participatory inventory of non-timber forest...
TRANSCRIPT

ASIA NETWORK FOR SUSTAINABLE AGRICULTURE AND BIORESOURCES (ANSAB)
ParticipatoryInventory ofNon-timberForest Products
ToolkiT 2RuRal DevelopmenT ToolkiT SeRieS
oTheR anSaB RuRal DevelopmenT ToolkiTS in ThiS SeRieS (2010)
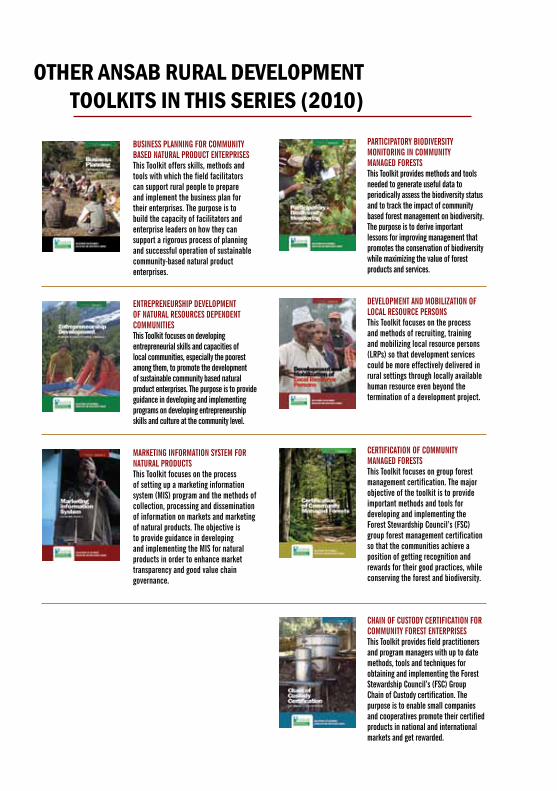
BUSINESS PLANNING FOR COmmUNITy BASED NATURAL PRODUCT ENTERPRISESThis Toolkit offers skills, methods and tools with which the field facilitators can support rural people to prepare and implement the business plan for their enterprises. The purpose is to build the capacity of facilitators and enterprise leaders on how they can support a rigorous process of planning and successful operation of sustainable community-based natural product enterprises.
ENTREPRENEURShIP DEvELOPmENT OF NATURAL RESOURCES DEPENDENT COmmUNITIESThis Toolkit focuses on developing entrepreneurial skills and capacities of local communities, especially the poorest among them, to promote the development of sustainable community based natural product enterprises. The purpose is to provide guidance in developing and implementing programs on developing entrepreneurship skills and culture at the community level.
mARKETING INFORmATION SySTEm FOR NATURAL PRODUCTSThis Toolkit focuses on the process of setting up a marketing information system (mIS) program and the methods of collection, processing and dissemination of information on markets and marketing of natural products. The objective is to provide guidance in developing and implementing the mIS for natural products in order to enhance market transparency and good value chain governance.
PARTICIPATORy BIODIvERSITy mONITORING IN COmmUNITy mANAGED FORESTSThis Toolkit provides methods and tools needed to generate useful data to periodically assess the biodiversity status and to track the impact of community based forest management on biodiversity. The purpose is to derive important lessons for improving management that promotes the conservation of biodiversity while maximizing the value of forest products and services.
DEvELOPmENT AND mOBILIzATION OF LOCAL RESOURCE PERSONSThis Toolkit focuses on the process and methods of recruiting, training and mobilizing local resource persons (LRPs) so that development services could be more effectively delivered in rural settings through locally available human resource even beyond the termination of a development project.
CERTIFICATION OF COmmUNITy mANAGED FORESTSThis Toolkit focuses on group forest management certification. The major objective of the toolkit is to provide important methods and tools for developing and implementing the Forest Stewardship Council’s (FSC) group forest management certification so that the communities achieve a position of getting recognition and rewards for their good practices, while conserving the forest and biodiversity.
ChAIN OF CUSTODy CERTIFICATION FOR COmmUNITy FOREST ENTERPRISESThis Toolkit provides field practitioners and program managers with up to date methods, tools and techniques for obtaining and implementing the Forest Stewardship Council’s (FSC) Group Chain of Custody certification. The purpose is to enable small companies and cooperatives promote their certified products in national and international markets and get rewarded.

ASIA NETWORK FOR SUSTAINABLE AGRICULTURE AND BIORESOURCES (ANSAB)2010
ParticipatoryInventory ofNon-timberForest Products
ToolkiT 2RuRal DevelopmenT ToolkiT SeRieS

© ANSAB, 2010
Citation: ANSAB. 2010. Participatory Inventory of Non-Timber Forest Products. Asia Network for
Sustainable Agriculture and Bioresources. Kathmandu, Nepal.
All rights reserved. Reproduction and dissemination of information in this toolkit for educational,
research or other non-commercial purposes are authorized without any prior written permission from
ANSAB provided the source is fully acknowledged. The reproduction of the information from this
toolkit for any commercial purposes is prohibited without written permission from ANSAB.
ISBN:978-99933-796-8-3
First edition: 2010
Designed and printed in Nepal

Participatory Inventory of Non-timber
Forest Products
iii
Rural development presents an immense challenge both to theorists and practitioners in the field. Many rural development and conservation projects end up in utter frustration because they are not equipped with effective methods and tools. ANSAB itself has tried various approaches since its establishment in 1992. We have developed a practical combination of environmental, social and economic interventions that conserve biodiversity, create jobs and provide income for the rural poor in remote but resource-rich areas of Nepal. The encouraging outcomes of these interventions have led us to pursue the successful approaches over the past several years.
By 2009, we were able to organize and develop 393 enterprise-oriented community forest user groups and 1,166 economic entities, which generated US $6.82 million in annual total monetary benefits to 78,828 individuals and, at the same time, brought over 100,000 hectares of forests and meadows in Nepal Himalaya under improved community management. When applied properly under an enabling policy environment, this approach can transform rural poor women and men into well governed, organized entrepreneurs that are capable of accessing the market as well as essential business development services. By creating economic incentives to local stewards, the approach helps to reverse deforestation and enhance the stock of natural wealth for improved and sustained flow of ecosystem services and for climate change mitigation and adaptation.
Building on these insights, we have been producing a number of manuals, toolkits, and guidelines. This Rural Development Toolkit Series represents the continuation of our attempt to present our learning to a wide range of development practitioners. This Series consists of eight separate but interrelated toolkits. These toolkits offer practical guidance on the key methods and tools that were developed, tested and refined over the years by working with local communities, development partners and government agencies. These capture the experiential knowledge of dozens of people working for ANSAB and are published after a thorough field testing and peer review. These toolkits are primarily designed for field facilitators and managers of development and conservation programs who have some basic facilitation skills and experience of working with rural people. We are hopeful that the toolkits will prove useful to other rural development and conservation programs, and consequently, to a wider application of our fruitful approach. It is expected that users will adapt the methods and tools presented here to work in different social contexts. This Toolkit “Participatory Inventory of Non-Timber Forest Products” provides practical methods and tools to determine total stock and harvestable amount of the selected NTFPs and derive specific recommendations for forest management interventions. The objective is to provide participatory inventory method that provides a basis for sustainable forest management.. This toolkit is divided into 4 stages. A number of steps are suggested
Preface

iv
for each stage and a number of activities are recommended for each step. Practical tools and considerations are provided along with activities when required.We are thankful to the blue moon fund (bmf) for providing the grant that allowed us to develop the Series and for encouraging us to translate ANSAB expertise into simple-to-use toolkits. The main contributors of the toolkit are Bhishma Subedi, Shiva Shanker Pandey, Shambhu Charmakar, Sushil Gyawali and Nabaraj Panta. Surya B. Binayee through his work in ANSAB program contributed to the evolution and development of the methodology. A number of ANSAB
staff (especially Indu Bikal Sapkota, Ram P. Acharya, Netra Bhandari, Chandika Amagain, Gopal Sharma, Bishnu Luintel, Govinda Baral, Durga Regmi, Sony Baral, and Rijan Tamrakar), donors (USAID, The Ford Foundation, IDRC), partners (EWV), NGOs and local communities contributed to this methodology through their involvement in ANSAB programs. Hari Dhungana, an experienced ANSAB technical expert, edited the Series. We welcome suggestions and feedback from readers and users as we are very much keen on periodically updating the toolkits to make it more productive and useful.
Bhishma P. Subedi, PhDExecutive Director, ANSAB

Participatory Inventory of Non-timber
Forest Products
v
AAH Annual allowable harvestANSAB Asia Network for Sustainable Agriculture and BioresourcesCF Community forestsCFUG Community forest users’ groupcm centimeterdbh Diameter at breast heightFMU Forest management unitg gramGIS Geographic information systemGPS Global positioning systemha hectarem meterkg kilogram NTFP Non-timber forest productTFP Timber forest product wt. weight
Acronyms

vi
Annual allowable harvest: The amount of forest products (e.g., the volume or number of stems or plants) that can be removed annually from a forest or from its block
Annual growth: An increment in the stock of forest products in a forest over a year
Crown cover: A vertical projection of the crown area of a species to the ground surface; it indicates the dominance of a particular species in the forest
Density: Number of plants of a species relative to the total number of all species present in an area; it is often expressed in terms of percentage or fraction
Facilitator: A person who supports the local community and other groups to conduct a specific activity or a range of activities primarily in reference to the objectives of a development program
Frequency: Number of occurrence of a plant species in a particular area
Non-timber forest products: All goods of biological origin other than timber, fuel wood and fodder derived from forest, grassland or any land under similar use; includes medicinal and aromatic plants (MAPs); bamboo and rattan; nuts, fruits, tubers and berries; grasses and leaves;
Glossary
resins; insect and insect providers; and wild animals and birds.
NTFP inventory: A measurement and assessment of the existing stock and growth of NTFPs in a given area
Observation: A record (e.g. measurement of height, girth, diameter, weight and number) taken from sample unit
Population: Total number of units or the “universe” from which samples are taken
Sampling: A way of taking a part of the population or forest as a representative of the whole
Stratification: Division of a forest or “population” into more or less homogenous units in order to reduce errors in sampling
Total growing stock: The sum of the stock (by number, volume, or weight) of all the timber and NTFPs in a forest or its part
Transect line: A line drawn in the map according to a pre-defined rule to represent a route in the forest along which transect walk will be carried out
Transect walk: A walk along the transect line with which pre-defined observations are made and recorded.

Participatory Inventory of Non-timber
Forest Products
vii
Preface ---------------------------------------------------------------------------------------------------- iiiAcronym -----------------------------------------------------------------------------------------------------vGlossary ---------------------------------------------------------------------------------------------------- viTable of Content ------------------------------------------------------------------------------------------- viiAbout this toolkit -------------------------------------------------------------------------------------------- 1
Stage 1: get prepared -------------------------------------------------------------------- 3Step 1: Prepare yourself ------------------------------------------------------------------------------- 3Step 2: Build rapport and make a preliminary plan for inventory -------------------------- 3Step 3: Prepare formats and arrange field equipment ----------------------------------------- 4Step 4: Provide orientation training to the inventory team ----------------------------------- 5
Stage 2: delineate foreSt boundary and develop Sampling deSign ---------- 7Step 1: Delineate forest area and prepare map -------------------------------------------------- 7Step 2: Stratify and calculate area ------------------------------------------------------------------13Step 3: Layout sampling plots on the map -------------------------------------------------------16
Stage three: Carry out the meaSurement in the field --------------------------22Step 1: Layout the sample plots on the ground -------------------------------------------------22Step 2: Carry out measurement and recording -------------------------------------------------23
Stage four: Compile, analyze and interpret the data --------------------------33Step 1: Compile the data------------------------------------------------------------------------------33Step 2: Enter the data ----------------------------------------------------------------------------------33Step 3: Analyze the data ------------------------------------------------------------------------------34Step 4: Interpret the data -----------------------------------------------------------------------------36 annexeS ----------------------------------------------------------------------------------------------------39
Table of Content

viii

Participatory Inventory of Non-timber
Forest Products
1
About this Toolkit
This toolkit provides methods and tools for carrying out the inventory of non-timber forest products (NTFPs). It provide a basis for the sustainable management of NTFPs that supports both conservation of biodiversity and the generation of income and employment for the rural people. Thus, in resource-rich areas, supporting the sustainable management of NTFPs comprises an important aspect of rural development.
An important component of technical support for the sustainable management of the forest is inventory. An inventory involves determination of existing stock of the forest products under consideration and an estimation of their growth rate in order that prescriptions can be offered for their management and utilization. The inventory of forest products is thus important to develop forest management plan and for its subsequent implementation. It is equally useful for the initiation and operation of forest product based enterprises, as it is for conservation activities.
This toolkit seeks to fill the gap experienced by development as well as conservation organizations on the practical methods and tools essential for the inventory of NTFPs. It is primarily based on the experience of ANSAB over the past one and a half decade. It is expected that this toolkit will be useful for those who want to support the sustainable management of NTFPs as part of their conservation or rural development work.
objeCtiveS of the toolkitThis toolkit provides practical methods and tools to determine total stock and harvestable amount of the selected NTFPs and other forest products. The objectives of the toolkit are to:• offer practical methods and tools for
participatory NTFP resource assessment and data analysis; and
• provide knowledge and skill to determine annual harvestable quantity of the products.
Who iS thiS toolkit for? This toolkit is intended for field-level facilitators and forest technicians involved in supporting sustainable management of NTFPs. It will be also useful for researchers, local resource persons, community leaders and organizations that seek to get involved in community-based conservation and enterprise-oriented forest management, research and monitoring of commercial forest resources.
It is expected that a forest technicians, suitably trained to work with local communities as a facilitator, will be able to carry out the activities outlined in this toolkit.
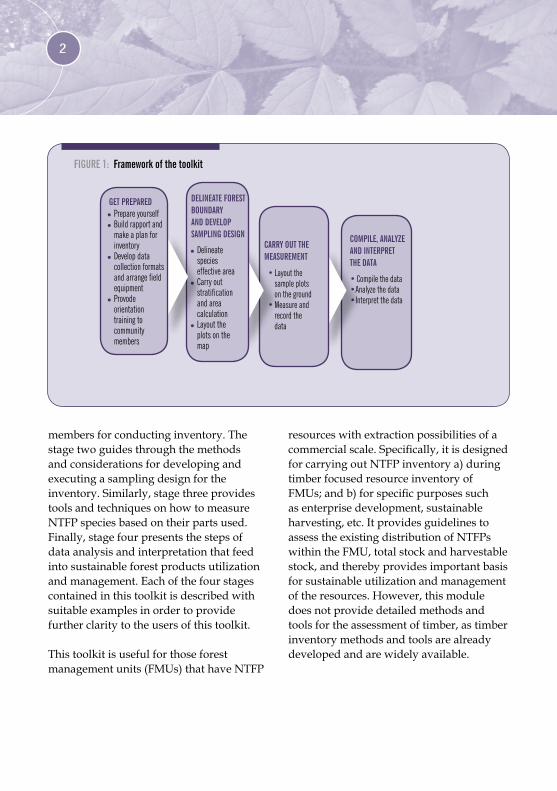
What doeS thiS toolkit Contain?This toolkit is organized in four stages—starting from preparatory work to the analysis and interpretation of inventory data gathered through field process as given in Figure 1. Stage one describes how the facilitators supporting local communities in forest management should prepare themselves and the community
2
members for conducting inventory. The stage two guides through the methods and considerations for developing and executing a sampling design for the inventory. Similarly, stage three provides tools and techniques on how to measure NTFP species based on their parts used. Finally, stage four presents the steps of data analysis and interpretation that feed into sustainable forest products utilization and management. Each of the four stages contained in this toolkit is described with suitable examples in order to provide further clarity to the users of this toolkit.
This toolkit is useful for those forest management units (FMUs) that have NTFP
resources with extraction possibilities of a commercial scale. Specifically, it is designed for carrying out NTFP inventory a) during timber focused resource inventory of FMUs; and b) for specific purposes such as enterprise development, sustainable harvesting, etc. It provides guidelines to assess the existing distribution of NTFPs within the FMU, total stock and harvestable stock, and thereby provides important basis for sustainable utilization and management of the resources. However, this module does not provide detailed methods and tools for the assessment of timber, as timber inventory methods and tools are already developed and are widely available.
• Compile the data•Analyze the data•Interpret the data
COmPILE, ANALyzE AND INTERPRET ThE DATA
•Layout the sample plots on the ground •Measure and
record the data
CARRy OUT ThE mEASUREmENT
lDelineate species effective area
lCarry out stratification and area calculation
lLayout the plots on the map
DELINEATE FOREST BOUNDARy AND DEvELOP SAmPLING DESIGN
FIGURE 1: Framework of the toolkit
lPrepare yourselflBuild rapport and
make a plan for inventory
lDevelop data collection formats and arrange field equipment
lProvode orientation training to community members
GET PREPARED

Participatory Inventory of Non-timber
Forest Products
3
Get Prepared Stage One
The stage one of this toolkit contains steps and activities essential for preparation of inventory. It starts with how the facilitator should set the groundwork for carrying out detailed inventory in subsequent stages. It has four steps (see Figure 2).
At the end of this stage, the following outputs are expected:• the facilitator is prepared for inventory; • major commercial NTFPs are identified
for a detailed inventory;• community members are prepared for
inventory work; and• an action plan for forest inventory is
prepared at the forest management unit (FMU) level.
Step 1: prepare yourSelfBefore proceeding inventory, the facilitator needs to do three major activities. First, while this toolkit is meant to be comprehensive, it will be beneficial to collect more recent experiences and methods on NTFP inventory methods, techniques and tools. This toolkit should be studied in detail and any government directive and inventory methods available from other sources should be reviewed. It is also important to have training on the methods of using the inventory instruments (if the facilitator does not have prior experience about it). Another toolkit on “Participatory biodiversity monitoring in community managed forests” published by ANSAB (2010) provides methods and tools that will also be useful for inventory work.
Secondly, the facilitator should have skills to work with the community. However, if s/he has no prior experience working with community s/he should attend a training
course on community facilitation.
Finally, the facilitator should gather information about the community and locality where inventory is planned. This will make subsequent work manageable.
Step 2: build rapport and make a preliminary plan for inventoryAt the second step, the facilitator should build rapport with the community. This helps develop a plan for inventory and subsequently conduct field activities. This step involves the following activities.
2.1 Visit community leadersIn the beginning, the facilitator needs to visit community leaders, including the chairperson, secretary, treasurer, etc. of FMUs and share the purpose of the visit. In these meetings, the facilitator and the local leaders identify the major interest groups of the community that should be involved in inventory process. They should also fix the date of the meeting to prepare the preliminary
FIGURE 2: STEPS OF PREPARATION PhASE
Build rapport and make a preliminary plan for inventory
Develop data collection formats and arrange field equipment
Prepare yourself
Provide orientation training to the inventory team

4
action plan for inventory. These visits and discussions help facilitators familiarize with community and encourage active participation of the community in the inventory process.
2.2 Prepare preliminary action plan for inventoryAs planned in the previous meetings, the local leaders and facilitators arrange a meeting at the FMU level, with participation of the individuals from major interest groups including NTFP collectors, pastoral communities and those who have knowledge of forest resources and forest boundary. In the meeting, the following four agenda will have to be discussed and decided:
Agree on the purpose of inventory: The facilitator should discuss with the community members the purpose of inventory (e.g., commercialization, conservation, research or monitoring) and why it is important for the local people to participate in it. The local leaders, members of interest groups and the facilitator should come up with the exact purpose and on how inventory of NTFPs would support forest management.
Select NTFPs for detailed inventory: On the basis of the purpose of inventory, community members should be encouraged to select the most important species for detailed inventory. If the purpose of inventory is commercialization, the facilitator and community members should refer and follow the chapter one page 5-11 of “Enterprise Development for Natural Products Manual”published by ANSAB for the selection of most prominent products.
List the activities to be carried out for the inventory: The meeting identifies broad level
The number of species to be selected for inventory depends upon the purpose of inventory itself. If the purpose is research and species monitoring, number can be one or two, whereas if the purpose is commercializa-tion, number may be as high as the number of species that have high market potential.In ANSAB’s experience, on an average, up to 10 NTFP spe-cies may be selected for detail inventory in a community forest, having a size of 100 hectares.
of activities to be done in the inventory. The activities identified in this toolkit provide a reference of important activities.
Identify team members to carry out inventory: The facilitator should encourage the committee to form an inventory team comprising 5-7 community members from amongst those who depend on NTFPs and those who have knowledge of NTFPs. These members will work closely with the facilitator in inventory work. Few additional members with reading and writing ability should also be selected. Table 1 provides the required number of members in the team and their responsibilities.
StepS 3: prepare formatS and arrange field equipmentAt the third step of stage one, the facilitator should prepare formats for data collection and arrange equipment for the inventory work.

Participatory Inventory of Non-timber
Forest Products
5
It is advisable to make measurements with new equipment f such as vertex IV and Transponder, Densiometer, Silva Survey Master, if available.
TEAm mEmBER
1
2 & 3
4 & 5
6
TITLE
Team leader (forest technician or facilitator )
Plot layerSample measurer
Diameter measurer
Record keeper
RESPONSIBILITIES
lNavigation to the plot lDetermine the plot edge and trees within the plotslheight measurement of treeslSupervision of the team and work quality
lmeasurement, sample preparation for NTFPs
lDiameter measurementlAssist Team leader for determining the edge of the plot
lRecord keeping of all the measures done within the plot
EqUIPmENT/ mATERIALS TO BE USED
lGPS or compass and tapelLinear tape or measuring rope or vertex IvlClinometers or vertex Iv and linear tapelChecklist of equipment and materials
lPoly bags, cloth bag, knife or sickle, weighing machine
lDBh tapelClinometer, vertex Iv, tape, slope correction table
lForms, pen, pencil
TABLE 1: Responsibilities of members in inventory
3.1 Prepare formats for data collectionThe facilitator should prepare formats for data collection as per the categories of NTFPs to be inventoried as given in stage three of this toolkit. The inventory format for timber is given in Annex 2 and other formats are available in stage three. However, in this stage, the facilitator can modify the formats as per inventory objectives and make required copies by printing or photocopying.
3.2 Arrange inventory equipmentNow the facilitator arrange field measurement equipment for the inventory work. All instruments (Table 2) should be collected early on so that they can be checked and calibrated in advance. The facilitator has to ensure that every instrument is functioning well, so that fieldwork can move without any disturbance. Similarly, a complete checklist should be prepared for ensuring that no instrument is left behind.
Step 4: provide orientation training to the inventory teamThe facilitator should provide training and orientation to the community members to make them capable to conduct forest inventory. The main contents of the orientation are:• What is a forest product (timber and NTFP)?• What is NTFP inventory? What is its
general method?• What are the major objectives of forest
resource inventory?• What is the process of participatory forest
resource inventory?• What tools and equipment are used in
inventory and how?• How to record the measurements?• What formats are used in forest resource
inventory?

6
FOR
BOUNDARy DELINEATION AND AREA CALCULATION
LAyING OUT ThE PLOTS AND mEASUREmENT
EqUIPmENT/mATERIAL
• Topographic map• GPS (GPS map 60CSx, Garmin) or compass• Length measuring tape/Pedometer/DmU• Transparent grid sheet
• GPS • Rope• Length measuring tape• Diameter tape• Clinometers or Silva survey master• vertex Iv and Transponder• Densiometer• Kuto (spade)• Plastic bags • Knife or sickle• Scissors• Weighing machine• Data recording formats
PURPOSE
• Forest boundary delineation and stratification • Boundary survey, stratification and locating plots• Distance measurement (one survey station to next survey station)• Tracing the map and for forest area calculation • Sample plots navigation • Plot boundary delineation• Locating plot boundary and distance measurement• measuring diameter of the tree at breast height• measuring the ground slope, top and bottom angle to the tree• measuring tree height and establishing circular plots without the use of tapes and clinometers• measurement of canopy cover or canopy density• Digging samples• Collect and weigh the sample (root, rhizome, leaf, bark, fruit and flowers and whole plants• Cutting and collection of NTFP sample• Cutting herbs, fruits, leaves and other parts of plants• Weighing herbs, grasses and leaf litters• Recording the measured variable of timber and non-timber species
TABLE 2: List of instruments and materials required to carry out NTFP inventory
This orientation training provides knowledge and skill of measurement and recording of data. During the orientation training, the field team should also develop a practical action plan including activities, responsible person and time frame (see Table 3 for sample action plan used by ANSAB in Nepal). Responsibilities of the team member should be divided on the basis of their individual capacities, interest and commitment.
S.N. ACTIvITIES RESPONSIBLE PERSON TImE
1 Participatory resource mapping Community members and facilitator 1 march
2 Forest boundary mapping and species effective area calculation Facilitator and community member 3-10 march
2 Sampling design Facilitator and community members 10-15 march
3 Plot lay out in the ground Facilitator and community members 20 mar-10 April
4 measurement and recording Facilitator and community members
…... ……………..
10 Data analysis and interpretation Facilitator and community members Up to April 25
TABLE 3: Sample of action plan
It is better if the team members remain same throughout the process of forest resource inventory. In doing so, most of team members acquire adequate knowledge, thus developing themselves as local resource persons (LRPs) who can later conduct forest resource inventory on their own.

Participatory Inventory of Non-timber
Forest Products
7
The stage two of this toolkit guides you through the delineation of forest boundary and development of the sampling design. These two activities are carried out immediately before the actual field measurement. This stage has three steps (Figure 3). It starts with the delineation and mapping of the boundary of the forest for which inventory is planned. At the second step, effective areas for the species are identified for detailed inventory are delineated. The third step provides methods and tools for stratification of the forest—as stratified systematic sampling is commonly used in forest inventory—and calculation of area of the whole forest as well as the strata. Finally, at the fourth step describes about how to lay out the sample plots on the map. These steps lead the inventory team to be prepared for field measurement.
Thus this stage is primarily focused on developing the sampling design. By the end of this stage, the following outputs are expected:
• forest area with its boundaries is mapped;
• forest strata and/or blocks are identified and delineated;
• NTFP effective area is delineated;• number of sample plots for detailed
measurement is identified; and• forest map and tables with the details of
sample plots are worked out.
Step 1: delineate foreSt area and prepare the map1.1 Carry out participatory resource mappingThe following activities are carried out for resource mapping:• gather the inventory team and other
FMUs members who have knowledge of forest and forest resources and are interested to participate in resource mapping;
• identify a suitable area spot close to the forest from where whole forest and village is visible;
• explain the purpose and process of participatory mapping to the community members;
• choose two community members to draw the forest boundary and block division on the map;
• gather the material (e.g. sticks, stones, wood ash, flowers, leaves, and other material that are available locally) to develop the participatory resource mapping (brown sheet and marker pens of various colors can be used);
• use symbols to indicate different land uses, etc. as symbols provide easier visual reference;
• support participants to find the north direction first and sketch the boundary with that direction as base;
Delineate Forest Boundary and Develop Sampling Design
Stage Two
FIGURE 3: PROCESS OF SAmPLING DESIGN
Stratify and calculate area
Delineate forest boundary and prepare map
Layout sample plots on the map

8
• facilitate to prepare sketch map showing the forest resources, topographic features (river, terrain structures), community and physical infrastructure including road and foot trails (see Figure 4);
• support to sketch the potential habitat of commercially important NTFP species;
• discuss with community members the prominent features of forest—NTFP distribution, difference of topography and other physical features and how that would shape inventory design; and
• transfer the participatory map—either copy it by drawing in a plain sheet of paper or take a photograph showing all details for future reference.
1.2 Conduct Forest Boundary Survey and Prepare MapForest boundary survey and mapping is not necessary if forest map is already available. If map is not available, a boundary survey needs to be carried out. Forest blocking should also be conducted simultaneously. For small-sized forest with area less than 500 hectares, a) GPS survey method, or b) compass survey method can be used.
However, for large forest area (bigger than 500 hectares) it is better to use topographic map or high resolution satellite image for mapping forest area and blocks. All the methods are described below.
GPS survey: GPS (GPS Map 60CSx, Garmin) is one of the modern and prominent tools for boundary survey and mapping. With GPS, tracking is performed to survey the forest boundary and block division. For this the facilitator should first learn about handling the GPS receiver, unit set up to mark location of forest boundary and mapping. The process is given in Box 1, 2, and 3.
Use topo map if the boundary survey is impossible due to terrain, topography and large forest area, and under limited human resource and time. ANSAB experience shows that the use of topographic map is suitable for those FMUs which have forest area larger than 500 hectares.
It is the process of dividing a forest into a number of blocks. It is useful for prescribing forest management activities. Some basic criteria of blocking are:• permanentnaturalfeatures(river,
road and ridge);• objectiveofforestmanagement;and• foresttype(conifer,broadleaved,
grassland,shrubland).
FIGURE 4: PARTICIPATORy RESOURCE mAPPING

Participatory Inventory of Non-timber
Forest Products
9
Box 1: Procedure for handling GPS receiver
How to Setup GPS (GPS Map 60CSx, Garmin) • GotoMainMenupagepressingPage Key (there aresixpages:Satellitepage,Tripcomposer,Mappage,Compass,AltimeterandMainMenu).
• HighlightSetup Menu and press Enter Key.Whenthesetuppageisdisplayed,highlightSystemiconandpressEnteragain.
• SetthefollowingsystemsetupusingRoger Key: GPS–Normal WAAS/EGNOS–Disabled BatteryType–Alkaline TextLanguage–English ExternalPowerLost–TurnOff ProximityAlarms–On.• QuitthispageusingQuit Key.
Box 2: Procedure for setting up of the unit
Unit set up (GPS Map 60CSx, Garmin) Unitsetupisanimportantstepandcanbedoneasperfollowinginstructions:• IntheSetup Menupage,highlighttheUnitsicon,andpressEnter.• SetthefollowingUnitsSetupusingRoger Key
n Position Format–UsersUPS(choseacoordinatesystemaccordingtoyourworkingarea)
n Map Datum–India Bangaladesh (it is a description of geographiclocationforsurveying,mappingandnavigationforNepal).HoweveritmaychangeonyourAvailabilityandlocation.
n Distance/Speed – Matricesn Elevation (vert. Speed) – Metern Depth – Metern Temperature – Celsius/Fahrenheitn Pressure – Millibars.

10
Marking Current Location (GPS Map 60CSx, Garmin) • Toquicklycaptureyourcurrentlocation,pressandholdtheMark KeyuntiltheMark Waypoint pageappears.
• Atthetopofthescreen,a3digitWaypointnameappearsasadefault:highlightitandpresstheEnterkey.
• UsetheRockertoenterthenameofcapturedWaypoint and press OKonthekeyboard(YoucanalsoedittheWaypointandmanuallyloadnewwaypointusingthispage).PressOK at the bot-tomrightoftheMark Waypointpageandthenpressquittoexit.
• TofindthewaypointpressFind Key to open the Find Menu
• HighlighttheWaypoint icon and press Enter.• HighlightanyWaypoint and press Enter,infor-mationofselectedwaypointisdisplayed.
Ifsoftwareisunavailable,geographiccoordinates(latitude,longitudeandaltitude)ofeachGPSpointmustberecordedasprovidedinTable4formanualmapping.
Box 3: Process for marking location and delineating boundary using GPS and GIS
GPS POINT (SN) LATITUDE LONGITUDE ELEvATION (m) REmARKS
TABLE 4: The format for recording geographic position of each GPS point

Participatory Inventory of Non-timber
Forest Products
11
After the forest boundary or individual forest blocks within the forest area are tracked using GPS (e.g. GPS Map 60CSx, Garmin), we can directly download the recorded data from GPS to computer using GIS softwares like Arc View 3x or Arc GIS 9x or DNR Garmin or GPS Utility, etc. Map can be prepared map using GIS software as described below.
Process of Downloading GPS data using DNR-Garmin: • Switch on your GPS and connect with
PC through data cable. • Open DNR-Garmin; go to Menu bar
and click Waypoint to download point feature and click Track to download tracking data.
• When download is completed the window appears with table as shown in Figure 5.
• Select desired waypoint or track and go to File Menu; click Save to from drop
down menu; then choose File or Arc View or Arc Map Shapefile to save data.
• Choose save in directory; give the file name and click Save.
Now the data downloading is complete and data is saved.
Process of creating polygon and calculating area With Arc View GIS• Open Arc View and add the saved point
or line data theme. Then, go to File menu, when drop down menu exists click Extensions. When Extensions window opens, check in XTools Extensions.
• Click on XTool menu, drop down menu appears. There are options to convert Point to Polyline, Point to Polygon, and Polyline to Polygon. Using these options polygon from point or from polyline can be made.
FIGURE 5: DOWNLOADING DATA IN DNR-GARmINFIGURE 6: mAP OF FOREST WITh BLOCKS

12
• Edit your point, line or polygon theme using Start Editing mode from Theme menu. When editing is complete do not forget to Save Edits and Stop Edits.
• To create polygon go to the XTool menu again and select Calculate Area, perimeter, Length…. from drop down menu and Click showing as shown in Figure 6. It automatically calculates the area and length of selected theme. To see the calculated value, Open Theme Table from Toolbar.
• Now you can also prepare a map of given area using appropriate layout template.
If GIS softwares are not available, the coordinates (latitude and longitude) of each GPS point can be recorded as given in Table 4. These coordinates are plotted on the grid sheet or transparent grid sheet. Finally these GPS points are connected to form a polygon. Then the area of polygon (forest and forest blocks) is calculated using the same process as for compass survey.
Compass survey: It is one of the well-known methods of boundary delineation and mapping. It is cheap and easy to handle; why most of the FMUs have been using it since long time. Silva compass, linear tape and ranging rod are used in this
method. With the help of these instruments, direction and lengths of the survey line and its slope are measured and recorded in surveyors’ field book as given in Table 5.
The information (direction and distance) is plotted on grid sheet fixing the scale for map. While the forest map is developed, its area can be calculated from the grid sheet and tracing paper or transparent grid sheet alone.
Forest area calculation: After plotting the direction and distance of survey stations, the area of forest is calculated in the following way:• overlay transparent grid sheet on the
base map (area delineated map sheet). If there is no transparent grid sheet, first the delineated map is traced and overlaid over the graph paper;
• count and mark the number of grid cell covered by each strata;
• calculate the area covered by a grid cell using the scale of the map and unit given in the grid sheet i.e. cm;
• convert the area of a grid cell (cm2) into hectare; and
• multiply the area of a grid cell by number of grid cell counted in each block so as to calculate the area covered by each block and whole forest.
STATION NO. FORE BEARING (0) BACK BEARING (0) SLOPE DISTANCE (m) SLOPE (0) REmARKS
TABLE 5: Formatforboundarysurveyusingcompass(Silva)

Participatory Inventory of Non-timber
Forest Products
13
1.3 Forest mapping using topographic mapForest boundary is delineated on topographic map or satellite image in the active participation of the community members:• select a location from where most parts
of the forest are visible;• place the topographic map in the center
of the community members; • ask with community members to fix
the north on the map then describe the process of delineation; and
• provide pencil for a person and facilitate to delineate the boundary of forest and forest blocks.
During this stage, the facilitator needs to cross-verify the area repeatedly asking with community members with respect to some permanent natural features.• After completing the boundary
delineation in topographic map or satellite image, the facilitator should map the forest.
• Finally, the area of forest and forest blocks is calculated using the similar process mentioned for compass survey.
Step 2: Stratify and CalCulate the areaThe second step of this stage discusses how to divide the forest into a number of strata. The strata increase accuracy and can serve as blocks in the forest management plan.
2.1. Stratification focusing on timber resources Once the forest and forest blocks have been delineated and mapped, it is essential to stratify the areas to make more or less
homogeneous units so that inventory provides accurate result. Stratification of forest is based mainly on the following criteria:• altitude;• diameter group of dominant forest
species; • composition of the species i.e. conifer
forest, broad leaved forest, mixed forest and grassland and others; and
• aspect and position of hill slopes.
The strata may be whole forest alone (e.g. in even-aged plantation or in small-sized forest) or a number of blocks if the forest is heterogeneous in terms of species, age, or topographic conditions. Carry out the following activities in a community meeting:• orient the participants about the process
of stratification;• provide pencil to a person and facilitate
FIGURE 7 STRATIFICATION FOCUSING TImBER RESOURCES

14
to delineate non-timber forest product (NTFPs) area and timber area first (during this stage, facilitator needs to cross verify the area repeatedly asking with the community member);
• facilitate to delineate the forest into different strata (more-or-less homogeneous units) based on the above criteria (the divisions may include tree strata, pole strata and regeneration strata based on diameter class; or conifer forest strata, broad-leaved forest strata, mixed broad-leaved and conifer strata and non-tree (grass and shrub) strata based on species composition); and
• use color pen to mark the stratum types clearly and distinctly (Figure 7).
2.2. Stratification of the NTFP area Generally, NTFP species are found in specific habitats or sites of the forest. The NTFP area of selected species in the forest is delineated to identify accurate habitat boundary to carry out detailed inventory of these species. The area of commercial NTFPs is delineated on forest map (Topo map, compass survey map, high resolution satellite image, etc) and the area so delineated is called NTFP area. The NTFP area of a particular forest is further stratified on the basis of one or more of the following parameters:• species composition i.e. tree, shrub and
herb non-timber forest products;• aspect and position of hill slopes of
forest; and • altitude of the forest.
However, these criteria need to be discussed with participants (community members including inventory field team) to
stratify the forest accurately. The inventory team should conduct the following activities for the stratification of forest focusing on NTFPs:• keep the base map (e.g. survey map or
topographic map) in the center stage of the participants and facilitate to delineate the NTFP habitat in the map; and
• facilitate the community members to delineate the strata where large number of commercially important (selected) species are growing together and go on to areas with lesser number of species using color pen on the base map.
Accordingly, the inventory team can have various strata, e.g. strata of multiple NTFPs species (herbs, shrubs and tree) or of only multiple herb species or single herb species or single shrub species (Figure 8).
A forest can have several habitats and a single habitat may have multiple NTFP species. The facilitator needs to mark and stratify the NTFPs area based on NTFP species composition, for example- a stratum of Sunpati, Dhupi, Jatamansi and Nirmasi in high mountains; Lokta, Argeli, Wintergreen, Sugandhawal and Satuwa in Mid hills; and strata of single species. The habitat of selected NTFP species may be within a block or within two or more blocks.

Participatory Inventory of Non-timber
Forest Products
15
2.3. Verification of the NTFP area and strata To verify the NTFP area and its stratification, the inventory team conducts a transect walk on the sample sites of the forest. Sampling sites should be accessible in a short period of time. The following activities should be carried out:• select sample sites and agree on the
suitable route for a transect walk in the selected species effective area;
• undertake the transect walk; observe the species effective area and species distribution;
• verify and correct the boundary of the effective area on the map if necessary; and
• finalize delineation of the effective area of selected NTFP species.
2.4. Block area calculationAfter verification, the facilitator has to calculate the area of each stratum. The area is calculated as follows:• overlay transparent grid sheet on the
forest map;
• count and mark the number of grid cells covered by delineated area of each stratum; and
• calculate the area covered by a grid cell and each stratum using the same process as mentioned for compass survey.
If there is GIS program, then area can be calculated directly using the process described for forest boundary survey using GPS.
FIGURE 8: DELINEATION OF NTFP STRATA AND AREA CALCULATION
Example of area calculation GridsheetisincmunitMapscale:1:10000or1cm=10000cmAreaofagridcell(1cm2)=10000X10000cm2
=(10000×X10000)/(100×X100)m2 =10000m2
=10000m2/10000 =1haTotalgridcellcountedonLoktaandWintergreen(L+D)strata=15.5haTotalareacoveredbyL+Dstrata=areaofagridcell×Xtotalgridcellcountedwithinstrata =1X×15.5 =15.5ha
16
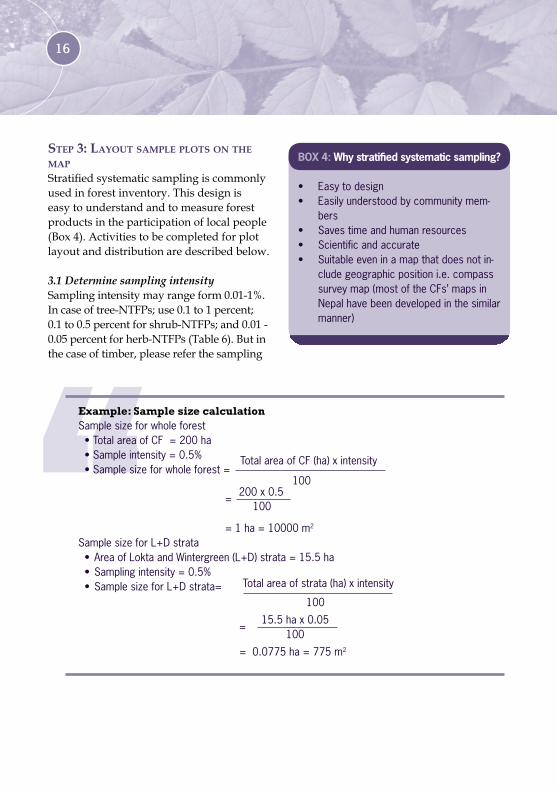
Step 3: layout Sample plotS on the mapStratified systematic sampling is commonly used in forest inventory. This design is easy to understand and to measure forest products in the participation of local people (Box 4). Activities to be completed for plot layout and distribution are described below.
3.1 Determine sampling intensitySampling intensity may range form 0.01-1%. In case of tree-NTFPs; use 0.1 to 1 percent; 0.1 to 0.5 percent for shrub-NTFPs; and 0.01 - 0.05 percent for herb-NTFPs (Table 6). But in the case of timber, please refer the sampling
Box 4: Why stratified systematic sampling?
• Easytodesign• Easilyunderstoodbycommunitymem-
bers• Savestimeandhumanresources• Scientificandaccurate• Suitableeveninamapthatdoesnotin-
cludegeographicpositioni.e.compasssurveymap(mostoftheCFs’mapsinNepalhavebeendevelopedinthesimilarmanner)
15.5hax0.05100
Example: Sample size calculation Samplesizeforwholeforest•TotalareaofCF=200ha•Sampleintensity=0.5%•Samplesizeforwholeforest= =
=1ha=10000m2
SamplesizeforL+Dstrata• AreaofLoktaandWintergreen(L+D)strata=15.5ha•Samplingintensity=0.5%•SamplesizeforL+Dstrata=
TotalareaofCF(ha)xintensity
100
100
200x0.5 100
Totalareaofstrata(ha)xintensity
=0.0775ha=775m2
=

Participatory Inventory of Non-timber
Forest Products
17
intensity as given in “Inventory Guideline 2061” published by Department of Forest, Government of Nepal.
Sample sizeUsing sampling intensity, we can calculate sample size (area in hectare) as follows:• take sampling intensity;• multiply total species effective area by
sampling intensity and divide by 100; and
• repeat the same process to calculate the sample size of each selected species.
Size of the sample plotSize of the sample plot depends upon the life forms of the plants i.e. herbs, shrubs and trees. A circular (of various radii) or rectangular sample plot can be used. However, circular plot is preferred as it is relatively trouble-free to establish and more accurate (with less ‘boundary error’).
A 500 m2 plot with 12.62 m radius is used for mature tree species while the 100 m2 plot with 5.64 m radius is used for pole size tree and shrub measurement. For herb, 4 m2 plots with radius 1.128 m are used in general (see Table 7).
Sample plot types differ with the life form and product category. Three different plot sizes of 500 m2, 100 m2 and 4 m2 for mature trees (>30 cm dbh), pole size trees (10 - 30 cm dbh) and shrubs, and 4 m2 for herbs and regeneration can be used respectively. For example, if the different forms of NTFP species
FOREST SIzE SAmPLING INTENSITy (%) FOR vARIOUS LIFE FORmS OF NTFPS REmARKS
TREES (TImBER OR NON-TImBER) ShRUBS (NON-TImBER) hERBS
<100 ha 1 0.5 0.05 - 0.1
100-500 ha 0.5 0.5 0.05
>500 ha 0.1 - 0.5 0.1 0.01
TABLE 6: Sampling intensity for various life forms of NTFPs
SN FORm SIzE OF PLOT DImENSION FOR RADIUS FOR REmARKS OF NTFPS RECTANGULAR PLOT CIRCULAR PLOT
1 herbs 4 m2 2 m X 2 m 1.128 m
25 m2 5 m X 5 m 2.820 m
2 Shrubs 100 m2 10 m X 10 m 5.640 m
3 Trees 500 m2 20 m X 25 m 12.620 m For trees having dbh >30 cm
100 m2 10 m x 10 m 5.640 m For trees having dbh 10 - 30 cm
4 m2 2 m x 2 m 1.128 m For trees having dbh <10 cm
TABLE 7: Sample plot size for different forms of NTFPs
Composite and single sample plots (rectangular and circular)
If the herbs are highly scattered, the plants may not be covered in sample plots of 4 m2. So, it is sometimes advisable to take the sample plots of 25 m2.
18
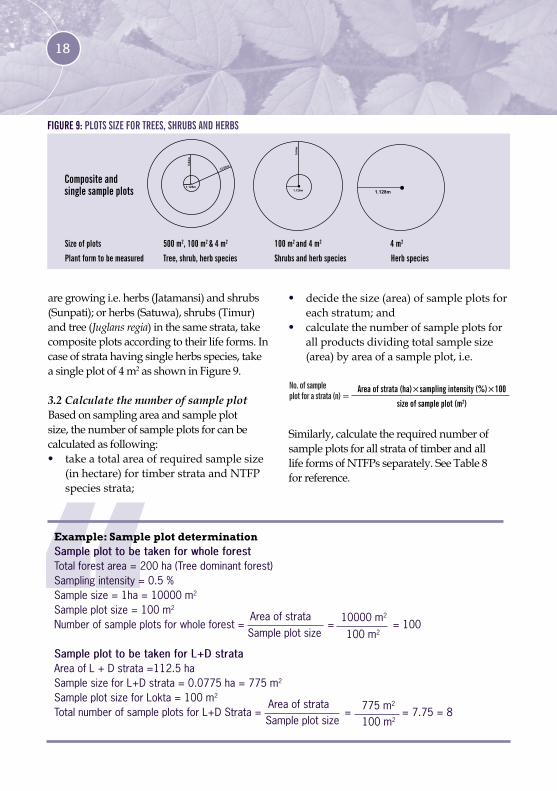
• decide the size (area) of sample plots for each stratum; and
• calculate the number of sample plots for all products dividing total sample size (area) by area of a sample plot, i.e.
Composite and single sample plots
Size of plots 500 m2, 100 m2 & 4 m2 100 m2 and 4 m2 4 m2
Plant form to be measured Tree, shrub, herb species Shrubs and herb species herb species
Example: Sample plot determination Sample plot to be taken for whole forest Totalforestarea=200ha(Treedominantforest)Samplingintensity=0.5%Samplesize=1ha=10000m2
Sampleplotsize=100m2
Numberofsampleplotsforwholeforest===100
Sample plot to be taken for L+D strataAreaofL+Dstrata=112.5haSamplesizeforL+Dstrata=0.0775ha=775m2
SampleplotsizeforLokta=100m2
TotalnumberofsampleplotsforL+DStrata== =7.75≈=8
FIGURE 9: PLOTS SIzE FOR TREES, ShRUBS AND hERBS
are growing i.e. herbs (Jatamansi) and shrubs (Sunpati); or herbs (Satuwa), shrubs (Timur) and tree (Juglans regia) in the same strata, take composite plots according to their life forms. In case of strata having single herbs species, take a single plot of 4 m2 as shown in Figure 9.
3.2 Calculate the number of sample plotBased on sampling area and sample plot size, the number of sample plots for can be calculated as following:• take a total area of required sample size
(in hectare) for timber strata and NTFP species strata;
Areaofstrata
100m2
10000m2
Sampleplotsize
Areaofstrata
Sampleplotsize 100m2
775m2
No. of sample plot for a strata (n) =
Area of strata (ha)×sampling intensity (%)×100
size of sample plot (m2)
Similarly, calculate the required number of sample plots for all strata of timber and all life forms of NTFPs separately. See Table 8 for reference.

Participatory Inventory of Non-timber
Forest Products
19
For shrub species: •Find the number of remaining sample
plots where shrub and herbs will be measured as per following formula.
= Total no. of shrub plots (Ns) - No. of tree plotsNo. of plots to measure shrub and herbs (Nsh) • Now distribute the rest of the sample
plots of shrub strata calculating the plot to plot distance dividing the total transects line measured within area of shrub strata (where shrubs, herbs and regeneration are measured).
Total length of transect in a strata (m) - Total length of transect intercepted by tree composite plots (m)
Total sample plots required for shrub species - total sample plots overlapped in tree composite plots
Plot to plot distance (m) =
For multiple herbs’ strata:• Find out the number of sample plots
remained to be measured for each herb products in its stratum area by deducting the number of overlapped sample plots during the tree and shrub measurement.
= Total no. of multiple herb plots - Total no. of shrub plotsNo. of plots to measuremultiple herbs (Nmh)
3.3 Distribute the plots on map and prepare field index tableThe following activities are carried out to distribute the sample plots on map: • identify the very steep and rocky area
which is impossible for transect walk and such area should be removed during the distribution of plot in map;
• draw the transect line in each strata in the distance of 100 to 500 m considering NTFPs species but representing all plants forms in participatory way as shown in Figure 10;
• calculate the total length of the transect line on map and ground for each NTFP and tree strata and whole forest area, separately multiplying total length of transect line in map by the value given in scale of map;
• calculate the plot to plot distance for according to tree, shrubs and herbs species;
For tree species: •Calculate the plot to plot distance for
trees by dividing the total transect line measured in its effective area by the number of composite sample plots as calculated above for trees and distribute them along transect lines.
Total length of transect line in a strata (m)
Total number of sample plotsPlot to plot distance (m) =
STRATA NO. NUmBER OF SAmPLE PLOT FOR INvENTORy REmARKS
TREE ShRUB hERB
TABLE 8: Number of sample plots FIGURE 10: LAyING OUT TRANSECT LINE IN mAP
20
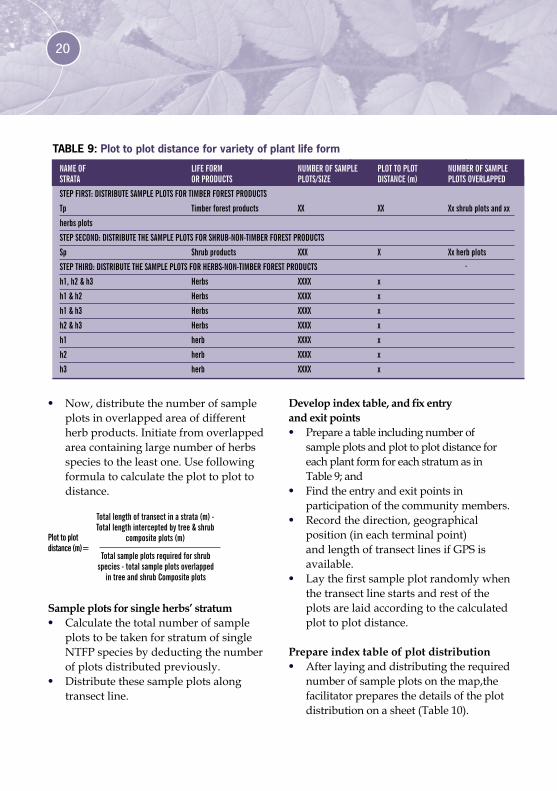
• Now, distribute the number of sample plots in overlapped area of different herb products. Initiate from overlapped area containing large number of herbs species to the least one. Use following formula to calculate the plot to plot to distance.
Total length of transect in a strata (m) - Total length intercepted by tree & shrub
composite plots (m)
Total sample plots required for shrub species - total sample plots overlapped
in tree and shrub Composite plots
Plot to plot distance (m)=
Sample plots for single herbs’ stratum• Calculate the total number of sample
plots to be taken for stratum of single NTFP species by deducting the number of plots distributed previously.
• Distribute these sample plots along transect line.
Develop index table, and fix entry and exit points • Prepare a table including number of
sample plots and plot to plot distance for each plant form for each stratum as in Table 9; and
• Find the entry and exit points in participation of the community members.
• Record the direction, geographical position (in each terminal point) and length of transect lines if GPS is available.
• Lay the first sample plot randomly when the transect line starts and rest of the plots are laid according to the calculated plot to plot distance.
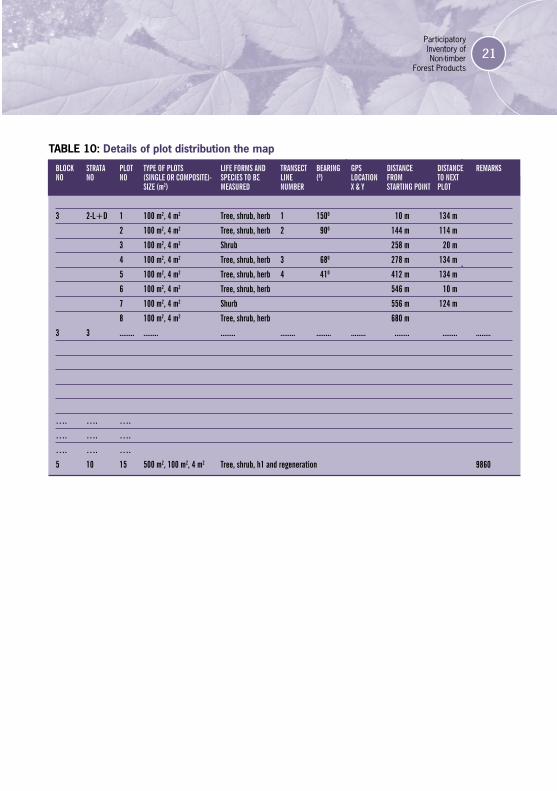
Prepare index table of plot distribution • After laying and distributing the required
number of sample plots on the map,the facilitator prepares the details of the plot distribution on a sheet (Table 10).
NAmE OF LIFE FORm NUmBER OF SAmPLE PLOT TO PLOT NUmBER OF SAmPLESTRATA OR PRODUCTS PLOTS/SIzE DISTANCE (m) PLOTS OvERLAPPED
STEP FIRST: DISTRIBUTE SAmPLE PLOTS FOR TImBER FOREST PRODUCTS
Tp Timber forest products XX XX Xx shrub plots and xx
herbs plots
STEP SECOND: DISTRIBUTE ThE SAmPLE PLOTS FOR ShRUB-NON-TImBER FOREST PRODUCTS
Sp Shrub products XXX X Xx herb plots
STEP ThIRD: DISTRIBUTE ThE SAmPLE PLOTS FOR hERBS-NON-TImBER FOREST PRODUCTS
h1, h2 & h3 herbs XXXX x
h1 & h2 herbs XXXX x
h1 & h3 herbs XXXX x
h2 & h3 herbs XXXX x
h1 herb XXXX x
h2 herb XXXX x
h3 herb XXXX x
TABLE 9: Plot to plot distance for variety of plant life form
Participatory Inventory of Non-timber
Forest Products
21
BLOCK STRATA PLOT TyPE OF PLOTS LIFE FORmS AND TRANSECT BEARING GPS DISTANCE DISTANCE REmARKSNO NO NO (SINGLE OR COmPOSITE)- SPECIES TO BE LINE (0) LOCATION FROm TO NEXT SIzE (m2) mEASURED NUmBER X & y STARTING POINT PLOT
3 2-L+D 1 100 m2, 4 m2 Tree, shrub, herb 1 1500 10 m 134 m
2 100 m2, 4 m2 Tree, shrub, herb 2 900 144 m 114 m
3 100 m2, 4 m2 Shrub 258 m 20 m
4 100 m2, 4 m2 Tree, shrub, herb 3 680 278 m 134 m
5 100 m2, 4 m2 Tree, shrub, herb 4 410 412 m 134 m
6 100 m2, 4 m2 Tree, shrub, herb 546 m 10 m
7 100 m2, 4 m2 Shurb 556 m 124 m
8 100 m2, 4 m2 Tree, shrub, herb 680 m
3 3 ........ ........ ........ ........ ........ ........ ........ ........ ........
…. …. ….
…. …. ….
…. …. ….
5 10 15 500 m2, 100 m2, 4 m2 Tree, shrub, h1 and regeneration 9860
TABLE 10: Details of plot distribution the map

22 Carry out the Measurement in the Field
Stage Three
The stage three of this toolkit presents process of field measurement and recording of data for subsequent analysis. This stage includes two steps (Figure 11). The first step describes procedure and tools for laying the sample plots on the ground. The next step provides methods and tools for field measurement and recording of information on various forest products, e.g. timber, root/rhizome, leaf, fruit and flowers, barks, whole plant and exudates.
Thus, the steps and activities of this stage are concerned with collecting and organizing inventory data. The data generated in this way will be used in the analysis, the methods and tools of which are presented in the stage four of this toolkit.
Step 1: layout the Sample plotS on the groundThe first step of stage three of this toolkit guides the facilitator on how to lay out sample plots on the ground (the location of the sample plots were identified at the end of stage two). As mentioned earlier, plot layout as well as field measurements are carried out by an in inventory team, comprising of facilitator(s) and a number of previously assigned local people. It is important to remind the roles of team members as assigned previously before starting the work on ground. Now the
FIGURE 12: LAyOUT OF ThE SAmPLE PLOTS ON GROUND
FIGURE 11: STEPS OF FIELD mEASUREmENT
Carry out measurement and recording 1) Timber products 2) Non-timber forest products
•Roots and rhizome
• Leaves
•Bark
• Fruits and flowers
•Whole plants
Lay the sample plots on the ground
Participatory Inventory of Non-timber
Forest Products
23
facilitator carries out the following procedures to lay out the plots.
• Find the starting plot on transect line in participation of community members and from reference of geographic data.
• Fix the centre of the plot and mark the edges of the plots.
• Stretch the nylon rope along the plot boundary keeping small flag on the borders. Facilitator can also place the team member around the plot if possible.
• For composite plots, lay out the smallest one first and gradually the larger one (Figure 12).
• Data recorder needs to stand at a place from where whole plot is visible.
• Record the plot characteristics (slope, aspect, altitude, soils characters (texture and color), associated species and other features) within the sample plots.
Step 2: Carry out meaSurement and reCordingThe second step involves the measurement and recording in the sample plots, which were laid out on the ground either as single or composite plots. Methods of measurement vary according to forest product categories and are provided below in the following categories:
2.1 Trees and shrubs 2.2 Non-timber forest products
2.2.1 Roots and rhizome2.2.2 Leaves2.2.3 Bark2.2.4 Fruits and flowers2.2.5 Whole plant
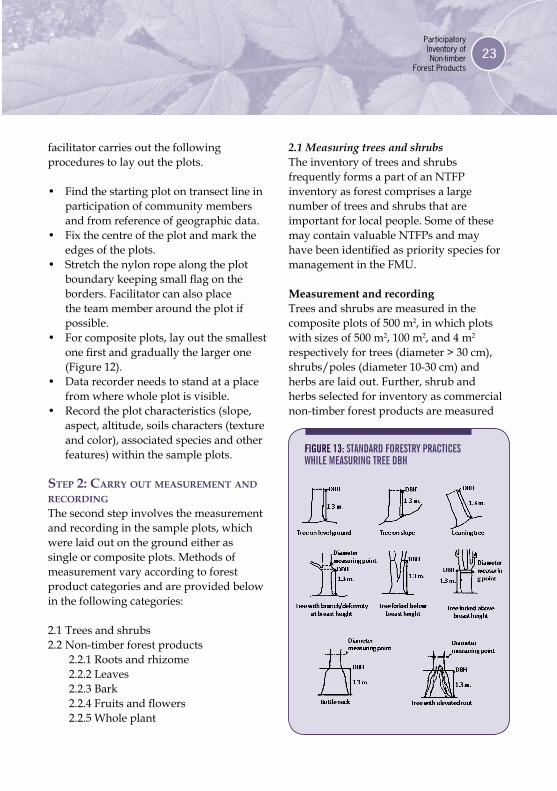
2.1 Measuring trees and shrubsThe inventory of trees and shrubs frequently forms a part of an NTFP inventory as forest comprises a large number of trees and shrubs that are important for local people. Some of these may contain valuable NTFPs and may have been identified as priority species for management in the FMU.
Measurement and recording Trees and shrubs are measured in the composite plots of 500 m2, in which plots with sizes of 500 m2, 100 m2, and 4 m2
respectively for trees (diameter > 30 cm), shrubs/poles (diameter 10-30 cm) and herbs are laid out. Further, shrub and herbs selected for inventory as commercial non-timber forest products are measured
FIGURE 13: STANDARD FORESTRy PRACTICES WhILE mEASURING TREE DBh

24
in detail within these composite plots. The following are measured and recorded in the format (see Annex 2):• plant species;• dbh of the mature and pole sized tree;• height of the mature and pole sized tree;• estimated crown cover of tree, shrubs
and herbs; and• number of sapling and seedling.
Dbh measurementDbh is the basic measure of trees which is recorded for all trees The dbh of individual trees greater than or equal to 10 cm dbh are measured with diameter tape or callipers of each tree in composite plots. Each tree is recorded individually, together with its species name. Trees on the border must be included if >50% of their basal area falls within the plot and excluded if > 50% of their basal area falls outside the plot. Trees overhanging into the plot are excluded, but trees with their trunk inside of the sampling plot and branches out are included. (Note that, for stems with irregularities, measurements is done according to the principles illustrated in Figure 13.)
Height measurementWithin the tree composite plots, the height of each mature and pole size tree is measured using clinometers or Silva survey master or Vertex IV and transponder (procedures to use these equipment is given in Annex 3). The data recording format is given in Annex 2.
Shrub and herbs measurementWithin tree composite plots, number, average height and shrub diameter are measured and recorded. Similarly, all
the herbs which are commercially not important are counted and recorded. However, the selected commercial NTFPs are measured applying the methods as described below.
2.2 NTFPs measurementThe measurement techniques for NTFPs are different from timber and may also differ within NTFP species due to variability in season of growth (e.g., flowers can be measured only in the flowering season), rotation period and varieties of products. Thus, the method of measurement for each category of NTFP is discussed as below:
2.2.1 Roots and rhizomesThere are large number of plant species that have commercially important roots and rhizomes. The measurement techniques for all species of this category are similar but the season of inventory varies with their harvesting time. The season of inventory and methods of inventory are discussed below.
Season of inventoryPlants provide optimum yield of the product when they are mature. For root and rhizomes, the inventory season coincides with the “harvesting season” in which they grow to the full. Table 11 provides the season of inventory for some commercial species having the root and rhizome (Please see resource book “Commercially important Non-timber forest products in Nepal” published by ANSAB, 2003 for harvesting time of other species not included in Table 11). However, facilitator needs to avoid too hot, too rainy, too snowy and stormy days for field measurement.

Participatory Inventory of Non-timber
Forest Products
25
Measurement and data recordingThe following are the ways in which rhizomes and roots are measured and recorded.
• Count the selected species within sample plot and record it on the Format 1. In addition, record the name of associated species in the plot.
• Calculate conversion factor if unavailable. Dig or uproot all the roots and rhizome of selected NTFP from 4 m2 plot. Take the average fresh weight of a plant during the inventory. Dry the roots/rhizome in sun or oven. Weigh the dried roots and rhizome (please see Box 5). Calculate conversion factor using following formula:
Conduct this process in five percent of total sample plots only.
• Count the number of plants in rest of the sample plots and record it properly.
2.2.2 LeavesThere are a large number of plant species that have leaves of commercial value. It is important to have detailed inventory
SN SPECIES (LOCAL NAmE) SCIENTIFIC NAmE SEASON OF INvENTORy
1 Jatamansi Nardostachys grandiflora September - December
2 Kutki Picrorhiza scrophulariflora October – November
3 Kurilo Asparagus racemosus January - march
4 Sugandhawal Valeriana jatamansi September - November
5 Padamchal Rheum emodi October – November
6 Niramansi Delphinium denudatum November - December
7 Ban Lasun Allium wallichii October – November
8 Bikhma Aconitum sps. September - December
9 Satuwa Paris polyphylla September - November
10 Pakhanbed Bergenia ciliata September - November
11 Bhutkesh Selinum wallichianum October – November
12 Bojho Acorus calamus November - December
13 Bikh Aconitum spicatum October – November
14 Atis Delphinium himalayii October – November
TABLE 11: Species and their inventory season
conversion factor = dry weight of the sample fresh weight of sample
Box 5: Calculating dry weight of roots
In order to calculate dry weights of the sample, carry out the following activities:
• keep safely the collected samples in a plastic bag or in cloth or in sacs; and
• dry the root continuously on sun heat or oven (if available) until the sample gets constant weight and record the dry weight on the given format.
26
and sustainable harvesting plan for those species. The measurement technique of this product category is different according to plant types i.e. bush and tree. The season of inventory and measurement method for these species are described under subsequent sub-headings with examples:
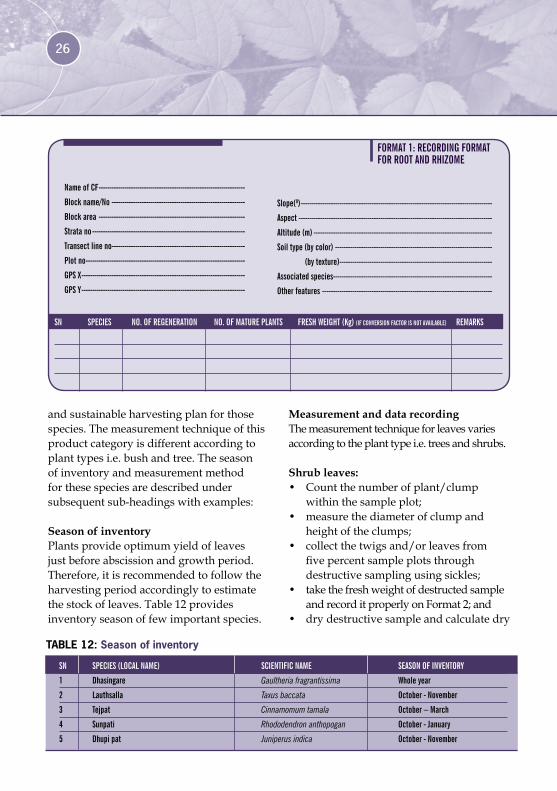
Season of inventoryPlants provide optimum yield of leaves just before abscission and growth period. Therefore, it is recommended to follow the harvesting period accordingly to estimate the stock of leaves. Table 12 provides inventory season of few important species.
Measurement and data recordingThe measurement technique for leaves varies according to the plant type i.e. trees and shrubs.
Shrub leaves:• Count the number of plant/clump
within the sample plot;• measure the diameter of clump and
height of the clumps;• collect the twigs and/or leaves from
five percent sample plots through destructive sampling using sickles;
• take the fresh weight of destructed sample and record it properly on Format 2; and
• dry destructive sample and calculate dry
FORmAT 1: RECORDING FORmAT FOR ROOT AND RhIzOmE
Name of CF --------------------------------------------------------------------
Block name/No --------------------------------------------------------------
Block area --------------------------------------------------------------------
Strata no -----------------------------------------------------------------------
Transect line no--------------------------------------------------------------
Plot no --------------------------------------------------------------------------
GPS X ----------------------------------------------------------------------------
GPS y ----------------------------------------------------------------------------
Slope(0) -----------------------------------------------------------------------------------------
Aspect ------------------------------------------------------------------------------------------
Altitude (m) -----------------------------------------------------------------------------------
Soil type (by color) -------------------------------------------------------------------------
(by texture) -----------------------------------------------------------------------
Associated species--------------------------------------------------------------------------
Other features -------------------------------------------------------------------------------
SN SPECIES NO. OF REGENERATION NO. OF mATURE PLANTS FRESh WEIGhT (Kg) (IF CONvERSION FACTOR IS NOT AvAILABLE) REmARKS
SN SPECIES (LOCAL NAmE) SCIENTIFIC NAmE SEASON OF INvENTORy
1 Dhasingare Gaultheria fragrantissima Whole year
2 Lauthsalla Taxus baccata October - November
3 Tejpat Cinnamomum tamala October – march
4 Sunpati Rhododendron anthopogan October - January
5 Dhupi pat Juniperus indica October - November
TABLE 12: Season of inventory
Participatory Inventory of Non-timber
Forest Products
27
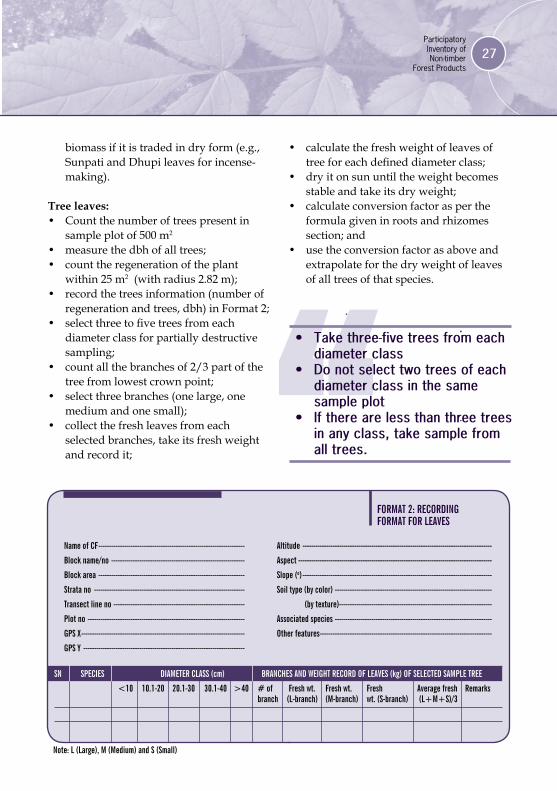
biomass if it is traded in dry form (e.g., Sunpati and Dhupi leaves for incense-making).
Tree leaves: • Count the number of trees present in
sample plot of 500 m2 • measure the dbh of all trees;• count the regeneration of the plant
within 25 m2 (with radius 2.82 m);• record the trees information (number of
regeneration and trees, dbh) in Format 2; • select three to five trees from each
diameter class for partially destructive sampling;
• count all the branches of 2/3 part of the tree from lowest crown point;
• select three branches (one large, one medium and one small);
• collect the fresh leaves from each selected branches, take its fresh weight and record it;
• Take three-five trees from each diameter class
• Do not select two trees of each diameter class in the same sample plot
• If there are less than three trees in any class, take sample from all trees.
• calculate the fresh weight of leaves of tree for each defined diameter class;
• dry it on sun until the weight becomes stable and take its dry weight;
• calculate conversion factor as per the formula given in roots and rhizomes section; and
• use the conversion factor as above and extrapolate for the dry weight of leaves of all trees of that species.
FORmAT 2: RECORDING FORmAT FOR LEAvES
Name of CF --------------------------------------------------------------------
Block name/no --------------------------------------------------------------
Block area --------------------------------------------------------------------
Strata no ----------------------------------------------------------------------
Transect line no -------------------------------------------------------------
Plot no -------------------------------------------------------------------------
GPS X ----------------------------------------------------------------------------
GPS y ---------------------------------------------------------------------------
Altitude ----------------------------------------------------------------------------------------
Aspect ------------------------------------------------------------------------------------------
Slope (o) ----------------------------------------------------------------------------------------
Soil type (by color) -------------------------------------------------------------------------
(by texture) -----------------------------------------------------------------------
Associated species -------------------------------------------------------------------------
Other features --------------------------------------------------------------------------------
SN SPECIES DIAmETER CLASS (cm) BRANChES AND WEIGhT RECORD OF LEAvES (kg) OF SELECTED SAmPLE TREE
<10 10.1-20 20.1-30 30.1-40 >40 # of Fresh wt. Fresh wt. Fresh Average fresh Remarks branch (L-branch) (m-branch) wt. (S-branch) (L+m+S)/3
Note: L (Large), m (medium) and S (Small)
28
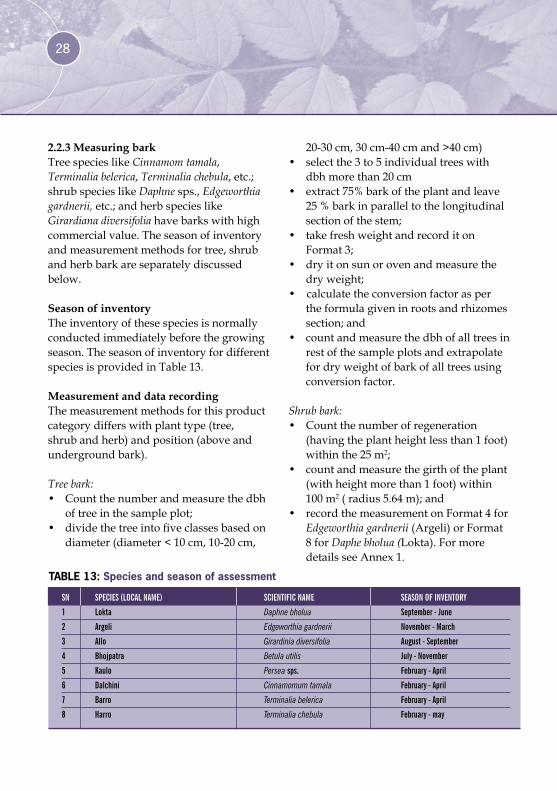
2.2.3 Measuring barkTree species like Cinnamom tamala, Terminalia belerica, Terminalia chebula, etc.; shrub species like Daphne sps., Edgeworthia gardnerii, etc.; and herb species like Girardiana diversifolia have barks with high commercial value. The season of inventory and measurement methods for tree, shrub and herb bark are separately discussed below.
Season of inventoryThe inventory of these species is normally conducted immediately before the growing season. The season of inventory for different species is provided in Table 13.
Measurement and data recordingThe measurement methods for this product category differs with plant type (tree, shrub and herb) and position (above and underground bark).
Tree bark:• Count the number and measure the dbh
of tree in the sample plot;• divide the tree into five classes based on
diameter (diameter < 10 cm, 10-20 cm,
20-30 cm, 30 cm-40 cm and >40 cm)• select the 3 to 5 individual trees with
dbh more than 20 cm• extract 75% bark of the plant and leave
25 % bark in parallel to the longitudinal section of the stem;
• take fresh weight and record it on Format 3;
• dry it on sun or oven and measure the dry weight;
• calculate the conversion factor as per the formula given in roots and rhizomes section; and
• count and measure the dbh of all trees in rest of the sample plots and extrapolate for dry weight of bark of all trees using conversion factor.
Shrub bark:• Count the number of regeneration
(having the plant height less than 1 foot) within the 25 m2;
• count and measure the girth of the plant (with height more than 1 foot) within 100 m2 ( radius 5.64 m); and
• record the measurement on Format 4 for Edgeworthia gardnerii (Argeli) or Format 8 for Daphe bholua (Lokta). For more details see Annex 1.
SN SPECIES (LOCAL NAmE) SCIENTIFIC NAmE SEASON OF INvENTORy
1 Lokta Daphne bholua September - June
2 Argeli Edgeworthia gardnerii November - march
3 Allo Girardinia diversifolia August - September
4 Bhojpatra Betula utilis July - November
5 Kaulo Persea sps. February - April
6 Dalchini Cinnamomum tamala February - April
7 Barro Terminalia belerica February - April
8 harro Terminalia chebula February - may
TABLE 13: Species and season of assessment
Participatory Inventory of Non-timber
Forest Products
29
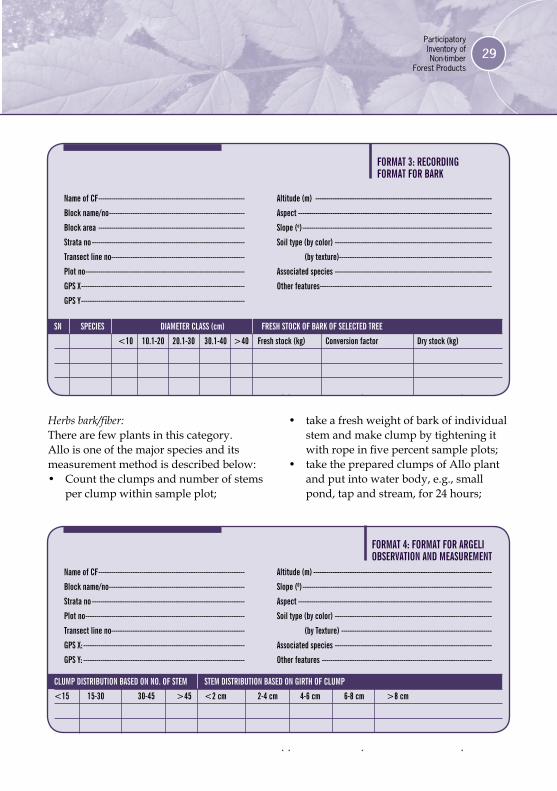
Herbs bark/fiber:There are few plants in this category. Allo is one of the major species and its measurement method is described below:• Count the clumps and number of stems
per clump within sample plot;
• take a fresh weight of bark of individual stem and make clump by tightening it with rope in five percent sample plots;
• take the prepared clumps of Allo plant and put into water body, e.g., small pond, tap and stream, for 24 hours;
FORmAT 3: RECORDING FORmAT FOR BARK
Name of CF --------------------------------------------------------------------
Block name/no ---------------------------------------------------------------
Block area --------------------------------------------------------------------
Strata no -----------------------------------------------------------------------
Transect line no--------------------------------------------------------------
Plot no --------------------------------------------------------------------------
GPS X ----------------------------------------------------------------------------
GPS y ----------------------------------------------------------------------------
Altitude (m) ----------------------------------------------------------------------------------
Aspect ------------------------------------------------------------------------------------------
Slope (o) ----------------------------------------------------------------------------------------
Soil type (by color) -------------------------------------------------------------------------
(by texture) -----------------------------------------------------------------------
Associated species -------------------------------------------------------------------------
Other features --------------------------------------------------------------------------------
SN SPECIES DIAmETER CLASS (cm) FRESh STOCK OF BARK OF SELECTED TREE
<10 10.1-20 20.1-30 30.1-40 >40 Fresh stock (kg) Conversion factor Dry stock (kg)
FORmAT 4: FORmAT FOR ARGELI OBSERvATION AND mEASUREmENT
Name of CF --------------------------------------------------------------------
Block name/no ---------------------------------------------------------------
Strata no -----------------------------------------------------------------------
Plot no --------------------------------------------------------------------------
Transect line no--------------------------------------------------------------
GPS X: ---------------------------------------------------------------------------
GPS y: ---------------------------------------------------------------------------
Altitude (m) -----------------------------------------------------------------------------------
Slope (0) ----------------------------------------------------------------------------------------
Aspect ------------------------------------------------------------------------------------------
Soil type (by color) -------------------------------------------------------------------------
(by Texture) ----------------------------------------------------------------------
Associated species -------------------------------------------------------------------------
Other features -------------------------------------------------------------------------------
CLUmP DISTRIBUTION BASED ON NO. OF STEm STEm DISTRIBUTION BASED ON GIRTh OF CLUmP
<15 15-30 30-45 >45 <2 cm 2-4 cm 4-6 cm 6-8 cm >8 cm

30
• remove the clumps from water body and extract the bark from the plant;
• make a small clump of Allo bark by tightening it with an Allo bark;
• dry the extracted bark in sun or oven;• take dry weight of all extracted bark
from different plots;• calculate the conversion factor as per the
formula provided in roots and rhizomes section;
• count the number of Allo plant in rest of the sample plots and record the measurement in Format 1.
2.2.4 Fruits and flowers/flossesFruit, flower and flosses of some plants are of high commercial value. Season and methods of inventory differs for fruits and flowers/flosses of tree, shrub and herbs.
Season of inventoryThe inventory season of fruits and flowers/flosess coincides with the season when they become mature. The list of important species with tradable fruit parts and their season of inventory is provided in Table 14.
Measurement and data recordingThe measurement method for tree fruit and
shrub or herb/climber fruit are more or less similar. • Count the number and measure the dbh
within the sample plot;• divide the tree into five dbh classes (dbh
< 10 cm, 10 - 20 cm, 20 - 30 cm, 30 - 40 cm and > 40 cm);
• select 3 - 5 individual trees from each diameter class for partial destructive sampling;
• select the 3 branches (lower, medium and top part of crown) from each selected tree;
• collect the fruit from these selected branches and calculate the average fresh
According to ANSAB study in Parbat district of Nepal, a clump of Allo contains 6 stems on an average. A stem gave 17.1 gm fresh weight and 4.8 gm dry weight of bark. Thus a conversion factor of 0.281 can be used if no local conversion factor is developed for a particular area.
SN SPECIES (LOCAL NAmE) SCIENTIFIC NAmE SEASON OF INvENTORy
1 Timur Zanthoxylum armatum October – December
2 Amala Phyllanthus emblica October – January
3 Pipla Piper longum January – march
4 Dalechuk Hippophae tibetana August – November
Hippophae salicifolia August – November
5 Chiuri Bassia butyracea June – July
6 Okhar Juglans regia September – October
7 Rittha Sapindus mukorossi October – January
8 Bel Aegle marmelos August – September
TABLE 14: Species and season of inventory for fruits

Participatory Inventory of Non-timber
Forest Products
31
weight of fruit on a branch. Record all the measurement on the Format 5.
• count and measure the diameter of all trees in the rest of the sample plots; and
• the average fruit stock of a tree is calculated and the result can be used for inventory in similar regions.
For the inventory of flowers and flosses, the methods are same as given for fruits but it is more sensitive due to their highly perishable nature. Therefore the inventory should be conduct at the time maturity of the product with due carefulness.
2.2.5 Whole plantIf whole part of a NTFP species is commercially important detailed measurement is required. This category mainly include plant and fungi. Due to various distribution patterns of the plants, the inventory techniques are different. The season and methods of inventory for those species are as provided in Table 15.
Season of inventoryThe season of inventory is chosen at a time when the plant flowers (for flowering plants) and when other fungal body
FORmAT 5: RECORDING FORmAT FOR FRUIT
Name of CF --------------------------------------------------------------------
Block name/no ---------------------------------------------------------------
Strata no -----------------------------------------------------------------------
Plot no --------------------------------------------------------------------------
Transect line no--------------------------------------------------------------
GPS X: ---------------------------------------------------------------------------
GPS y: ---------------------------------------------------------------------------
Altitude (m) -----------------------------------------------------------------------------------
Slope (0) ----------------------------------------------------------------------------------------
Aspect ------------------------------------------------------------------------------------------
Soil type (by color) -------------------------------------------------------------------------
(by texture) ----------------------------------------------------------------------
Associated species--------------------------------------------------------------------------
Other features -------------------------------------------------------------------------------
SN SPECIES DIAmETER CLASS (cm) BRANChES AND WEIGhT RECORD OF FRUIT (kg) OF SELECTED SAmPLE TREE
<10 10.1-20 20.1-30 30.1-40 >40 No. of Fresh wt. Fresh wt. Fresh wt. Average wt. Average dry wt. branches (L-branch) (m-branch) (S-branch) (L+m+S)
Note: L (Large), m (medium) and S (Small)
SN SPECIES (LOCAL NAmE) SCIENTIFIC NAmE SEASON OF INvENTORy
1 Chirayito Swertia chiraita November - January
2 Guchhichyau Morchella conica April - June
3 yarsagumba Cordyseps sinensis April - June
TABLE 15: species and season for whole plant inventory
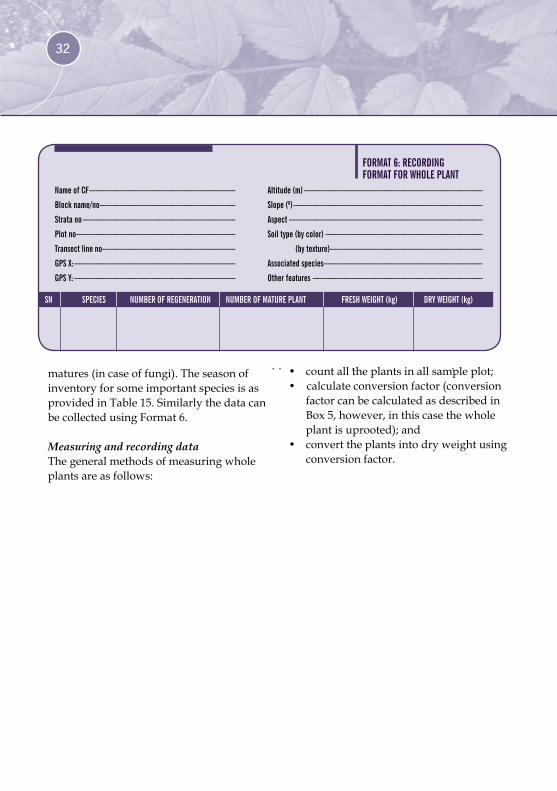
32
matures (in case of fungi). The season of inventory for some important species is as provided in Table 15. Similarly the data can be collected using Format 6.
Measuring and recording dataThe general methods of measuring whole plants are as follows:
FORmAT 6: RECORDING FORmAT FOR WhOLE PLANT
Name of CF --------------------------------------------------------------------
Block name/no ---------------------------------------------------------------
Strata no -----------------------------------------------------------------------
Plot no --------------------------------------------------------------------------
Transect line no--------------------------------------------------------------
GPS X: ---------------------------------------------------------------------------
GPS y: ---------------------------------------------------------------------------
Altitude (m) -----------------------------------------------------------------------------------
Slope (0) ----------------------------------------------------------------------------------------
Aspect ------------------------------------------------------------------------------------------
Soil type (by color) -------------------------------------------------------------------------
(by texture) -----------------------------------------------------------------------
Associated species--------------------------------------------------------------------------
Other features -------------------------------------------------------------------------------
SN SPECIES NUmBER OF REGENERATION NUmBER OF mATURE PLANT FRESh WEIGhT (kg) DRy WEIGhT (kg)
• count all the plants in all sample plot;• calculate conversion factor (conversion
factor can be calculated as described in Box 5, however, in this case the whole plant is uprooted); and
• convert the plants into dry weight using conversion factor.
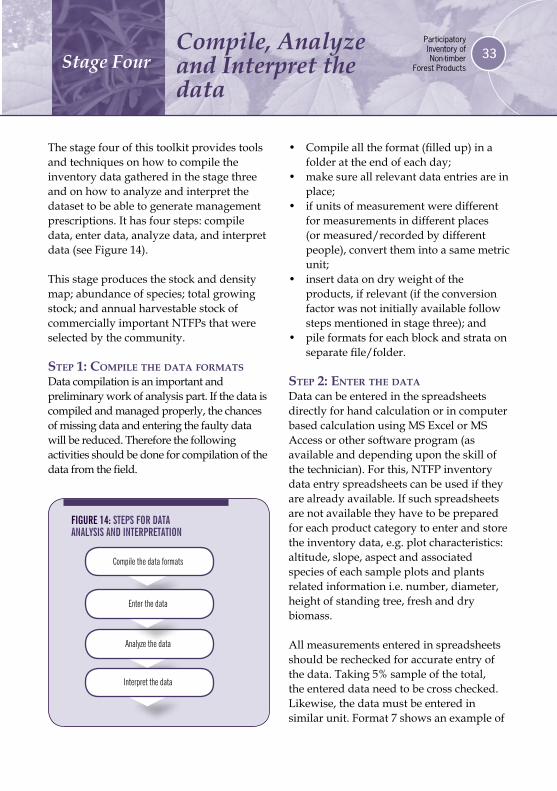
Participatory Inventory of Non-timber
Forest Products
33
The stage four of this toolkit provides tools and techniques on how to compile the inventory data gathered in the stage three and on how to analyze and interpret the dataset to be able to generate management prescriptions. It has four steps: compile data, enter data, analyze data, and interpret data (see Figure 14).
This stage produces the stock and density map; abundance of species; total growing stock; and annual harvestable stock of commercially important NTFPs that were selected by the community.
Step 1: Compile the data formatSData compilation is an important and preliminary work of analysis part. If the data is compiled and managed properly, the chances of missing data and entering the faulty data will be reduced. Therefore the following activities should be done for compilation of the data from the field.
Compile, Analyze and Interpret the data
Stage Four
• Compile all the format (filled up) in a folder at the end of each day;
• make sure all relevant data entries are in place;
• if units of measurement were different for measurements in different places (or measured/recorded by different people), convert them into a same metric unit;
• insert data on dry weight of the products, if relevant (if the conversion factor was not initially available follow steps mentioned in stage three); and
• pile formats for each block and strata on separate file/folder.
Step 2: enter the dataData can be entered in the spreadsheets directly for hand calculation or in computer based calculation using MS Excel or MS Access or other software program (as available and depending upon the skill of the technician). For this, NTFP inventory data entry spreadsheets can be used if they are already available. If such spreadsheets are not available they have to be prepared for each product category to enter and store the inventory data, e.g. plot characteristics: altitude, slope, aspect and associated species of each sample plots and plants related information i.e. number, diameter, height of standing tree, fresh and dry biomass.
All measurements entered in spreadsheets should be rechecked for accurate entry of the data. Taking 5% sample of the total, the entered data need to be cross checked. Likewise, the data must be entered in similar unit. Format 7 shows an example of
FIGURE 14: STEPS FOR DATA ANALySIS AND INTERPRETATION
Compile the data formats
Analyze the data
Enter the data
Interpret the data

34
data entry spreadsheet for NTFP root and rhizomes.
Similarly, the data entry spreadsheet is prepared for each category considering the data collection format. Then the data are entered into the spreadsheets. ANSAB has developed analysis software for Lokta (Danphe bholua), Argeli (Edgeworthia gardnerii), wintergreen (Gaultheria fragrantissima) and trees. With such spreadsheet in place, field information can be directly entered and results obtained easily.
Step 3: analyze the dataThe analysis of inventory data gives:• plant and stock density of timber and
NTFPs;• total growing stock (fresh and dry) per
hectare;• annual harvestable stock for each
species per hectare; and• total growing stock and harvestable
stock (species wise) in forest block and whole forest area.
The following steps should be followed for analysis of data:
3.1 Summarize plot level field dataFirst of all data of each species collected from the field needs to be summarized at the plot level. This includes plot level summation of the number of regeneration, number of plant and fresh weight of product (kg). (Conversion ratio for Jatamasi, Kutki and Sumpati is given in Box 6.) This step is simple and straight forward if a database has been maintained; otherwise it can be done manually by summing values from the field datasheets with the help of pocket calculator.
Box 6: Fresh and dry weight conversion ratio
FreshweightoftheJatamansi,KutkiandSunpaticanbeconvertedintodryweightusingconversionfactor0.44,0.61and0.44respectively.ItwasdevelopedbyANSABforKarnalizone.Whenconversionfactorisavail-able,destructivesamplingisnotnecessary.
FORmAT 7: DATA ENTRy FORmAT
Name of CF: -------------------
Block name/no: -------------
Block area: --------------------
Strata no.: ---------------------
Transect line no: -------------
PLOT NO SPECIES NUmBER OF REGENERATION NUmBER OF mATURE PLANTS FRESh WEIGhT (kg) REmARKS
PLOT NO GPS X GPS y SLOPE(0) ASPECT ALTITUDE SOIL TyPE ASSOCIATED SPECIES
COLOR TEXTURE

Participatory Inventory of Non-timber
Forest Products
35
1 2 3 4 5 6 7 8 9 10
3.2 Derive per hectare values from plot dataThe plot level data summarized in section 3.1 need to be converted into per hectare values. For this,
• divide the values derived from step 1 of Table 16 by the area of the block (in hectare);
• convert per hectare fresh weight into per hectare dry weight; and
• multiply per hectare fresh weight of the product (calculated by step 2 of Table 16) by a ‘fresh wt. to dry wt. conversion factor’ to derive per hectare dry weight.
3.3 Find block level total dry weight of the productThe block level dry weight of the product can be calculated by multiplying per hectare dry weight of the product (calculated from the step 3 of Table 16) and the block area (hectare).
Please refer to the fields in the table 15 for the steps below.Step 1 Plot level summarization of field data: Blocknumber( 1 ),blockarea( 2 ),speciesname( 3 ),numberofregeneration( 4 ),numberofplant( 5 )andfreshweightofproduct(kg)( 6 )aresumma-rizedfromthedatabaseorfielddatasheet.Thesefieldsareshownbyshadedfieldsinthetable15above.
Step 2 Deriving per hectare values from per block level data:Forthisexample,perhectarefreshweightof product ( 7 )hastobederivedbydividingtotalfreshweightoftheintheblock( 6 )bytheblockarea( 2 )
Step 3 Converting per hectare fresh weight into per hectare dry weight: Forthedryweightof the product per hectare ( 9 ),multiplyperhectarefreshweightoftheproduct( 7 )bythegiven‘freshwt.todrywt.conversionfactor’( 8 ).
Step 4 Finding block level total dry stock of the product:Toarriveattheblockleveldryweightofthe product ( 10 ),multiplyperhectaredryweightoftheproduct( 9 )bytheblockarea(hectare)( 2 ).
Step 5 Finding total dry stock of the product in the whole forest:Finally,summationofthedryweightsoftheproductfromtheentireblock( 10 )givesthetotaldrystockoftheproductinthewholeforest( 11 ).
Block No
Block area (ha)
Name of species
Total no. of regenera-tion in the block
Total no. of plant in the block
Total fresh wt. of product in the block (kg)
Per hectare fresh wt. of the product (kg)
Factor for converting fresh wt. into dry wt.
Per hectare dry wt. of the product (kg)
Total dry stock of the product in the forest Xxxxx kg
Total dry stock of the product in the block (kg)
TABLE 16: Worked out example for analysis data.
11

36
3.4 Calculate total dry stock of the product in the whole forestFinally, summation of the dry weights of the product from the entire blocks gives the total dry stock of the product in the whole forest.
Worked out example of data analysisTable 16 gives a worked out example of data analysis using the step-wise method mentioned.
Step 4: interpret the data The analyzed information such as area characteristics (physical features), plant abundance, total growing stock, growth and annual allowable cut of the selected species are interpreted according to the management objectives. Based on that, Forest management units in support of forest technicians need to design and incorporate the sustainable utilization and management strategies in detail.
NAmE OF ThE SPECIES TOTAL STOCK (KG) - A ANNUAL ALLOWABLE hARvEST % - B AAh (KG)-A*B
TABLE 17: Format for harvestable stock calculation
LOCAL NAmE SCIENTIFIC NAmE AAh (%)
Atis Delphinium himalayai 80
yarsagumba Cordyseps sinensis 90
Nirmasi Delphinium denudatum 75
Kutki Picrorhiza scrophulariflora 80
Ban Lasun Allium wallichii 75
Jatamansi Nardostachys grandiflora 80
Lokta Danphe bholua 70 - 80
Allo Girardiana diversifolia 90
Kaulo Persea sps. 50
Tejpat Cinnamomum tamala 70
Sunpati Rhododendron anthopogan 70
Loth Salla Taxus baccata 50 - 60
Dalechuk Hippophae tibetana 75 - 80
Timur Zanthoxylum armatum 80
Chiraito Swertia chiraita 75 - 80
Pipla Piper longum 90
TABLE 18: Speciesandannualallowableharvest(AAH)
Participatory Inventory of Non-timber
Forest Products
37
Total fresh and/or dry biomass (kg) and annual harvestable stock of the product per hectare are incorporated in reports, management plan, harvesting plan and business plan.
Stock mapping should show the block wise total and harvestable stock of timber forest products and NTFPs. Although the harvestable amount of product has been calculated in kg or cubic feet, it is better to use units of measurement that are familiar to the users.
Number of regeneration, total stock and harvestable stock are depicted in table along with some description needed for the particular management objective(s) of the FMU.
Resource status and management prescription for each block of the specified forest should be given. The NTFP stock should be linked with physical features of the block and the human influence on it, so that these form the basis for future management.
The inventory results are then used in:• Harvesting plan of timber and each
NTFP product• Forest management plan of community
managed forest• Business plan for enterprise
development • Reports of NTFP research and inventory
38
Additional ReferencesANSAB & DFO Parbat (2010) Mapping Allo Production Potential Areas
and Enterprise Opportunities in Parbat District, Asia Network for Sustainable Agriculture and Bioresources (ANSAB), Kathmandu, and District Forest Office, Parbat, Nepal.
ANSAB & SNV (2002) Inventory of Non-Timber Forest Products at Mimi, Melchham and Darma VDCs Humla, Nepal,Asia Network for Sustainable Agriculture and Bioresources and Netherland Development organization-SNV, Nepal.
ANSAB (2003) Commercially important non timber forest products (NTFPs) of Nepal, Asia Network for Sustainable Agriculture and Bioresources, Kathmandu, Nepal.
ANSAB (2003) Enterprise Development for Natural Products Manual, Asia Network for Sustainable Agriculture and Bioresources, Kathmandu, Nepal.

Participatory Inventory of Non-timber
Forest Products
39
The participatory process of inventory for four species is illustrated here in detail. The species are Lokta, Jatamansi, Dhasingare and Chiraito as an example practiced by ANSAB in Nepal.
1. Lokta (Daphne bholua)Product category: BarkAssessment of Lokta in Binayak
Community Forest, Bajhang
Step 1: partiCipatory reSourCe mapping The community in support of ANSAB forest technician prepared a participatory resource map showing forests and their real users. The forest boundary was delineated on a topographic map sheet neatly and cleanly.
Step 2: foreSt boundary Survey and mapping Using topographical map sheet, forest boundary was tentatively delineated. The
boundary was verified with a compass and tape survey. The community forest area was calculated from the map (912 hectares), and was divided into seven blocks, based on the existing natural boundaries and forest types.
Step 3: Sampling deSignLokta grows in patches that are highly variable in size and density. To reduce variability, the size of the plots should have been large. Taking the 0.5 % sampling intensity, the sample size was determined. In order to take the measurement, the sample plot size of 100 m2 area was used. 136 plots were determined as optimal number of sample plots. Then the plots were allocated along the strata based on stratified systematic sampling along the transect line with plot to plot distance of 55 m.
Annex 1: Examples of participatory inventory four NTFP species—Lokta, Jatamansi, Wintergreen, Chiraito
Annexes
NAmE OF CFUG: BLOCK NO.: AREA OF BLOCK:
STRATA NO: ASPECT: ALTITUDE (m): SLOPE (0): ASSOCIATED SPECIES:
Plot no. Plot no. Plot no. Plot no. Plot no. Plot no.
Girth (cm) No Girth (cm) No Girth (cm) No Girth (cm) No Girth (cm) No Girth (cm) No
0-2 0-2 0-2 0-2 0-2 0-2
2-4. 2-4. 2-4. 2-4. 2-4. 2-4.
4-6. 4-6. 4-6. 4-6. 4-6. 4-6.
6-8. 6-8. 6-8. 6-8. 6-8. 6-8.
8-10. 8-10. 8-10. 8-10. 8-10. 8-10.
10-12. 10-12. 10-12. 10-12. 10-12. 10-12.
12-14. 12-14. 12-14. 12-14. 12-14. 12-14.
14-16 14-16 14-16 14-16 14-16 14-16
>16 >16 >16 >16 >16 >16
FoRmAT 8: Data recording format for Lokta plant

40
Step 4: meaSurement and reCordingTwenty major tree species and twenty NTFP species were recorded. Only seven tree species and Lokta were inventoried in greater detail. Stock of Lokta was recorded for predetermined girth classes as provided in format to identify sustainable harvesting levels (Table 19).
Step 5: data analySiS and eStimation of SuStainable harveSt levelSThe stock of Lokta was estimated for community forest using data analysis software of Lokta by ANSAB. Using the inventory result and available secondary sources (growth rate, stem diameter and bark yield relations etc.), sustainable yield was prescribed for five years. Every year the FUG can obtain approximately 20,000 kg of Lokta bark that produced 7200 kg of handmade paper. Sampling error can be expected but experiences afterwards showed that the estimate provided a fairly accurate basis to judge the potential of Lokta supply, upon which enterprise decisions could be made.
Step 6: inCorporation of management proviSionS in fmpThe information was used to prescribe harvesting system for timber as well as NTFP used in subsistence and/or income generating activities. The plan included a separate section on the harvesting of NTFP, particularly Lokta. The 5-year operational plan described the forest management and harvesting activities.
The group applied relatively a quick, participatory, yet scientific assessment
of resources and expanded community forest area to make a total of 912 ha. The sustainable harvesting system mentioned in the community forest management plan and implemented by the group supported the supply of optimum raw material required for the enterprise run by same group.
2. jatamanSi (nardoStaChySgrandiflora)Product category: Root/RhizomeJatamansi inventory in Humla
Step 1: Participatory resource mapping A participatory map of the forest was prepared showing different forest types and conditions, indicating the distribution of Jatamansi in five community forests.
Step 2: Boundary survey and mapping Participatory resource mapping was done in order to capture and portray the information on the map in participation of community members. For finalizing the participatory map verification and cross checking was conducted in participation of locals. Then, the effective area of Jatamansi was calculated as 6010 hectare from 5 CFUGs.
Step 3: Sample designJatamansi grows in patches that are highly variable in size and density. To reduce variability, the size of the plots should be large, but the optimum size proved to be impracticable. Taking the 0.01% sampling intensity, the sample size was determined. In order to take the measurement, the sample plot size was used an area of 4 m2.

Participatory Inventory of Non-timber
Forest Products
41
The harvested Jatamansi was pooled and converted to kg/4 m2 units that also read as tons per hectare.
Step 5: Data analysis estimation of sustainable harvest levelsThe data from each sites and strata were compiled and various analyses were done. Using the collected information, the total stock was calculated for Jatamansi (see Table 19).
Step 6: Incorporation of management provisions in FMPTable 20 gives a summary of the recommended optimal harvesting practices for Jatamansi as determined from the biological field research and studies completed in Humla.
SPECIES AND ITS ASSOCIATION mEAN GROUND COvER (%) mEAN PRODUCTION ±95% CI1 (kg/ha)
Jatamansi only 30.62 2772.49±426.92
Jatamansi and Kutki 50.35 2022.16±1011.08
Jatamansi and Sunpati 22.6 1919.47±332.80
Jatamansi, Kutki and Sunpati 19.65 1771.25±726.00
TABLE 19: Distribution and production of the Jatamansi by different combinations of association with other species
PLANT SPECIES FRESh PRODUCTS (kg/ha) RATIO OF FRESh TO DRy WEIGhT DRy PRODUCTS (kg/ha)
Jatamansi 2315.60 1:0.44 1018.86
Similarly, the fresh weight ratio was determined for Jatamansi using the measured fresh and dry biomass of the Jatamansi as below:
PLANT SPECIES AND OPTImAL OPTImAL OPTImAL PERCENTAGE OPTImAL hARvESTING PARTS hARvESTED hARvEST SEASON ROTATIONAL INTERvAL OF PLANT NOT hARvESTED mEThOD
Jatamansi(rhizomes) Fall 5 years 20% plants undisturbed Whole plants pulled from bushy areas and dug out carefully using tool (kuto) from open grasslands.
TABLE 20: Recommended optimal harvesting practices for sustainable use
A total of 1502 sample plots were systematically distributed along the transect line in the strata with calculated plot to plot distance.
Step 4: Measurement and recordingObservations were made and measurements of specified variables were taken from each sample plot using the standard inventory form developed for the study. Five places were selected from the best looking spots in terms of density. A total of 10 replications were made for destructive harvesting. The numbers of individuals were counted; fresh weight was taken in the field; and their dry weight was taken after drying on solar heat. Similarly, the numbers of individual were only counted in rest of the sample plots.
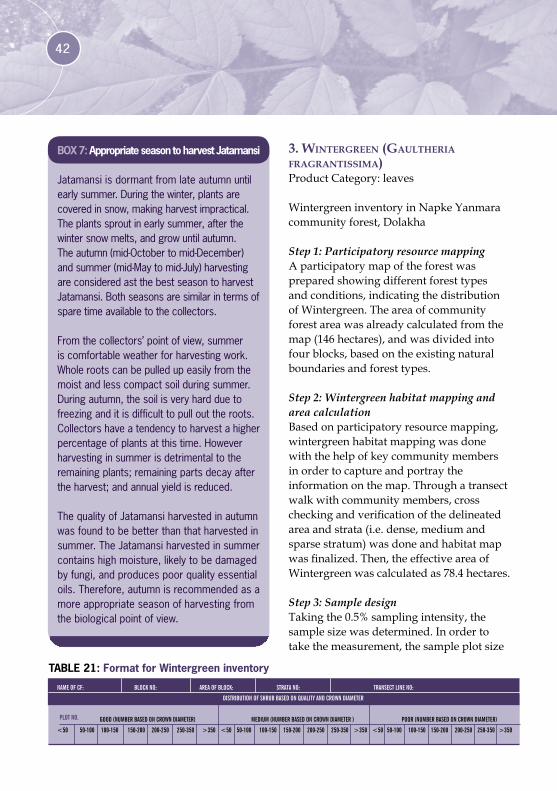
42
Box 7: Appropriate season to harvest Jatamansi
Jatamansiisdormantfromlateautumnuntilearlysummer.Duringthewinter,plantsarecoveredinsnow,makingharvestimpractical.Theplantssproutinearlysummer,afterthewintersnowmelts,andgrowuntilautumn.Theautumn(mid-Octobertomid-December)andsummer(mid-Maytomid-July)harvestingare considered ast the best season to harvest Jatamansi.Bothseasonsaresimilarintermsofsparetimeavailabletothecollectors.
Fromthecollectors’pointofview,summeriscomfortableweatherforharvestingwork.Wholerootscanbepulledupeasilyfromthemoistandlesscompactsoilduringsummer.Duringautumn,thesoilisveryhardduetofreezinganditisdifficulttopullouttheroots.Collectorshaveatendencytoharvestahigherpercentageofplantsatthistime.Howeverharvestinginsummerisdetrimentaltotheremainingplants;remainingpartsdecayaftertheharvest;andannualyieldisreduced.
ThequalityofJatamansiharvestedinautumnwasfoundtobebetterthanthatharvestedinsummer.TheJatamansiharvestedinsummercontainshighmoisture,likelytobedamagedbyfungi,andproducespoorqualityessentialoils.Therefore,autumnisrecommendedasamoreappropriateseasonofharvestingfromthebiologicalpointofview.
3. Wintergreen (gaultheria fragrantiSSima)Product Category: leaves
Wintergreen inventory in Napke Yanmara community forest, Dolakha
Step 1: Participatory resource mapping A participatory map of the forest was prepared showing different forest types and conditions, indicating the distribution of Wintergreen. The area of community forest area was already calculated from the map (146 hectares), and was divided into four blocks, based on the existing natural boundaries and forest types.
Step 2: Wintergreen habitat mapping and area calculationBased on participatory resource mapping, wintergreen habitat mapping was done with the help of key community members in order to capture and portray the information on the map. Through a transect walk with community members, cross checking and verification of the delineated area and strata (i.e. dense, medium and sparse stratum) was done and habitat map was finalized. Then, the effective area of Wintergreen was calculated as 78.4 hectares.
Step 3: Sample designTaking the 0.5% sampling intensity, the sample size was determined. In order to take the measurement, the sample plot size
NAmE OF CF: BLOCK NO: AREA OF BLOCK: STRATA NO: TRANSECT LINE NO:
DISTRIBUTION OF ShRUB BASED ON qUALITy AND CROWN DIAmETER
GOOD (NUmBER BASED ON CROWN DIAmETER) mEDIUm (NUmBER BASED ON CROWN DIAmETER ) POOR (NUmBER BASED ON CROWN DIAmETER)
<50 50-100 100-150 150-200 200-250 250-350 >350 <50 50-100 100-150 150-200 200-250 250-350 >350 <50 50-100 100-150 150-200 200-250 250-350 >350
TABLE 21: Format for Wintergreen inventory
PLOT NO.
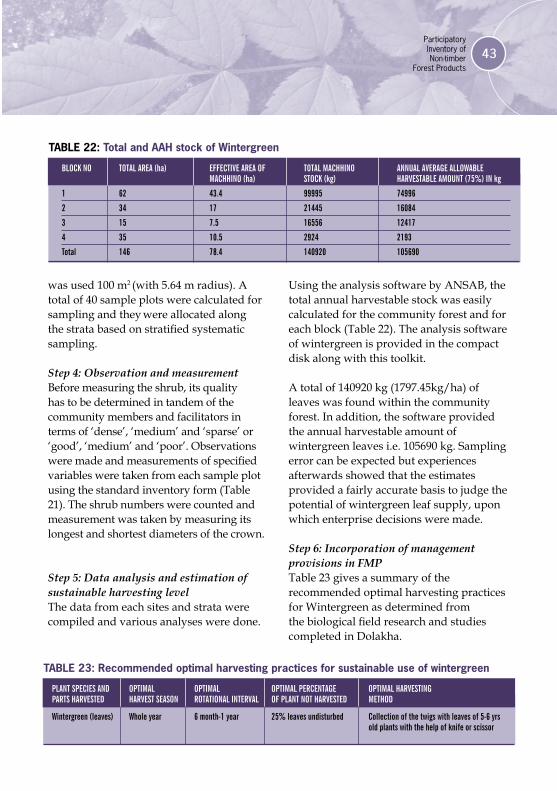
Participatory Inventory of Non-timber
Forest Products
43
was used 100 m2 (with 5.64 m radius). A total of 40 sample plots were calculated for sampling and they were allocated along the strata based on stratified systematic sampling.
Step 4: Observation and measurementBefore measuring the shrub, its quality has to be determined in tandem of the community members and facilitators in terms of ‘dense’, ‘medium’ and ‘sparse’ or ‘good’, ‘medium’ and ‘poor’. Observations were made and measurements of specified variables were taken from each sample plot using the standard inventory form (Table 21). The shrub numbers were counted and measurement was taken by measuring its longest and shortest diameters of the crown.
Step 5: Data analysis and estimation of sustainable harvesting level The data from each sites and strata were compiled and various analyses were done.
Using the analysis software by ANSAB, the total annual harvestable stock was easily calculated for the community forest and for each block (Table 22). The analysis software of wintergreen is provided in the compact disk along with this toolkit.
A total of 140920 kg (1797.45kg/ha) of leaves was found within the community forest. In addition, the software provided the annual harvestable amount of wintergreen leaves i.e. 105690 kg. Sampling error can be expected but experiences afterwards showed that the estimates provided a fairly accurate basis to judge the potential of wintergreen leaf supply, upon which enterprise decisions were made.
Step 6: Incorporation of management provisions in FMPTable 23 gives a summary of the recommended optimal harvesting practices for Wintergreen as determined from the biological field research and studies completed in Dolakha.
BLOCK NO TOTAL AREA (ha) EFFECTIvE AREA OF TOTAL mAChhINO ANNUAL AvERAGE ALLOWABLE mAChhINO (ha) STOCK (kg) hARvESTABLE AmOUNT (75%) IN kg
1 62 43.4 99995 74996
2 34 17 21445 16084
3 15 7.5 16556 12417
4 35 10.5 2924 2193
Total 146 78.4 140920 105690
TABLE 22: TotalandAAHstockofWintergreen
PLANT SPECIES AND OPTImAL OPTImAL OPTImAL PERCENTAGE OPTImAL hARvESTING PARTS hARvESTED hARvEST SEASON ROTATIONAL INTERvAL OF PLANT NOT hARvESTED mEThOD
Wintergreen (leaves) Whole year 6 month-1 year 25% leaves undisturbed Collection of the twigs with leaves of 5-6 yrs old plants with the help of knife or scissor
TABLE 23: Recommended optimal harvesting practices for sustainable use of wintergreen

44
4. Chiraito (SWertia Chirayita)Product Category: Whole plantChiraito assessment in Darchula
Step 1: Participatory resource mapping Chiraito habitat was delineated and stratification (i.e. dense, medium and sparse stratum) was made in the forest map by community members in facilitation of forest technicians. Through a transect walk with community members, cross check and verification of the delineated area and strata were done and habitat map was finalized. Then, area was calculated for each species.
Step 2: Chiraito habitat mapping and area calculation Transect walk with community members was made in order to cross check and verify the delineated area and stratification were done. The delineated potential habitat and strata was finalized after the transect walk in the area. Then, area was calculated for each species
Step 3: Sampling design Taking sampling intensity 0.5%, the number of sample plots of size 4 m2 was calculated for sampling. Similarly, the plot to plot distance was calculated. These sample plots were laid along the transect line following the stratified systematic sampling.
Step 4: Measurement and recording After laying the plot on ground, measurement was made in the plot of 4 m2. The numbers of individual were counted and fresh weight was taken through destructive sampling on five percent of total sample plots. In the remaining plots only number of plants were recorded.
Step 5: Data analysis and estimation of sustainable harvesting levelAfter completion of field measurement, data sheets were in systematic manner based on strata and the total and harvestable stock (number and volume)was analyzed, density and distribution of Chiraito per hectare, in blocks and within the community forest were estimated. In average, 1.93 to 2.61 chiraito plant per m2. and up to 100-400 kg dry biomass per hectare was found. This data has also been supported by another research conducted by CECI which found 207.33 kg per hectare (Chaudhary, 2004).
Step 6: Incorporation of management provisions in FMP
Table 24 gives a summary of the recommended optimal harvesting practices for Chiraito as determined from the biological field research and studies.
PLANT SPECIES AND OPTImAL OPTImAL OPTImAL PERCENTAGE OPTImAL hARvESTING PARTS hARvESTED hARvEST SEASON ROTATIONAL INTERvAL OF PLANT NOT hARvESTED mEThOD
Chiraito (whole plant) November - 3 years 20% plants undisturbed Whole plants pulled or dug out carefully with January prescribed tool (kuto) from the sample plots
TABLE 24: Recommended optimal harvesting practices for sustainable use of Chiraito
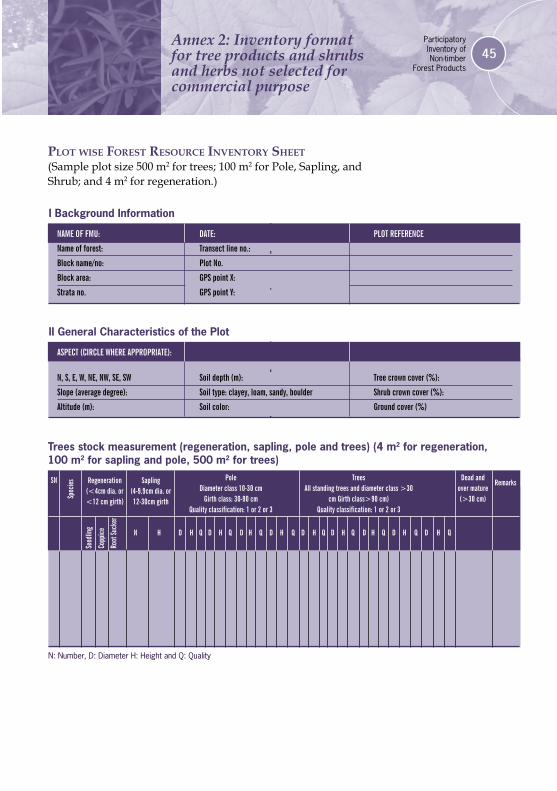
Participatory Inventory of Non-timber
Forest Products
45Annex 2: Inventory format for tree products and shrubs and herbs not selected for commercial purpose
plot WiSe foreSt reSourCe inventory Sheet(Sample plot size 500 m2 for trees; 100 m2 for Pole, Sapling, and Shrub; and 4 m2 for regeneration.)
NAmE OF FmU: DATE: PLOT REFERENCE
Name of forest: Transect line no.:
Block name/no: Plot No.
Block area: GPS point X:
Strata no. GPS point y:
I Background Information
ASPECT (CIRCLE WhERE APPROPRIATE):
N, S, E, W, NE, NW, SE, SW Soil depth (m): Tree crown cover (%):
Slope (average degree): Soil type: clayey, loam, sandy, boulder Shrub crown cover (%):
Altitude (m): Soil color: Ground cover (%)
N:Number,D:DiameterH:HeightandQ:Quality
II General Characteristics of the Plot
Treesstockmeasurement(regeneration,sapling,poleandtrees)(4m2forregeneration,100 m2forsaplingandpole,500m2 for trees)
SN
N h D Dh hq qD Dh hq qD Dh hq qD D Dh h hq q q
Regeneration (<4cm dia. or <12 cm girth)
Sapling(4-9.9cm dia. or 12-30cm girth
PoleDiameter class 10-30 cm
Girth class: 30-90 cmquality classification: 1 or 2 or 3
TreesAll standing trees and diameter class >30
cm Girth class>90 cm)quality classification: 1 or 2 or 3
Dead and over mature (>30 cm)
Remarks
Spec
ies
Seed
ling
Copp
ice
Root
Suck
er

46
SN SPECIES REGENERATION (NO.) ADULT PLANTS CROWN COvER (%) REmARKS (INvADER, ETC.)
1
2
3
4
5
6
7
OThERS
Shrubs measurement Sample plot size for shrub 100 m2,andforitsregeneration4m2
SEEDLING COPPICE ROOT SUCKER NO Av. hEIGhT
SN SPECIES REGENERATION (NO.) ADULT PLANTS CROWN COvER BIOmASS REmARKS (INvADER, ETC.)
1
2
3
4
5
6
7
OThERS
Herbspeciesmeasurement(Sampleplotsizeof4m2)
NO Av. hEIGhT
NUmBER OF CLUmP DIAmETER OF CLUmP NUmBER OF STEm IN A CLUmP REGENERATION qUALITy REmARKS
1
2
3
4
5
6
Nigalomeasurement(plotsizeof100m2 if sparse otherwise 25 m2)

Participatory Inventory of Non-timber
Forest Products
47
Vertex IV and Transponder T3 (Source: Vertex IV and Transponder T3 manual January 2007, v.10)
deSCriptionThe Vertex IV is primarily used to measure the height of standing trees. The instrument can also be used to measure distance, horizontal distance, angle and inclination. The Vertex instrument uses ultrasonic measuring technique for measurements.
Setting-up the equipmentAll settings to measure heights, distances and angles are made in the SETUP menu. Choose between metric or feet, degrees or percentage, pivot offset, transponder height and manual distance. Start the Vertex IV by pressing ON. Press any of the arrow keys to go to the SETUP page and press ON to enter into settings. Step to the parameter using ON and change values with the arrow keys.
METRIC/FEET Choose if height and distance values should be featured in METRIC or FEET. Shift with the arrow keys and confirm your choice with ON.
DEG/GRAD/% Select Angle unit as Deg (degrees 0 to 360), GRAD (gradients 0 to 400) or % (percentage) by pressing the arrow keys. Confirm by pressing ON.
P.OFFSET (Pivot Offset) Change the value with the arrow keys and confirm your choice with ON. The value is shown in Metric/Feet.
The “Pivot offset” is equal to the distance between the front side of the instrument to the aimed point where the prolonging of the sight line from the transponder and the top of the tree coincide. The imagined point is located somewhere behind your neck and
Annex 3: Description of equipment (Vertex IV and Transponder, Silva survey master and densitometer)
To define a reference point in a secure and reliable way, the Vertex IV communicates and works with the transponder T3
The Vertex IV has three keys: Two arrow keys and one ON key. To turn the Vertex IV off, press DME and IR keys together.
Vertex IV and the transponder T3 each use an alkaline or a rechargeable battery of 1.5 V AA. The battery is placed under the battery cap, plus pole + down. Data in the Vertex can be sent through IR or Bluetooth.

48
turning the t3 on and offThe T3 has no switch and the Vertex is used as a remote control to turn T3 off and on. For both turning the T3 on and off, turn on the Vertex IV, press any of the arrow keys to go to the CALIBRATE page and press ON to enter into calibration and do as follows:
To turn T3 ON: Press ON until two signals beeps from the T3.
To turn T3 OFF: Press ON until four signals beeps from the T3.
The T3 is equipped with an audible signal that tells if the transponder is activated or not. Once turned on, the T3 Transponder stays activated for approximately 20 minutes.
CalibrationTo increase and optimize the measuring accuracy, the instrument should be calibrated on a regular basis. The measuring fault can be made permanent if the instrument is calibrated before reaching the correct current temperature. Therefore, when calibrating, it is of utmost importance that the instrument has been given enough time to stabilize at ambient temperature.
Use a measuring tape to measure the exact distance of 10.0 m (32.8 feet) between the T3 and the Vertex front.
the value should in normal cases be set to 0.3 m (1.0 feet).
Since the Vertex IV will presume that the transponder T3 is placed directly under the aimed height of the measuring object (when the object is equal to a tree), a half of the objects diameter should be added to the Pivot Offset. This compensates for the diminishment of the tree top. When measuring tree heights, it is recommended to add half the average diameter in the area, for improved accuracy.
t.height (tranSponder height)Change the value with the arrow keys and confirm with ON. The value is set in metric/feet. T.HEIGHT is the height where the transponder is set, the reference height for the measuring unit. The Vertex IV adds the preset T. HEIGHT to the measured height. Normal breast height value is set to 1.3 m (4.5 ft).
m.diSt (manual diStanCe)This function is useful when measuring without the transponder. Change value with the arrow keys and confirm with the ON key. The value is shown in metric or feet. M. DIST is the manual distance to the reference point on the object where the height is measured. Make sure that the T.HEIGHT is correctly set, i.e. the height to the chosen reference point.
To perform any of the operations described below, ensure a battery in placed in the T3 properly and keep the measuring unit’s loudspeaker towards the T3’s loudspeaker.

Participatory Inventory of Non-timber
Forest Products
49
Press ON to start the Vertex instrument, step in the menu to CALIBRATE and press ON. The instrument will calibrate to 10 m, automatically exit from the calibration and display the CALIBRATE page.
Again, it is important to give the instrument approximately 10 minutes to set to the correct temperature before calibrating.
meaSuring tree height With tranSponder t3Start the transponder T3 and place it on the tree to be measured. Note that the transponder should be placed at the T.HEIGHT (transponder height) that has been determined in the settings menu. Walk a suitable distance from the object – for optimal result accuracy, a distance equal to the approximate tree height.
1. Press ON to start the Vertex, scroll to the HEIGHT page and aim at the transponder. Keep pressing ON until the cross hair sight goes out momentarily. Now release ON. The Vertex has measured the distance, the angle and the horizontal distance to the transponder.
2. Aim at the height to measure with the sight cross blinking. Press ON until the cross hair disappears. The height of the tree is locked and displayed.
Detecting the trees on the edge (circumference) of a circular plot
When the T3 is used with the adapter (graduated staff), the ultrasound is spread and it is possible to take measurement from any direction. This is particularly useful when working in circular plots, where the distance from the plot centre to trees within a defined circle should be measured.
To determine the radius in case of a circular plot, first fix the T3 at T. HEIGHT at the centre of the plot. Then press the DME key (left arrow key) when the Vertex IV
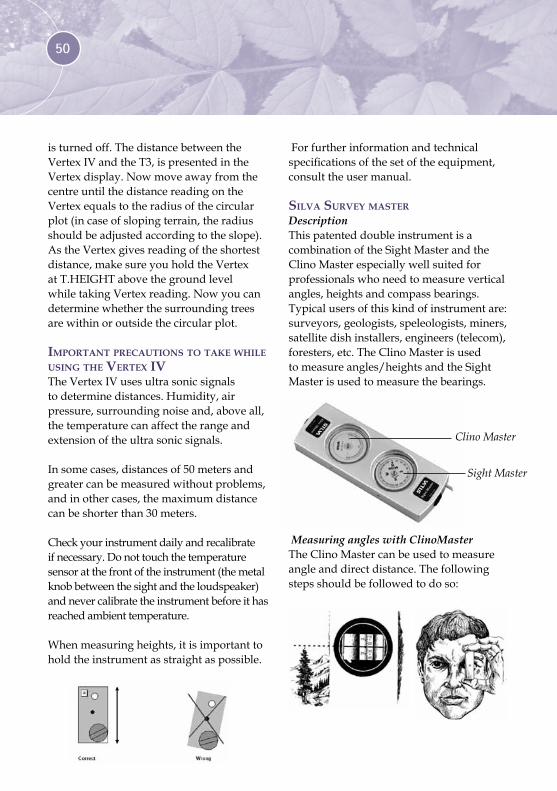
50
is turned off. The distance between the Vertex IV and the T3, is presented in the Vertex display. Now move away from the centre until the distance reading on the Vertex equals to the radius of the circular plot (in case of sloping terrain, the radius should be adjusted according to the slope). As the Vertex gives reading of the shortest distance, make sure you hold the Vertex at T.HEIGHT above the ground level while taking Vertex reading. Now you can determine whether the surrounding trees are within or outside the circular plot.
important preCautionS to take While uSing the vertex ivThe Vertex IV uses ultra sonic signals to determine distances. Humidity, air pressure, surrounding noise and, above all, the temperature can affect the range and extension of the ultra sonic signals.
In some cases, distances of 50 meters and greater can be measured without problems, and in other cases, the maximum distance can be shorter than 30 meters.
Check your instrument daily and recalibrate if necessary. Do not touch the temperature sensor at the front of the instrument (the metal knob between the sight and the loudspeaker) and never calibrate the instrument before it has reached ambient temperature.
When measuring heights, it is important to hold the instrument as straight as possible.
For further information and technical specifications of the set of the equipment, consult the user manual.
Silva Survey maSterDescriptionThis patented double instrument is a combination of the Sight Master and the Clino Master especially well suited for professionals who need to measure vertical angles, heights and compass bearings. Typical users of this kind of instrument are: surveyors, geologists, speleologists, miners, satellite dish installers, engineers (telecom), foresters, etc. The Clino Master is used to measure angles/heights and the Sight Master is used to measure the bearings.
Clino Master
Sight Master
Measuring angles with ClinoMasterThe Clino Master can be used to measure angle and direct distance. The following steps should be followed to do so:

Participatory Inventory of Non-timber
Forest Products
51
Place yourself at a suitable distance from the object, if possible a distance equal to the height of tree.
Hold the Clino Master vertically close to one of your eyes. Because of the optical illusion, the index line will appear to “stand out” from the Clino Master housing making it easy to accurately read the correct angle.
Sight with both eyes towards the top of the tree.
Read the angle at the index line on the left side scale. The angle is given in degrees on the left side and percentage on the right side. For example 15o and XX%
A similar process can be repeated when measuring the angle at the base of the tree.
Measuring the bearing using Sight Master
Sight with both eyes towards the object. See fig. A
You read the bearing through the compass sighting system at the same time you sight above the instrument towards the object. The index line will appear to “stand up” from the compass housing making it easy to accurately read the correct bearing towards the object (See Fig. B).
The bigger scale gives the bearing from your position to the object and the smaller one the reverse bearing from the object to your position. Reverse bearings are essential in accurate positioning tasks, particularly at sea.
thingS to be ConSidered While uSing Survey maSterThe compass should be used as far as possible from iron and steel objects, such as engines, electrical equipment, knives, tooling, etc. because they can cause magnetic interference and direction errors. Even wrist watches and steel-framed spectacles may cause deviation in the bearings.
denSiometerDescriptionSpherical densiometer is common yet simple instrument for measuring forest overstory density or canopy cover (Figure 11). The instrument has reflective spherical surface divided into 16 equispaced square grids. When the instrument is taken under forest canopy, the images of overhead crown can be seen in mirror and the amount of canopy coverage is estimated based on proportion of the mirror surface reflecting the overstory crown.
The Sight Master can be used in the following way to measure the bearing which is required when establishing reference points:
Hold the compass horizontally in front of you, close to one of your eyes.

52
FIGURE 13 SPhERICAL DENSITOmETER
eStimating Canopy Cover uSing denSiometerAlthough it is ideal to take canopy cover measurements in each sample plot, but depending on resources availability canopy measurements can be taken in skipped in several plots. However, the plots where canopy measurements are taken should be allocated in proportion to the area of different strata. Prior to taking the canopy cover measurements, all trees should be already tagged, and diameter at breast height (dbh) measured. This measurement procedure can be efficiently handled by one person using the following procedure.
Keep the densiometer instrument leveled (indicated by the round level in the lower right-hand corner). Hold the densitometer far enough away from your body so that your head is just outside the grid (30-45 cm away). Maintain the densiometer approximately at elbow height.
There are a total of 24, 3 mm x 3 mm squares in the grid. Each square represents an area of canopy opening (sky image or unfilled squares) or canopy cover (vegetation image or filled squares). Count the number of canopy opening squares. If there are squares that are only partially filled, these can be added to make a complete square.
Note down the total number of squares that are filled on the sampling sheet.
An average of four measurements for plots with non-uniform canopy cover or one measurement for plot with uniform canopy cover should be used for that plot.
For deciduous trees in late fall to winter, when trees have no leaves, the crown area needs to be visualized for a proper reading. Only squares that are completely free of branches should be counted as sky.
Take four measurement from plot center but facing North, East, South and West (Figure 12) and record the average.
Average number of sky squares and canopy squares can be calculated during data analysis phase.
If spherical densiometer is not available, a densiometer can be made using local resources. When resource permits, hemispherical photos using a digital camera with a fish eye lens such as FC E8, can be taken during field inventory. The digital image, then can be analyzed using Gap Light Analyzer (GLA) (http://www.ecostudies.org/gla/), a image analysis program, to estimate the canopy cover (Frazer et al. 1999).
FIGURE 14 POSITION TO TAKE DENSITOmETER mEASUREmENTS

Some Relevant Publications from ANSAB
• ANSAB and FAO. 2009. Challenges and Opportunities for Nepal’s Small and Medium Forest Enterprises.
• Subedi, B. P. 2006. Linking Plant-Based Enterprises and Local Communities to Biodiversity Conservation in Nepal Himalaya. ANSAB. Adroit Publishers, New Delhi.
• ANSAB and FECOFUN. 2005. Forest Certification in Nepal (In Nepali). Kathmandu
• ANSAB and SNV/Nepal. 2003. Commercially Important Non Timber Forest Products (NTFPs) of Nepal (In Nepali). Kathmandu.
• ANSAB. 2003. Forest Products Based Enterprise Development. Field Manual (In Nepali). Kathmandu.
• Subedi, B. P., Binayee, S.B., Ojha, H.R. and Nicholson, K. 2002. Community Based Enterprises in Nepal: Case Studies, Lessons and Implications. ANSAB and SNV/Nepal, Kathmandu.
• ANSAB, EWW and IRG. 2006. Role of Natural Products in Resource Management, Poverty Alleviation, and Good Governance: A Case Study of Jatamansi and Wintergreen Value Chains in Nepal.
• ANSAB. 1999. Monitoring the Effects of Community Based Conservation and Commercial Utilization of Natural Products in Humla, Nepal.
• ANSAB. 1999. Socio-Economic and Institutional Impacts of Community Based Ecosystem Management Project in Humla, Nepal.
• Video Documentaries on - Forest Certification - Steps Towards Sustainability (English and
Nepali)- 30 Minutes- In Search of Yarshagumba (English and Nepali)- 29 Minutes- Community Enterprises (In Nepali)- 29 Minutes

Asia Network for Sustainable Agriculture and Bioresources (ANSAB)
P.O. Box 11035Kathmandu, Nepal
Tel: (977-01)-4497547 or 4478412Fax: (977-01)-4476586
E-mail: [email protected] Website: www.ansab.org
The Asia Network for Sustainable Agriculture and Bioresources
(ANSAB) is a civil society organization that has been
conserving biodiversity and improving livelihoods across
South Asia for almost twenty years. It places community
empowerment and economic incentives at the heart of its
approach, believing that as people benefit from natural
resources they become more motivated to conserve them
– and vice-versa. ANSAB implements a variety of innovative
solutions in line with this core conviction, such as the
creation of enterprises based on the sustainable use of
natural resources, especially Non Timber Forest Products
(NTFPs), and the establishment of payment-schemes for
environmental services, especially for Reducing Emissions
from Deforestation and Forest Degradation (REDD) plus.
It has notably pioneered the Forest Stewardship Council
(FSC) certification in Nepal and introduced the concept of
subgroup in community forestry to ensure that ultra-poor and
marginalized people benefit from the natural resources of
their communities. ANSAB is also deeply involved in climate
change mitigation and adaptation as the issue continues
to threaten the environmental and economic progresses
achieved so far – in Nepal as in the rest of the world.
Visit www.ansab.org ton Read our detailed capability
statementn Watch short documentaries
about our workn Consult more than 50
publicationsn Subscribe to our newsletter,
price list & more
ISBN:978-99933-796-8-3