participatory decision-making indicators - · pdf filetable of content 1 an innovative ... 4...
TRANSCRIPT

Decision-making IndicatorsUNCHS (Habitat) 09-99
Participatory Decision-MakingIndicators
Measuring progress on improvingurban management decision-making processes
Guidelines for Istanbul+5

Decision Making IndicatorsUNCHS (Habitat) 09-99
2
The international community is committed to use indicators for monitoring theimplementation of the Habitat Agenda:
"All partners of the Habitat Agenda, including local authorities, the private sector andcommunities, should regularly MONITOR and EVALUATE their own performances in theimplementation of the Habitat Agenda through comparable human settlements and shelterindicators..."(paragraph 240 of the Habitat Agenda)

Decision-making IndicatorsUNCHS (Habitat) 09-99
3
This document is the result of the work of a Habitat interdivisional team. It brings togetheroperational experience from almost all Habitat Programmes and Sections.
TABLE OF CONTENT
1 AN INNOVATIVE APPROACH TO MONITORING CITY PERFORMANCE 4
1.1 Measuring progress on improving urban management decision-making processes 4
1.2 Basic assumptions on good decision-making processes 4
1.3 The benefits of measuring progress in participatory decision-making 4
2 THE DECISION-MAKING PROCESS 5
2.1 A simple process 5
2.2 The ingredients for successful decision-making 5
3 DEFINING PARTICIPATORY DECISION-MAKING INDICATORS 6
4 APPLYING PARTICIPATORY DECISION-MAKING INDICATORS 7
4.1 Reporting level and reference years 7
4.2 How should data be collected? 7
4.3 Description of the reporting sheets and index 7
5 THE EXAMPLE OF Z-CITY 8
5.1 The process of applying indicators in Z-City 8
5.2 Analysis of the results in Z-City 8
6 ANNEXE 11
Indicator 1: Monitoring information and assessment activities 12
Indicator 2: Monitoring strategy and action planning 14
Indicator 3: Monitoring implementation 16
Indicator 4: Monitoring institutionalisation 18
Decision Making IndicatorsUNCHS (Habitat) 09-99
4
1 AN INNOVATIVE APPROACH TO MONITORING CITY PERFORMANCE
1.1 Measuring progress on improving urban management decision-making processesDecision-making is usually based on a series of qualitative and quantitative data related to physicalconditions and trends. Cities invest a great deal of time and resources in the collection ofinformation to produce such assessments. However, very little is known about how decisions aremade and the processes that lead to them.
The aim of this document is to introduce a simple methodology for the assessment and monitoringover time of improvements in decision-making processes.
1.2 Basic assumptions on good decision-making processesLessons learnt from successful decision-making in cities imply that, in order to stand a good chanceof success, decision-making processes have to be participatory. This has been recognised by theinternational community in conferences such as the Earth Summit in Rio and the Habitat IIConference in Istanbul.
City experiences show that participation enhances:! Transparency because information, priorities, strategies, actions are open to all stakeholders in
the city;! Accountability because by sharing in decisions, partners are accountable to each other vis-à-
vis the tasks they have committed themselves to;! Equity because the groups which are usually excluded from the decision-making process have
the opportunity to present their concerns and defend their interests;! Efficiency, because information is shared and decisions are taken in common, avoiding overlap
and duplication of efforts. Actions are complementary and mutually supportive.
Ultimately participation in decision-making guarantees sustainable implementation. It allows themobilisation of local resources, divergent interests are reconciled and consensus among allstakeholders is secured on how to tackle priority issues. Taking all these reasons into account, it isclear that participation is a key element of good governance.
1.3 The benefits of measuring progress in participatory decision-makingKnowing how decision-making processes are working:! Ensures that the right people are involved, by assessing who is participating, in which activities
and what their concerns and contributions are. It also allows the assessment of their level ofparticipation and its evolution over time.
! Identifies and addresses weaknesses in the decision-making process. It allows urbanmanagers to assess which activities are being poorly conducted. Thus they can take correctiveaction.
! Provides early warning on the outcome of the process. Most urban managers cannot wait 10years to see if the outcome of the process is successful. Monitoring the process allows them toestimate the likelihood that it will be.
! Allows the documentation of progress in participatory processes, which support themobilisation of resources and attracts investments. It makes the process more credible byshowing those who have the means to do something that their interests and concerns will betaken into account and that their resources will be applied in a highly efficient environment.
Decision-making IndicatorsUNCHS (Habitat) 09-99
5
2 THE DECISION-MAKING PROCESS
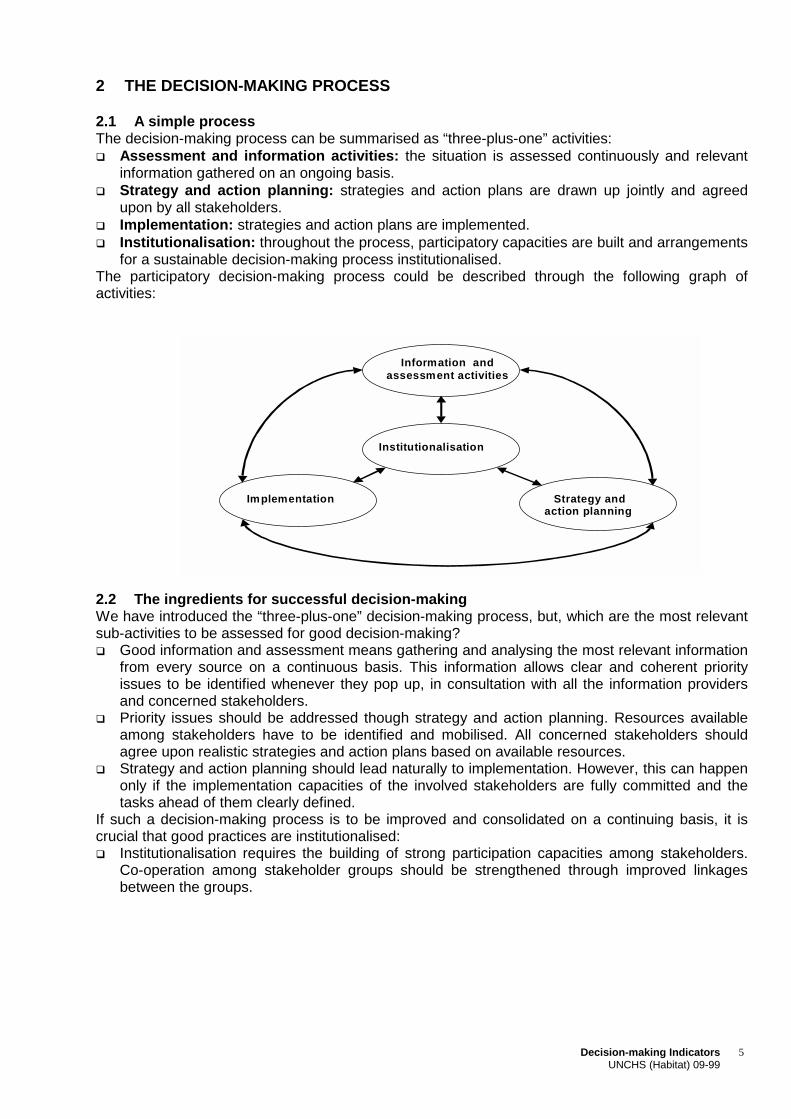
2.1 A simple processThe decision-making process can be summarised as “three-plus-one” activities:! Assessment and information activities: the situation is assessed continuously and relevant
information gathered on an ongoing basis.! Strategy and action planning: strategies and action plans are drawn up jointly and agreed
upon by all stakeholders.! Implementation: strategies and action plans are implemented.! Institutionalisation: throughout the process, participatory capacities are built and arrangements
for a sustainable decision-making process institutionalised.The participatory decision-making process could be described through the following graph ofactivities:
Information andassessment activities
Strategy andaction planning
Implementation
Institutionalisation
2.2 The ingredients for successful decision-makingWe have introduced the “three-plus-one” decision-making process, but, which are the most relevantsub-activities to be assessed for good decision-making?! Good information and assessment means gathering and analysing the most relevant information
from every source on a continuous basis. This information allows clear and coherent priorityissues to be identified whenever they pop up, in consultation with all the information providersand concerned stakeholders.
! Priority issues should be addressed though strategy and action planning. Resources availableamong stakeholders have to be identified and mobilised. All concerned stakeholders shouldagree upon realistic strategies and action plans based on available resources.
! Strategy and action planning should lead naturally to implementation. However, this can happenonly if the implementation capacities of the involved stakeholders are fully committed and thetasks ahead of them clearly defined.
If such a decision-making process is to be improved and consolidated on a continuing basis, it iscrucial that good practices are institutionalised:! Institutionalisation requires the building of strong participation capacities among stakeholders.
Co-operation among stakeholder groups should be strengthened through improved linkagesbetween the groups.
Decision Making IndicatorsUNCHS (Habitat) 09-99
6
3 DEFINING PARTICIPATORY DECISION-MAKING INDICATORS
The indicators have been designed to assess participation in the decision-making process. Tomeasure the level of participation, the best approach is to examine the roles of the variousstakeholders in each of the process activities. The roles of stakeholders can be:! direct and substantive (contributing information, ideas and financial resources and deploying
implementation instruments and capacities)! supportive and technical (research, information analysis and technical advise), and promotional
(lobbying, advocating and campaigning)Each actor will also assess the gender responsiveness of his or her participation in the variousactivities. Contrary to many other indicator approaches, these decision-making indicators are not meant to beused for the international comparison of city performance. Decision-making indicators are onlymeant to be a tool for monitoring progress over time. Evolution is more important than absoluteresults. Comparison between cities or projects can only be made on the progress, not on theratings given by the community of stakeholders.

Decision-making IndicatorsUNCHS (Habitat) 09-99
7
4 APPLYING PARTICIPATORY DECISION-MAKING INDICATORS 4.1 Reporting level and reference years In the context of reporting progress for the Istanbul+5 Conference, the decision-making indicatorsare to be applied at the city level. As described in the general reporting guidelines for Istanbul+5,each country should provide indicators for at least one major city. However it is recommended thatcountries report on more than one city in order to provide a more complete picture of the urbansituation in the country. Indicators have to be provided for the following dates:! 1995, one year prior to the Habitat II Conference (Istanbul)! 2000, one year prior to Istanbul+5Reporting on these years provides a five-year assessment of progress since the Habitat IIConference. 4.2 How should data be collected? Participatory decision-making indicators are not based on statistics or raw data. They are based ona rating, given by the stakeholder groups to themselves. Rating scales are provided for eachindicator. The ratings range from 0 (totally negative appraisal) to 3 (totally positive appraisal). Each stakeholder group should rate its own performance according to the proposed scale. It isimportant to rate performance for both reference years so that progress can be assessed. Therating process should be participatory, and the final rating must be a consensus. Consistency andconsensus are as important as objectivity. However, in order to be as accurate as possible, it isdesirable that as many stakeholders as possible in the same group decide collectively on the scoresto be given. The more sub-indicators the city monitors, the better. However, if one indicator is locallyproblematic, it can be decided through consensus not to deal with it. At the city level a local committee should be set up and composed of local stakeholder grouprepresentatives. Typically the following groups of actors should be represented:! National Government (Ministries, government agencies…)! Local authorities (Municipal departments, Municipal Water Board…)! NGO’s (Environmental movements, poverty alleviation associations…)! CBO’s (Women’s groups, residents associations…)! Private sector (Private companies, Chamber of Commerce…)! Academic and scientific community (Universities, training institutions…)! Others This local committee will gather the data, settle any possible disagreements, reach a consensus andcomplete the definitive Reporting Forms.
4.3 Description of the reporting sheets and index! There are 4 indicators (one for each activity of the decision-making process). As the different
activities are divided into 3 sub-activities, each indicator is composed of 3 sub-indicators.! For each indicator, a reporting sheet is provided. Each sheet contains 2 reporting tables, one for
1995 and one for 2000, and details of how stakeholders should rate each sub-activity.! Each indicator has a result representing an average of all stakeholders’ ratings. A bar chart
presents the progress made between 1995 and 2000. This is shown first according to thestakeholders and second according to the sub-activity.
! Finally a web-graph summarises the results in an index. Boxes are provided for adding anarrative commenting on the results

Decision Making IndicatorsUNCHS (Habitat) 09-99
8
5 THE EXAMPLE OF Z-CITY 5.1 The process of applying indicators in Z-City Z-City is strongly committed to the implementation of the Habitat Agenda. It has been requested bythe Habitat II National Committee to report on the progress made during the last five years. The citynot only wants to report on physical urban conditions and trends, but also on how the urbanmanagement and decision-making processes have improved over the last five years. Local partnersand especially the municipality are interested in checking if the participatory approaches todecision-making have improved. The city is committed to a long-term project for the improvement of partnerships. Its partners are ina variety of sectors in the metropolitan area (private sector, community sector, other levels of thepublic sector). Over the last 8 years, the management approach has changed dramatically tobecome more broad-based and participatory. However, as tangible effects are not yet perceptible,the city is willing to assess these “management reforms”, and their potential results. Decision-makers from all sectors involved in the reforms are asking themselves questions such as:! Did we follow the right process for decision-making? Did we enhance participation throughout
the process? What is the progress so far?! Were the various activities of the process conducted adequately? Which activities are weak?! Did we involve the relevant stakeholders, and do they provide expertise, information, and
resources as much as they can? Did we secure strong commitment for implementation from awide range of stakeholders?
! Did we manage to build strong consensus on priorities to be addressed and on strategies to beimplemented?
A committee made up of representatives from all the stakeholder groups involved in Z-Cityurban management is created. During an introductory meeting, the purpose of the exercise isexplained. Assessment criteria are refined to fit with local circumstances. For various reasons,stakeholder group representatives do not feel comfortable with some sub-indicators. Throughconsensus it is decided not to deal with them.
Sub-meetings are organised for each stakeholder group. During these sub-meetings,stakeholder participation in the various stages of the decision-making process and itsinstitutionalisation is discussed. Ratings are decided through consensus. The ratings are reportedto the committee, which fills the 4 reporting sheets accordingly and agree on explanatory text to bepresented with the results.
The results of the exercise are sent to the Habitat II National Committee. These results arealso made public by being posted in the City Hall. Further, they are presented in the municipalbulletin and the Z-City brochure. Local media use the results to make analyses of the improvementof participation in municipal management and decision-making. Lessons learned are used tocorrect and improve the decision-making process where necessary.
5.2 Analysis of the results in Z-City
Analysis of a specific group of actors (Academic and scientific community – page 9)During the assessment activities, in 1995, the university, who maintains an extremely relevantGeographic Information System (GIS), was not involved. The university, which became involvedonly in 1998, decides to give the 1995 indicator 1a “Variety of Sources of Information” a rating of 0.However, from 1998, the GIS has contributed fully to assessment and information collection and theuniversity decides to rate the indicator 1a for the year 2000 as 3. The involvement of the universitywas of great influence, because up until 1998 the city was unable to spatially organise theinformation collected or to produce substantive maps to support decisions.

Decision-making IndicatorsUNCHS (Habitat) 09-99
9
Analysis of a specific group of actors (National Government – page 9)Due to general election in the country in 1999, national government has changed. This has alsobrought changes in representation of ministries at the regional level. Representatives of theministries have not yet been briefed on the initiatives undertaken by Z-City and are not fully involvedin Z-City planning and management activities. An effort will be required to brief and re-mobilise thisgroup of actors. Analysis of a sub indicator (Consensus on priorities – page 9)Some stakeholders gave a poor rating to indicator 1.b “Consensus on priorities” for 1995, becausethey did not feel concerned by the priorities chosen. However for 2000 the same stakeholdersgenerally give this sub-indicator quite a high rating. This is due to the shift in priorities on the part ofthe municipality and reflects the tremendous widening of the information base since 1995 which hasmeant that the priority concerns of stakeholders are now identified much more effectively. Analysis of the indexLooking at the web graph a number of points are very clear. For example, information activitieswere already quite well performed in 1995. These activities have improved slightly, due to the factthat the priorities being tackled correspond better to stakeholders’ concerns. It appears that
important progress has been made regarding theinstitutionalisation of the process. The organisation ofcapacity building activities has been of benefit to thewhole process. Specifically, stakeholders’ capacity toparticipate in consensus building around strategieshas improved tremendously. This is reflected in verygood progress in Strategy and action planning.Despite this, implementation activities are still weak.This is due to the fact that stakeholders’ mentalityhas not yet fully changed and some of them are stillreluctant to commit their resources forimplementation.
Participatory decision-making Index
0
1
2
Assessment and InformationActivities
Strategy and Action Planning
Implementation
Institutionalization
Habitat II
Istanbul +5
3

Decision Making IndicatorsUNCHS (Habitat) 09-99
10
6
���������������������������������������������������������������������������������������������������������������������������������������������������������������������������������������������������������������������������������������������������������������������������������������������������������������������������������������������������������������������������������������������������������������������������������������������������������������������������
���������������������������������������������������������������������������������������������������������������������������������������������������������������������������������������������������������������������������������������������������������������������������������������������������������������������������������������������������������������������������������������������������������������������������������������������������������
REPORTING SHEET: Please, fill colored cells Z-CITY EXAMPLEIndicator 1: Information and assessment activities
1995 2000Information and assessment activities Information and assessment activities
Actors a. v
arie
ty o
f sou
rces
of
info
rmat
ion
b. c
onse
nsus
on
prio
ritie
s
c. g
ende
red
asse
ssm
ent
Tota
l by
acto
r
Actors a. v
arie
ty o
f sou
rces
of
info
rmat
ion
b. c
onse
nsus
on
prio
ritie
s
c. g
ende
red
asse
ssm
ent
Tota
l by
acto
r
1 National Government 2 3 1 2.00 1 National Government 1 1 0 0.672 Local authorities 3 3 2 2.67 2 Local authorities 3 3 1 2.333 NGO's 1 1 3 1.67 3 NGO's 2 2 3 2.334 CBO's 2 0 2 1.33 4 CBO's 3 2 2 2.335 Private sector 1 2 1 1.33 5 Private sector 2 2 0 1.336 Academics and scientists 0 2 2 1.33 6 Academics and scientists 3 3 3 3.007 Other 1 1 2 1.33 7 Other 2 2 1 1.67
Total 1.43 1.71 1.86 1.67 Total 2.29 2.14 1.43 1.9531
Results: based on your inputs above
Progress by stakeholders
Actors 1995
2000
Prog
ress
1 National Government 2.00 0.67 -1.332 Local authorities 2.67 2.33 -0.333 NGO's 1.67 2.33 0.674 CBO's 1.33 2.33 1.005 Private sector 1.33 1.33 0.006 Academics and scientists 1.33 3.00 1.677 Other 1.33 1.67 0.33
Total assessment 1.67 1.95 0.29
Progress by activities
Actors a. v
arie
ty o
f sou
rces
of
info
rmat
ion
b. c
onse
nsus
on
prio
ritie
s
c. g
ende
red
asse
ssm
ent
Tota
l ass
essm
ent
1995 1.43 1.71 1.86 1.672000 2.29 2.14 1.43 1.95PROGRESS 0.86 0.43 -0.43 0.29
0.00
0.50
1.00
1.50
2.00
2.50
3.00
a. variety of sources ofinformation
b. consensus onpriorities
c. genderedassessment
Total assessment
19952000
0.00
0.50
1.00
1.50
2.00
2.50
3.00
1 2 3 4 5 6 7
1995
2000
Consensus on priorities.Within the stakeholder group:(0) for all the actors the priorities are not important(1) for a few actors the priorities are quite important(2) for some actors the priorities are very important(3) for all actors the priorities are very important
Gendered assessment.Within the stakeholder group:(0) women are not involved at all(1) are involved but no disaggregated information is collected(2) women and men are equally involved AND separateinformation is collected(3) same, and women's and men's priorities are also equallyreflected in final assessment
Information and assessment activities.Within the stakeholder group:(0) no information is provided(1) few actors provide little information(2) some actors provide relevant information(3) a lot of relevant information is provided bymany actors

Decision-making IndicatorsUNCHS (Habitat) 09-99
11
ANNEXE
Indicator 1Reporting sheet and explanatory notes for “Information and assessmentactivities”
Indicator 2Reporting sheet and explanatory notes for “Strategy and action planning”
Indicator 3Reporting sheet and explanatory notes for “Implementation”
Indicator 4Reporting sheet and explanatory notes for “Institutionalisation”
Index of participatory urban decision-making and explanatory comments onthe results

Decision Making IndicatorsUNCHS (Habitat) 09-99
12
DEFINITION
Indicator 1: Monitoring information and assessment activitiesDefinition: the quality of information and assessment activities is measured through the variety of sources of informationused and the level of consensus on priorities. The level of gender sensitivity is also assessed.
Indicator 1.a: Variety of sources of informationIn order for information regarding development issues in acity to be useful for strategic planning and decisionmaking, the information must be relevant. Cities find,however, that the more diverse the kind of stakeholdersproviding the information, the more relevant and useful theinformation base becomes. Diversity of stakeholder allowsthe inclusion of types of information and perspectives thatare not usually taken into consideration. This provided abalanced and comprehensive view of the issues affectingthe city. Monitoring the variety of sources of informationmeans you can assess the quality of the information baseon which decision-making is grounded.
How to rate?You should evaluate the variety of sources of informationby considering the extent of the contribution of the variousstakeholders to your information base! They provide you with documents, reports, or maps...! They prepare specific studies! They are interviewed or participate in discussions and
records of their inputs are incorporated into yourinformation base
Stakeholders’ contributions can be incorporated in theinformation overview in different formats:! Geographic Information Systems (GIS)! Environmental Profile! City diagnosis or Audit! City Profile
Indicator 1.b: Identification of prioritiesThe indicator measures progress in achieving agreementon which priorities are to be addressed. It allows cities tomeasure the extent to which there is a consensus amongstakeholders on the selected priority issues. It makes theassumption that any strategy or implementation of policyrelating to the selected priorities can only be successful if ithas been reached through a consensus. This consensuscan be described as a situation in which selected prioritiesare recognised by a large number of stakeholders asimportant issues which should be addressed first. Bymeasuring stakeholder agreement on selected priorities,cities can infer the degree of likelihood that stakeholderswill become involved in formulating strategies andtranslating them into action.
How to rate?
Stakeholders may feel that some problems are morerelevant to them than others. Cities can estimate this byusing the criteria below:! The stakeholder feels directly concerned by the
problem! The stakeholder feels a responsibility to participate in
the solution of problems faced by the community! The stakeholder recognises the importance of the
problem for the community, although not directlyaffected by it
A way of estimating the consensus surrounding theselected priorities would be to ask each stakeholderseparately to rank the list of priorities, according to theirown particular concerns. If their own ranking agreesclosely with the selected list, a strong consensus has beenachieved. A lack of consensus may indicate, for example,that the selection of criteria for prioritising issues did notinvolve all the stakeholders, or that the criteria were notrelevant to their situation.
Indicator 1.c: GenderThis indicator measures the inclusiveness of theassessment. It measures the extent to which informationcovers what both women and men do, what their prioritiesare, and whether these are reflected in the prioritiesselected.
How to rate?The gender sensitivity of the assessment and informationactivities is estimated through the following criteria:! Cities can estimate whether women are not involved
at all (0)! Are involved but no disaggregated information is
collected (1)! Women and men are equally involved, and separate
information is collected (2)! Same, and women's and men's priorities are also
equally reflected in final assessment (3)

Decision-making IndicatorsUNCHS (Habitat) 09-99
13
���������������������������������������������������������������������������������������������������������������������������������������������������������������������������������������������������������������������������������������������������������������������������������������������������������������������������������������������������������������������������������������������������������������������������������������������������������������������������
���������������������������������������������������������������������������������������������������������������������������������������������������������������������������������������������������������������������������������������������������������������������������������������������������������������������������������������������������������������������������������������������������������������������������������������������������������
REPORTING SHEET: Please, fill colored cells
Indicator 1: Information and assessment activities1995 2000
Information and assessment activities Information and assessment activities
Actors a. v
arie
ty o
f sou
rces
of
info
rmat
ion
b. c
onse
nsus
on
prio
ritie
s
c. g
ende
red
asse
ssm
ent
Tota
l by
acto
r
Actors a. v
arie
ty o
f sou
rces
of
info
rmat
ion
b. c
onse
nsus
on
prio
ritie
s
c. g
ende
red
asse
ssm
ent
Tota
l by
acto
r
1 National Government 2 3 1 2.00 1 National Government 1 1 0 0.672 Local authorities 3 3 2 2.67 2 Local authorities 3 3 1 2.333 NGO's 1 1 3 1.67 3 NGO's 2 2 3 2.334 CBO's 2 0 2 1.33 4 CBO's 3 2 2 2.335 Private sector 1 2 1 1.33 5 Private sector 2 2 0 1.336 Academics and scientists 0 2 2 1.33 6 Academics and scientists 3 3 3 3.007 Other 1 1 2 1.33 7 Other 2 2 1 1.67
Total 1.43 1.71 1.86 1.67 Total 2.29 2.14 1.43 1.9531
Results: based on your inputs above
Progress by stakeholders
Actors 1995
2000
Prog
ress
1 National Government 2.00 0.67 -1.332 Local authorities 2.67 2.33 -0.333 NGO's 1.67 2.33 0.674 CBO's 1.33 2.33 1.005 Private sector 1.33 1.33 0.006 Academics and scientists 1.33 3.00 1.677 Other 1.33 1.67 0.33
Total assessment 1.67 1.95 0.29
Progress by activities
Actors a. v
arie
ty o
f sou
rces
of
info
rmat
ion
b. c
onse
nsus
on
prio
ritie
s
c. g
ende
red
asse
ssm
ent
Tota
l ass
essm
ent
1995 1.43 1.71 1.86 1.672000 2.29 2.14 1.43 1.95PROGRESS 0.86 0.43 -0.43 0.29
0.00
0.50
1.00
1.50
2.00
2.50
3.00
a. variety of sources ofinformation
b. consensus onpriorities
c. genderedassessment
Total assessment
19952000
0.00
0.50
1.00
1.50
2.00
2.50
3.00
1 2 3 4 5 6 7
1995
2000
Consensus on priorities.Within the stakeholder group:(0) for all the actors the priorities are not important(1) for a few actors the priorities are quite important(2) for some actors the priorities are very important(3) for all actors the priorities are very important
Gendered assessment.Within the stakeholder group:(0) women are not involved at all(1) are involved but no disaggregated information is collected(2) women and men are equally involved AND separateinformation is collected(3) same, and women's and men's priorities are also equallyreflected in final assessment
Information and assessment activities.Within the stakeholder group:(0) no information is provided(1) few actors provide little information(2) some actors provide relevant information(3) a lot of relevant information is provided bymany actors
Decision Making IndicatorsUNCHS (Habitat) 09-99
14
DEFINITION
Indicator 2: Monitoring strategy and action planningDefinition: the quality of strategies will be measured through the consideration of resources available and consensus onstrategy. The equal involvement of men and women is important.
Indicator 2.a: consideration of available resourcesThis indicator will help cities monitor the extent to whichavailable resources from stakeholders have been takeninto account when drawing up strategies. It is assumedthat resources exist locally, in the hands of the variousstakeholders. As it is recognised that resources arescarce, it is important to make the most out of whatever isavailable. This indicator allows cities to monitor whetherthe full range of resources has been considered. It is alsoassumed that successful and implementable strategies arebacked up by firm commitments of resources fromstakeholders. Unless they are aware of their resources,stakeholders are unable to make realistic commitments.This indicator will help cities to understand the adequacyof the resource assessment that has taken place. Ittherefore also provides a means of gauging the suitabilityof prioritised strategies according to their feasibility.
How to rate?Evaluate to which extent resources have been consideredby asking yourself how implementation capacities havebeen taken into account:List the implementation capacities available to eachstakeholder: financial, economic, technical, administrative,physical, political, etc. Now evaluate to what extent thesewere considered in relation to each stakeholder group:! Did you consider all available implementation means?! Did you consider the constraints or difficulties that
may be faced by a stakeholder when implementing aparticular strategy?
! Did you consider how resource needs are likely toevolve and be met throughout the life of the project,including for operation and maintenance?
! Have you considered contingency options andresources in the strategy?
! Have you considered alternative implementationoptions and resources available to each stakeholderwhere conventional means are not available?
! Have you used any techniques, such as social cost-benefit analysis, to help stakeholders to analyse theresource needs of a strategy and understand theirown implementation capacities?
Indicator 2.b: consensus on strategiesStakeholders possess most of the capacities forimplementation of projects, so if they feel that strategies donot meet their needs or that they are unhappy with theapproach being taken, it is unlikely that they will contributeto moving the project forward. This will jeopardise thechances of the strategy being implemented successfully.Measuring the level of support for objectives andstrategies is the most direct way to monitor the extent ofthe consensus surrounding them. In addition, meaningfulinvolvement of stakeholders in the decision-makingprocess, and good group dynamics, showing thatstakeholders understand each other, also indicatemovement towards consensus. These elements of astrong consensus will manifest themselves as support forthe chosen objectives and strategies.
How to rate?To measure the extent of the consensus amongstakeholders, answer some of the questions below. Eachparticular stakeholder may agree with different elements ofthe strategy:! Do stakeholders agree with the objectives to be
reached?! Do they agree with the method of achieving the
objectives as set out in the strategy?Where strategies are still being negotiated, cities canmeasure support for the strategy negotiations and indicatethat stakeholders are moving towards a consensus byasking:! Do stakeholders exhibit good group dynamics and
show understanding of each other’s positions?! Are stakeholders familiar with the issues?
Indicator 2.c: genderWomen’s resources and capacities are oftenunderestimated and may also not be included in decision-making at all levels. This indicator measures whetherwomen’s as well as men’s resources are considered andwhether women’s as well as men’s priorities are central tothe strategy.
How to rate?The gender sensitivity of the strategy and action planningcan be estimated through the following criteria. Cities canestimate whether women's resources are:! Not considered at all and women's view's are not
separately heard (0)! Women's resources are considered, their views are
not separately heard (1)! Women's resources and views are considered but do
not influence the selected strategy (2)! Women's resources and views are central to the
selected strategy (3)
Decision-making IndicatorsUNCHS (Habitat) 09-99
15
������������������������������������������������������������������������������������������������������������������������������������������������������������������������������������������������������������������������������������������������������������������������������������������������������������������������������������������������������������������������������������������������������������������������
��������������������������������������������������������������������������������������������������������������������������������������������������������������������������������������������������������������������������������������������������������������������������������������������������������������������������������������������������������������������������������������������������������
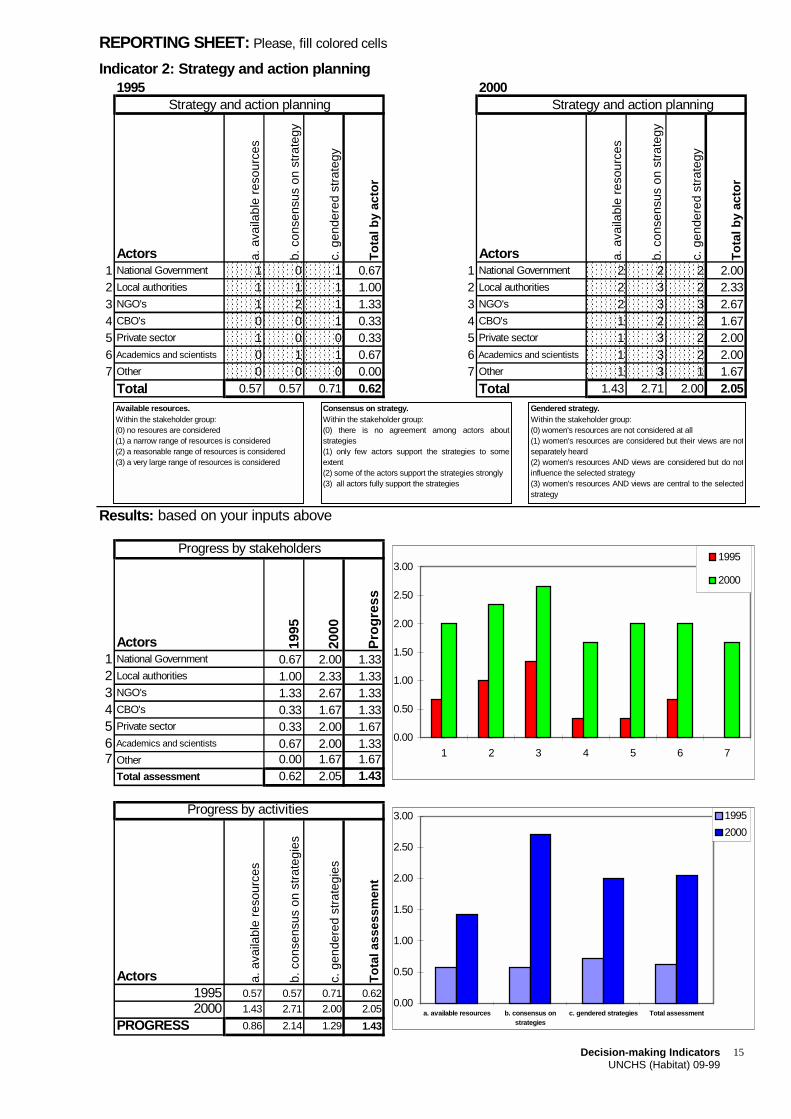
REPORTING SHEET: Please, fill colored cells
Indicator 2: Strategy and action planning1995 2000
Strategy and action planning Strategy and action planning
Actors a. a
vaila
ble
reso
urce
s
b. c
onse
nsus
on
stra
tegy
c. g
ende
red
stra
tegy
Tota
l by
acto
r
Actors a. a
vaila
ble
reso
urce
s
b. c
onse
nsus
on
stra
tegy
c. g
ende
red
stra
tegy
Tota
l by
acto
r
1 National Government 1 0 1 0.67 1 National Government 2 2 2 2.002 Local authorities 1 1 1 1.00 2 Local authorities 2 3 2 2.333 NGO's 1 2 1 1.33 3 NGO's 2 3 3 2.674 CBO's 0 0 1 0.33 4 CBO's 1 2 2 1.675 Private sector 1 0 0 0.33 5 Private sector 1 3 2 2.006 Academics and scientists 0 1 1 0.67 6 Academics and scientists 1 3 2 2.007 Other 0 0 0 0.00 7 Other 1 3 1 1.67
Total 0.57 0.57 0.71 0.62 Total 1.43 2.71 2.00 2.05
Results: based on your inputs above
Progress by stakeholders
Actors 1995
2000
Prog
ress
1 National Government 0.67 2.00 1.332 Local authorities 1.00 2.33 1.333 NGO's 1.33 2.67 1.334 CBO's 0.33 1.67 1.335 Private sector 0.33 2.00 1.676 Academics and scientists 0.67 2.00 1.337 Other 0.00 1.67 1.67
Total assessment 0.62 2.05 1.43
Progress by activities
Actors a. a
vaila
ble
reso
urce
s
b. c
onse
nsus
on
stra
tegi
es
c. g
ende
red
stra
tegi
es
Tota
l ass
essm
ent
1995 0.57 0.57 0.71 0.622000 1.43 2.71 2.00 2.05
PROGRESS 0.86 2.14 1.29 1.43
0.00
0.50
1.00
1.50
2.00
2.50
3.00
a. available resources b. consensus onstrategies
c. gendered strategies Total assessment
19952000
0.00
0.50
1.00
1.50
2.00
2.50
3.00
1 2 3 4 5 6 7
1995
2000
Consensus on strategy.Within the stakeholder group:(0) there is no agreement among actors aboutstrategies(1) only few actors support the strategies to someextent(2) some of the actors support the strategies strongly(3) all actors fully support the strategies
Gendered strategy.Within the stakeholder group:(0) women's resources are not considered at all (1) women's resources are considered but their views are notseparately heard(2) women's resources AND views are considered but do notinfluence the selected strategy(3) women's resources AND views are central to the selectedstrategy
Available resources.Within the stakeholder group:(0) no resoures are considered(1) a narrow range of resources is considered(2) a reasonable range of resources is considered(3) a very large range of resources is considered

Decision Making IndicatorsUNCHS (Habitat) 09-99
16
DEFINITION
Indicator 3: Monitoring implementationDefinition: the quality of implementation is measured through the strength of action plans, the stakeholders’ commitment,and the extent to which they are gender specific.
Indicator 3.a: capacity to implementImplementation of an action plan requires a strong,detailed stakeholder- or agency-specific agreement.Formulation of such an agreement requires stakeholdersto understand their implementation capacities andresources and to be fully aware of their responsibilitieswhen entering into the agreement. A strong action plan istherefore a contract which virtually guarantees effectiveimplementation. It may be argued that to define an actionplan does not necessarily mean to implement it, andtherefore it would be better to compare the actualimplementation outputs with the commitments laid out inthe action plan. However, we are interested in monitoringthe processes that lead to successful implementation,rather than the outputs themselves, because if the processmoves forward successfully, the outputs should follownaturally. Monitoring implementation itself tells us nothingabout why implementation failed or succeeded, whilemonitoring the strength of the agreement within the actionplan does provide this information. A weak agreement canexplain the failure of implementation of planned actions.
How to rate?A strong action plan should describe each stakeholder'scommitment to the priority action. Does the stakeholder-specific action plan describe:! Allocation of staff time and resources! Amount and deployment of financial resources for
investment / operation / maintenance! Detailed geographic focus! Application of other relevant instruments for
implementation! A common system for monitoring achievement of
objectives and observance of commitments! A well-defined timetable! Contingency plans! Have stakeholders thoroughly reviewed their own
abilities to meet these commitments?! Is the stakeholder-specific agreement supported by
the action plan of another stakeholder?! Have other relevant actors approved the agreement?! Does the action plan meet the city’s needs? Is it
technologically appropriate and financially feasible?! Has the action plan been co-ordinated with the action
plans of other stakeholders?
Indicator 3.b: commitment to implementationThe level of commitment from stakeholders provides adirect indicator to monitor reconfirmation of politicalsupport and mobilisation of resources. The indicatorassumes that stakeholders can provide two kinds ofsupport to implement strategies or action plans -- politicalsupport, and resources (financial, human, technical…).However, stakeholders will not mobilise their resourcesunless they support the strategy politically in some way.This indicator will enable you to monitor the evolution ofstakeholders’ commitment to action plans and strategies.
How to rate?The criteria below allow you to assess the level ofstakeholders commitment to implementation:! Do stakeholders in key institutions lobby for the
strategy to be approved and followed?! Do they regularly attend workshops and meetings
during which decisions are made?! Do they persuade other key figures to adopt the
approach being taken?! Do they provide funding from existing budgets?! Do they make public statements expressing their
support?! Do they provide administrative or technical resources?
Indicator 3.c: genderWomen are sometimes left out of decision making, thusweakening an otherwise strong action plan.Implementation capacity is increased by genderinclusiveness. Cities need to measure whether bothwomen and men are committed to the agreement at alllevels. Also, whether their roles and capacities areseparately defined and clarified in the action plan.
How to rate?The gender sensitivity of the implementation can beestimated through the following criteria. Cities evaluatewhether women are:! Not separately involved in defining capacities and
commitments (0)! Are consulted on capacities or commitments (1)! Are actively involved in decisions but their roles and
responsibilities in the action plan are not clarified (2)! Are actively involved and their roles and
responsibilities are clarified in action plan (3

Decision-making IndicatorsUNCHS (Habitat) 09-99
17
���������������������������������������������������������������������������������������������������������������������������������������������������������������������������������������������������������������������������������������������������������������������������������������������������������������������������������������������������������������������������������������������������������������������������������������������������������������������������
���������������������������������������������������������������������������������������������������������������������������������������������������������������������������������������������������������������������������������������������������������������������������������������������������������������������������������������������������������������������������������������������������������������������������������������������������������
REPORTING SHEET: Please, fill colored cells
Indicator 3: Implementation1995 2000
Implementation Implementation
Actors a. s
treng
th o
f act
ion
plan
sb.
com
mitm
ent t
o
impl
emen
tatio
n
c. g
ende
red
impl
emen
tatio
n
Tota
l by
acto
r
Actors a. s
treng
th o
f act
ion
plan
sb.
com
mitm
ent t
o
impl
emen
tatio
n
c. g
ende
red
impl
emen
tatio
n
Tota
l by
acto
r
1 National Government 1 1 0 0.67 1 National Government 2 0 0 0.672 Local authorities 0 1 0 0.33 2 Local authorities 1 1 1 1.003 NGO's 1 1 1 1.00 3 NGO's 1 1 2 1.334 CBO's 0 0 0 0.00 4 CBO's 1 0 1 0.675 Private sector 0 0 0 0.00 5 Private sector 0 0 0 0.006 Academics and scientists 1 1 0 0.67 6 Academics and scientists 2 1 0 1.007 Other 0 0 0 0.00 7 Other 0 0 0 0.00
Total 0.43 0.57 0.14 0.38 Total 1.00 0.43 0.57 0.67
Results: based on your inputs above
Progress by stakeholders
Actors 1995
2000
Prog
ress
1 National Government 0.67 0.67 0.002 Local authorities 0.33 1.00 0.673 NGO's 1.00 1.33 0.334 CBO's 0.00 0.67 0.675 Private sector 0.00 0.00 0.006 Academics and scientists 0.67 1.00 0.337 Other 0.00 0.00 0.00
Total assessment 0.38 0.67 0.29
Progress by activities
Actors a. s
treng
th o
f act
ion
plan
sb.
com
mitm
ent t
o
impl
emen
tatio
n
c. g
ende
red
impl
emen
tatio
n
Tota
l ass
essm
ent
1995 0.43 0.57 0.14 0.382000 1.00 0.43 0.57 0.67
PROGRESS 0.57 -0.14 0.43 0.29
0.00
0.50
1.00
1.50
2.00
2.50
3.00
a. strength of actionplans
b. commitment toimplementation
c. genderedimplementation
Total assessment
19952000
0.00
0.50
1.00
1.50
2.00
2.50
3.00
1 2 3 4 5 6 7
1995
2000
Commitments to implementation.Within the stakeholder group:(0) actors are not committing resources(1) some actors are committing few resources(2) some actors are committing some resources(3) most actors are committing a lot of resources
Gendered implementation.Within the stakeholder group:(0) women are not separately involved in defining capacitiesand commitments(1) are consulted on capacities or commitments, but notactively involved in decisions (2)are actively involved but their roles and responsabilities inimplementing the action plan are not clarified (3) are actively involved AND their roles and responsibilitiesare clarified in action plan
Strength of action plans.Within the stakeholder group:(0) no actors have a proper action plan(1) some actors have weak action plans(2) some actors have good action plans(3) most actors have very strong action plans

Decision Making IndicatorsUNCHS (Habitat) 09-99
18
DEFINITION
Indicator 4: Monitoring institutionalisationDefinition: the level of institutionalisation depends on the linkages existing among the stakeholders and their capacity toparticipate. Once again, the gender issue is important.
Indicator 4.a: capacity of stakeholders to participateThis indicator will allow you to monitor the strengthening ofstakeholders’ capacities throughout the decision-makingprocess. We assume that the capacity of stakeholders toparticipate in the decision-making process needs to bebuilt on an ongoing basis (in terms of training, equipment,etc.) if the process is to be sustainable in the long term.We also assume that successful capacity-buildingactivities have a measurable impact on stakeholders.
How to rate?Use the examples to develop criteria to assess the abilityof each stakeholder group to participate. List the measurescarried out by, or for, each stakeholder group to buildcapacities to participate, of which the following areexamples:! Structural and budget reforms within organisation! Legislation to strengthen decision-making or
enforcement powers! Public information and awareness-building
! Provision of essential technological equipment andknow-how
! Community partnerships / direct technical assistanceto informal sector groups
! Capacity-building programmes specifically designedfor NGOs and CBOs
! Lower-level skills training focused on small-scaleorganisations / training of trainers
! Promoting alternative techniques! “Sensitivity” training for public sector institutions to
better understand non-public sectors' pointsEvaluate how far stakeholders’ capacities have beenstrengthened by the activities:! To what extent has the ability to communicate and
understand improved?! To what extent has the structural reform improved
stakeholders’ capacity to act and participate?! What level of expertise have capacity building
activities imparted to the stakeholder group?
Indicator 4.b: linkages among actorsThis indicator allows you to measure the extent to whichstakeholders’ participation in decision-making has becomethe norm. Institutionalisation of participatory approaches,by which we mean routine use of participatory approachesto decision-making, requires one main condition: formalarrangements for participation are incorporated intostakeholders’ organisational structures. The strength oflinkages among stakeholders indicates the extent to whichprocedures for co-ordination between sectors andinstitutions have become the norm. It is assumed that if co-ordination is to be effectively institutionalised, it mustbecome embedded in the mandates, activities andstructures of stakeholders’ organisations. Simplymeasuring how far stakeholder groups co-ordinate theiroperations is not enough. If inter-organisational co-ordination is to be sustainable, it needs to be fullyintegrated into working procedures so that participationbecomes routine.
How to rate?Use the questions below to develop criteria to evaluateeach stakeholder’s performance in integrating inter-organisational linkages into their activities:! Has each stakeholder nominated a representative to
act as a clear contact with each working group, taskforce or inter-sectoral committee?
! How regular are inter-organisational meetings andconsultations, and to what extent have stakeholdersincorporated them in their programme?
! Are there mechanisms enabling the sharing anddissemination of information?
! Have the stakeholders developed partnerships orhave their institutional structures modified to permitco-ordination of their activities?
! Has the stakeholder group set up co-ordinatingcommittees or mechanisms to update otherstakeholders on their progress and develop cross-sectoral linkages?
! Have any projects been implemented jointly, or areorganisations replicating each other’s activities?
! Is co-ordination with other organisations written intoeach stakeholder’s TOR or work programme?
Indicator 4.c: genderThis indicator measures the extent to which women as wellas men benefit from capacity building, and also whetherboth men and women have developed their capacities forgender planning. Finally, it measures whether theinstitutional capacity exists for both women’s and men'sinterests to be represented, and for them to besuccessfully combined.
How to rate?Evaluate whether women's capacities! are not addressed (0)! women's capacities are addressed (1)! women's capacities are addressed and gender
capacity building exists for men and women (2)! same and men's and women's stakeholder interests
are separately established and linked (3)

Decision-making indicatorsUNCHS (Habitat) 09-99
19
���������������������������������������������������������������������������������������������������������������������������������������������������������������������������������������������������������������������������������������������������������������������������������������������������������������������������������������������������������������������������������������������������������������������������������������������������������������������������
���������������������������������������������������������������������������������������������������������������������������������������������������������������������������������������������������������������������������������������������������������������������������������������������������������������������������������������������������������������������������������������������������������������������������������������������������������
REPORTING SHEET: Please, fill colored cells
Indicator 4: Institutionalisation1995 2000
Institutionalisation Institutionalisation
Actors a. c
apac
ity to
par
ticip
ate
b. li
nkag
es a
mon
g st
akeh
olde
rs
c. g
ende
red
inst
itutio
nalis
atio
n
Tota
l by
acto
r
Actors a. c
apac
ity to
par
ticip
ate
b. li
nkag
es a
mon
g st
akeh
olde
rs
c. g
ende
red
inst
itutio
nalis
atio
n
Tota
l by
acto
r
1 National Government 1 2 2 1.67 1 National Government 3 3 2 2.672 Local authorities 1 1 1 1.00 2 Local authorities 3 3 3 3.003 NGO's 1 2 2 1.67 3 NGO's 3 3 3 3.004 CBO's 1 0 0 0.33 4 CBO's 3 2 2 2.335 Private sector 0 2 1 1.00 5 Private sector 3 2 2 2.336 Academics and scientists 1 2 1 1.33 6 Academics and scientists 3 2 3 2.677 Other 0 0 0 0.00 7 Other 2 2 2 2.00
Total 0.71 1.29 1.00 1.00 Total 2.86 2.43 2.43 2.57
Results: based on your inputs above
Progress by stakeholders
Actors 1995
2000
Prog
ress
1 National Government 1.67 2.67 1.002 Local authorities 1.00 3.00 2.003 NGO's 1.67 3.00 1.334 CBO's 0.33 2.33 2.005 Private sector 1.00 2.33 1.336 Academics and scientists 1.33 2.67 1.337 Other 0.00 2.00 2.00
Total assessment 1.00 2.57 1.57
Progress by activities
Actors a. c
apac
ity to
par
ticip
ate
b. li
nkag
es a
mon
g st
akeh
olde
rs
c. g
ende
red
inst
itutio
nalis
atio
n
Tota
l ass
essm
ent
1995 0.71 1.29 1.00 1.002000 2.86 2.43 2.43 2.57
PROGRESS 2.14 1.14 1.43 1.57
0.00
0.50
1.00
1.50
2.00
2.50
3.00
a. capacity toparticipate
b. linkages amongstakeholders
c. genderedinstitutionalisation
Total assessment
19952000
0.00
0.50
1.00
1.50
2.00
2.50
3.00
1 2 3 4 5 6 7
1995
2000
Linkages among stakeholders.Within the stakeholder group:(0) actors are not linked to other groups(1) some actors are linked to other groups(2) most actors are linked to other groups(3) all actors have strong links with other groups
Gendered institutionalisation.Within the stakeholder group:(0) women's capacities are not addressed (1) women's capacities are addressed (2) women's capacities are addressed AND gender capacitybuilding exists for men and women (3)same AND men and women stakeholder interests areseparately established and linked
Capacity to participate.Within the stakeholder group:(0) actors have no capacity to participate(1) few actors can participate(2) many actors participate to some extent(3) most actors have strong capacities to participate

Decision-making IndicatorsUNCHS (Habitat) 09-99
20
Index: overall results
Information and assessment activities Strategy and action planning
Implementation Institutionalisation
0.00
0.50
1.00
1.50
2.00
2.50
3.00
1 2 3 4 5 6 7
1995
2000
0.00
0.50
1.00
1.50
2.00
2.50
3.00
1 2 3 4 5 6 7
1995
2000
0.00
0.50
1.00
1.50
2.00
2.50
3.00
1 2 3 4 5 6 7
1995
2000
0.00
0.50
1.00
1.50
2.00
2.50
3.00
1 2 3 4 5 6 7
1995
2000
Indicators for decision-making
0
1
2
3
Information andAssessment Activities
Strategy and ActionPlanning
Implementation
Institutionalisation
19952000
1: National Government2: Local authorities3: NGO's4: CBO's5: Private sector6: Academics and Scientists7: Other

Decision-making indicatorsUNCHS (Habitat) 09-99
21
COMMENTS: please provide comments on your resultsInformation and assessment activities Strategy and action planning
Implementation Institutionalisation
General comments