participation and productivity: a comparison of worker ... comparison of worker cooperatives and...
TRANSCRIPT

BEN CRAIG Federal Reserve Bank of Cleveland
JOHN PENCAVEL Stanford University
Participation and Productiviy: A Comparison of Worker Cooperatives and Conventional Firms in the Plywood Industry
A PERENNIAL ISSUE in the study of organizational behavior is the impact on productivity of participation by workers in a firm's decisionmaking. The question has returned to the foreground in the recent debate over policies to increase U.S. productivity growth.' A large literature is aimed at quantifying the impact of worker participation on productivity though the results from this research fall somewhat short of being fully persuasive.2 There are several difficulties in this research, not least that worker participation can mean various things in different contexts.
At one extreme, workers may be consulted on a narrow range of issues, and the consultations may be designed more to give the appear-
1. The 1994 Economic Report of the President states that "the Administration aims to increase the productivity of the work force by helping employers make better use of their workers through increased worker participation. Numerous studies have now dem- onstrated that cooperative techniques increase productivity substantially in a wide range of enterprises. By helping to disseminate information on what successful firms have been able to accomplish, the Administration hopes to speed the adoption of these prac- tices throughout the economy" (p. 128).
2. Levine and Tyson (1990, p. 203) provide a comprehensive review of the literature. Even with a sympathetic reading of the evidence in favor of the hypothesis that partici- pation enhances productivity, the authors conclude merely that, "Our overall assessment of the empirical literature from economics, industrial relations, organizational behavior, and other social sciences is that participation usually leads to small, short-run improve- ments in performance and sometimes leads to significant, long-lasting improvements in performance" (emphasis in original).
121

122 Brookings Papers: Microeconomics 1995
ance of involving workers in decisionmaking than to grant workers effective influence. The other extreme occurs when workers have full discretionary powers and both own and manage the enterprise they work in. If productivity impacts of participation are not visible when workers are the firm's owners, they are less likely when workers participate to a much smaller extent. Therefore, this paper addresses the question of whether productivity differences are evident between conventional firms and worker cooperatives, which are firms owned and managed by their workers.
This is by no means the first investigation of productivity differences between conventional firms and worker co-ops though ours is unusual in a number of respects. Most research lacks observations on both conventional firms and co-ops in the same product market environment. As Bonin, Jones, and Putterman observe, "To examine productivity differences between PCs [producer cooperatives] and CFs [conventional firms], the comparison should be made between firms that are 'twins' in all nonorganizational respects, e.g., in terms of technology, the product generated, and market conditions. However, identifying 'twins' (isolation) is often impossible because the existing data on product type and technology are not sufficiently disaggregated. Firm- level data that applies consistent accounting conventions to both PCs and CFs in the same industry are rare."3 Nevertheless, the observations we have collected satisfy these stringent requirements.
They are longitudinal data on plywood mills in Washington state. The observations (collected by the authors) are at the level of the pro- ducing unit, the measurement of inputs and outputs is on a consistent basis, and the technology mapping inputs into outputs is virtually iden- tical across the firms. It is not the case that all the co-ops are the same, and we shall mention below some differences among them. However, they share the important characteristic that virtually all the firm's own- ers are workers in the firm, and most workers are owners. By contrast, the workers in the conventional firms in our sample are employees.
The conventional mills are individual proprietorships or partnerships or parts of a corporation. The workers at some of these mills are union- ized, while those at other mills, which we label "classical," are not. Most of the plywood produced in the Pacific Northwest comes from the
3. Bonin, Jones, and Putterman (1993, p. 1306).

Ben Craig and John Pencavel 123
unionized mills. In our work, we not only distinguish co-ops from conventional firms, but also discriminate between unionized mills and classical mills and thereby contribute to the literature on union-nonu- nion differences in productivity.
The principal goal of the research reported in this paper is to deter- mine whether, for given levels of observed inputs, the worker-owned plywood mills as a group produce more or less output than do conven- tional firms. We take it as a truism that, if every input were observed and observed without error, then at specified levels of these inputs each firm should produce the same level of output as every other. However, whenever economists estimate production functions, every input is not observed. Not merely are the conscientiousness, vigor, initiative, and other attributes of workers (including managers) not measured, but the information normally available on physical capital and raw materials omits details regarding the great variety of the plant and equipment and the frequently varying quality of the raw material. Therefore, after accounting for observed differences in worker-hours, the quantities of raw materials, and indicators of physical capital, we shall be asking whether there is a distinct difference in the amount of output produced by mills owned and managed by their workers.
There is a long-standing interest in knowing whether worker-owned and worker-managed enterprises are more productive organizations than conventional firms. The belief that they are lies behind some sugges- tions that worker-owned firms serve as the vehicles for divestiture of state-owned properties in East Europe. But many of these suggestions rest more on speculation about the operation of worker-owned firms than on familiar knowledge of their functioning. Using information from the U.S. manufacturing industry where cooperative enterprises are the most common, we examine the comparative behavior of co-ops and conventional firms to inform the discussion on the relative produc- tivity of worker-management.
Productivity, Capital Markets, and Worker-Owned Enterprises
Before investigating productivity in the plywood industry, we con- sider the principal reasons why worker-owned and worker-managed

124 Brookings Papers: Microeconomics 1995
firms might operate more efficiently and why other factors might frus- trate the exploitation of this advantage.
Productivity and Worker-Owned Enterprises
A study of worker cooperatives cannot distinguish between two types of argument regarding productivity and features of industrial relations systems. One class of argument concerns the relationship between pro- ductivity and the mechanism by which workers are compensated. The hypothesis here is that there are productivity gains from relating work- ers' pay to their output or to a firm's sales or to profits instead of to the workers' input of time. The second class of argument concerns the locus of decisionmaking and contends that a firm's productivity would be higher if workers participated more in various enterprise decisions.4
Analytically, the difference between the productivity effects from instituting incentive-type compensation schemes and the productivity effects from increased involvement by workers in decisionmaking is quite distinct. In practice, group pay incentive schemes tend more often to be found where workers have a role in decisionmaking or where some consultative mechanisms are in place to garner workers' sugges- tions. For instance, the frequently lauded Japanese industrial relations system is characterized (at least in the larger firms) by both profit- related bonus payments and greater use of consultation and consensus building. Similarly, in the worker cooperatives studied here, the work- ers both share net revenues and are intimately involved in the manage- ment of their enterprises, so there is no opportunity to distinguish the effects on productivity of group pay compensation schemes from those of worker participation in decisionmaking.
There are several reasons why worker co-ops may operate more productively than corporate firms. First, a co-op mitigates the agency costs associated with a corporation's division between ownership and control. Worker-owners are likely to be much better informed about
4. A clear statement of this notion is provided by Slichter (1968, p. 575): "The very fact that the workers have had an opportunity to participate in determining their working conditions is in itself favorable to efficiency. . . . [E]fficiency depends upon consent. Even though the specific rules and policies adopted in particular instances may not be ideal, the process of joint determination of working conditions at least offers the possi- bility of achieving greater efficiency than could be obtained under rules and conditions dictated by one side."

Ben Craig and John Pencavel 125
actions taken by managers than are nonworker-owners. Indeed, in the plywood co-ops studied below, managers have sometimes complained of what they regard as excessive involvement by the workers in day- to-day managerial decisions.5 The workers view their behavior more constructively.
Second, worker ownership eliminates the separation of interests be- tween workers and owners. There are occasions in which a conventional firm is presented with a choice of actions that can enhance the welfare of owners only at the expense of workers. This naturally pits one party against the other and may result in bargaining costs. Or a worker in a conventional firm may have better information about work effort or the organization of production at the shop floor level, but he may be hesitant to reveal that information because management might use it to further their interests or the owners' interests at the expense of the worker. In the presence of such asymmetrical information, a worker co-op offers the opportunity of productivity gains from eliminating the division of interests between owners and workers.6
Third, workers may be able to monitor each other's effort more effectively than in firms where the monitor is the owner's agent.7 In
5. Greenberg (1986) quotes the general manager of a mill that had been converted from a worker co-op to a privately owned firm as remarking, "It sure as hell is easier now. Before I had 250 bosses . . . everyone wanted to put his two cents in. Now I just answer to one man. . . . I like it better that way" (p. 44).
6. Greenberg's (1986) survey of production practices at conventional and co-op plywood mills is consistent with this argument: "worker-shareholders are much more likely to cooperate on production problems than are workers in a conventional plant. Indeed, there is a very strong tendency among the latter to stick to one's assigned job and not to meddle in what is considered the business of other workers or the responsibility of some other production unit in the plant. The boundaries of work responsibility are clearly drawn; workers in conventional plants are willing to put in a hard day's work on their assigned tasks, but they are not likely to move beyond those boundaries and act in ways that will enhance the productivity of the entire process. In the cooperatives, the job boundaries are less rigid and more fluid when, in the opinion of the people involved in production, the situation demands it" (p. 41).
7. Whenever there are opportunities and incentives for workers to shirk, efficient production requires their work behavior to be monitored. Alchian and Demsetz (1972) argued that such moral hazard problems are larger when profits are shared among many individuals. In their view, cooperatives are more likely to be found in situations where these shirking problems are offset by inherent difficulties of measuring work effort. "While it is relatively easy to manage or direct the loading of trucks by a team of dock workers where input activity is so highly related in an obvious way to output, it is more difficult to manage and direct a lawyer in the preparation and presentation of a case"

126 Brookings Papers: Microeconomics 1995
fact, there is direct evidence of this in the plywood mills where co-ops usually operate with many fewer supervisors than in conventional firms .8
Fourth, firms applying some method of incentive pay such as profit- sharing may attract workers whose ability or work effort is unusually high. These incentives may appear small insofar as a single worker contributes little to the firm's net revenues. On the other hand, a co- operative outcome in which all workers are motivated to work hard results in every member of the firm being better off. This self-selection argument applies, of course, in an economy consisting of a mixture of co-ops and conventional firms. No selectivity process can operate when all firms are co-ops.
Finance and Worker-Owned Enterprises
These productivity arguments may not be correct or of little conse- quence, and it is the goal of this paper to quantify their overall relevance in the largest and most durable sector of worker ownership in U. S. manufacturing. But if these arguments are correct, why are worker co- ops unusual in market economies? There are two primary explanations.
The first is that they are inherently risky institutions: workers have tied to the fortunes of the enterprise not only their labor incomes but also their capital. The purchase of a share in a plywood co-op involves the investment of much, if not all, of a worker's wealth.9 Far from diversifying his wealth, the worker concentrates his wealth into one form, the performance of his company. When the same worker is em- ployed in a conventional mill, he has the option of investing his capital in an asset whose returns are uncorrelated with movements in his labor income. The desire of workers to spread their risks is testified by the
(p. 786). The argument is attractive, though the plywood co-ops do not conform to it: work performance in a plywood mill is relatively straightforward to monitor. In the case of the plywood co-ops, the answer to Alchian and Demsetz's question of "who will monitor the monitor?" is the workers; the workers monitor each other.
8. Greenberg's (1986) survey of plywood mills suggested that conventional mills tended to use six or seven supervisors per shift, while co-ops operated with one or two. In one instance, upon conversion from a co-op to a conventional mill, the number of supervisors was increased fourfold (pp. 43-44).
9. In the 1980s, the shares of several mills were advertised at prices of over $80,000. Naturally, these were the most profitable mills, and at others the prices were very much lower. See Craig and Pencavel (1992) for an analysis of these share prices.

Ben Craig and John Pencavel 127
fact that, when they were permitted to do so, labor unions chose not to concentrate their pension funds in investments in the companies where the union members worked.
The second reason is associated with the costs of supplying capital. The wealth limitations of workers constrain the amount of capital that can be raised from workers themselves, so they are obliged to turn to banks and other credit institutions for loans. These organizations- regardless of whether the borrower is a co-op or a conventional firm- are sensitive to the risks of opportunistic behavior when their loans are used to purchase specific capital assets. To mitigate the risk of being "held-up," the lending institutions will demand some collateral or insist that their agents be a party to the firm's critical decisions.
For a worker co-op, the former presents the workers with the same credit problems that induced them to turn to banks in the first place, while the latter compromises the principle of workers being the sole owners of their enterprise. Conventional firms, by contrast, when per- mitted by law, often admit to their Board of Directors the representa- tives of their principal creditors. In some cases, of course, the financial institutions end up as owners of the firms to whom they have extended loans, a classical vertical integration response to the potential problems of postcontractual opportunism. 10
The Plywood Co-ops' Sources of Capital
The experiences of the plywood co-ops in the Pacific Northwest testify to the relevance of these capital market problems. The workers have constituted the major source of capital both through the sale of shares at the founding of the company and through subsequent loans (in the form, for example, of the sale of further stock or deferred earnings). Often a co-op was constrained in its attempt to raise capital by two factors: first, it attempted to restrict the number of shares to the number of workers expected to be employed in the mill; and, second, it tried to keep the price of the shares to a level within range of a typical working household's wealth. Given these constraints, it is not surpris-
10. See, for instance, Klein, Crawford, and Alchian (1978). A similar argument attributing the infrequency of worker co-ops to their distinctive capital market difficulties appears in Bowles and Gintis (1993).

128 Brookings Papers: Microeconomics 1995
ing that, soon after the founding of a co-op venture, it was common for the mill to return to its worker-owners for more funds.
Many of the co-ops have borrowed money from sources other than their workers. Short-term borrowing to build up inventories or meet transitory contingencies has not been difficult to obtain, but long-term financing seems to have been more problematic. Borrowing from banks has usually required mills to mortgage their equipment, plant, or in- ventory or to impose ceilings on their member-workers' pay. 1I The most common source of outside borrowing, however, has been the Federal Government's Small Business Administration, such loans being con- ditional on the borrower's demonstrated inability to secure capital from private sources.
Co-ops have operated at something of a disadvantage in capital mar- kets. The share prices of co-ops have shown a persistent tendency to be undervalued. In earlier research, we found that the prices of the shares of three plywood co-ops tended to be far below the level that would have made membership and working in these cooperatives of equal monetary return to working in a conventional mill.'2 There are several possible explanations for this finding, but we found most plau- sible the proposition that the co-ops' activities are impaired by capital market considerations.
11. Gintis (1990) argues that credit institutions prefer to make loans to enterprises effectively controlled by a small number of people whose behavior can be monitored and directed easily rather than to an enterprise whose ownership is diffused among the entire work force. The plywood co-ops supply evidence of this. In a detailed study of the finances of some co-ops, Dahl (1957) writes, "The banker must recognize that, while he may discuss the [co-op] company's financial problems with the company manager, he frequently does not have the final say on what the company is going to do. Instead, the Board of Directors [elected by the worker-members] is much more active in handling ordinary day-to-day problems of the company, including bank financing, than is common with ordinary corporations. This will require that the banker not only discuss affairs of the company in the bank with the manager but it is very likely that he will have to attend Board meetings to explain the bank's method of financing before the company will give its approval. He may even be requested to attend stockholders' meetings to explain to the entire group of stockholders the bank's position. . . The banker will recognize a great difference between the Board of Directors of his bank composed of a few bankers and successful businessmen in other lines of business, and the board of the plywood company" (pp. 65-66).
12. Craig and Pencavel (1992).

Ben Craig and John Pencavel 129
The Plywood Industry and Co-ops in the Pacific Northwest
Plywood is produced by a simple process that did not alter over the period of our data. Logs are first soaked in a tank of hot water, then placed on a lathe where the veneer is peeled off in long strips, patched, and cut into manageable lengths. The strips are then sorted onto a "layup" machine that glues the veneer together into plywood, often using heat. Some mills have no veneer lathe and purchase the veneer from other mills for their own layup presses. Other mills have no layup capacity and sell veneer.
Unlike sawmills, where great technical advances have changed the production process by computerizing the pattern of cuts and where labor spans a wide spectrum of different skills, plywood production remained technologically simple throughout our sample period. The only skilled workers used by the mill are the electricians, the machine maintenance workers, and the wright who designs the layout of the plant. Virtually all other workers have skills that are rapidly acquired on the job. How- ever, there are opportunities for workers to exhibit superior productivity such as in determining the width of veneer to be cut, in minimizing wastage from the raw material, and in working quickly and accurately.
The Plywood Cooperatives
In 1960, 99 percent of U.S. production of plywood came from the Pacific Northwest (table 1, column 2). The depletion of first-growth timber lands and environmental restrictions on logging have since moved the locus of production to the South. The plywood cooperatives have remained an important part of the industry within the Northwest, however. Thus, in 1990, in the state of Washington alone, seven of the thirteen plywood mills were cooperatives. Each mill produces a very small fraction of total U.S. production, and it is customary to treat each mill as a price-taker in its markets for output and for log inputs.
Plywood and timber prices are volatile and have displayed some remarkable movements over the past thirty years. 13 Columns 4 and 5 of table 1 record the real price of Western plywood and the real price of
13. This flatly contradicts Meade's (1972) assertion that a necessary condition for cooperative enterprises to thrive is an industry where "the risk of fluctuations in the demand for the product must not be too great" (p. 427).

130 Brookings Papers: Microeconomics 1995
Table 1. The Plywood Industry in Washington, 1960-92
Plywood production
In Pacific Northwest as a share
In of U.S. Real price Real price Washington production Employment of plywood of logs
Year (1) (2) (3) (4) (5)
1960 1.44 99.0 44.4 119.3 84.1 1961 1.54 97.9 41.6 116.4 70.4 1962 1.74 97.5 42.9 112.1 63.0 1963 1.82 96.5 43.7 115.2 70.4 1964 2.06 95.1 46.7 111.5 91.8
1965 2.07 90.9 46.2 109.4 102.5 1966 2.02 84.4 46.6 106.3 113.8 1967 1.85 78.1 44.0 100.0 100.0 1968 2.06 76.6 45.9 126.0 147.3 1969 1.80 72.3 45.2 130.7 196.7
1970 1.80 70.5 42.2 102.5 86.4 1971 2.07 67.3 43.4 110.6 94.5 1972 2.25 65.1 47.3 129.4 161.8 1973 2.23 64.0 49.1 145.0 286.6 1974 1.85 61.4 49.7 117.6 344.2
1975 1.72 57.9 43.8 116.0 222.0 1976 1.89 56.5 51.0 133.8 236.7 1977 2.01 55.1 53.9 149.6 321.6 1978 2.08 54.2 55.1 154.8 337.0 1979 1.73 51.5 52.6 139.6 442.4
raw timber, respectively, from 1960. While the real price of plywood was lower in the late 1980s than its level 25 years earlier, real log prices were very much higher. The declining profitability of the industry in the Northwest is evident. 14
The co-ops are different from one another in many details, so a brief description of them masks this heterogeneity. 15 Each member of the co- op must own one (and often no more than one) share. Regardless of the number of shares held, each member has a single vote to select the
14. The reasons for the rise in the price of softwood timber in the past seven years are discussed in Shull and Zager (1994).
15. Outstanding descriptions of the co-ops are provided by Berman (1967); Dahl (1957); and Gunn (1984).

Ben Craig and John Pencavel 131
Table 1. (continued)
Plywood production
In Pacific Northwest as a share
In of U.S. Real price Real price Washington production Employment of plywood of logs
Year (1) (2) (3) (4) (5)
1980 1.33 47.6 46.5 115.7 412.5 1981 1.38 42.9 44.4 106.9 240.0 1982 1.17 39.5 39.0 94.3 102.0 1983 1.37 40.2 41.1 101.5 140.8 1984 1.54 38.9 41.0 98.1 116.0
1985 1.65 37.5 37.3 98.5 123.1 1986 1.72 37.7 36.7 103.5 157.6 1987 1.71 37.8 39.2 97.5 194.8 1988 1.59 35.2 40.5 95.4 243.0 1989 1.46 30.9 42.2 105.5 300.4
1990 1.26 27.6 40.4 97.7 352.0 1991 1.17 25.5 38.0 96.2 234.7 1992 1.16 23.0 36.1 117.0 319.0
Sources: All these wood products data are from Production, Prices, Emplomvttent atnd Trade in Northwest Forest Industries (Portland, Ore.: U.S. Department of Agriculture, Forest Service, Pacific Northwest Research Station), various issues. The U.S. producer price index is from Ecotionoic Report of the President, February 1994, p. 343.
(1) Plywood production in the state of Washington in thousand million square feet, 3/8 inch basis. Before 1983, the statistics relate to plywood only. From 1983, they refer to plywood, waferboard, and oriented strand board.
(2) Softwood plywood production in Washington, Oregon, and California as a percent of total U.S. production. (3) Employment (in thousands) in lumber and wood products industries in the state of Washington. The industries cover
logging, lumber, plywood. poles and piling, and miscellaneous wood products. Furniture, paper, and allied products are excluded.
(4) Real price of softwood plywood (1967 = 100). The numerator is the price (in dollars per thousand square feet) of sheathing, western exterior, 3/8 inch, CD, net f.o.b. mill. The denominator is the total finished goods U.S. producer price index.
(5) Real price of sawtimber (1967 = 100). The numerator is the price (in dollars per thousand board feet) of sawtimber (all species) sold on National Forests in the Pacific Northwest Region. The denominator is the total finished goods U.S. producer price index.
board of directors who themselves are worker-members of the co-op. Turnover of board members is usually high. The by-laws of the com- panies specify annual meetings of all stockholders, though special stockholder meetings are frequently convened. The general manager is hired by the board of directors, and often he is not an owner.
All the co-ops employ workers who are not members, though these have normally constituted a minority of the workers. Some of these nonmembers are planning to purchase a share when they have accu- mulated some wealth and when a share becomes available. Others are

132 Brookings Papers: Microeconomics 1995
machine maintenance workers or electricians or glue spreaders-all of whom undertake distinctly different work.'6
The perennial concern of the champions of worker-ownership is that co-ops "degenerate" from a pure form in which all workers are owners and all owners are workers to a conventional firm in which ownership is concentrated in the hands of a few people and most workers are employees. Indeed, by purchasing the shares of departing members, the first plywood co-op (established in 1921), Olympia Veneer, steadily shed its cooperative character over time so that when the mill was sold in the early 1950s only a few of the workers were shareholders. Our irregular data on membership-employment ratios suggest a tendency toward "degeneration" in the plywood co-ops since the late 1950s although, given the shortcomings of the data, the inference is not a confident one. 17
Upon leaving the firm, a co-op member's sale of stock has to be ratified by the board of directors. Usually, to sustain a work force with desirable qualities, a new buyer has to work in the co-op for a proba- tionary period before the sale is approved (unless the buyer has already been working in the mill). A shareholder is given preference in em- ployment over a nonmember, and worksharing is a common response to adversity before layoffs are contemplated. In surveys, members state that their principal concern is with their weekly earnings where these earnings are related to their input of time, not to their stock ownership.
The Conventional Mills
The unionized mills operate under a contract that embraces most of the unionized lumber workers in the Pacific Northwest. Plywood mill employees constitute less than 5 percent of the total union membership covered by the collective bargaining agreement, which is usually ne- gotiated for a two-year period (though one-, three-, and four-year con- tracts were also negotiated during our sample period). Once negotiated at the regional level, the collective bargaining contract is often modified
16. From his survey of the co-op mills, Greenberg (1986) argues that nonmember workers are typically well treated: "hired workers are a minority in the cooperatives, . . . they are a highly diverse group many of whom exercise considerable influence and receive considerable benefits, and . . . their presence does not substantially damage the standing of cooperatives as democratic workplaces" (p. 62).
17. Craig and Pencavel (1992).

Ben Craig and John Pencavel 133
to fit the circumstances of each mill. Frequently, this amounts to main- taining existing wage differentials among mills. Within each mill, wage differentials range by a factor of about 2.5 from the lowest to the highest paid workers. Though such differentials are narrow by the standards of many manufacturing contracts, they are wide by comparison with the co-ops where all workers (with only a few exceptions) are paid the same hourly wages.
The few complete contracts available to us from the classical mills were written by human resource consultants. The pay differentials by job category were broadly based on the union contracts, though with fewer categories in the classical mills.
Births and Deaths of Cooperative Mills
As argued at the beginning of this paper, there are necessarily omit- ted variables in the production functions we (and others) estimate, and this raises questions about the meaning of any unobserved differences among the enterprises. The primary concern is whether, in their spatial distribution in the Pacific Northwest, the co-op plywood mills are a random selection of all firms. The argument against randomness of this sort would run as follows: those mills expecting to gain most from worker ownership and management are those that are more likely to organize in that form, in which case the observed productivity-partici- pation relationship tells us more about the explanations for the pattern of worker ownership than about the impact of cooperative organization on productivity.
This is potentially a profound problem in interpreting any observed correlation between productivity and participation. It suggests not that participation has an impact upon productivity, but that those firms of- fering superior returns to participation become cooperatives. 18 The sort of experiment we would like to conduct is to select randomly a subset of all firms, to convert these to cooperative ventures, and then to ob- serve the subsequent change in output per input. Because we cannot conduct this experiment, we may ask whether the choice of organiza-
18. The same type of problem arises in studies restricted to worker cooperatives that draw inferences from indicators of the nature of worker participation (such as amount of capital loaned per worker). This is recognized in Estrin, Jones, and Svejnar's (1987) study of French, British, and Italian cooperatives.
134 Brookings Papers: Microeconomics 1995
tional form between conventional plywood mills and co-op plywood mills in the Pacific Northwest is independent of productivity.
The record of the formation and demise of particular plywood mills suggests a number of factors relevant in accounting for the pattern of co-op and conventional organizational form. It is difficult, however, to find solid evidence suggesting that an idiosyncratic productivity element is an important component of the explanation for the incidence of co- operatives. Though the Pacific Northwest has long had a tradition sym- pathetic to worker cooperative enterprises, the extension of the co-op organization in the plywood industry has much to do with the example provided by the Olympia Veneer Company. After some initial adver- sity, the mill became extraordinarily profitable and served as the pro- totype for subsequent co-ops.
Most of the co-op mills were set up in the decade after the Second World War. Some built their own mills from scratch, while others acquired existing mills from owners who wanted to cease their involve- ment in the industry. The organizers were usually groups of individuals who planned to work in the mills they established, but there have also been a number of instances in which individual entrepreneurs have provided the organizational impetus for the formation of these mills. Typically these entrepreneurs have had little interest in actually working in the mills and have sought short-term returns from their ventures.
When existing plants have been converted to co-ops, the private owner has sold out because of low or negative profits. In these in- stances, the co-op often started out with the liability of an old plant or depleted raw material supplies. Some of these ventures failed, and the mill ultimately ceased production or was sold to private investors. But in a number of cases, after years of uncertainty, the worker-owners put the mills on new and successful footings. Though some of the co-ops converted to conventional firms because of financial difficulties, others converted because of the opportunity of great financial returns: the classic example is provided by the Olympia Veneer Company, which sold out to the United States Plywood Corporation in 1954. The evi- dence we have garnered does not suggest any material difference be- tween the failure rates of conventional and co-op mills. We estimate the co-ops' share of production in the region in the 1968-86 period remained between 40 and 50 percent.
There is nothing in this account to suggest that the incidence of

Ben Craig and John Pencavel 135
cooperative plywood mills within the region is influenced by productiv- ity factors specific to that type of organization. The pattern of co-op mills has more to do with the initiative and attitudes of groups of working people when presented with opportunities that were not specific to one organizational form or the other. None of the co-ops examined in this paper was established during the period under study. Therefore, even if there were specific advantages to co-op organization at the time the co-ops were formed, the advantages are likely to have expired many years ago.
Data Description
The data we collected derive from a variety of sources. One source, the Department of Natural Resources of the state of Washington, col- lected information on all plywood mills in the state biennially, so our data are available every other year from 1968 to 1986.19 Information on the cooperatives was taken from those annual reports to which we were granted access. A large amount of material was compiled, but much of it could not be used because our work required a data set consisting of the intersection of the sets of input and output quantities and input and output prices.20 The result is 170 observations on 34 mills: 7 mills are cooperatives, 19 are unionized mills, and 8 are clas- sical mills. For only three mills (one co-op, one unionized, and one
19. The Department of Natural Resources provided data on output, the inputs of logs, species of tree used, and types of machinery. In addition, individual establishments submitted employment and compensation information to the Employment Security De- partment of the state. Unions collected records for their individual pension funds on hours and earnings, and the national union headquarters made some data available. Finally, individual mills and published industry sources filled in some gaps in the data. For an analysis of the accuracy of our data, see the appendix to Craig and Pencavel (1992).
20. The data set used in this paper differs from that used in our article for the American Economic Review (Craig and Pencavel, 1992). For the research reported here we required information on the input of log raw materials that was lacking for 27 observations. This reduces the number of observations from 200 to 173. The data set here is smaller than that used in our Journal of Political Economy article (Pencavel and Craig, 1994) because we ejected three observations where the values of the raw material inputs were distinct outliers. This reduces the number of observations from 173 to 170. (The inclusion of these three outliers never had any effect on the point estimates of the equations reported below.)

Table 2.
Distribution of
Observations by
Firm
Type
and by
Production,
1968-86
Plywood
only
Veneer
only
Both
plywood
All
mills
and
veneer_
Year
Co-op
Union
Classical
All
Union
Classical
All
Co-op
Union
Classical
All
Co-op
Union
Classical
All
1968
5
4
1
10
2
1
3
5
6
2
13
1970
3
6
1
10
2
1
3
3
8
2
13
1972
4
6
1
11
2
1
3
1
3
4
5
11
2
18
1974
2
6
1
9
2
1
3
5
5
2
13
2
17
1976
2
4
1
7
3
1
4
1
6
7
3
13
2
18
1978
1
6
1
8
3
3
6
2
5
7
3
14
4
21
1980
4
4
1
9
4
4
8
5
1
6
4
13
6
23
1982
4
2
6
3
3
6
-
5
1
6
4
10
4
18
1984
2
2
4
2
4
6
1
4
1
6
3
8
5
16
1986
3
4
7
3
3
1
1
1
3
4
5
4
13
All
years
30
44
7
81
23
22
45
6
34
4
44
36
101
33
170
Source:
Authors'
data.

Ben Craig and John Pencavel 137
classical) are there observations in each (even-numbered) year, so the data set is unbalanced. We calculate that our sample constitutes 49.7 percent of all active mills over these years, 37.5 percent of co-ops, 67.8 percent of unionized mills, and 34.0 percent of classical mills. Hence, our inferences below about the population of plywood mills rest upon a relatively large sample of firms.
The decomposition of our observations by type of firm and by pro- duction is provided in table 2. Most of the 36 observations on the cooperatives are on mills that produce only plywood. None of the co- ops specializes in veneer production. By contrast, two-thirds of the classical mills specialize in the production of veneer. Evidently, the three organizational forms (cooperatives, classical mills, and unionized mills) are not equally distributed across the three types of production, so care must be taken to ensure that any productivity differences among the organizations are not attributable to variations in their production type.
Average values of inputs and output are given in table 3. Output is an annual aggregate in square feet of softwood plywood and veneer.2' Worker-hours are measured per year and calculated by forming the product of the number of workers and annual hours per worker.22 The input of logs is also measured annually in terms of thousands of feet consumed. We collected information on a number of types of machines, but we report results in this paper using as a measure of capital input the length in feet of the mill's largest lathe. The lathe is the mill's most critical machine, and measures of other machinery inputs are highly correlated with lathe size.
The mills vary little in their production methods, and certainly there is no meaningful difference between the co-ops and the conventional firms in the vintage of machines and technology of production. As Greenberg remarks, "the technical production processes, the compo- sition of the machinery, the optimal level of operation of that machin- ery, and the division of labor are virtually identical in all the plywood plants. Unless one is especially knowledgeable and blessed with a dis-
21. Softwood plywood and veneer (and a very little hardwood) are aggregated using region-specific current prices and then deflated by an overall plywood producer price index.
22. Annual hours per worker are the number of days operated per year times the number of hours per shift.

Table 3.
Mean
Values of
Variables by
Firm
Type
and by
Production
Both
plywood
Plywood
only
Veneer
only
and
veneer
All
mills
Variable
Co-op
Union
Classical
All
Union
Classical
All
Co-op
Union
Classical
All
Co-op
Union
Classical
All
Output
(X)
135.8
138.4
68.6
131.4
49.2
19.5
34.7
113.5
126.2
51.6
117.7
132.1
114.0
33.8
102.3
Worker-hours (L)
60.1
58.4
22.4
55.9
33.2
7.7
20.7
49.1
59.2
12.2
53.5
58.3
52.9
11.3
46.0
Log
inputs(G)
243.0
280.9
158.9
256.3
197.8
89.9
145.1
148.2
254.9
110.0
227.2
227.2
253.2
106.9
219.3
Lathe
size
(K)
77.4
72.6
61.7
73.5
68.5
49.2
59.1
79.3
77.2
37.0
73.8
77.8
73.2
50.4
69.8
XIL
236.0
257.0
290.1
252.1
163.7
268.1
214.8
235.2
259.1
399.2
268.6
235.9
236.5
288.7
246.5
XIG
6.47
6.89
4.03
6.49
2.43
2.43
2.43
12.24
8.36
4.67
8.55
7.43
6.37
3.04
5.95
X/K
1.82
2.57
1.09
2.17
0.75
0.42
0.59
1.46
1.99
1.59
1.88
1.76
1.96
0.70
1.67
LIG
28.8
34.3
19.3
31.0
24.3
15.2
19.8
50.9
44.8
12.3
42.6
32.5
35.6
15.7
31.0
Source:
Authors'
data.

Ben Craig and John Pencavel 139
cerning eye, one cannot easily tell the difference in the actual produc- tion process between cooperative and conventional firms."23 This is interesting in view of the argument sometimes voiced that employers at conventional firms foist on their employees working conditions that the employees resent. In particular, some sociological literature as- sumes that worker ownership would reduce, if not eliminate, the alien- ation of workers from their production activities. There is absolutely no evidence of this from the plywood cooperatives where "worker- shareholders in the cooperatives go about producing plywood in almost exactly the same mind- and body-numbing ways as workers in conven- tional mills. "24 Indeed, on one measure of worker welfare-the inci- dence of accidents-the cooperatives are more alienating workplaces: "the plywood cooperatives are by far the most dangerous places to work in the entire plywood industry.' "25
According to table 3, the average output and employment of the cooperatives are similar to those of the unionized mills. The classical mills are between one-third and one-half the size of the other mills. The industry has used two primary methods to measure productivity, and the values of both of these are listed in table 3. One is output per worker-hour, and the other is output per input of logs, the latter some- times called the log recovery ratio.26 Both of these measures have
23. Greenberg (1986, p. 40). Greenberg later notes that "the production process in cooperative and conventional mills is indistinguishable" (p. 81).
24. Ibid., pp. 83-84. 25. Ibid., pp. 84-85. In Greenberg's survey, the mill with the greatest concern for
safety was a conventional mill. He conjectures that the Occupational Safety and Health Administration (OSHA) spends less time monitoring the cooperatives under the mistaken belief that worker-owned mills will be especially alert to their own safety and, therefore, require less regulation. In his own study, Grunberg (1991) suggested that part of the "staggering" difference in injuries between cooperatives and conventional mills was attributable to the co-ops' greater readiness to report accidents. The state's system for compensating workers for their injuries provides incentives for reporting such accidents, and the relative absence of supervisors in the co-op mills made it easier for co-op workers to claim work-related injuries. However, Grunberg believed that the difference between co-op and conventional mills was not entirely a reporting difference and that "safety has been a matter of very low priority in the co-operatives" (p. 117).
26. It was primarily on the basis of output per worker-hour that in the 1950s the cooperatives in the plywood industry were said to be more productive than the conven- tional firms. In Grunberg's (1991) more recent survey, output per worker-hour was higher among the conventional mills. Berman and Berman (1989, p. 290) compute output per worker for the plywood mills in the years 1963, 1967, 1972, 1976, and 1977. In each year, there is no statistically significant difference (even at the 10 percent level)

Table 4.
Proportionate
Differences
between
Co-ops
and
Classical
Firms
and
between
Unionized
and
Classical
Firms by
Type of
Output
Adjusting
for
Year
Effects
Both
plywood
Plywood
only
Veneer
only
and
veneer
All
mills
Variable,
Co-op
Union
Union
Co-op
Union
Co-op
Union
XIL
-0.16
-0.13
-0.49
-0.55
-0.64
-0.36
-0.39
(0.21)
(0.20)
(0.26)
(0.36)
(0.29)
(0.17)
(0.13)
X/G
0.42
0.34
0.03
0.92
0.35
0.36
0.19
(0.23)
(0.22)
(0.11)
(0.47)
(0.39)
(0.15)
(0.12)
XIK
0.66
0.71
0.79
-0.01
0.30
0.61
0.71
(0.33)
(0.31)
(0.33)
(0.42)
(0.35)
(0.24)
(0.19)
Output
price
(p)
-0.01
0.01
0.02
0.03
0.05
0.04
0.03
(0.01)
(0.01)
(0.04)
(0.04)
(0.03)
(0.02)
(0.02)
Price of
logs (r)
-0.03
-0.05
0.02
0.03
-0.02
0.01
-0.01
(0.03)
(0.03)
(0.02)
(0.06)
(0.05)
(0.02)
(0.02)
Hourly
wage
(w)
-0.13
-0.01
0.16
-0.21
-0.07
-0.02
0.14
(0.10)
(0.10)
(0.16)
(0.12)
(0.10)
(0.10)
(0.07)
Source:
Authors'
data.
Standard
errors
are in
parentheses.
a.
For
explanation of
first
three
variables.
see
table 3.
Ben Craig and John Pencavel 141
shortcomings as productivity indicators. If output is measured in phys- ical terms (conventionally 3/8 inch equivalent basis), the quality of the finished product is being neglected, and there are corresponding con- cerns with respect to the quality of log inputs. The effective input of labor may well differ from labor time when there are opportunities for people to work more or less effectively and conscientiously. These are familiar difficulties in research on productivity measurement, though they are less severe in this instance insofar as the variance of unmea- sured components is smaller within an industry and region than across industries and regions.
In table 3, average values of output per worker-hour (labor produc- tivity) are consistently higher for the classical firms, but there is little difference between the co-ops and the unionized mills. By contrast, average values of output per log input (material productivity) are usu- ally higher for the co-ops and the unionized mills and lowest for the classical mills. This implies quite different labor-log ratios as shown in the last line: computed over all production types, the average ratio of worker-hours to log inputs in cooperative and unionized mills is more than double its value in classical mills. These differences in input ratios are less marked in mills specializing in plywood and in veneer produc- tion. Output per size of largest lathe (XIK) is consistently highest among the unionized mills and usually lowest among the classical mills.
One difficulty with the values of productivity in table 3 arises from the fact that the data are not a balanced panel, so differences in the mixture of observations across firm types by year may influence the mean values. Table 4 reports proportionate differences in productivity, first, between co-ops and classical firms and, second, between union- ized firms and classical firms after adjusting for variations in the distri- bution of observations over time. The entries in table 4 are least-squares estimates of the parameters a, and a2 in the following equation:
(1) ln(X/Zj)i, = ao; + a,jCi + a2jU; + Eta3tY, + Uitj
where X denotes output, Zj represents the use of input j, Ci is an indi- cator for a co-op mill, Ui is an indicator for a unionized mill, and Y, is an indicator for year t. The Uj are stochastic disturbance terms.
between the co-ops and the conventional firms except in 1977, when the conventional firms are reported as being 20 percent more productive.

142 Brookings Papers: Microeconomics 1995
The adjusted differences in labor productivity in table 4 still suggest that classical firms are the most efficient.27 However, the differences are now smaller than those implied by the raw means in table 3. Among the largest production group, mills specializing in plywood, the co-op mills are 16 percent less productive than classical mills, whereas un- ionized mills are 13 percent less productive. Even this difference would not be judged as significantly less than zero by the usual statistical criteria.
The superior raw material productivity of the co-ops and unionized mills also falls in table 4 compared with the values in table 3. The raw material productivity of the co-ops is 36 percent greater (in logarithmic units) than the classical mills, and the material productivity of the unionized mills is 19 percent greater than the classical mills. The im- plied labor-log input ratios are correspondingly smaller though they remain sizable: averaged over all production types, the ratio of worker- hours to raw material inputs is 74 percent greater in co-ops and 59 percent greater in unionized mills than in classical mills.
Table 4 also presents some average ratios of output per machine. The ratio of output to the size of the mill's largest lathe is XIK. These output-machine ratios are very much higher in co-op mills and in un- ionized mills than in classical mills. There is no meaningful difference between co-ops and unionized mills, however. Indeed, this seems to be a general finding: whereas the classical mills' output-input ratios are different from the other mills, there is little difference between the co- ops and the unionized mills.
In discussing table 4, we have concentrated on those estimates cor- responding to the columns "all mills" because, for each measure of productivity, standard F-tests indicate no significant differences (apply- ing conventional statistical criteria) among the productivity estimates according to the degree of product specialization. Indeed, throughout our research, it was a common finding that differences among the three types of mills according to their product specialization (that is, mills producing plywood only, mills producing veneer only, and mills pro- ducing both plywood and veneer) were not statistically significant by customary standards. Hence, in what follows, we concentrate on dif-
27. The numbers in parentheses in table 4 are the least-squares estimated standard errors. For the estimates of a, and a2 in the column "all mills" in table 4, dichotomous variables identifying veneer only and plywood only mills are added to equation 1.

Ben Craig and John Pencavel 143
ferences among co-ops, unionized mills, and classical mills for the entire sample of 170 observations.
Input-Output Ratios, Production Functions, and Supply Functions
The previous section concluded by presenting information on input- output ratios, so it is useful to start our analysis there.
Input-Output Ratios
A natural concern with the productivity differences reported in table 4 is that no account is taken of differences in input and output prices facing these mills. Though these prices are predetermined to these mills, there are systematic price differences at a given time attributable primarily to variations in the quality of the output sold and log inputs purchased. Most of the sample variation in prices is over time, and relatively little is across firms,28 but there remains some variation across firm types as indicated in the last lines of table 4. There are small differences in the price of output and of log inputs across the firm types, but unionized wages are about 14 percent higher than wages in classical mills.
This concern with the role of prices arises, of course, out of rudi- mentary notions that firms do not randomly select their inputs and outputs, but do so with regard to some objectives. To determine whether the inferences from table 4 are affected by controlling for prices, con- sider augmenting equation 1 so that productivity equations of the fol- lowing form are estimated:
(2) ln(X/Zj)i, = aoj + aljCi + a2jU; + a3j(PONLY)i, + a4j(VONLY)i,
+ a5jln(pj/p,)i, + a6jlnZ>j, + a7jT, + Ei,j.
Again, X stands for output, and Zj for the use of input j. The price of (plywood or veneer) output is po, and the price of input j is pj. C is a dichotomous variable taking the value of unity for co-op mills, and
28. Eighty-eight percent and 90 percent, respectively, of the variation in the loga- rithm of output prices and in the logarithm of log input prices are removed by yearly dummy variables alone.

144 Brookings Papers: Microeconomics 1995
U is a dichotomous variable taking the value of unity for unionized mills. The omitted firm type is, therefore, the classical mill. PONLY and VONLY are also dichotomous variables, the former identifying mills producing only plywood and the latter identifying mills producing only veneer. The integrated firm producing both veneer and plywood thus constitutes the omitted category.29 A linear time trend is indicated by T,.30 The E are stochastic error terms.
The purpose of these equations is to measure productivity differences by type of firm, holding constant three classes of variables: first, the degree to which the mills specialize in their production (hence the presence of PONLY and VONLY); second, relative prices; and, third, the general scale of production in recognition of any nonconstant returns to scale (which explains the presence of Zj on the right-hand side of these equations).3'
The instrumental variable estimates of equation 2 are presented in
29. Note that there is a time subscript on PONLY and VONLY. In most cases, a mill remained in one of the three stages of production throughout the time period. In a few cases, there are instances of a mill that usually specializes in veneer (plywood) producing a little plywood (veneer).
30. All these equations were estimated with dummy variables for each year replacing the linear time trend. The differences in inferences between the two specifications are very small.
31. These equations may be rationalized as first-order conditions from a production function of the following form:
X = A(e,j"j)
where A?0 is usually designated a neutral efficiency parameter and, once the normali- zation Y_ -- 1 is imposed, the ,?0 may be interpreted as distributional parameters. The delta and Oj should be of the same sign. The values of the 4 parameters depend upon the units in which the inputs are measured. This function does not impose homotheticity, it is compatible with increasing, decreasing, or constant returns to scale, and the partial elasticities of substitution among the inputs need not be constant. The ratios of the partial elasticities of substitution are independent of the levels of inputs and output. If inputs are selected such that the values of marginal products are equal to input prices, the following output-input equations are implied:
ln(XIZ,) = (1 - 6)'ln(80y-"lq1) + (1 - 8)-'ln(pj1pO) + (6 - Oj) (1 - )-'lnZ ?+ vj
where Nq = A and vj = (1 - 6) -' Xj . These equations are equivalent to equation 2 provided the ln-qj terms are linear functions of C;, Ui, PONLYi,, VONLYi,, and time and provided the vj are treated as stochastic disturbance terms that vary across mills and over time. According to this interpretation of equation 2, the technical efficiency param- eter (A) or the distributional parameters (4j) of the production function vary by type of firm (C; and Uj), but the other parameters (0,, XA, and 6) do not.

Ben Craig and John Pencavel 145
Table 5. Instrumental Variable Estimates of Equation 2
Variable Worker-hours Logs Lathe
Intercept 1.315 0.896 3.110 (0.588) (0.238) (0.993)
C; -0.108 0.583 1.100 (0.206) (0.123) (0.212)
U; -0.154 0.457 1.007 (0.180) (0.100) (0.166)
(PONLY)i, -0.035 -0.138 0.056 (0.116) (0.086) (0.143)
(1VONLY)i, -0.665 -1.106 -1.266 (0.152) (0.101) (0.165)
ln(p /pO)j, -0.109 -0.183 -0.530 (0.148) (0.214) (0.214)
InZji, -0.183 -0.341 - 1.186 (0.090) (0.043) (0.182)
T, -0.001 -0.002 0.006 (0.009) (0.007) (0.015)
Source: Authors' data. Note: In each instance, InZj is treated as endogenous as is the hourly wage for cooperative mills. The instrumental
variables are the price of output, the price of logs, the price of machinery, the wage rate for the classical and unionized mills, and dummy variables for each mill and for each year. The price variables are interacted with Ui and C;. Standard errors are in parentheses.
table 5.32 The labor productivity of co-ops and unionized mills remains lower than that of the classical mills, though the differences are not significantly different from zero. Measured in terms of logarithmic differences, the output to log-input ratio of the co-ops is about 58 percent higher and of the unionized mills 46 percent higher than that of the classical mills. The two equations describing variations in output per machine suggest very much higher productivity in the unionized and cooperative mills. In other words, these equations suggest that, with the exception of output per worker-hour, productivity is higher in both the co-op and unionized mills than in the classical mills. In all of the productivity equations, the hypothesis of no difference in produc-
32. In these equations, the logarithm of the input on the right-hand side of each equation is treated as endogenous as is the hourly wage for the cooperative mills. The variables serving as instruments are the price of output, the price of logs, the price of machinery, the wage rate (for the unionized and classical mills), and dummies for each year and each mill. In these instruments, the price variables and time dummies are interacted with Ci and Ui.

Table 6.
Estimated
Production
Functions
All
mills
Co-op
mills
Unionized
mills
Classical
mills
Variable
OLS"
INVb
OLS"
INVb
OLS"
INVb
OLS
INV"
Intercept
0.662
0.743
3.006
3.540
0.098
0.770
-0.857
-
2.366
(0.495)
(0.585)
(0.718)
(0.823)
(0.707)
(0.769)
(1.145)
(1.713)
j
(0.137)
(0.124)
N.A.
N.A.
N.A.
N.A.
N.A.
N.A.
U;
(0.029)
(?0.13)
N.A.
N.A.
N.A.
N.A.
N.A.
N.A.
(PONLY)i,
-0.131
-0.158
-0.021
0.003
-0.055
-0.084
-0.440
-0.391
(0.079)
(0.079)
(0.092)
(0.094)
(0.100)
(0.099)
(0.252)
(0.263)
(VONLY)i,
-0.836
-0.810
N.A
N.A
-0.919
-0.906
-0.684
-0.668
(0.101)
(0.106)
(0.128)
(0.138)
(0.208)
(0.224)
ln(worker-hours)j,
-0.606
-0.566
-0.585
-0.543
-0.679
-
0.653
-0.663
-0.714
(0.073)
(0.089)
(0.129)
(0.173)
(0.109)
(0.143)
(0.110)
(0.126)
ln(logs)j,
0.539
0.533
0.170
0.150
0.507
0.512
0.791
0.857
(0.044)
(0.053)
(0.069)
(0.086)
(0.061)
(0.069)
(0.077)
(0.098)
ln(lathes)j,
-
0.066
-0.103
-0.170
-0.312
-0.023
-0.021
0.100
0.401
(0.105)
(0.132)
(0.170)
(0.217)
(0.139)
(0.176)
(0.253)
(0.379)
T,
0.001
0.001
0.004
0.003
0.005
0.006
-0.009
0.004
(0.006)
(0.007)
(0.005)
(0.006)
(0.010)
(0.010)
(0.016)
(0.019)
Source:
Authors'
data.
Note:
Estimated
standard
errors
are in
parentheses.
Dependent
variable is
logarithm of
output
per
worker-hour.
N.A.
Not
applicable
a.
Ordinary
least-squares
estimates.
b.
Instrumental
variable
estimates.

Ben Craig and John Pencavel 147
tivity between the cooperative mills and the unionized mills cannot be rejected. The mills specializing in the production of veneer have lower productivity, but there is little difference between the integrated mills and those specializing in the manufacture of plywood.33
Hence the estimates in table 5 indicate higher levels of average output per materials and of average output per machine in the co-op mills and the unionized mills, holding constant scale effects, relative prices, and type of production. This suggests differences in the production func- tions by type of firm, and it is to this issue that we now turn.
Production Functions
A simple reparameterization of equation 2 yields a production func- tion. That is, if relative prices in equation 2 are replaced with all input quantities, a familiar Cobb-Douglas production function results:
(3) ln(X/Zj)i, = bo + b1Cj + b3Ui + b3(PONLY)i, + b4(VONLY)i,
+ 1k b5klnZ4'kit + b6T, + ui,
where ui, is a stochastic error term. Provided all inputs are included on the right-hand side of equation 3, at least with least squares, it is immaterial which input, Zj, is used to normalize output on the left-hand side of the equation.34
The first two columns of table 6 contain least-squares (OLS) and
33. If the estimates in table 5 are interpreted in terms of the production function specified in footnote 31, the statistical significance of the coefficients on C; and Ui in the output per materials and the output per lathe equations together with the apparent lack of significance of these coefficients in the output per worker-hours equation must imply that the distributional parameters attached to materials and to machines, the 4, vary across type of firms.
34. A considerable amount of effort was devoted to the estimation of other forms of the production function such as the translog and quadratic. (By quadratic, we mean specifying output to be a second-order Taylor series expansion in the inputs, not in the logarithm of inputs.) To be interpreted as meaningful production functions, our estimates must satisfy two criteria: first, the law of diminishing returns should apply to each input, holding constant other inputs at their mean values; and, second, marginal products should be positive at input levels actually observed. Our estimates of the translog and quadratic production functions did not always satisfy these two requirements. For at least one type of firm (not the same type), these specifications did not deliver an eco- nomically meaningful technology. For this reason, we concentrate on the estimates of the Cobb-Douglas function that we interpret as simply a log-linear approximation to the technology.

148 Brookings Papers: Microeconomics 1995
instrumental variable (INV) estimates of equation 3. In the case of instrumental variables, all inputs are treated as endogenous, and input and output prices serve as instruments in addition to year and firm dummy variables. The Zj used to normalize output is worker-hours, and the inputs consist of worker-hours, logs, and maximum lathe length. The coefficient on worker-hours implies an elasticity of output with respect to worker-hours of about 0.4. The elasticity of output with respect to log inputs is 0.53, and a negative elasticity is computed for machines .35
These estimates suggest that the co-ops are 13 to 15 percent more productive than are the classical mills. However, the coefficients on neither the co-op dummy nor the union dummy variables, Ci and Ui, respectively, would be regarded as significantly different from zero by conventional criteria.
These estimates impose the same input-output elasticities on the three types of firms. This is relaxed in the estimates reported in the other columns, where equation 3 is fitted to the observations on co-ops, unionized mills, and classical mills separately.36 According to these estimates, the coefficient on worker-hours is similar across the three types of firms. However, the coefficients on raw materials and machines appear different. With respect to the coefficients attached to the input of logs, the elasticity is lowest for the co-ops and highest for the clas- sical mills. These estimated elasticities are negatively correlated with the average values of output per log input reported in the previous
35. Berman and Berman (1989) also estimate Cobb-Douglas production functions to pooled cross-section time-series observations of the plywood industry in the Pacific Northwest. They derive their data from the Census of Manufactures for the years 1958, 1963, 1967, 1972, 1976, and 1977. Their inputs are employment, the book value of gross depreciable assets divided by the GNP implicit price deflator, and the ratio of output to maximum feasible output, which they label as a capacity utilization measure. The input of log raw materials is omitted. They introduce fixed-year effects, which in their results for the combined sample are not individually significantly different from zero. Not surprisingly, the ratio of output to maximum feasible output is strongly correlated with output (the left-hand-side variable). In their combined sample, other things equal, a cooperative mill is estimated to produce about 19 percent less than a conventional mill, and this estimate is significantly less than zero at the 1 percent level (p. 292). No distinction is made between unionized and nonunionized conventional mills.
36. We estimated all equations using different techniques such as adjusting standard errors to recognize the unbalanced nature of the panel and also allowing each mill to have its specific random effect. Our results were very similar to those reported.

Ben Craig and John Pencavel 149
sections. According to the X!G ratios in table 4 and also according to the estimates attached to Ci and Ui in the second column of table 5, average values of output per log input are highest among the co-ops and lowest among the classical firms. Using 0 to denote classical mills, C the co-op mills, and U the unionized mills, the ordering of average values of output per log input is
(X/G)C > (XIG)U > (XIG)?.
By contrast, letting y be the estimated coefficient on the logarithm of the input of logs in table 6, the ordering of the values of y by firm type is
y 0> yu > .yc
This pattern of values of X/G and of y is exactly that implied by a log-linear production function if the three types of firms face approxi- mately the same output and log input prices and if log inputs are selected such that the value of the marginal product of logs equals the price of logs. In this situation, because the marginal product of logs in the Cobb- Douglas production function is -yX/G, equality of input prices implies that relatively high values of -y are offset by relatively low values of XIG.
This argument suggests, therefore, that the observed differences in output per log input across the three types of firms are the consequence of differences in the elasticity of output with respect to log inputs in the production functions of the three types of firms. The elasticity is lowest for the co-op mills, and accordingly they economize on their input of logs relative to their output; the elasticity is largest for the classical mills, and accordingly they make relatively extensive use of log inputs given their output.37
This reasoning is based on the point estimates of the production functions reported in table 6. Let us consider whether the differences in the point estimates reported in table 6 would be judged as statistically
37. An argument along these lines applies also to the output-machine elasticities reported in table 6. These elasticities are highest for the classical mills and least for the unionized mills. Inspection of tables 3 and 4 indicates that the average values of XIK are least for the classical mills and highest for the unionized mills. Again, when faced with similar machine prices, the classical mills' production function inclines them to make extensive use of machinery given their output, while the unionized mills' produc- tion function induces them to conserve on machinery given their output.
150 Brookings Papers: Microeconomics 1995
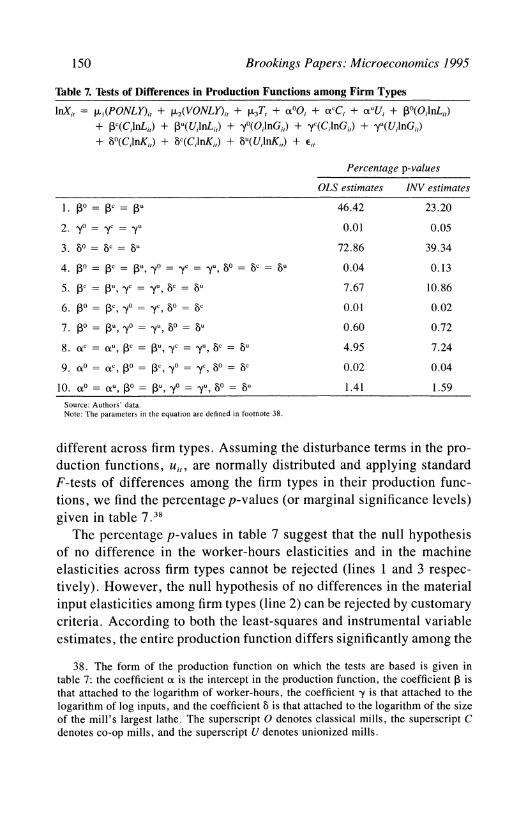
Table 7. Tests of Differences in Production Functions among Firm Types
InX,, = P,1(PONLY)h, + P,2(VONLY)h, + p,,T, + o&Oj + otCC + otUi + 13(OilnLi) + P3c(CjlnL,) + Pu(UjlnLiJ) + y0(OilnGi,) + yc(ClnGi) + yu(UilnGi,) + 80(CilnKJ,) + 8c(C lnKi,) + 8u(UilnKi,) + Ei,
Percentage p-values
OLS estimates INV estimates
1. PO = = r3u 46.42 23.20
2. yo = yC = Yu 0.01 0.05
3. 60 = 6c = bu 72.86 39.34
4 PO = c= 1u, y= = -yc = YU, 86 = 8c =u 0.04 0.13
5 Pc = P3U,yc = y, 6c = 6u 7.67 10.86
6. PO= 3c,yO= yc, 8O= 8c 0.01 0.02
7. p0 = Pu, yo = Yu, 80= 8u 0.60 0.72
8. (xc = tui c = pu, yc= Yu, 6c = 8u 4.95 7.24
9. o= Oc, O= Pc,yo= =,c 80 = 8o c 0.02 0.04
10. o0 = .u [30 = PU y = yU 86 = 6u 1.41 1.59 Source: Authors' data. Note: The parameters in the equation are defined in footnote 38.
different across firm types. Assuming the disturbance terms in the pro- duction functions, ui,, are normally distributed and applying standard F-tests of differences among the firm types in their production func- tions, we find the percentage p-values (or marginal significance levels) given in table 7.38
The percentage p-values in table 7 suggest that the null hypothesis of no difference in the worker-hours elasticities and in the machine elasticities across firm types cannot be rejected (lines 1 and 3 respec- tively). However, the null hypothesis of no differences in the material input elasticities among firm types (line 2) can be rejected by customary criteria. According to both the least-squares and instrumental variable estimates, the entire production function differs significantly among the
38. The form of the production function on which the tests are based is given in table 7: the coefficient ox is the intercept in the production function, the coefficient i is that attached to the logarithm of worker-hours, the coefficient y is that attached to the logarithm of log inputs, and the coefficient 8 is that attached to the logarithm of the size of the mill's largest lathe. The superscript 0 denotes classical mills, the superscript C denotes co-op mills, and the superscript U denotes unionized mills.

Ben Craig and John Pencavel 151
three firm types (line 4). In general, the classical mills' production function appears more distinctive than that of the co-ops or of the unionized mills.39
What do the estimated production functions in table 6 imply about overall production efficiency? Denote the vector of inputs and output by Z and X, respectively, and let 0 be the vector of estimated input- output elasticities. Zi denotes the inputs actually used by mill i, and O0 represents the input-output elasticities estimated with the data for firm type j (where j = 0 for classical mills, U for unionized mills, and C for co-ops). Then lnXj. represents the logarithm of output that mill i would have produced given its inputs Zi and given the estimated param- eters O: lnXi = lInZi.0'. Hence InX? (= lInZi.0) is the logarithm of the output of mill i when the input-output elasticities estimated to the ob- servations on the classical mills, 00, are applied to mill i's actual inputs, Z .40 These levels of output were predicted for all the mills using both the least-squares estimates and the instrumental variable estimates of the production functions.4'
Table 8 presents the average values of these predictions for each type of firm for the year 1980 and for a mill producing both plywood and veneer. Thus when the co-op mills are examined, the logarithm of their observed inputs multiplied by the production function parameters esti- mated from the classical mills' observations, 00, yields an average of log output of 4.820. When the logarithm of each co-op's observed inputs is multiplied by the production function parameters estimated from the unionized mills' observations, Ou, the average of the logarithm
39. In other words, according to line 5, the null hypothesis of no difference in the input-output elasticities of the co-ops' and unionized mills' production functions cannot be rejected by customary criteria. The corresponding null hypotheses regarding classical mills and co-op mills (line 6) and regarding classical mills and unionized mills (line 7) can be rejected.
40. Correspondingly, lnXc (= lnZ; * OC) is the logarithm of output of mill i when the input-output elasticities estimated to the co-op mills, Oc, are applied to the actual inputs used by this mill. The logarithm of output of mill i is lnXu' (= lnZ .0u) when the input-output elasticities estimated from the data on the unionized mills, Ou, are applied to the actual inputs used by this mill.
41. The form of the production function is that presented in table 7. It allows each firm type to have its own intercept and its own input-output elasticity. The effects of the time trend and the (PONLY) and (VONLY) variables were constrained to be the same across the firm types. For the predictions summarized in table 8, the coefficients on (PONLY) and (VONLY) are set to zero, and the time trend is assigned its value in the year 1980.

152 Brookings Papers: Microeconomics 1995
Table 8. Predictions of the Logarithm of Output for Production Function Parameters of Different Firm Types
Classical Co-ops' Union mills' mills'
Estimates parameters parameters parameters
Ordinary least-squares estimates Co-op mills' inputs 4.928 4.815 4.820 Union mills' inputs 4.857 4.718 4.715 Classical mills' inputs 4.007 3.583 3.482
Instrumental variable estimates Co-op mills' inputs 4.925 4.813 4.864 Union mills' inputs 4.850 4.710 4.740 Classical mills' inputs 3.906 3.492 3.453
Source: Aujthors' data.
Note: Each entry is the average value of the predictions over all mills within each firm type.
of output is 4.815. Finally, when the co-ops' production function pa- rameters, Oc, are applied to each co-op's inputs, the average of the logarithm of output is 4.928. In other words, according to the least- squares estimates of the production functions, the co-op estimated pa- rameters imply about a 10 percent higher output than do the estimated parameters for a classical mill (4.928 - 4.820 = 0.108) when applied to the levels of inputs actually used by the co-ops. Indeed, in each instance, the elasticities computed with the observations on the co-op mills generate higher output than the elasticities estimated from the observations on the conventional firms.42
A different way of assessing whether the production functions of these mills are materially different is to consider whether behavioral equations that are derivative of the production function also suggest differences among firm types. For instance, if these mills face approx- imately the same prices of output and inputs, then (assuming similar concern with net revenue maximization) differences in their production functions should imply differences in the output supply responses to changes of prices. We now turn to consider this implication.
42. This is consistent with (though not necessarily implied by) the estimated coef- ficients on C, in the first two columns of table 6, which suggested higher productive efficiency for the co-op mills of 13 to 15 percent.

Ben Craig and John Pencavel 153
Output Supply Functions
The equations reported in the previous section related a quantity, namely output, to other quantities, the inputs. In this section we inquire into differences among firms in the relationship between output and prices and ask whether the supply functions of the co-ops are different from the conventional firms'. There has been a large theoretical litera- ture speculating on the shape of the co-ops' output supply function, but remarkably little persuasive empirical research on the matter.43
Following the general log-linear form of equations 2 and 3, we start with the following supply equation:
(4) lnXit = c0 + CiC + c2UA + c3(PONLY)i, + c4(VONLY)i,
+ c51npi, + c61nri, + c71nwi, + c8lnst + cgTt + vit
where p is the real price of output, r is the real price of log inputs, w is the real hourly wage, and s is an index of the real price of machin- ery.44 T is a linear time trend, and vi, is a stochastic disturbance term. This equation would result if the mills have a cost function of the form
eBXY IrY2WY3SY4
and if they select an output at which their marginal cost is equal to price. If B is a linear function of C,, Ui, (PONLY)i,, (VONLY)it, a time trend, and a stochastic disturbance, then equation 4 is implied.
Because most labor is not a hired input for the co-ops, a cost function of this form has a different interpretation from that for the conventional firms. For the co-ops, the cost function is the outcome of the problem of producing an output such that (1) the cost of raw materials and machines plus (2) the disutility of labor is minimized. The relevant w
43. The seminal statement was, of course, Ward (1958) who showed that under some restrictive assumptions a co-op's output supply function would slope negatively with respect to its price. Although Ward demonstrated this was not a robust result, it remained a preoccupation in the theoretical literature for a long time.
44. The variable s is defined as P,,(8 + p)ICPI, where p is Moody's AAA domestic corporate bond rate, P,,, is a price index for machinery and equipment used in manufac- turing industry, 8 is an assumed depreciation rate of 0. 10, and CPI is the all items consumer price index. Data on p, P,Z, and CPI are found in the Economic Report of the President, January 1993, on pages 411, 418, and 428. The variable s varies over time but not across firms.

154 Brookings Papers: Microeconomics 1995
Table 9. Least-Squares Estimates of Output Supply Equations
Variable (1) (2) (3) (4) (5) (6)
Intercept 3.401 3.512 3.356 -0.446 -0.633 -0.293 (1.634) (1.617) (1.671) (2.387) (2.399) (2.417)
Cj 1.002 1.030 1.023 10.066 11.041 9.675 (0.199) (0.202) (0.200) (3.943) (4.075) (3.922)
Uj 0.959 0.957 0.956 6.405 6.622 6.140 (0.159) (0.159) (0.159) (2.941) (2.958) (2.928)
(PONLY)i, -0.010 -0.007 -0.008 -0.068 -0.072 -0.061 (0.143) (0.143) (0.143) (0.144) (0.144) (0.143)
(VONLY)i, -1.315 -1.317 -1.316 -1.293 -1.288 -1.296 (0.166) (0.167) (0.166) (0.166) (0.167) (0.167)
lnpi, 1.106 1.066 1.086 1.861 1.909 1.771 (0.452) (0.446) (0.446) (0.567) (0.569) (0.554)
Cflnpi,N. . A NTA. .A - 1.897 - 2.087 - 1.808 NAn .A NA. . . (0.826) (0.850) (0.821)
Uilnpi, -1134 -1.178 -1.080 N. A. N. A. N. A. (0.609) (0.613) (0.607)
Inri, -0.827 -0.811 -0.808 -0.668 -0.666 -0.633 (0.397) (0.397) (0.393) (0.398) (0.397) (0.397)
Inw,, -0.219 -0.102 -0.120 -0.249 -0.284 -0.208 (0.186) (0.188) (0.186) (0.195) (0.201) (0.195)
Ins, - 0.395 -0.414 -0.374 -0.544 -0.546 -0.509 (0.409) (0.408) (0.422) (0.411) (0.409) (0.422)
T, 0.005 -0.006 -0.003 -0.006 -0.006 -0.004 (0.018) (0.018) (0.019) (0.018) (0.018) (0.018)
Source: Authors' data. Note: Estimated standard errors are in parentheses. N.A. not applicable
in the co-ops' marginal cost equation is the marginal disutility (or opportunity cost) of labor. We use three different estimates of this marginal disutility: first, the observed hourly real earnings of co-op workers; second, the hourly real wage averaged each year over the unionized firms; and third, the hourly real wage averaged each year over the classical firms.
Columns 1, 2, and 3 of table 9 report least-squares estimates of the supply equation 4. In column 1, w for the co-op mills is taken to be their actual real hourly earnings; in column 2, the co-ops' w is that

Ben Craig and John Pencavel 155
predicted from the wage data for the union mills; in column 3, the co- ops' w is that predicted from the wage observations of the classical mills. The coefficient estimates in columns 1, 2, and 3 resemble those we would expect of firms in a competitive industry: supply rises with respect to output price with an elasticity of about unity; and supply falls with respect to the price of raw materials, labor, and machinery.45
The estimates reported in columns 4, 5, and 6 of table 9 are those that result when equation 4 is modified to allow the output price elas- ticity, c5, to differ among the three types of firms. According to the estimates in column 4 of table 9, the output price elasticity among classical firms is 1.86, while that attached to the interaction between lnpi, and Ci is almost exactly equal to the negative of 1.86. In other words, the output price elasticity among the co-op mills is considerably lower than that' for the classical firms. The unionized mills' output price elasticity is about 0.7 and lies between the classical mills' and the co- ops'. These coefficients are not measured with much precision, so the confidence intervals around the price elasticities are regrettably high.46 Nevertheless, here is evidence that the co-ops' supply response to changes in output prices is considerably lower than that among the classical firms, just as some of the theoretical literature has surmised. Indeed, some of the conventional firms in the plywood industry have complained of the co-ops' price-insensitive behavior.47
45. The coefficient of approximately unity on C, implies that, at the same prices, the co-ops' supply is about twice in logarithmic units that of the classical firms. This large difference is the consequence of the omission of factors in equation 4 accounting for plant size, the co-ops and the unionized mills having considerably larger plants than the classical mills. The difference between the estimated coefficients on C, and on Ui imply that, at the same prices, the co-ops supply between 4 and 7 percent more output than do the unionized firms. This difference between the co-ops and the union mills would not be judged as significantly different from zero by the customary criteria.
46. A test of the hypothesis that the coefficients on the interactions terms (that is, the coefficients on Cilnpi, and Uilnpi,) are jointly zero yields a p-value of 4.75 percent for the estimates in column 4. The test statistics for the other columns are very similar. Note the larger coefficients estimated for the dummy variables Ci and Ui in columns 4, 5, and 6. This is to be expected: if the co-ops' output-price elasticity is very low, then naturally the supply curve will rotate clockwise around the central tendency of its output- price observations and generate a higher intercept. The same argument applies to the unionized mills though the output-price elasticity is not as small as it is for the co-ops so the union mills' estimated intercept is not as large.
47. Writing in 1967, Berman observes, "The worker-owned companies are noto- rious in the industry for maintaining high-level output regardless of market conditions,

156 Brookings Papers: Microeconomics 1995
The equations whose estimates are reported in columns 4, 5, and 6 of table 9 permit the output price coefficients to vary by firm type, but restrict the other price coefficients to be the same. The estimates in table 10 relax this constraint by presenting estimates of equation 4 separately by firm type.48 Naturally, the estimates are very much less precise. The point estimates suggest that, in their output responses, the classical mills are very sensitive to the price of output, raw material inputs, and machinery. By contrast, the co-ops' supply is much less responsive to changes in input and output prices.49 The estimates for unionized firms seem to fall between those of the classical firms and those of the co-ops.
These differences in the output supply equations are consistent with the differences in the point estimates of the production functions in table 6. In particular, where the input-output elasticities of the produc- tion function are higher, the output-price responses of the supply equa- tion should also be greater. The classical firms tend to have higher output-input elasticities for raw materials and machines than do the co- op mills, and correspondingly the classical mills' output-price re- sponses tend to be larger in absolute value.
Of course, an alternative explanation for the differences between the output-price responses in table 10 of conventional firms and those of the co-ops is that they have different objectives. For instance, a co-op may maximize an objective function that has as arguments not merely net revenues, but also the employment of its members. In this circum- stance, even if the production functions of the co-op mills were identical to those of the conventional firms, their output-price responses would be different. These responses would depend upon the relative weight of employment and net revenues in their objective function. Therefore,
as their tendency to continue five- and even six-day operations has been widely blamed for aggravating price depression" (p. 199). Dahl (1957, p. 59) wrote that "the privately- owned mills . . . are particularly bitter because the worker-owned plants operate contin- uously regardless of market conditions."
48. As before, the estimates in column 1 of table 10 measure the co-ops' opportunity cost of labor as the observed hourly real wage paid in these mills. In columns 2 and 3, the co-ops' opportunity cost of labor is measured by the average real wage paid to workers in the unionized mills and in the classical mills, respectively.
49. The null hypothesis that the co-ops' estimated output elasticities with respect to input and output prices are the same as those of the classical mills yields a p-value of 3.32 percent for the estimates reported in column 1 of table 10. The p-values for the estimates in columns 2 and 3 are almost the same.

Ben Craig and John Pencavel 157
Table 10. Least-Squares Estimates of Output Supply Equations by Firm Type
Unionized Classical Co-op mills mills mills
Variable (1) (2) (3) (4) (5)
Intercept 6.888 7.009 9.507 6.587 5.835 (1.745) (1.524) (5.051) (2.198) (5.211)
(PONLY)i, 0.162 0.194 0.157 -0.139 -0.100 (0.127) (0.128) (0.126) (0.156) (0.843)
(VONLY), N.-A. N.1A. N.A. 1098 -1.612 NA. NA. NA. ~~~~~(0.191) (0.633)
Inpi, 0.022 0.333 - 0.289 0.470 2.636 (0.556) (0.516) (0.778) (0.538) (1.562)
Inri, -0.550 -0.674 -0.775 -0.360 -2.414 (0.383) (0.373) (0.483) (0.455) (1.646)
Inw,, 0.044 -0.742 0.573 -0.704 0.011 (0.266) (0.778) (1.000) (0.268) (0.501)
Ins, 0.062 0.122 -0.486 - 0.594 - 1.612 (0.314) (0.303) (1.025) (0.561) (1.278)
T, 0.007 0.001 0.038 -0.001 0.046 (0.013) (0.014) (0.056) (0.024) (0.061)
Source: Authors' data. Note: Estimated standard errors are in parentheses. N.A. not applicable
the differences in the output-price responses between the co-op mills and those of the classical mills do not necessarily imply differences in the underlying production functions. However, the differences across the firm types in the point estimates of the output supply equations are consistent with the point estimates of the production function reported in table 6.
Conclusions
The evidence we have assembled here suggests three classes of find- ings. First, input-output ratios among the three types of mills in the plywood industry of the Pacific Northwest are different. The differences are related to differences in their production functions: higher input- output ratios tend to be found where production function input-output elasticities are lower.

158 Brookings Papers: Microeconomics 1995
The second class of findings relates to these production functions. Though the production functions of the mills may not be identical, there is not much to distinguish these types of firms in terms of overall production efficiency. What differences we have found imply that co- ops are more efficient than the principal conventional firms by between 6 and 14 percent (as suggested by the results reported in table 8).50 There is little difference between the efficiency of the unionized and classical mills (again as suggested by table 8).
The third class of findings relates to the output supply functions of these firms. If these firms face the same product and input prices and if these firms share a concern with net revenues, then differences in pro- duction functions should imply differences in output supply functions; indeed, this is what we find. The classical mills with the highest input- output elasticities in their production function have the highest output- price responses in the estimated supply function; the co-ops tend to have the smallest input-output elasticities in their production function and also the smallest output-price responses in their supply function.
Our research on this important case study suggests that worker par- ticipation has neither major efficiency gains nor efficiency losses. If these beneficial or deleterious effects are present, they are of secondary importance. This does not mean that there are no important differences among these types of mills. On the contrary, we have argued in other research that the co-op mills behave in quite different ways from the conventional firms. When faced with adversity, the co-ops adjust pay and avoid changes in their labor inputs and output; by contrast, when confronted with drops in output price, conventional firms adjust em- ployment and work hours (and consequently output), and wages do not change. These are important differences, but they do not relate to the
50. This is the range of differences between the predicted outputs across the columns of table 8 for the lines corresponding to "co-op mills' inputs" and "union mills' inputs." The differences for the "classical mills' inputs" are much larger, and this might suggest an alternative explanation for these production patterns. The co-ops and unionized firms are similar in size, while the classical firms are much smaller. It could be that all three types of firms operate at different points on the same nonhomothetic production function. We estimated the first-order conditions from the nonhomothetic production function defined in footnote 31, and we simulated the resulting parameters (that were not estimated precisely) to determine whether there was evidence of changes in returns to scale by size. Our estimates of decreasing returns to scale changed very little with the level of inputs and outputs.

Ben Craig and John Pencavel 159
technical conditions of production that this paper suggests are similar across the three types of firms.
The small differences across these mills in the technical conditions of production explain why over a period of 70 years conventional firms and cooperatives have co-existed in the same industry and the same location. If the co-ops have been slightly more efficient producers, then their dominance has been offset by their capital market difficulties mentioned above. If their superiority in production were greater, it is likely their capital market obstacles would have been overcome, and cooperatives would have dominated the industry.
Interestingly, as plywood production has moved to the South, the cooperative organization has not moved with it. Why? We speculate that a conjunction of several factors accounts for the durability of the plywood co-ops in the Pacific Northwest and have obstructed its trans- plantation to the South. The establishment and success of the first co- op in the plywood industry in Washington state were the product of the foresight of some shrewd men who, prior to its formation, were already skilled in the work relevant to plywood production and who shared a common Scandinavian heritage. This co-op served as the model for many imitators in the area.
These factors seem to be present in other sectors where cooperatives have been important. In many instances, a group of workers with train- ing in a given line of work and who share cultural ties form a collective organization that enjoys remarkable success. It serves as a prototype, and other firms are established along the same lines so that the coop- erative form of organization constitutes a substantial component of the industry. For example, this pattern applies to Boston's Independent Taxi Operators Association, which involved many Jewish immigrants from Eastern Europe, and it applies to the scavenger companies in the San Francisco Bay Area whose owner-workers were predominantly of northern Italian origin. At the same time, the dilution of the common ties of ethnicity has contributed to the decline of the cooperatives in these two sectors: in the case of the taxi cabs, new immigrants from the Soviet Union brought different attitudes to the cooperative, attitudes that emphasized short-term monetary gain over long-term investments, while in the case of the scavenger companies, the core Italian members resisted the growing presence of Hispanic and Black workers and as a

160 Brookings Papers: Microeconomics 1995
result found themselves presented with a class action discrimination suit.
When workers share similar values, disputes within the producing unit are less likely to occur, monitoring costs tend to be lower, and social sanctions are probably more effective in deterring malfeasance. If such "cultural" factors are important in understanding the pattern and success of worker co-ops in the United States, then the value of the international comparisons of organizations that are so common today is questionable. Thus it has become routine to contrast the internal struc- ture of Japanese firms with that of U.S. firms, and the common sug- gestion is that the performance of U.S. firms would improve if only they emulated the Japanese. If one of the factors contributing to the success of firms is closely tied to nonreproducible cultural factors, as the study of cooperatives in the United States would suggest, then U.S. firms may experience no more success by copying the internal structure of Japanese firms than plywood companies in the South would enjoy by imitating the worker-owned companies of the Pacific Northwest.

Comments and Discussion
Comment by Henry Farber: This paper is the third in a series by Craig and Pencavel comparing the economic behavior of cooperative firms in the Pacific Northwest plywood industry with the behavior of nonunion (or classical) and union firms in the same industry. The first paper, published in the American Economic Review, examined differential responses of employment and wages to changes in output and concluded that cooperatives adjust wages more and employment less in response to output changes than do other types of firms. The second paper, published in the Journal of Political Economy, corroborates and ex- pands on these findings from a somewhat different theoretical perspec- tive. Their new paper addresses the question of the productivity of cooperative firms relative both to nonunion and union firms. As such, it fills an important niche left unexplored by the earlier papers. I
This paper is carefully done, and the central conclusion is that co- operative firms are somewhat more productive (about 6 to 14 percent) than are other types of firms in the sense that output is predicted to be that much higher when a fixed set of inputs is used in a cooperative firm rather than in a classical or union firm. Not surprisingly, I have a few quibbles with choices made and roads not taken, but my overall assessment is that the analysis is sound and informative.
The efficiency of cooperative firms can be compared with that of other types of organizations in at least two ways. The first is the effi- ciency with which the enterprise chooses its inputs. The earlier work by Craig and Pencavel provides clear evidence that cooperatives choose
1. See Craig and Pencavel (1992) and Pencavel and Craig (1994).
161

162 Brookings Papers: Microeconomics 1995
their inputs differently, particularly in how they adjust to changes in demand. The fact that labor inputs in cooperative firms exhibit less fluctuation over time than do labor inputs in union and classical firms is clear evidence that the efficiencies are different.
The second sense of efficiency, the efficiency with which a fixed set of inputs is converted into output through the production process, is the focus of the current paper. My remarks focus on this analysis. But it should be kept in mind that a full evaluation of the economics of cooperative ventures needs to consider input choice as well as input usage.
The paper starts with a discussion of reasons why cooperatives might be more productive than other types of firms. Virtually all of this dis- cussion focuses on agency explanations regarding monitoring by fellow worker-owners, less need for monitoring by managers, and so forth. The authors also note that cooperative firms might be able to attract more productive workers.
Next is an interesting discussion of why cooperative firms are so scarce generally if there is any substantial productive advantage. Much of this discussion focuses on capital market problems. For example, workers might have trouble collateralizing loans used to buy shares in their firm. Or investing in the firm in which a worker is employed does not diversify the worker's overall portfolio. One potential explanation for the scarcity of cooperatives that is unrelated to capital market prob- lems and that Craig and Pencavel do not examine is related to a point made in the conclusion to the paper: an important factor in the formation of cooperatives is a social or ethnic commonality among the potential worker-owners. It may be that such commonality of background com- bined with an interest in working together is relatively rare.
After a detailed description of the plywood industry and of the struc- ture of the cooperatives, the central question of productivity is dis- cussed. The necessary discussion of potential endogeneity of ownership structure is clear, but, absent a real experiment, we must simply stip- ulate that the analysis proceeds conditional on ownership structure.
Now comes the data description and empirical analysis. The plywood mills are classified two ways: by ownership structure (classical, union, cooperative), and by type of output (plywood only, veneer only, ply- wood and veneer). It may be more important than the authors admit that the ownership structure is not distributed randomly among the

Ben Craig and John Pencavel 163
output types.2 The cooperative mills are disproportionately plywood- only mills. The classical mills are disproportionately veneer-only mills. The union mills represent both types more equally, but virtually all of the combined mills are union mills.
A related point is that the authors (to their advantage) are using a physical measure of output (3/8 inch equivalent square feet or sheets). But it is hard to see how this measure is strictly comparable across output types. Producing veneer (soaking the logs, stripping the veneer from the log) and producing plywood (layup of the veneer, sorting, and gluing) are simply different processes.
My intuition is that the production processes (and, hence, production functions) likely differ across output types. The fact that ownership type is not distributed randomly suggests some systematic selection of ownership type by production process. After some preliminary testing that finds no significant differences by output type, the empirical anal- ysis that follows generally allows only for intercept shifts by output type, while allowing for more complete interactions with ownership type. It may be the case that part of what is measured as differences by ownership type may be differences by output type that cannot make themselves heard any other way.
A puzzle, evident in the simple statistics in table 1, is noted but not really discussed in the paper. The real price of logs rose by a factor of about 4 between 1960 and 1992, while the real price of plywood was relatively stable over this period. Thus, this is an industry where there has not been much technological change and where the price of the raw material, which makes up a significant fraction of costs, increased dramatically, while the product price was roughly fixed. One would expect the product price to increase as well. A first approximation would be to multiply the proportional change in the raw material price (four times) by the share of log costs in total costs (about 0.5 based on the Cobb-Douglas production function estimates). Thus, plywood prices would have been expected to double. I do not have a good explanation for the relative stability of plywood prices. Perhaps tre- mendous quasi rents were being earned in this industry 30 years ago that no longer exist. This remains a puzzle.
2. A two-way table I constructed from Craig and Pencavel's table 2 has a p-value from a chi-squared test of independence of 2.2 x 10- 10.

164 Brookings Papers: Microeconomics 1995
The central empirical results are presented in table 4, which contains estimates of output per unit input for three inputs: labor, logs (timber), and capital. I am somewhat concerned by the capital measure, which is the size of the largest lathe in the mill. Surely what is needed is a measure of total capital input, and the implication of the discussion is that mills can have more than one lathe. Using the size of the largest lathe seems (to my technically uninformed eye) to be akin to measuring labor input by the height or weight of the largest worker. Perhaps the total length of all lathes would be a better measure. At the least, some discussion of how closely the size of the largest lathe correlates with scale of production is needed.
Some very interesting contrasts are apparent in table 4. Cooperative mills and union mills produce less output per labor input than do clas- sical mills. Offsetting this, cooperative mills produce more output per log input and per capital input than do classical mills. On balance, the cooperative mills and union mills look fairly similar on output-per-unit- input grounds, and both types differ fairly substantially from classical mills .3
Next is an analysis, in table 5, of output per unit input as a function of the ratio of the input price to the output price, including intercept shifts for ownership type and output type. I would like to see the price ratio unconstrained to allow independent estimates of the input and output price effects. I would also like to see more discussion of the instruments (particularly the wage measures) and tests of the overiden- tifying restrictions. Finally, it would be useful to see the OLS estimates as well as the first-stage regressions.
In the end, I would skip these estimates and jump right to the pro- duction function estimates in table 6 where log output is regressed on the log of all inputs and dummy variables for ownership and output types. Both OLS and IV estimates are presented, and the results are similar. Unconstrained specifications with separate equations for each ownership type are also presented. The results of this exercise are fairly clear. Cooperative mills have higher output conditional on inputs and output type. The evidence is also fairly clear that the capital measure
3. This general characterization of the results has been noted in Craig and Pencavel's earlier work.

Ben Craig and John Pencavel 165
(maximum lathe size) is not significantly related to output controlling for other inputs. Finally, the input of logs (timber) is only weakly related to output in cooperative mills.
I have only a couple of comments on these estimates. First, the overidentifying restrictions in the IV estimates should be tested. Sec- ond, and perhaps more important, it might be that the right way to break down the sample is not by ownership type but by output type.
Table 8 contains the final product of the analysis. Taking, in turn, the estimates from table 6 of the production functions by ownership type, Craig and Pencavel predict output using, in turn, the inputs by ownership type. The results are two sets of nine predicted outputs (three sets of parameters by three sets of input types by two estimation pro- cedures, OLS and IV). These estimates show a productivity advantage to cooperative mills of 8 to 10 percent. Unfortunately, no standard errors are provided for these predicted values or for key differences.
The last part of the paper examines output supply as a function of input and output prices. The interesting result of this analysis is that output is strongly related to output price only for classical firms. The point estimate of the elasticity of output with respect to output price is zero for cooperatives and (probably) insignificantly different from zero for union firms. The result for cooperatives is not terribly surprising. Craig and Pencavel's earlier work demonstrated that cooperatives ab- sorb demand fluctuations more in earnings than in employment, which implies relatively little output fluctuation. The surprising result here is that output of union firms is relatively insensitive to price. The usual view of union firms is that wages are rigid so that all adjustment must take place in quantities. That does not seem to be what is happening here, and this is a puzzle.
In summary, there is a clear result from the analysis. Cooperative firms do seem to produce moderately more output with a given set of inputs. We remain in the dark, however, about exactly (or even ap- proximately) why that might be the case. Some hints (empirical and theoretical) are contained in the paper. One is that the output per log is highest in cooperative mills. Another is the view that cooperatives have different objectives (employment stabilization?) than do other types of mills. Both of these suggest that the production process has a different focus in cooperative mills. One is left with the puzzle of whether the

166 Brookings Papers: Microeconomics 1995
(seeming) focus on employment stabilization in cooperative mills has productivity advantages that are at the core of the central findings in this interesting paper.
Comment by Alan Krueger: This paper is well written and topical. Indeed, for reasons I'll detail shortly, the paper may even be more topical now than the authors realized when they wrote it. The empirical work is thorough and straightforward. I especially commend Craig and Pencavel's efforts collecting and analyzing a new data set. I also com- mend their strong knowledge of the institutions of the plywood industry.
I said the paper may be more topical than the authors realized when they wrote it because, since then, Richard Freeman and Joel Rogers released results of a large survey of workers that found, "The vast majority of employees want more involvement and greater say in com- pany decisions affecting the workplace. "' The New York Times, Wash- ington Post, and Wall St. Journal recently ran stories on the "partici- pation gap." Freeman and Rogers also find that more than three- quarters of workers feel that giving workers more say in decisions about production would increase competitiveness, improve quality, and im- prove worker satisfaction. Perhaps most interesting, workers-by a 3- to-I margin-would prefer a powerless organization that management cooperates with to a powerful organization that management does not cooperate with. Freeman and Rogers conclude that workers want more cooperative and participatory arrangements.
Craig and Pencavel pose cooperatives as an extreme form of partici- pation. If cooperatives do not increase productivity, then lesser forms of employee participation will not either. They then investigate whether productivity is higher among plywood firms organized as cooperatives than among traditional (union or nonunion) management-owned ply- wood companies. This is a sensible hypothesis, although one may ques- tion whether the plywood industry is the right place to investigate this hypothesis.
I suspect employee participation helps productivity the most in in- dustries in which technology is subject to change, and workers play a role in developing new technology. My guess is that employee coop- erative or participatory arrangements have their greatest payoff when
1. Freeman and Rogers (1994).

Ben Craig and John Pencavel 167
workers are less inhibited about developing innovations because they don't fear losing their jobs from labor-saving innovations. The authors point out that technology in the plywood industry has been stable. In addition, the time trends in their production functions are usually insig- nificant, which suggests that technology has been stable. This makes me question the generality of testing their hypothesis in this industry.
Nevertheless, Craig and Pencavel's work represents the most so- phisticated quantitative analysis of cooperative arrangements to date. And cooperatives in the plywood industry are the oldest and most du- rable cooperatives in all of U.S. manufacturing. I liked their previous paper in the American Economic Review on this topic, and I like the current paper.2
Many of the questions I thought of while reading this paper were answered later in the text. The authors free up coefficients; try different production functions; control for different combinations of inputs. In- deed, the best way to read this paper is from the back forward. Skip to the production functions (table 8).
Craig and Pencavel's bottom line on productivity is that cooperatives may raise productivity by 6 to 14 percent over conventional firms. (They don't mention the much greater implied productivity effects when the classical mills' inputs are used as weights.) In addition, unionized mills are about as productive as classical mills.
They provide several caveats in interpreting these results. I would add the following to the list:
First, the sample sizes are small, and thus the standard errors are big. There are only 34 plants and just 7 cooperatives in the sample.
Second, the instrumental variables (IV) estimates are open to ques- tion. The instruments include prices and establishment dummies. But the establishment dummies may be correlated with the error components that the IV estimate is meant to overcome. Furthermore, the instrument list includes 34 establishment dummies and prices, with only 170 ob- servations. The first stage equation may overfit, since there are only 3 or 4 degrees of freedom per moment estimated. I'm concerned about finite sample bias toward OLS in these estimates. (Indeed, the IV coef- ficients almost look "too" much like the OLS coefficients.)
Third, there is the perennial problem of whether the cooperatives
2. See Craig and Pencavel (1992).

168 Brookings Papers: Microeconomics 1995
differ in unobserved ways, on average, from the noncooperatives. Craig and Pencavel discuss this issue, and they try to control for differences in capital, and so on. But the type of capital may differ. For example, cooperatives may work existing capital longer because they take better care of it. The fact that the capital measure (lathe length) has no effect on output makes me wonder if capital is adequately controlled.
Fourth, quality of output may differ. Since cooperatives may affect quality, this issue is of even more importance.
Lastly, I thought it would be useful to explore the union-classical mill distinction further. There have been many establishment-level studies of the effect of unions on productivity in other industries (ce- ment, construction, and paper mills). How do the present results relate to this literature? How can union mills stay in business if they pay 14 percent more than the cooperatives and classical mills but are only as productive as the classical mills? The union mills look like the coop- eratives in many respects (for example, factor shares and size), but why are they less productive? Why do they have similar production functions and factor shares?
Craig and Pencavel conclude, "Worker participation has neither ma- jor efficiency gains nor efficiency losses." I found this conclusion rather bold given the imprecision of the estimates. Moreover, a 14 percent increase in productivity could be considered a major gain. To achieve this large a gain, one would have to increase logs by some 30 percent.
One useful standard of comparison for the productivity effect would be the estimated productivity effect in the literature on profit sharing. Marty Weitzman and Doug Kruse survey this literature and conclude that on average profit sharing raises productivity by about 4.5 percent.3 This is a small but significant productivity boost. But the costs are probably not very big either. Craig and Pencavel find a productivity effect that is substantially larger.
Another point they make in the conclusion that I found provocative is the suggestion that "nonreproducible cultural factors" are responsi- ble for the existence of cooperatives in plywood. I call this provocative because I couldn't find the coefficient that relates to culture anywhere in the paper. Nevertheless, they draw a caution between comparing
3. Weitzman and Kruse (1990).

Ben Craig and John Pencavel 169
Japanese and American organizational structures due to cultural differ- ences. This caution is probably warranted, but it is difficult to distin- guish between the cultural interpretation and multiple equilibrium- alternative forms of organization are possible if everyone is doing it.
There may be something to the cultural interpretation in plywood, however. If this is the case, then the productivity figure of 6 to 14 percent may be an overstatement.
Authors' Response: Henry Farber claims our paper contains two "puz- zles." The first puzzle arises from the fact that "the real price of logs rose by a factor of about 4 between 1960 and 1992, while the real price of plywood was relatively stable over this period. . . . One would ex- pect the product price to increase as well." There is no puzzle here. The depletion of first-growth timber forests and the restrictions on log- ging due to environmental concerns caused log prices in the Pacific Northwest to rise. By comparison, the price of plywood output was kept down by the entry of new mills located principally in the South. So costs in the Pacific Northwest have risen, output prices have not changed materially because of the almost costless entry of new mills in other parts of the country, and the industry in the Northwest has shrunk drastically.
Farber's second "puzzle" arises from the fact that, according to the estimates of the output supply function in table 9, the estimated output- price elasticity of union firms is about 0.7. Farber writes, "The sur- prising result here is that output of union firms is relatively insensitive to price. The usual view of union firms is that wages are rigid so that all adjustment must take place in quantities. That does not seem to be happening here, and this is a puzzle." Why is an elasticity of output with respect to output price of 0.7 not compatible with adjustment of quantities? What supply elasticity would be compatible?
General Discussion: Several participants argued that the paper showed clear and striking differences among the cooperative, union, and clas- sical plywood mill types that warrant additional analysis. Henry Aaron pointed out that classical mills differ from the other two types in that they are much smaller on average and have dramatically higher output per labor hour. These differences suggest enormous heterogeneity in the industry, he said, adding that the classical mills might really be

170 Brookings Papers: Microeconomics 1995
involved in a different line of business. Noting that the three types of firms appeared to use vastly different production mixes, Sam Peltzman wondered whether the authors could be confident in drawing conclu- sions about level differences in their production functions.
In response, Pencavel agreed that average ratios of labor to raw materials were, indeed, quite different across the three types of firms. The paper had gone to some length to account for these differences in the mean values, he said. In addition, there are considerable variations around these means. For example, many of the observations on the co- ops' input mixes are similar to the average values of the unionized firms' input mixes and, similarly, observations on the unionized firms' input combinations resemble the average values of the co-ops' input combinations. In general, the observations on the ratio of labor to raw material inputs reveals considerable overlap in these input proportions across firm types.
After Frank Lichtenberg noted that the returns to scale differed rad- ically among the three firm types, Peter Reiss argued that the produc- tivity differences among them might be largely driven by this factor, as well as by the differences in their input mixes. He said that the authors could separate out these effects relatively easily with their pro- duction functions.
Considerable discussion surrounded the possible special character- istics of cooperative mills that allow them to be more productive than both union and classical firms. F.M. Scherer speculated that the ethnic communities from which the cooperatives were formed might have been located in remote areas close to virgin forest and, as a result, nearer to larger logs than the other mills, which would provide an explanation for their higher output yields per log. Ben Craig disagreed, arguing'that many of the co-ops are actually in highly settled areas, including one each in Tacoma and Seattle; conversely, it is the classical mills which tend to be in the most remote areas.
Karl Scholz suggested that other factors in addition to nonreprodu- cible cultural factors are a key to the success of the cooperative mills. He noted that studies have demonstrated that companies with employee stock ownership plans (ESOPs) are slightly (2 to 3 percent) more pro- ductive than traditional firms. The paper's results showing that coop- erative mills are on average 6 to 14 percent more productive than the
Ben Craig and John Pencavel 171
other two types are consistent with such studies because co-op workers usually do not hold all of their firm's equity through ESOPs.
Kathryn Shaw wondered whether the workers at cooperative plywood mills have adopted special management practices-such as problem-solving teams or a high degree of worker interaction-that enable them to be so productive and that might be transferable to noncooperative firms. Soci- ological literature on the plywood cooperatives, Ben Craig responded, generally shows that their workers behave like those in other companies and, in addition, that co-op members and nonmembers at the same mill behave similarly. The literature does, however, argue that productivity in cooperatives may be enhanced by less shirking and monitoring than in traditional firms. John Pencavel added that the cooperative mills are gen- erally dirtier and more dangerous than the others, possibly because their workers regard themselves as private entrepreneurs and are, as a conse- quence, willing to take greater risks than those in conventional firms. Hans Gersbach asked about the control mechanisms that the co-ops use to overcome the free-rider problem and reduce shirking. Craig said that workers can easily pick out shirkers and that disciplinary methods for habitual shirkers can ultimately include being stripped of the right to work-which forces the shirker to sell his share in the cooperative.
Noting that the plywood industry in the Northwest was shrinking dra- matically during the period of the paper's analysis, Ariel Pakes asked about the role of cooperatives and unions in industry restructuring, partic- ularly with regard to firm mergers. Pencavel answered that, although the industry was moving to the South, little restructuring was actually occur- ring in the Northwest. Craig added that, when co-ops went under, it was typically because they had logged out all of their timber or because their land had become so valuable that they decided to sell it and divide the proceeds among their members. Pencavel noted that most logs in the Northwest are currently harvested from government-owned land. Paul Jos- kow asked whether any cooperatives had formed in the South. Craig said that, although no co-ops had sprung up there, three existing mills had gone co-op in the Northwest in recent years, despite the overall decline of the industry in that region.
Questioning whether the output of the three types of mills is identical, Zvi Griliches asked if plywood is a genuinely homogenous product. Craig said that, although there are some special grades of plywood, the vast
172 Brookings Papers: Microeconomics 1995
majority of the mills are primarily producing softwood, exterior grade plywood, which, despite brand names, is essentially the same product.
Michelle White noted that the literature on Yugoslav worker-owned companies has shown that over time they often begin to hire employees as nonowners, thereby gradually degenerating into traditional firms. Craig said that, although some of this phenomenon was observed over the twenty-year period examined in the paper, many plywood cooperatives have continued to maintain high membership ratios.

Ben Craig and John Pencavel 173
References
Alchian, Armen A., and Harold Demsetz. 1972. "Production, Information Costs, and Economic Organization." American Economic Review 62 (De- cember): 777-95.
Berman, Katrina V. 1967. Worker-Owned Plywood Companies: An Economic Analysis. Washington State University Press.
Berman, Katrina V., and Matthew D. Berman. 1989. "An Empirical Test of the Theory of the Labor-Managed Firm." Journal of Comparative Econom- ics 2 (June): 281-300.
Bonin, John P., Derek C. Jones, and Louis Putterman. 1993. "Theoretical and Empirical Studies of Producer Cooperatives: Will Ever the Twain Meet?" Journal of Economic Literature 31 (September): 1290-1320.
Bowles, Samuel, and Herbert Gintis. 1993. "The Democratic Firms: An Agency-Theoretic Evaluation." In Markets and Democracy: Participation, Accountability, and Efficiency, edited by Samuel Bowles, Herbert Gintis, and Bo Gustafsson, 13-39. Cambridge University Press.
Craig, Ben, and John Pencavel. 1992. "The Behavior of Worker Cooperatives: The Plywood Companies of the Pacific Northwest." American Economic Review 82 (December): 1083-1105.
Dahl, Henry G., Jr. 1957. "Worker-Owned Plywood Companies in the State of Washington." Everett, Wash.: The First National Bank of Everett. Un- published paper. April.
Estrin, Saul, Derek C. Jones, and Jan Svejnar. 1987. "The Productivity Effects of Worker Participation: Producer Cooperatives in Western Economies. Journal of Comparative Economics 11 (March): 40-61.
Freeman, Richard, and Joel Rogers. 1994. "Worker Representation and Par- ticipation Survey: First Report of Findings." Harvard University, Depart- ment of Economics. Mimeo. December.
Gintis, Herbert. 1990. "The Principle of External Accountability in Compet- itive Markets." In The Firm as a Nexus of Treaties, edited by Masahiko Aoki, Bo Gustafsson, and Oliver E. Williamson, 289-302. London: Sage Publications.
Greenberg, Edward S. 1986. Workplace Democracy: The Political Effects of Participation. Cornell University Press.
Grunberg, Leon. 1991. "The Plywood Cooperatives: Some Disturbing Find- ings." In International Handbook of Participation in Organizations for the Study of Organizational Democracy, Co-operation, and Self-Management, edited by Raymond Russell and Veljko Rus. Vol. II: Ownership and Par- ticipation, 103-22. Oxford University Press.
Gunn, Christopher Eaton. 1984. Workers' Self-Management in the United States. Cornell University Press.
174 Brookings Papers: Microeconomics 1995
Klein, Benjamin, Robert G. Crawford, and Armen A. Alchian. 1978. "Ver- tical Integration, Appropriable Rents, and the Competitive Contracting Pro- cess.'" Journal of Law and Economics 21 (October): 297-326.
Levine, David I., and Laura D'Andrea Tyson. 1990. "Participation, Produc- tivity, and the Firm's Environment." In Paying for Productivity: A Look at the Evidence, edited by Alan S. Blinder, 183-237. The Brookings Institu- tion.
Meade, James E. 1972. "The Theory of Labour-Managed Firms and of Profit Sharing." The Economic Journal 82 (March): 402-28.
Pencavel, John, and Ben Craig. 1994. "The Empirical Performance of Ortho- dox Models of the Firm: Conventional Firms and Worker Cooperatives." Journal of Political Economy 102 (August): 718-44.
Shull, Marcus, and Lisa Zager. 1994. "Factors Affecting the International Softwood Lumber Market, 1987-93." Monthly Labor Review 117 (Febru- ary): 21-29.
Slichter, Sumner H. 1968. Union Policies and Industrial Management. The Brookings Institution.
Ward, Benjamin. 1958. "The Firm in Illyria: Market Syndicalism." American Economic Review 48 (September): 566-89.
Weitzman, Martin L., and Douglas L. Kruse. 1990. "Profit Sharing and Pro- ductivity. " In Paying for Productivity: A Look at the Evidence, edited by Alan S. Blinder, 95-142. Brookings.