participant referral rate in the national eye health ... · the united states and reported referral...
TRANSCRIPT
RESEARCH ARTICLE
Participant referral rate in the National Eye
Health Survey (NEHS)
Stuart Keel1, Pei Ying Lee1, Joshua Foreman1,2, Peter van Wijngaarden1,2, Hugh
R. Taylor3, Mohamed Dirani1*
1 Centre for Eye Research Australia, University of Melbourne, Melbourne, Victoria, Australia, 2 Department
of Ophthalmology, University of Melbourne, Melbourne, Victoria, Australia, 3 Indigenous Eye Health Unit,
Melbourne School of Population and Global Health, The University of Melbourne, Melbourne, Victoria,
Australia
Abstract
Purpose
To present the rates of referral of participants in the National Eye Health Survey (NEHS) for
further eye care.
Materials & methods
A national sample of 3098 non-Indigenous Australians aged 50–98 and 1738 Indigenous
Australians aged 40–92 years living in 30 randomly selected sites was recruited using a
door-to-door approach. Participants completed a general questionnaire and a series of eye
tests, including vision and anterior segment assessment, intra-ocular pressure measure-
ment, visual field testing and fundus photography. A predefined protocol was used to guide
the referral of participants for follow up eye care. An ophthalmologist was on-call to assist
with the triaging of participants.
Results
Of the total sample, 32.1% (994/3098) of non-Indigenous participants and 43.6% (757/
1738) of Indigenous participants were referred for further eye care (p<0.001). A significant
difference in referral rates for Indigenous Australians was observed between regions of dif-
fering geographic remoteness [range = 32.2% (Inner Regional)—60.4% (Very Remote),
p <0.001]. After adjusting for covariates, males (OR = 1.24, 95% CI: 1.06–1.46), older age
(OR = 1.02 per year, 95% CI: 1.01, 1.02) and longer time since previous eye examination
(OR = 1.15 per year, 95% CI: 1.12, 1.19) were associated with higher rates of eye care refer-
ral in the non-Indigenous population. In the Indigenous population, older age (OR = 1.02 per
year, 95% CI: 1.01–1.03), self-reported diabetes (OR = 1.70, 95% CI: 1.37–2.12), greater
geographical remoteness (OR = 1.19, 95% CI: 1.09–1.29) and longer time since previous
eye examination (OR = 1.10 per year, 95% CI: 1.07, 1.13) were associated with a higher
rate of referral after multivariate adjustments. A total of 25 participants (1.4%) were referred
for urgent follow-up of potentially sight threatening conditions.
PLOS ONE | https://doi.org/10.1371/journal.pone.0174867 April 4, 2017 1 / 12
a1111111111
a1111111111
a1111111111
a1111111111
a1111111111
OPENACCESS
Citation: Keel S, Lee PY, Foreman J, van
Wijngaarden P, Taylor HR, Dirani M (2017)
Participant referral rate in the National Eye Health
Survey (NEHS). PLoS ONE 12(4): e0174867.
https://doi.org/10.1371/journal.pone.0174867
Editor: Fakir M Amirul Islam, Swinburne University
of Technology, AUSTRALIA
Received: August 24, 2016
Accepted: March 16, 2017
Published: April 4, 2017
Copyright: © 2017 Keel et al. This is an open
access article distributed under the terms of the
Creative Commons Attribution License, which
permits unrestricted use, distribution, and
reproduction in any medium, provided the original
author and source are credited.
Data Availability Statement: Due to ethical
restrictions relating to the data of Indigenous
participants in this study we are not able to make
our data available in a public repository. Data
specific to this paper will be available to interested
researchers. All interested researchers may contact
Dr Mohamed Dirani from the Centre for Eye
Research Australia to request the data. Dr.
Mohamed Dirani may be reached at +61 3 8532
1976 or [email protected].
Funding: The National Eye Health Survey was
funded by the Department of Health of the

Conclusions
Our data has identified several high risk groups that required ophthalmic referral including
older Australians, non-Indigenous men, Indigenous Australians with self-reported diabetes
and those residing in very remote populations who may benefit from improvements in the
provision and/or uptake of eye health services. Future longitudinal research is warranted to
evaluate the feasibility and efficacy of implementing a referral protocol within a population-
based research setting.
Introduction
In 2012 the World Health Organisation (WHO) reported that more than 300 million people
worldwide were vision impaired or blind [1]. It has been estimated that 80% of vision
impairment and blindness can be treated or avoided through early detection and prevention
[2]. In Australia, two state-based studies (n = 8909) conducted in the early 1990s collectively
estimated that 480,300 Australians had vision impairment (visual acuity <6/12), including
50,600 with blindness (visual acuity <6/60) [3]. The National Eye Health Survey (NEHS) com-
menced in 2015 with the aim of providing up-to-date national data on the prevalence of vision
impairment and blindness in Indigenous and non-Indigenous Australians. The NEHS testing
protocol included predefined referral guidelines to ensure that participants with low vision,
those suspicious for eye disease and those that do not adhere to recommended guidelines for
general or diabetes ocular examinations were referred to the most appropriate healthcare pro-
vider in a timely fashion.
Most population-based eye health studies either fail to include referral guidelines in their
study protocols, or do not report referral rates or the reasons for referral [4–8]. Only a few
studies have reported referral rates for follow up eye care and most of these relate to eye
screening programs as opposed to population-based studies [9,10]. For instance, Friedman
and co-workers (2012) evaluated a vision screening program for under-served populations in
the United States and reported referral rates of 46% (1380/3004), while Looker and co-workers
(2014) reported a referral rate of 11% (20,952/187,822) in the Scottish National Diabetic Reti-
nopathy Screening Program. To date, only one population-based eye study conducted on
homeless adults in the Canadian city of Toronto has reported rates of urgent ophthalmology
referrals (8% of study participants) [11].
The implementation of a referral protocol in a research study requires adequate resources
including personnel, clinical expertise and governance systems. Whilst a population health
study should not be misconstrued as the provision of health screening or health care, the detec-
tion of disease or individuals at risk of disease in the course of a study should, in our view, war-
rant timely referral. This is particularly relevant in ophthalmic research given that the large
majority of eye diseases are asymptomatic in their early stages and vision loss is often treatable
or avoidable through appropriate interventions [2]. This paper describes the referral guidelines
and referral rates for participants in the NEHS.
Methods
The protocol for this study was approved by the Human Research Ethics Committee of the
Royal Victorian Eye and Ear Hospital (RVEEH) (HREC-14/1199H), the Aboriginal Health
and Medical Research Council of New South Wales (HREC-1079/15), the Aboriginal Health
Council of Western Australia (HREC-622), the Menzies School of Health Research (HREC-
Referral rate in the National Eye Health Survey
PLOS ONE | https://doi.org/10.1371/journal.pone.0174867 April 4, 2017 2 / 12
Australian Government, and also received financial
contributions from Novartis Australia and in-kind
support from our industry and sector partners,
OPSM, Carl Zeiss, Designs for Vision, the Royal
Flying Doctor Service, Optometry Australia and the
Brien Holden Vision Institute. We would like to
specifically acknowledge OPSM, who kindly
donated sunglasses valued at $130 for each study
participant. The Centre for Eye Research Australia
receives Operational Infrastructure Support from
the Victorian Government. The Principal
Investigator, Dr Mohamed Dirani, is supported by a
NHMRC Career Development Fellowship
(#1090466). The PhD student, Joshua Foreman is
supported by an Australian Postgraduate Award
scholarship. The funders had no role in study
design, data collection and analysis, decision to
publish, or preparation of the manuscript.
Competing interests: The National Eye Health
Survey received financial contributions from
Novartis Australia and in-kind support from our
industry and sector partners, OPSM, Carl Zeiss,
Designs for Vision, the Royal Flying Doctor Service,
Optometry Australia and the Brien Holden Vision
Institute. We would like to specifically acknowledge
OPSM, who kindly donated sunglasses valued at
$130 for each study participant. There are no
patents, products in development or marketed
products to declare. This does not alter our
adherence to all the PLOS ONE policies on sharing
data and materials.
2015-2360) and the Aboriginal Health Council of South Australia (HREC-04-15-604). This
research was conducted in accordance with the Declaration of Helsinki.
Sampling and recruitment
The selection of recruitment sites was based on the Australian Statistical Geography Standard
(ASGS), developed by the Australian Bureau of Statistics (ABS) to report 2011 Census data.
Thirty sites, across five Remoteness Areas (Major City, Inner Regional, Outer Regional, Remote
and Very Remote), were selected using a multi-stage, random cluster sampling methodology.
To obtain a nationally representative sample of the population, 100 non-Indigenous Austra-
lians aged 50 years and older and 50 Indigenous Australians aged 40 years and older were to be
recruited at each site. Recruiters went door-to-door to determine the eligibility of the residents.
All eligible residents were invited to participate. Engagement of local Aboriginal health workers
and community elders played a central role in the recruitment of Indigenous participants.
Participant questionnaire and examination methodology
Clinical examinations took place in a venue that was within 6km of the target recruitment
area. The testing protocol took approximately 30 minutes per participant.
Consent and questionnaire. All participants provided informed, written consent prior to
examination. Each participant underwent an interviewer-administered questionnaire to collect
information on socio-demographic factors, history of ocular problems, stroke and diabetes.
Participants then underwent a series of eye tests, administered by trained eye examiners.
Vision and refraction. Presenting distance visual acuity (VA) was measured using a log-
MAR chart (Brien Holden Vision Institute, Australia). If presenting VA was worse than 6/12
(0.3 logMar equivalent) in either eye, vision was retested with a pinhole occluder. Auto-refrac-
tion was performed using a hand-held auto-refractor/keratometer (Nidek ARK-30 Type-R,
Nidek Co., LTD, Japan) to objectively measure refractive error of participants whose VA
improved with pinhole to�6/12. Presenting near vision was assessed using the CERA E near
vision card at the participant’s preferred reading distance [12].
Anterior segment assessment. Anterior segment assessment of both eyes was conducted
using a hand-held slit lamp (Keeler PSL One, Keeler Ophthalmic Instruments, UK) at 10x
magnification for the presence of pterygium and lid abnormalities. Trachoma grading was
conducted using the WHO Trachoma Simplified Grading System [13] in Indigenous partici-
pants only as this condition was eradicated in non-indigenous Australians earlier this century
[14]. Anterior segment photographs were taken using a non-mydriatic Diabetic Retinopathy
Screening (DRS) camera (CenterVue SpA, Italy) in participants with presenting distance VA
of<6/12 in one or both eyes.
Perimetry and Intraocular Pressure (IOP). The N-30-5 screening protocol of the Fre-
quency Doubling Technology (FDT) perimeter (Carl Zeiss Meditec & Welch Allyn, USA) was
used to assess visual field loss. If the sensitivity was reduced in any of the field locations, the
test was repeated to determine the reproducibility of the defect and the best result was graded.
Intraocular pressure (IOP) was measured using a tonometer (iCare, Finland).
Retinal photography. Two-field, forty-five degree colour fundus photography was per-
formed using a non-mydriatic fundus camera (DRS, CenterVue SpA, Italy) to assess the
retina and the optic disc. If retinal photographs of reduced quality were due to small pupil size
(<3.00mm), the pupil was dilated with tropicamide 0.5% and photographs were retaken. Ante-
rior chamber angle depth estimation was performed with a hand-held slit lamp using the Van
Herick grading system, prior to pupil dilation to exclude participants at risk of anterior cham-
ber angle closure [15].
Referral rate in the National Eye Health Survey
PLOS ONE | https://doi.org/10.1371/journal.pone.0174867 April 4, 2017 3 / 12
Referral protocol
At the completion of the examination, each participant was provided with verbal feedback on
the health of their eyes. This included a discussion of VA, IOP, visual fields as well as anterior
and posterior ocular health. A referral protocol was developed by study investigators in con-
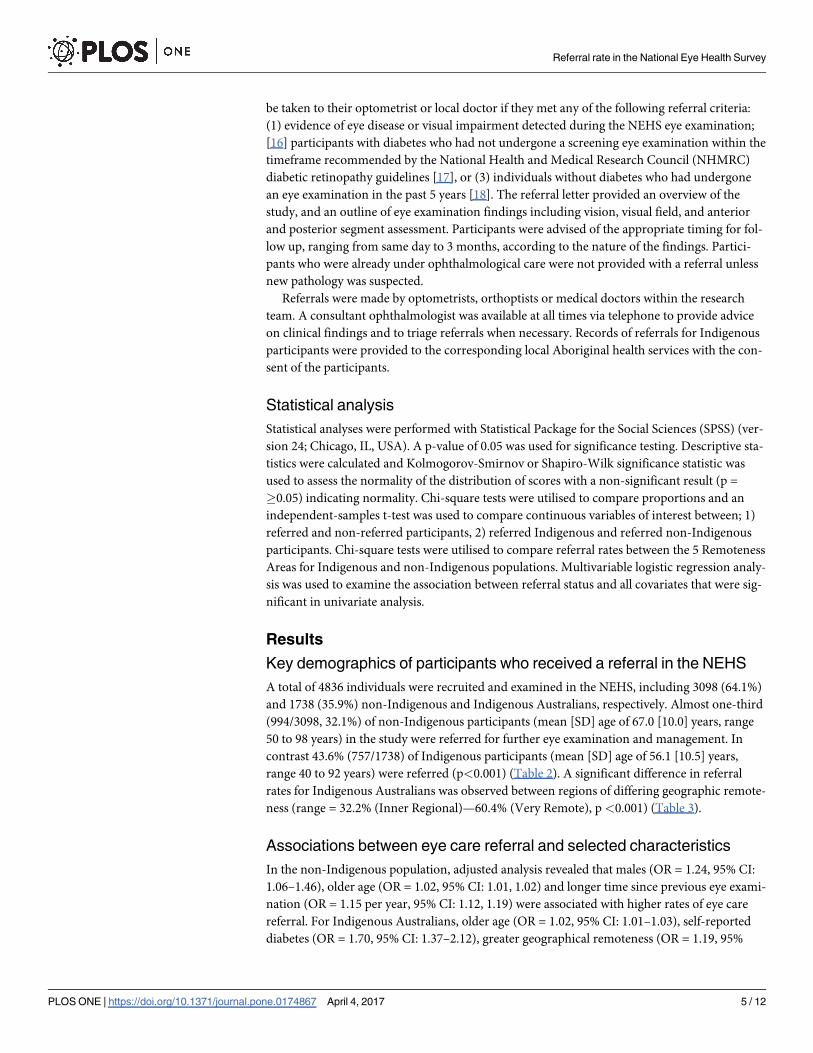
junction with ophthalmologists (Table 1). Participants were provided with a referral letter to
Table 1. Referral protocol in the NEHS.
Test Findings Timing of Referral
VA Presenting VA <6/12 in either eye 1–2 months (urgency dictated by onset and severity of vision loss
Within 1 week if VA <6/12 both eyes and participant is driving
FDT �2 points missed in either eye (for best result) 1–2 month
Diabetic retinopathy 1 month (haemorrhages & exudates, if eye health care provider has not
been seen in the last 3 months)
1 week (central exudates & reduced vision—macular oedema, or any
proliferative retinopathy)
NB: Annual examinations for Indigenous persons and at least every 2
years for non-Indigenous Australians with diabetes
Age related macular degeneration 1 month (large drusen, pigment change or atrophy)
1–2 days (any sub-retinal blood in macula, or new symptoms of
distortion, scotoma, vision loss)
Glaucoma suspect (C:D�0.4, asymmetry >0.2 C:D,
peripapillary atrophy, retinal nerve fiber layer defect)
1 month, unless under care
Pigmented lesion (choroidal naevus or melanoma) 1 month (naevus), 1 week (melanoma)
Vitreous haemorrhage, retinal vascular occlusion, retinal tear or
detachment
Same day
Trachoma
grading
Trachomatous trichiasis, corneal opacity 1 month
Unilateral red
eye
Especially if acute and painful; photophobic Same day
IOP IOP>21mmHg (non-urgent) 2 weeks (sooner if C:D >0.8)
IOP>30mmHg (urgent)1 Same day
Van Herrick �Grade 2 in either eye 1 month (check for symptoms of angle closure glaucoma—urgent
referral if so)
Symptoms:
• Flashing lights (persistent, recent onset), transient visual
obscuration (amaurosis)1Same day
• Recent headaches (if severe; or temporal ache) 1–2 days
• Red colour desaturation, photophobia (marked light
sensitivity), recent history of significant eye trauma
1–2 days
Signs:
• Reddening of the peri-ocular skin (cellulitis) Same day (Urgent if double vision; reduced motility or proptosis)
• Corneal ulcers or opacification Same day
• Lid lesions 1 week (if raised, irregular lid margin & vascularised), regular review (if
longstanding)
• Pterygium encroaching visual axis Same timing as VA referral
• Significant cataract 1 month
• Conjunctival lesions 1 week (if raised & vascularised), regular review (if longstanding)
Other issues on history:
• Using unspecified eye drops/naturopathy eye drops etc.,
strong family history of eye disease
1 month
1A phone referral was made if acute glaucoma or giant cell arteritis were suspected
https://doi.org/10.1371/journal.pone.0174867.t001
Referral rate in the National Eye Health Survey
PLOS ONE | https://doi.org/10.1371/journal.pone.0174867 April 4, 2017 4 / 12
be taken to their optometrist or local doctor if they met any of the following referral criteria:
(1) evidence of eye disease or visual impairment detected during the NEHS eye examination;
[16] participants with diabetes who had not undergone a screening eye examination within the
timeframe recommended by the National Health and Medical Research Council (NHMRC)
diabetic retinopathy guidelines [17], or (3) individuals without diabetes who had undergone
an eye examination in the past 5 years [18]. The referral letter provided an overview of the
study, and an outline of eye examination findings including vision, visual field, and anterior
and posterior segment assessment. Participants were advised of the appropriate timing for fol-
low up, ranging from same day to 3 months, according to the nature of the findings. Partici-
pants who were already under ophthalmological care were not provided with a referral unless
new pathology was suspected.
Referrals were made by optometrists, orthoptists or medical doctors within the research
team. A consultant ophthalmologist was available at all times via telephone to provide advice
on clinical findings and to triage referrals when necessary. Records of referrals for Indigenous
participants were provided to the corresponding local Aboriginal health services with the con-
sent of the participants.
Statistical analysis
Statistical analyses were performed with Statistical Package for the Social Sciences (SPSS) (ver-
sion 24; Chicago, IL, USA). A p-value of 0.05 was used for significance testing. Descriptive sta-
tistics were calculated and Kolmogorov-Smirnov or Shapiro-Wilk significance statistic was
used to assess the normality of the distribution of scores with a non-significant result (p =
�0.05) indicating normality. Chi-square tests were utilised to compare proportions and an
independent-samples t-test was used to compare continuous variables of interest between; 1)
referred and non-referred participants, 2) referred Indigenous and referred non-Indigenous
participants. Chi-square tests were utilised to compare referral rates between the 5 Remoteness
Areas for Indigenous and non-Indigenous populations. Multivariable logistic regression analy-
sis was used to examine the association between referral status and all covariates that were sig-
nificant in univariate analysis.
Results
Key demographics of participants who received a referral in the NEHS
A total of 4836 individuals were recruited and examined in the NEHS, including 3098 (64.1%)
and 1738 (35.9%) non-Indigenous and Indigenous Australians, respectively. Almost one-third
(994/3098, 32.1%) of non-Indigenous participants (mean [SD] age of 67.0 [10.0] years, range
50 to 98 years) in the study were referred for further eye examination and management. In
contrast 43.6% (757/1738) of Indigenous participants (mean [SD] age of 56.1 [10.5] years,
range 40 to 92 years) were referred (p<0.001) (Table 2). A significant difference in referral
rates for Indigenous Australians was observed between regions of differing geographic remote-
ness (range = 32.2% (Inner Regional)—60.4% (Very Remote), p <0.001) (Table 3).
Associations between eye care referral and selected characteristics
In the non-Indigenous population, adjusted analysis revealed that males (OR = 1.24, 95% CI:
1.06–1.46), older age (OR = 1.02, 95% CI: 1.01, 1.02) and longer time since previous eye exami-
nation (OR = 1.15 per year, 95% CI: 1.12, 1.19) were associated with higher rates of eye care
referral. For Indigenous Australians, older age (OR = 1.02, 95% CI: 1.01–1.03), self-reported
diabetes (OR = 1.70, 95% CI: 1.37–2.12), greater geographical remoteness (OR = 1.19, 95%
Referral rate in the National Eye Health Survey
PLOS ONE | https://doi.org/10.1371/journal.pone.0174867 April 4, 2017 5 / 12
CI: 1.09–1.29) and longer time since previous eye examination (OR = 1.10 per year, 95% CI:
1.07, 1.13) were associated with higher rates of eye care referral after multivariate adjustments
(Table 4).
Timing of referrals
Over three quarters of referrals for non-Indigenous (784/994, 78.9%) and Indigenous (573/
757, 75.7%) participants were recommended for one month (Table 5), while a total of 25
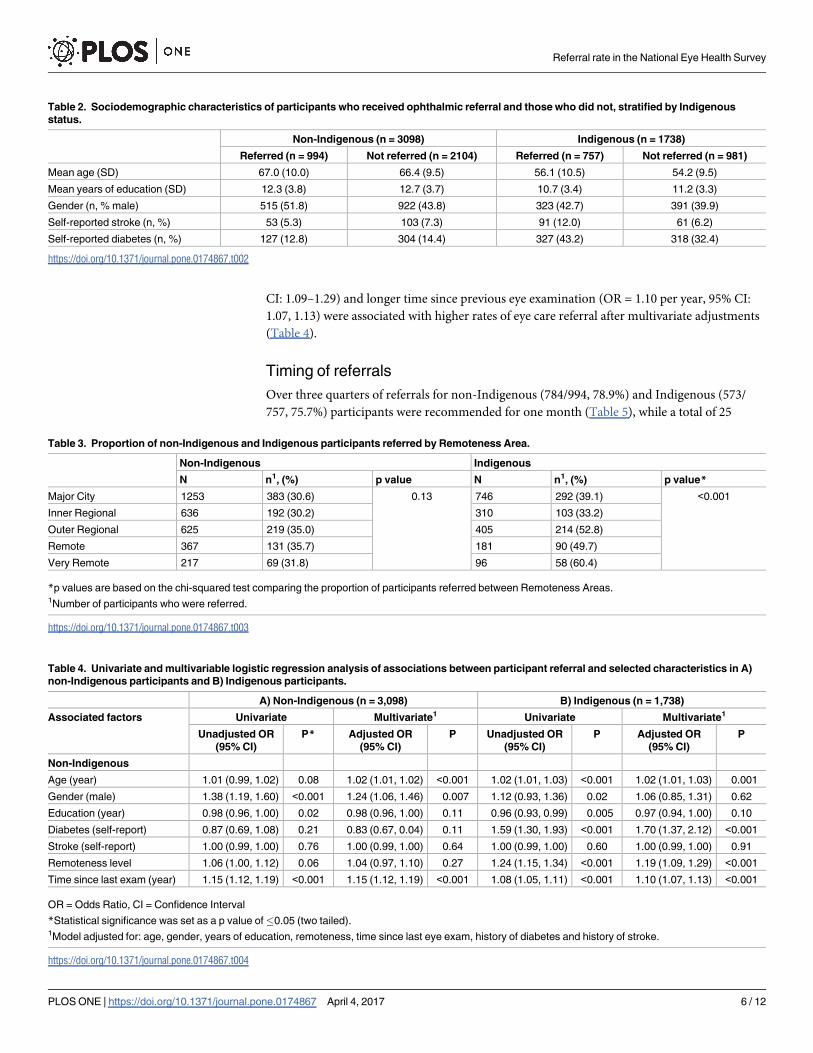
Table 2. Sociodemographic characteristics of participants who received ophthalmic referral and those who did not, stratified by Indigenous
status.
Non-Indigenous (n = 3098) Indigenous (n = 1738)
Referred (n = 994) Not referred (n = 2104) Referred (n = 757) Not referred (n = 981)
Mean age (SD) 67.0 (10.0) 66.4 (9.5) 56.1 (10.5) 54.2 (9.5)
Mean years of education (SD) 12.3 (3.8) 12.7 (3.7) 10.7 (3.4) 11.2 (3.3)
Gender (n, % male) 515 (51.8) 922 (43.8) 323 (42.7) 391 (39.9)
Self-reported stroke (n, %) 53 (5.3) 103 (7.3) 91 (12.0) 61 (6.2)
Self-reported diabetes (n, %) 127 (12.8) 304 (14.4) 327 (43.2) 318 (32.4)
https://doi.org/10.1371/journal.pone.0174867.t002
Table 3. Proportion of non-Indigenous and Indigenous participants referred by Remoteness Area.
Non-Indigenous Indigenous
N n1, (%) p value N n1, (%) p value*
Major City 1253 383 (30.6) 0.13 746 292 (39.1) <0.001
Inner Regional 636 192 (30.2) 310 103 (33.2)
Outer Regional 625 219 (35.0) 405 214 (52.8)
Remote 367 131 (35.7) 181 90 (49.7)
Very Remote 217 69 (31.8) 96 58 (60.4)
*p values are based on the chi-squared test comparing the proportion of participants referred between Remoteness Areas.1Number of participants who were referred.
https://doi.org/10.1371/journal.pone.0174867.t003
Table 4. Univariate and multivariable logistic regression analysis of associations between participant referral and selected characteristics in A)
non-Indigenous participants and B) Indigenous participants.
A) Non-Indigenous (n = 3,098) B) Indigenous (n = 1,738)
Associated factors Univariate Multivariate1 Univariate Multivariate1
Unadjusted OR
(95% CI)
P* Adjusted OR
(95% CI)
P Unadjusted OR
(95% CI)
P Adjusted OR
(95% CI)
P
Non-Indigenous
Age (year) 1.01 (0.99, 1.02) 0.08 1.02 (1.01, 1.02) <0.001 1.02 (1.01, 1.03) <0.001 1.02 (1.01, 1.03) 0.001
Gender (male) 1.38 (1.19, 1.60) <0.001 1.24 (1.06, 1.46) 0.007 1.12 (0.93, 1.36) 0.02 1.06 (0.85, 1.31) 0.62
Education (year) 0.98 (0.96, 1.00) 0.02 0.98 (0.96, 1.00) 0.11 0.96 (0.93, 0.99) 0.005 0.97 (0.94, 1.00) 0.10
Diabetes (self-report) 0.87 (0.69, 1.08) 0.21 0.83 (0.67, 0.04) 0.11 1.59 (1.30, 1.93) <0.001 1.70 (1.37, 2.12) <0.001
Stroke (self-report) 1.00 (0.99, 1.00) 0.76 1.00 (0.99, 1.00) 0.64 1.00 (0.99, 1.00) 0.60 1.00 (0.99, 1.00) 0.91
Remoteness level 1.06 (1.00, 1.12) 0.06 1.04 (0.97, 1.10) 0.27 1.24 (1.15, 1.34) <0.001 1.19 (1.09, 1.29) <0.001
Time since last exam (year) 1.15 (1.12, 1.19) <0.001 1.15 (1.12, 1.19) <0.001 1.08 (1.05, 1.11) <0.001 1.10 (1.07, 1.13) <0.001
OR = Odds Ratio, CI = Confidence Interval
*Statistical significance was set as a p value of�0.05 (two tailed).1Model adjusted for: age, gender, years of education, remoteness, time since last eye exam, history of diabetes and history of stroke.
https://doi.org/10.1371/journal.pone.0174867.t004
Referral rate in the National Eye Health Survey
PLOS ONE | https://doi.org/10.1371/journal.pone.0174867 April 4, 2017 6 / 12
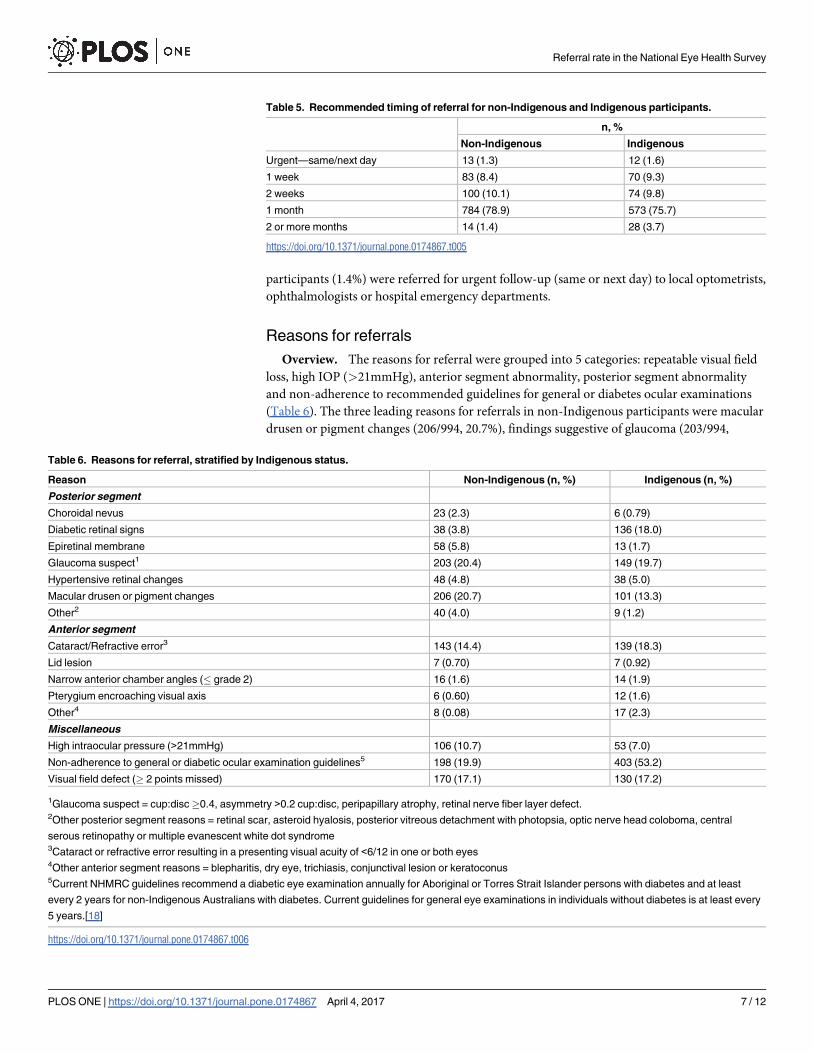
participants (1.4%) were referred for urgent follow-up (same or next day) to local optometrists,
ophthalmologists or hospital emergency departments.
Reasons for referrals
Overview. The reasons for referral were grouped into 5 categories: repeatable visual field
loss, high IOP (>21mmHg), anterior segment abnormality, posterior segment abnormality
and non-adherence to recommended guidelines for general or diabetes ocular examinations
(Table 6). The three leading reasons for referrals in non-Indigenous participants were macular
drusen or pigment changes (206/994, 20.7%), findings suggestive of glaucoma (203/994,
Table 5. Recommended timing of referral for non-Indigenous and Indigenous participants.
n, %
Non-Indigenous Indigenous
Urgent—same/next day 13 (1.3) 12 (1.6)
1 week 83 (8.4) 70 (9.3)
2 weeks 100 (10.1) 74 (9.8)
1 month 784 (78.9) 573 (75.7)
2 or more months 14 (1.4) 28 (3.7)
https://doi.org/10.1371/journal.pone.0174867.t005
Table 6. Reasons for referral, stratified by Indigenous status.
Reason Non-Indigenous (n, %) Indigenous (n, %)
Posterior segment
Choroidal nevus 23 (2.3) 6 (0.79)
Diabetic retinal signs 38 (3.8) 136 (18.0)
Epiretinal membrane 58 (5.8) 13 (1.7)
Glaucoma suspect1 203 (20.4) 149 (19.7)
Hypertensive retinal changes 48 (4.8) 38 (5.0)
Macular drusen or pigment changes 206 (20.7) 101 (13.3)
Other2 40 (4.0) 9 (1.2)
Anterior segment
Cataract/Refractive error3 143 (14.4) 139 (18.3)
Lid lesion 7 (0.70) 7 (0.92)
Narrow anterior chamber angles (� grade 2) 16 (1.6) 14 (1.9)
Pterygium encroaching visual axis 6 (0.60) 12 (1.6)
Other4 8 (0.08) 17 (2.3)
Miscellaneous
High intraocular pressure (>21mmHg) 106 (10.7) 53 (7.0)
Non-adherence to general or diabetic ocular examination guidelines5 198 (19.9) 403 (53.2)
Visual field defect (� 2 points missed) 170 (17.1) 130 (17.2)
1Glaucoma suspect = cup:disc�0.4, asymmetry >0.2 cup:disc, peripapillary atrophy, retinal nerve fiber layer defect.2Other posterior segment reasons = retinal scar, asteroid hyalosis, posterior vitreous detachment with photopsia, optic nerve head coloboma, central
serous retinopathy or multiple evanescent white dot syndrome3Cataract or refractive error resulting in a presenting visual acuity of <6/12 in one or both eyes4Other anterior segment reasons = blepharitis, dry eye, trichiasis, conjunctival lesion or keratoconus5Current NHMRC guidelines recommend a diabetic eye examination annually for Aboriginal or Torres Strait Islander persons with diabetes and at least
every 2 years for non-Indigenous Australians with diabetes. Current guidelines for general eye examinations in individuals without diabetes is at least every
5 years.[18]
https://doi.org/10.1371/journal.pone.0174867.t006
Referral rate in the National Eye Health Survey
PLOS ONE | https://doi.org/10.1371/journal.pone.0174867 April 4, 2017 7 / 12

20.2%) and non-adherence to general or diabetic ocular examinations (198/994, 19.9%). Non-
adherence to general or diabetic ocular examinations (403/757, 53.2%,), signs of glaucoma
(149/757, 19.7%) and findings suggestive of diabetic retinopathy (136/757, 18.0%) were pri-
mary reasons for referral for Indigenous participants. 14.4% of referrals for non-Indigenous
participants and 18.3% of referrals for Indigenous participants were made based on a present-
ing visual acuity of less than 6/12 in one or both eyes due to suspected cataract or refractive
error. Of note, an assessment of the best-corrected visual acuity (BCVA) in the better eye of
the 1751 persons referred revealed that 1660 (94.8%) individuals had a BCVA that was 6/12 or
better, 88 (5.0%) had a BCVA between<6/12-6/60 and 3 (0.2%) had a BCVA less than <6/60
in their better eye.
Reasons for urgent referrals. Of the 25 participants referred for urgent follow-up, 12
(48%) presented with an IOP of>30mmHg, 10 (40%) presented with symptoms consistent
with possible retinal tears (persistent photopsias of recent onset), 2 (8%) showed signs of uve-
itis, and 1 (4%) participant had presumed periorbital cellulitis.
Primary reasons for semi-urgent (1 week) referrals. Of those participants who required
semi-urgent (1 week) referrals (n = 153), the five primary reasons for referral were: presenting
vision less than the Australian driving standard (6/12) in both eyes (n = 81, 41.5%); a recent
onset of unilateral vision loss (VA<6/60) (n = 13, 7.3%); retinal hemorrhage (n = 12; 6.7%),
and elevated IOP (�21mmHg) with an enlarged vertical optic cup to optic disc ratio (�0.8)
(n = 8; 4.5%).
Discussion
The NEHS is a population-based study conducted between March 2015 and April 2016 that
aimed to determine the prevalence of vision impairment and blindness in Australia. Herein
we have described the rate of referral of NEHS participants for further eye care and identified
risk factors for referral.
The overall referral rate for the study was high, with more than 1 in 3 participants being
directed to a local eye health or primary care service for follow-up assessment. The significance
of this finding must not be overstated as the vast majority of referrals were due to non-urgent
reasons, such as poor compliance to recommended guidelines for general or diabetic ocular
examinations. Of note however, approximately 10% (178/1738) of the referrals made by NEHS
examiners recommended urgent (same day/next day) or semi-urgent (within one week) fol-
low-up, accounting for 3.9% of the total sample. Urgent and semi-urgent referrals represent
undetected and potentially sight-threatening ocular conditions that were opportunistically
detected. It can be speculated that had these individuals not participated in the NEHS their
ocular disease may have gone undetected, particularly for those who had never had an eye
examination. It is not easy to put these referral rates into context given the paucity of similar
data from other population-based eye studies. The urgent referral rate in the current study
(1.4%) was lower than that reported amongst homeless adults in the Canadian city of Toronto
of 8% [9]. These results are difficult to compare due to the vast differences in the sample popu-
lations and the referral protocols employed.
With the exception of non-adherence to recommended guidelines for general or diabetic ocu-
lar examinations, the main reason for referral of participants was the finding of suspicious retinal
or optic nerve pathology. Population studies have demonstrated that the prevalence of asymp-
tomatic retinal abnormalities increases with age [19]. While the clinical outcomes of the NEHS
participants who were referred for follow-up are not known, it is apparent that population eye
health studies may contribute to the opportunistic detection of disease and, when coupled with a
clinical referral protocol, could promote improved eye health outcomes for participants.
Referral rate in the National Eye Health Survey
PLOS ONE | https://doi.org/10.1371/journal.pone.0174867 April 4, 2017 8 / 12
Indigenous Australian participants (757/1738, 43.6%) in the NEHS were more likely than
non-Indigenous Australian participants (994/3098, 32.1%) to be referred for follow-up and
this was the case for all Remoteness Areas studied. It appears that this finding can be largely
explained by a higher prevalence of self-reported diabetes (Indigenous = 37.1% vs. non-Indige-
nous = 13.9%) coupled with poorer adherence to recommended guidelines for diabetes ocular
examinations in Indigenous Australians. A lack of awareness of the more stringent recommen-
dation for annual diabetic retinal screening for Indigenous Australians, as opposed to biennial
screening for most non-Indigenous Australians, may account for the sub-optimal compliance
to these guidelines [17]. This is consistent with previous studies that have identified a low
uptake of eye examinations by Indigenous Australians with diabetes [20–22]. Individuals with
diabetes who do not have their eyes examined at the recommended frequency place themselves
at risk of diabetic retinopathy. Therefore, the finding in Indigenous participants of a higher
rate of referral due to diabetic retinopathy is not surprising. In recent times, improvement in
the uptake of services by Indigenous Australians has been a focus of the Australian Govern-
ment, with the introduction of new Medicare Benefits Schedule [23] items for primary care
services to cover diabetic retinal screening using non-mydriatic retinal photography [24]. Our
findings may provide support for this initiative.
Referral rates differed significantly for Indigenous study participants by Remoteness Areas
(range = 39.1%–60.4%) but not for non-Indigenous participants (range = 30.2%–35.7%).
Notably, referral rates for Indigenous participants in very remote sites were approximately 1.5
to 2 times higher than those of Major City and Inner Regional sites. While referral rates may
not directly correlate with the burden of eye disease within communities, these findings may
be a reflection of the well-established barriers that Indigenous Australians face in accessing
specialist services in remote areas, including communication, distance, and cultural inappro-
priateness [25,26]. To compound this, a recent review has identified a disproportionately low
availability of services in remote Australia, with the number of patients per optometrist being
12,700 in remote areas compared with the national average of approximately 1,180 [27,28].
Numerous eye health care agencies are currently undertaking major efforts to improve Indige-
nous eye health through better access to education, improved funding and the implementation
of specialist outreach services in many regional and remote Indigenous communities [29].
A strength of the NEHS is its representativeness, achieved through the use of population-
based sampling stratified by remoteness. The use of a predefined clinical referral protocol by
qualified eye health professionals has allowed the study to provide useful insights into the prev-
alence of referable eye disorders and vision impairment. Nevertheless, the results of the current
study must be considered in light of two key limitations. Firstly, the clinical referral protocol
implemented in this study has not been validated and due to time and logistical constraints it
was beyond the scope of the study to obtain access to the outcomes of follow-up for referred
participants. This precludes appraisal of the appropriateness of the referral criteria, including
false-positive referral rates. The social costs [30] and individual psychological impact [31] of
false positive referrals have been well documented. Furthermore, an absence of follow-up data
precludes our ability to assess compliance rates to referral recommendations. Given that previ-
ous research indicates that less than half of those referred from eye screening services actually
present to a follow-up appointment [9] the health impact of the referral protocol is likely to be
sub-optimal. These factors limit our ability to draw conclusions regarding the efficacy and fea-
sibility of the referral protocol detailed in the current study. Secondly, the detection of refer-
able pathology and the recommended timeframe for referrals is likely to have varied somewhat
between examiners. To mitigate these effects, examiners were well trained and had demon-
strated knowledge of the referral guidelines. Furthermore, an on-call ophthalmologist with
access to de-identified retinal images, was available to adjudicate ambiguous cases. Emphasis
Referral rate in the National Eye Health Survey
PLOS ONE | https://doi.org/10.1371/journal.pone.0174867 April 4, 2017 9 / 12
was placed on participant safety and in circumstances in which examiners were uncertain of
the need for, or the urgency of referral, examiners erred on the side of caution.
Our data has identified several high risk groups requiring ophthalmic referral who may
benefit from improvements in the provision and/or uptake of eye health services, including;
older Australians, non-Indigenous males, Indigenous Australians with self-reported diabetes
and those residing in very remote communities. Whilst we are not in a position to assess the
impact of the referrals that were made on the eye health of participants, we hope that partici-
pants were assisted by this approach. Future longitudinal research is warranted to further eval-
uate the feasibility and efficacy of implementing a referral protocol within a population-based
research setting.
Acknowledgments
The Centre for Eye Research Australia (CERA) and Vision 2020 Australia wish to recognise
the contributions of all the NEHS project steering committee members (Professor Hugh Tay-
lor, Dr Peter van Wijngaarden, Jennifer Gersbeck, Dr Jason Agostino, Anna Morse, Sharon
Bentley, Robyn Weinberg, Christine Black, Genevieve Quilty, Louis Young and Rhonda Still-
ing) and the core CERA research team who assisted with the survey field work (Joshua Fore-
man, Pei Ying Lee, Rosamond Gilden, Larissa Andersen, Benny Phanthakesone, Celestina
Pham, Alison Schokman, Megan Jackson, Hiba Wehbe, John Komser and Cayley Bush). Fur-
thermore, we would like to acknowledge the overwhelming support from all collaborating
Indigenous organisations who assisted with the implementation of the survey, and the Indige-
nous health workers and volunteers in each survey site who contributed to the field work.
Author Contributions
Conceptualization: SK MD JF PYL.
Data curation: MD SK PYL JF.
Formal analysis: SK PYL JF.
Funding acquisition: MD.
Investigation: PYL JF SK.
Methodology: HRT PV MD.
Project administration: SK JF PYL.
Resources: MD SK PYL PV JF.
Supervision: MD HRT PV.
Visualization: SK PYL.
Writing – original draft: SK PYL.
Writing – review & editing: HRT PV MD JF.
References1. Organisation WH (2012) Global Data on Visual Impairments.
2. Bourne R, Price H, Stevens G (2012) Global burden of visual impairment and blindness. Arch Ophthal-
mol 130: 645–647. https://doi.org/10.1001/archophthalmol.2012.1032 PMID: 22652851
3. Taylor H, Keeffe J, Vu H, Wang J, Rochtchina E, et al. (2005) Vision loss in Australia. MJA 182: 565–
568. PMID: 15938683
Referral rate in the National Eye Health Survey
PLOS ONE | https://doi.org/10.1371/journal.pone.0174867 April 4, 2017 10 / 12

4. group Tedpr (2004) Causes and prevalence of visual impairment among adults in the United States.
Epidemiology 122: 477–485.
5. Klaver C, Wolfs R, Vingerling J, Hofman A, De Jong P (1998) Age-specific prevalence and causes of
blindness and visual impairment in an older population; the Rotterdam study. JAMA 116: 653–658.
6. Taylor H, Livingston P, Stanislavsky Y, McCarty C (1997) Visual impairment in Australia: distance visual
acuity, near vision, and visual field findings of the Melbourne Visual Impairment Project. Am J Ophthal-
mol 123: 328–337. PMID: 9063242
7. Taylor H, Xie J, Fox S, Dunn R, Arnold A, et al. (2010) The prevalence and causes of vision loss in
Indigenous Australians: the national Indigenous eye health survey. MJA 192: 312–318. PMID:
20230347
8. Wang J, Foran S, Mitchell P (2000) Age-specific prevalence and causes of bilateral and unilateral visual
impairment in older Australians: the Blue Mountains Eye Stud. Clinical and Experimental Ophthalmol-
ogy 28: 368–373.
9. Friedman D, Cassard S, Williams S, Baldonado K, O’Brien R, et al. (2012) Outcomes of a vision
screeing program for underserved populations in the United States. Ophthalmic Epidemiology 20:
201–211.
10. Looker H, Nyangoma S, Cromie D, Olsen J, Leese G, et al. (2014) Rates of referable eye disease in the
Scottish national diabetic retinopathy screening programme. Br J Ophthalmology 98: 790–795.
11. Noel C, Fung H, Srivastava R, Lebovic G, Hwang S, et al. (2015) Visual impairment and unmet eye care
needs among homeless adults in a Canadian City JAMA Ophthalmology 133: 455–460. https://doi.org/
10.1001/jamaophthalmol.2014.6113 PMID: 25654733
12. Keeffe J (1998) Low Vision Kit. World Health Organization.
13. Thylefors B, Dawson C, Jones B, West S, Taylor H (1987) A simple system for the assessment of tra-
choma and its complications. Bull World Health Organ 65: 477–483. PMID: 3500800
14. Jung J, Rahman S, Rashid H, Khandaker G (2014) Current status of trachoma elimination in Australia:
making trachoma a history by 2020. Infect Disord Drug Targets 14: 219–222. PMID: 25944335
15. Dabasia P, Edger D, Lawrenson J (2013) Methods of measurement of the anterior chamber angle part
2: screening for angle closure glaucoma. Optometry in Practice 14: 147–154.
16. Patel KH, Chow CC, Rathod R, Mieler WF, Lim JI, et al. (2013) Rapid response of retinal pigment epi-
thelial detachments to intravitreal aflibercept in neovascular age-related macular degeneration refrac-
tory to bevacizumab and ranibizumab. Eye (Lond) 27: 663–667; quiz 668.
17. NHMRC (2008) Guidelines for the management of diabetic retinopathy In: Council NHaMR, editor.
https://www.nhmrc.gov.au.
18. Taylor H, Vu H, McCarty C, Keefe J (2004) The need for routine eye examinations. IOVS 45: 25.
19. Pollack A, Brodie S (1998) Diagnostic yield of the routine dilated fundus examination. Ophthalmol 105:
382–386.
20. Gracey M, Bridge E, Martin D, Jones T, Spargo R, et al. (2006) An Aboriginal-driven program to prevent,
control and manage nutrition-related "lifestyle" diseases including diabetes. Asia Pacific Journal of Clini-
cal Nutrition 15: 178–188. PMID: 16672201
21. Jaross N, Ryan P, Newland H (2003) Prevalence of diabetic retinopathy in an Aboriginal Australian pop-
ulation: results from the Katherine Region Diabetic Retinopathy Study (KRDRS). Clinical and experi-
mental ophthalmology 31: 32–39. PMID: 12580891
22. Xie J, Arnold A, Keeffe J, Goujon N, Dunn R, et al. (2011) Prevalence of self-reported diabetes and dia-
betic retinopathy in Indigenous Australians: the National Indigenous Eye Health Survey. Clinical and
Experimental Ophthalmology 39: 487–493. https://doi.org/10.1111/j.1442-9071.2011.02502.x PMID:
21819502
23. Kivela T, Grambsch PM (2003) Evaluation of sampling strategies for modeling survival of uveal malig-
nant melanoma. Invest Ophthalmol Vis Sci 44: 3288–3293. PMID: 12882772
24. Australian Government (2016) Budget 2016–2017: Portfolio Budget Statements 2016–2017 Budget
Related Paper No1.10 Health Portfolio. Canberra.
25. Gruen R, Weeramanthri T, Bailie R (2002) Outreach and improved access to specialist services for
Indigenous people in remote Australia: the requirements for sustainability. J Epidemiol Community
Health 56: 517–521. https://doi.org/10.1136/jech.56.7.517 PMID: 12080159
26. Taylor H, Jatkar U, Anjou M (2015) The roadmap to close the gap for vision. http://iehu.unimelb.edu.
au/__data/assets/pdf_file/0007/1518802/Roadmap-Close-Gap-for-Vision-Summary-Report-2015-
September.pdf: Melbourne School of Population and Global Health.
27. Productivity Commission (2005) Australia’s Health Workforce, Research Report. In: Commission AGP,
editor. Canberra.
Referral rate in the National Eye Health Survey
PLOS ONE | https://doi.org/10.1371/journal.pone.0174867 April 4, 2017 11 / 12

28. Kiely PM, Chakman J (2011) Optometric practice in Australian Standard Geographical Classification—
Remoteness Areas in Australia, 2010. Clin Exp Optom 94: 468–477. https://doi.org/10.1111/j.1444-
0938.2011.00590.x PMID: 21426397
29. Tapp RJ, Anjou MD, Boudville AI, Taylor HR (2013) The roadmap to close the gap for vision—diabetes-
related eye care in the Indigenous Australian population. Diabet Med 30: 1145–1146. https://doi.org/
10.1111/dme.12215 PMID: 23586406
30. Burr JM, Mowatt G, Hernandez R, Siddiqui MA, Cook J, et al. (2007) The clinical effectiveness and
cost-effectiveness of screening for open angle glaucoma: a systematic review and economic evalua-
tion. Health Technol Assess 11: iii–iv, ix–x, 1–190.
31. Stewart-Brown S, Farmer A (1997) Screening could seriously damage your health. Bmj 314: 533–534.
PMID: 9055702
Referral rate in the National Eye Health Survey
PLOS ONE | https://doi.org/10.1371/journal.pone.0174867 April 4, 2017 12 / 12