partial discharge analysis of stator insulation at...
TRANSCRIPT
KTH Electrical Engineering
Partial Discharge Analysis of Stator Insulation at Arbitrary Voltage Waveform Stimulus
XIAOLEI WANG
Doctoral Thesis Stockholm, Sweden 2015

ii
TRITA-EE 2015: 019 KTH School of Electrical Engineering ISSN 1653-5146 SE-100 44 Stockholm ISBN 978-91-7595-548-3 SWEDEN Akademisk avhandling som med tillstånd av Kungl Tekniska Högskolan framlägges till offentlig granskning för avläggande av teknologie doktorsexamen fredagen den 29 maj 2015 klockan 10.00 i H1, Teknikringen 33, Kungl Tekniska Högskolan, Stockholm. © Xiaolei Wang, May 2015 Tryck: Universitetsservice US AB

iii
To my parents
我不去想未来是平坦还是泥泞
只要热爱生命
一切,都在意料之中
——汪国真《热爱生命》
I don’t consider whether my future will be smooth or bumpy If only I have passion for life everything will go as expected
Guozhen Wang Love life

iv

v
Abstract
Partial discharge (PD) detection is a powerful tool to diagnose the defects and degradation in high voltage electrical insulation systems. It can be performed in both on-line and off-line conditions. Unlike the on-line PD measurement, the off-line PD test can be performed at other voltages or frequencies besides power-frequency (50 Hz or 60 Hz) sinusoidal voltage. The PD studies in this work were done with other types of voltage waveforms to initiate the discharge, aiming to obtain a better understanding of PD features and its physics, mainly focused on how the charges on the insulating surface affect the discharge process. In particular, this method was studied for application in the stator insulation of high-voltage rotating machines. Several types of arbitrary voltage waveforms have been explored, such as periodic negative step voltage, triangular voltage, trapezoidal voltage and ''square'' voltage.
The PD measurements in this work can be summarized in two parts. One is the fundamental study of corona, surface and cavity discharges in the canonical test cells, using some common insulation materials such as polycarbonate and epoxy. The effect of different materials on corona discharge at periodic negative step voltage pulses was studied in the needle-plane geometry, in comparison with the corona discharge without the insulation material. The evolution of corona pulses shows that the PD repetition rate is strongly dependent on the charges deposited on the insulating surface, and the material properties such as conductivity have a significant effect on the charge decay process during the PD activities. Surface and cavity discharges were compared by the phase resolved PD patterns at several periodic voltage waveforms. The results indicate that the arbitrary voltage waveforms, particularly the square voltage, in off-line PD tests are a potential method for better identification of these two PD sources.
The other part is the practical study for stator winding insulation materials, which consists of mica, epoxy resin and glass-fiber. Specific PD sources that are sphere-plane discharge and crossed-bar discharge based on the stator insulation were created in the laboratory, in order to imitate real insulation such as slot discharges and dielectric bounded cavities. The trapezoidal voltage waveform, including triangular and square voltages was mainly used. Varied ambient conditions such as relative humidity (RH) and temperature were introduced into this part. Slot discharge was modelled by placing a spherical metal electrode above the mica-epoxy insulating surface, leaving a small air gap where PD may occur. The effect of humidity on the sphere-plane discharge shows that a few big discharge pulses in dry air will turn into a larger number of small pulses in humid air probably due to the increasing surface conductivity in a higher humidity condition. Crossed-bar discharge which took place in the air gap between two mica-epoxy surfaces of the cured samples was studied, combined with the influence of the temperature. The variation of PD patterns shows that the effect of temperature on the PD behavior is mainly due to the decreasing PD inception voltage with the increasing temperature.
Keywords: partial discharge, arbitrary voltage waveform, mica-epoxy insulation, corona, surface discharge, cavity discharge, sphere-plane discharge, crossed-bar discharge, surface charge.
vi
Sammanfattning
Mätning av partiella urladdningar (PD) är ett kraftfullt verktyg för att diagnostisera fel och nedbrytning i högspända elektriska isolersystem och kan användas i både ''on-line'' och ''off-line'' förhållanden. Till skillnad från PD mätning on-line, kan off-linemätningar utföras vid andra spänningar och frekvenser än vid matningsspänning (50 Hz eller 60 Hz sinusvåg). I detta arbete har PD analys utförts med andra typer av vågformer på spänningen för att initiera urladdningar, med syftet att få en bättre förståelse av PD karaktäristiken och dess fysik, främst med fokus på hur ytladdningar på isolationsmaterialet påverkar urladdningsprocessen. I synnerhet studerades metoden på artificiella defekter avsedda att vara representativa för statorisolation i högspända roterande maskiner. Flera typer av godtyckliga vågformer på spänningen undersöktes, såsom periodisk negativ stegspänning, triangelvåg, trapetsvåg och fyrkantsvåg.
PD mätningarna i detta arbete kan sammanfattas i två delar. Den första delen är en studie av korona, yt- och kavitetsurladdningar i väldefinierade testceller, med hjälp av några vanliga isoleringsmaterial, såsom polykarbonat och epoxi. Effekten av olika material på koronaurladdning vid periodiska negativa stegspänningspulser studerades, i jämförelse med koronaurladdning utan isoleringsmaterial närvarande i en spets-platta geometri. Tidsutvecklingen av koronaurladdningarna visar att repetitionshastigheten för PD är starkt beroende av ytladdning på isolermaterialet och att materialegenskaper som konduktivitet har en betydande effekt på urladdningsprocessen vid PD-aktivitet. Yt- och kavitetsurladdningar jämfördes genom fasupplösta PD-mönster under inverkan av flera olika typer av tidsperiodiska spänningsformer. Resultaten tyder på att godtyckliga spänningsvågsformer, särskilt fyrkantsvågformiga spänningar, under off-line tester av PD är en potentiell metod för att bättre kunna skilja dessa två PD källor ifrån varandra.
Den andra delen av arbetet utfördes på isolationsmaterial för statorlindningar bestående av uthärdade glimmerband (glimmer, epoxiharts och glasfiber). De artificiella PD källor som användes för detta ändamål utgjordes av en sfär-plangeometri och korsade stavar vilka simulerar verkliga PD-källor som kan uppstå i roterande maskiner, d.v.s. spårurladdningar och urladdningar dielektriskt avgränsade kaviteter som t.ex. delamineringar. Trapetsspänning, inklusive triangelvåg och fyrkantsvåg användes främst. Beroendet av omgivningens förhållanden som relativ fuktighet (RH) och temperatur studerades i denna del. Effekten av fukt på urladdningarna i en sfär-plangeometrin visar att ett fåtal stora urladdningspulser i torr luft kommer att förvandlas till ett större antal små pulser i fuktig luft främst på grund av den ökande ytkonduktivitet som uppstår i en högre luftfuktighet. Vid urladdningar mellan två korsade stavar isolerade med glimmerband studerades, i kombination med temperaturpåverkan. Variationen i PD mönstren visar att effekten av temperaturen på PD-beteendet främst beror på den minskande tändspänningen för PD vid ökande temperatur.
Nyckelord: partiell urladdning, godtyckliga spänningsvågformer, glimmer-epoxiisolation, korona, yturladdning, hålrumsurladdning, delaminering, ytladdning.

vii
Acknowledgements
The long journey of my doctoral work is eventually coming to the end. This Ph.D. thesis ends up my five-year Ph.D. study abroad and my entire career as a student. It is also a witness of my growth and progress in the past years. Whenever I look back how I got here and everything I experienced during this period, I realize that, how could I be so lucky to have you all around to help and support me, no matter in which way. At this moment, I would like to take this opportunity to express my sincere appreciations to all the people who have helped shape my life and work.
My deepest acknowledgement goes first and foremost to my supervisor, Assoc. Prof. Hans Edin. I still remember the first time we met each other when he picked me up at Arlanda airport after my arriving in Sweden. I always feel grateful to him for providing me this great study opportunity. During the entire period of study, he offers me abundant help, invaluable assistance, support and guidance. Whenever I have problems in the work, I can always find a way out from the confusion after talking with him. His patience and encouragement also means a lot to me. Under his supervision, I have been trying to improve myself to become an independent researcher. I extend my sincere gratitude to my co-supervisor, Dr. Nathaniel Taylor, who would like to help even though he always has endless work to do. He provides his kindness for all the aspects, assistance in laboratory experiments, rewarding discussion and correction of my writing with great patience; all of these are a significant contribution for the success of this work. I also would like to thank Prof. Rajeev Thottappillil, the head of the department, for the one-by-one talking with every Ph.D. students, and particularly for all his efforts to make the department be a nice place to work.
I had the pleasure to spend four months of my Ph.D. period at Eindhoven University of Technology (TU/e) in the Netherlands during spring 2015. This period was a mandatory part of EIT/KIC InnoEnergy PhD School. My special thanks to Assist. Prof. Peter Wouters for accepting me in his research group, spending time on discussing with me and giving the valuable comments about my work.
I am very fortunate to have some good friends in the high-voltage research group: Dr. Nadja Jäverberg, Dr. Respicius Clemence Kiiza, Dr. Mohamad Ghaffarian Niasar, Roya Nikjoo, Håkan Westerlund, and Patrick Janus. Thank you so much for accompanying me through this journey, taking the courses, working in the laboratory, attending the conferences, sharing the feelings, helping and supporting each other. I cannot imagine how my Ph.D. life would be without you standing by my side. Sincerely hope one day we might have a chance to work together again!
Thank all the people in the Department of Electromagnetic Engineering (ETK), giving me a very kind atmosphere to work in, Dr. Hanif Tavakoli, Dr. Seyedali Mousavi and all other colleagues. Thanks to Ms. Carin Norberg for financial administration, Mr. Peter Lönn for his continuous support in maintaining computers and software, and Mr. Jesper Freiberg for preparing all the test cells for my measurements.

viii
I am appreciating and enjoying the time together with my Chinese friends in Sweden. You make me feel warm in a foreign country. Thank you all for having lunch time together, Dr. Helin Zhou, Dr. Kelin Jia, Dr. Pu Zhang, Dr. Shuang Zhao, Dr. Yukun Hu, Dr. Hui Li, Mengni Long, Bing Li, Lipeng Liu, Lebing Jin, Yanmei Yao, Hui Zhang. Special thanks to Tingting Guan for shopping together and a lot of talk about future. Thanks my friends in TU/e as well, Dr. Fei Ni, Dr. Yan Li, Yu Xiang.
The project is funded by the Swedish Energy Agency, Elforsk AB, ABB AB and Swedish Railway Company via the ELEKTRA program, which is gratefully acknowledged. The project was also part of EIT/KIC-InnoEnergy through the CIPOWER innovation project.
Last but not least, I am indebted to my parents for their continuous support and endless love to me. I have been far away from them for thirteen years since I went to the university! They are always there to encourage me when I meet difficulties and frustrations in my life, making me become stronger and braver. Their love is something I will never pay back even though I spend my entire life trying.
I also appreciate my own efforts to make my dream come true. Life always continues, no matter where it is and in which way. Good luck to myself!
Thanks to all of you!
Xiaolei Wang Stockholm, May 2015

ix
List of Publications
This thesis is based on the following papers:
I. X. Wang, M. Ghaffarian Niasar, R. Clemence, and H. Edin, ''Partial discharge analysis in a needle-plane gap with repetitive step voltage'', IEEE Annual Report Conference on Electrical Insulation and Dielectric Phenomena (CEIDP), Montreal, Canada, pp. 92-95, Oct. 14-17, 2012.
II. X. Wang, R. Clemence Kiiza, M. Ghaffarian Niasar, R. Nikjoo, N. Taylor and H. Edin, ''Effect of dielectric material on decay of surface charge deposited by corona discharge'', Proceedings of the 18th International Symposium on High Voltage Engineering (ISH), Seoul, Korea, pp. 753-758, Aug. 25-30, 2013.
III. X. Wang, N. Taylor and H. Edin, ''Enhanced distinction of surface and cavity discharges by trapezoid-based arbitrary voltage waveforms'', submitted to IEEE Transactions on Dielectrics and Electrical Insulation, 2015.
IV. X. Wang, N. Taylor and H. Edin, ''Effect of humidity on partial discharge in a metal-dielectric air gap on machine insulation at trapezoidal testing voltages'', submitted to IEEE Transactions on Dielectrics and Electrical Insulation, 2014.
Licentiate thesis:
X. Wang, ''Partial Discharge Analysis at Arbitrary Voltage Waveform Stimulus'', Licentiate thesis, KTH, Stockholm, Sweden, 2012 [online]. Available: http://www.diva-portal.org/smash/get/diva2:572451/FULLTEXT01.pdf
Papers not included but relevant to the thesis:
V. X. Wang, N. Taylor and H. Edin, ''Surface discharge analysis at trapezoidal testing voltage waveform'', accepted by IEEE PowerTech Eindhoven 2015, Eindhoven, Netherlands, Jun. 29 - Jul. 2, 2015.
VI. X. Wang, R. Clemence Kiiza, M. Ghaffarian Niasar and H. Edin, ''Surface charge dynamics studied by the temporal evolution of the corona charging current'', submitted to Journal of Electrostatics, 2014.
VII. X. Wang, R. Clemence Kiiza, M. Ghaffarian Niasar, N. Taylor and H. Edin, ''Partial discharge analysis in a metal-dielectric air gap on machine insulation at arbitrary testing voltage'', Proceedings of International Symposium on Electrical Insulating Materials (ISEIM), Niigata, Japan, pp. 216-220, Jun. 1-5, 2014.
VIII. X. Wang, N. Taylor, M. Ghaffarian Niasar, R. Clemence Kiiza and H. Edin, ''Lumped-circuit modeling of surface charge decay in needle-plane geometry'', Proceedings of the 23rd Nordic Insulation Symposium (Nord-IS 13), Trondheim, Norway, pp. 183-186, Jun.

x
9-12, 2013.
IX. X. Wang, R. Clemence and H. Edin, ''Partial discharge analysis of a narrow dielectric gap with repetitive linear ramping pulses'', Proceedings of the 22nd Nordic Insulation Symposium (Nord-IS 11), Tampere, Finland, pp. 53-56, 2011.
X. X. Wang, R. Clemence, and H. Edin, ''Partial discharge analysis of a narrow dielectric gap with repetitive half-sine pulses'', IEEE Annual Report Conference on Electrical Insulation and Dielectric Phenomena (CEIDP), West Lafayette, Indiana, USA, pp. 481-484, 2010.
XI. R. Clemence Kiiza, M. Ghaffarian Niasar, R. Nikjoo, X. Wang and H. Edin, ''Change in partial discharge activity as related to degradation level in oil-impregnated paper insulation: effect of high voltage impulses'', IEEE Transactions on Dielectrics and Electrical Insulation, Vol. 21, No. 3, pp. 1243-1250, 2014.
XII. R. Clemence Kiiza, M. Ghaffarian Niasar, R. Nikjoo, X. Wang and H. Edin, ''The effect of PD by-products on the dielectric frequency response of oil-paper insulation comprising of a small cavity'', accepted by IEEE Transactions on Dielectrics and Electrical Insulation, 2015.
XIII. M. Ghaffarian Niasar, N. Taylor, P. Janus, X. Wang, H. Edin and R. Clemence Kiiza, ''Partial discharges in a cavity embedded in oil-impregnated paper: effect of electrical and thermal aging'', IEEE Transactions on Dielectrics and Electrical Insulation, Vol. 22, No. 2, pp. 1071-1079, 2015.
XIV. M. Ghaffarian Niasar, R. Clemence, X. Wang, R. Nikjoo and H. Edin, ''Aging of oil impregnated paper due to PD activity'', Proceedings of the 18th International Symposium on High Voltage Engineering (ISH), Seoul, Korea, pp. 1845-1849, Aug. 25-30, 2013.
XV. M. Ghaffarian Niasar, H. Edin, X. Wang and R. Clemence, ''Partial discharge characteristics due to air and water vapor bubbles in oil'', Proceedings of the 17th International Symposium on High Voltage Engineering(ISH), Hannover, Germany, Paper No. D-067, Aug. 20-26, 2011.

xi
Contents
1. Introduction .............................................................................................................. 1 1.1 Background and motivation for this study ............................................................... 1 1.2 Aim .......................................................................................................................... 3 1.3 Methods ................................................................................................................... 3 1.4 Thesis disposition .................................................................................................... 4 1.5 Author’s contributions ............................................................................................. 6
2. Literature review ....................................................................................................... 7 2.1 PD activity at variable frequency and other arbitrary excitations ............................ 7 2.2 Failures in stator insulation ...................................................................................... 8
2.2.1 Failures of rotating machines ................................................................................ 9 2.2.2 Construction and materials of stator insulation ................................................... 10 2.2.3 PD sources in stator insulation system ................................................................ 11 2.2.4 Effect of humidity on PD in stator insulation ...................................................... 14 2.2.5 Effect of temperature on PD in stator insulation ................................................. 14
2.3 PD diagnostics on rotating machines ..................................................................... 15
3. Experimental ........................................................................................................... 17 3.1 Test objects ............................................................................................................ 17
3.1.1 Simple geometries for corona, surface and cavity discharges ............................. 17 3.1.2 Sphere-plane geometry ........................................................................................ 19 3.1.3 Crossed-bar geometry ......................................................................................... 20
3.2 Measurement systems ............................................................................................ 21 3.2.1 Time-resolved PD measurement system ............................................................. 21 3.2.2 PD measurement system with humidity control .................................................. 22 3.2.3 PD measurement system with temperature control ............................................. 23 3.2.4 Dielectric spectroscopy measurement system ..................................................... 24
3.3 Arbitrary testing voltage waveforms ..................................................................... 24 3.3.1 Half-sine voltage pulses with pause period ......................................................... 25 3.3.2 Negative step voltage pulses ............................................................................... 25 3.3.3 Trapezoidal, triangular, square voltage waveforms ............................................. 26
3.4 Analysis method .................................................................................................... 26 3.4.1 Pulse Sequential Analysis-PSA ........................................................................... 26 3.4.2 Time delay of "square" wave .............................................................................. 27

xii
4. Corona discharge .................................................................................................... 31 4.1 Current-voltage characteristic ................................................................................ 31 4.2 Needle-plane geometry without insulating plate.................................................... 32 4.3 Needle-plane geometry with insulating plate ......................................................... 33 4.4 Effect of different insulation materials on corona discharge activity .................... 35
5. Surface and cavity discharges .................................................................................. 39 5.1 PD activity at half-sine pulse voltage with pause period ....................................... 40 5.2 PD activity at trapezoid-wave voltages .................................................................. 41 5.3 Polarity effect of surface discharge at arbitrary testing voltages ........................... 44
6. Sphere-plane partial discharge on stator insulation materials .................................. 47 6.1 PD behavior at relative humidity of 29%............................................................... 48
6.1.1 Effect of voltage rising period in the trapezoidal waveform ............................... 48 6.1.2 Effect of constant-voltage period in the trapezoidal waveform ........................... 50
6.2 PD behavior at relative humidity of 8%................................................................. 53 6.3 PD behavior at relative humidity of 77%............................................................... 55 6.4 Effect of relative humidity on the PD activity ....................................................... 56
7. Crossed-bar partial discharge on stator insulation materials ................................... 61 7.1 Effect of temperature on the PD inception voltage ................................................ 61 7.2 Effect of temperature on the PD patterns of the mica-epoxy sample ..................... 62 7.3 Effect of temperature on the permittivity of mica-epoxy insulation ...................... 66 7.4 Effect of temperature on the breakdown strength of air ........................................ 67
8. Summary of papers ................................................................................................. 71
9. Conclusions and future work ................................................................................... 73
Bibliography ............................................................................................................... 75

1
Chapter 1
Introduction
1.1 Background and motivation for this study
The electrical insulation system is one of the most important components in high voltage equipment. Its condition normally limits the lifetime of the equipment and determines the safe and reliable operation of the electrical power system. The failure of the insulation system may cause a complete failure of the equipment, resulting in large financial losses to utilities and end-users.
Since electrical insulation is the critical point of the equipment, it must be designed in such a way that it must have high resistance to current flow and be safe during operation. It also should sustain the mechanical stress as well as the ambient conditions for long term performance. However, there may exist built-in defects in the insulation system potentially created by various stresses during operation or manufacturing process, even though the insulation system has passed all the required tests before installation and operation. Thus Partial Discharge (PD) may arise at these defects when a critical electric field is reached, resulting in the gradual deterioration of insulation properties and increasing the risk of failure of the equipment.
PD activity is therefore normally considered as a symptom of degradation and overstress in the insulation system. Wherever degradation occurs in the insulation system, caused by the electrical, mechanical, thermal or ambient conditions, it is generally accompanied with the generation of partial discharge [1]. The presence of PD can indicate not only the electrical stress, but also the mechanical, thermal or ambient stresses. For instance, in the insulation system of high-voltage rotating machines, voids or delamination within epoxy-mica insulation may occur due to the higher temperature during operation [2]. Mechanical force may cause the vibration of the loose bar in the stator slot, leading to the slot discharge in the air gap between the groundwall insulation and the earthed core [3]. Surface contamination on the stator winding leads to intense surface discharge and tracking [4]. Furthermore, understanding the processes and mechanism of partial discharge is also important for developing the new insulation systems which are capable of withstanding these stresses [1].
In order to avoid the unexpected breakdown of insulation system and help to reduce the cost and time of maintenance of the equipment, partial discharge measurement has been used for many years as a powerful tool to detect and interpret the signature of the locally confined insulation defects. The ability to detect, localize and interpret the PD activity is of fundamental significance in many applications. PD measurement is commonly performed both in on-line and off-line conditions. In off-line measurements, in order to reduce the power and size of the supply equipment, it is possible to apply the voltages with other

2
frequencies to detect PD activity, for example the damped AC method or a low frequency method such as 0.1 Hz [5]. The intention of these methods is that quality assessment of the electrical equipment could be performed at another frequency other than power frequency if the relevant results yielded from two compared frequencies can be expected to be similar. On the other hand, in the case that results are not similar, the information of frequency dependence of PD behavior can be obtained. The nature of frequency dependence PD behavior could be useful for the classification of different PD defects and evaluation of the degree of progressive aging [6]. PD analysis at variable frequency of the applied voltage has been investigated in previous projects at KTH [6, 7], and PD measurements specifically on stator insulation at varied low frequency have also been studied [8].
The PD appearance and its specific features are greatly influenced by the testing voltage waveform and frequency; this is because different physical processes may be stimulated by different durations of the applied waveform [9]. Every PD activity has memory characteristics which influence the sequence of PD pulses; the memory is reflected as the surface charges remaining in the proximity of the discharge site after previous discharges, in the case when a solid insulation material is limiting the discharge. During the time between two consecutive discharges, the charges deposited on the insulating surface by the PD activities can decay by different physical mechanisms, such as bulk conduction, surface conduction, neutralization and diffusion process [10, 11]. The impact of the surface charges on the PD activity, such as the repetition rate, is determined by the time constant of the charge relaxation process and the rate of change of the electrical field in the space. So under AC voltage, after the first discharge has taken place, the consecutive discharges are governed by the space charge field and the applied time-varying voltage [12]. Thus, the benefit of using arbitrary voltage waveforms, by which is meant here all the periodic non-sinusoidal voltage waveforms, is that the local conditions at defects within or on the insulation, such as electric field distribution, surface charge accumulation and decay process, change with varying the voltage waveform as well as frequency.
The above described phenomena indicate that partial discharges exhibit non-linear, stochastic, time-variant and hysteretic behavior. These properties of relevance for PD study are briefly described as: (a) non-linear: PDs do not appear below a certain inception or extinction voltage; (b) stochastic: PD pulses occur partly randomly depending on the availability of seed electrons that can initiate the discharge; (c) time-variant: PD activity strongly depends on the local conditions, for example, a cavity will change gradually with the exposure to the discharge plasma, i.e. local ageing; (d) hysteretic: for instance, PD activity may continue at a voltage lower than the inception voltage if the voltage is decreased after the stimulus has been above inception for some time.
In general, there are two common techniques to measure and evaluate the PD activity; one is the Phase Resolved Partial Discharge Analysis (PRPDA) [6, 7], which acquires and stores the frequency distribution of discharge magnitude with respect to the phase of the applied voltage during a certain time interval, and the other one is Pulse Sequence Analysis is (PSA) [13-15], which registers every discharge pulse magnitude with respect to the time and the applied voltage of PD occurrence. The benefit of the PSA method is that it identifies the sequence of the discharge pulses, since some specific features of a particular insulation defect may also be reflected in the behavior of PD sequence or repetition over time; however, the PRPD method

3
loses this information by the accumulated mapping PD patterns. Nevertheless, they are both useful to recognize the insulation defects by some expected characteristics of the PD patterns [16-20], of which for PSA method are based on the parameters of the voltage and time difference of two consecutive discharge pulses.
In summary, the existing measurement techniques and available rules for PD behavior can be improved and enhanced. PD activity needs to be further investigated under a number of different conditions and waveforms. The obtained information may help to interpret the discharge physics and contribute to the off-line PD diagnostics.
1.2 Aim
The aim of this thesis is to investigate how different or arbitrary applied voltage patterns can be used to improve the ability to differentiate between different situations of relevance for analysis of partial discharges in high voltage insulation system. One objective is to find waveforms that provide a more clear picture of certain physical mechanisms responsible for sequence of PD than sinusoidal voltages that commonly are used for this context.
The measurement techniques are applied on the stator insulation materials of use in high-voltage rotating machines, aiming to study how those voltage waveforms can be used to obtain more information of PD behavior based on mica-epoxy insulation, related to the variation of ambient conditions, such as relative humidity and temperature.
The choice of arbitrary voltage waveforms can be adjusted to what phenomenon one is looking for. The intention of this work is to improve diagnostic methods by studying PD measurements using arbitrary waveforms that could give significant contributions to the understanding of PD behavior in off-line measurements.
1.3 Methods
The first step in the experimental work was establishing a measurement system that can perform time-sequential analysis of partial discharges at arbitrary voltage simulations. The detailed descriptions of the experimental set-up and arbitrary voltage waveforms are provided in Chapter 3.
The results presented in this thesis are divided into two main parts. Brief descriptions of each part, including the used insulation material, applied arbitrary voltage waveforms as well as the content of the investigation, are summarized in Table 1.1. Fundamental study of Part I contains the PD measurements performed on three common PD sources, corona, surface and cavity discharges. For corona discharge, the study was focused on a needle-plane system, with the plane covered by an insulating layer, the effect of the insulation material properties on the corona behavior was studied by varying the different materials, i.e. polytetrafluoroethylene (PTFE), polyethylene (PE), polycarbonate (PC), polyvinylchloride (PVC), epoxy, and dry pressboard. One specific voltage waveform, i.e. periodic negative step pulses, was utilized and the results were analyzed in comparison with corona behavior without the insulation material in the needle-plane geometry.

4
With regard to surface and cavity discharges, these experiments were performed in two canonical test cells with PC plate as the solid insulation material, the aim of using arbitrary testing voltages was to better distinguish these two PD sources by phase resolved PD patterns. A number of waveforms were explored in the study, in order to conclude the most useful waveforms for the distinction.
The study of Part II then focused on the practical application of the arbitrary voltage stimulus on the stator insulation of high-voltage rotating machines. Two discharge defects based on the mica-epoxy insulation were created in the laboratory. One was the sphere-plane geometry modelling the slot discharge occurring in the air gap between the spherical metal surface and the insulating surface of a short length of commercial stator bar, and the other one was the crossed-bar geometry based on the cured samples using mica tapes, where the discharge took place in the air gap between two mica-epoxy surfaces. Based on the fundamental study, the trapezoidal waveforms, including triangular and square waveforms, which can provide more information of discharge characteristics, were mainly applied in this part, focusing on the changing of PD activities with varying each parameter of the voltage waveforms. The ambient conditions, i.e. relative humidity and temperature, were also controlled to investigate their influence on the PD behavior at these arbitrary voltages, since the machine may operate in such ambient conditions.
Table 1.1 Brief descriptions of the PD measurements in this work
PD measurements Insulation materials
Arbitrary waveforms Investigation
Part I: fundamental
study
corona discharge PC, PE, PTFE, PVC, epoxy,
dry pressboard
negative step pulse
effect of material property
(Chapter 4)
surface discharge PC
half-sine, trapezoidal, including triangular and square
enhanced distinction of two
PD sources (Chapter 5) cavity discharge
Part II: practical
study
sphere-plane discharge
(in a metal-insulation air gap)
mica-epoxy (commercial stator bar) trapezoidal,
including triangular and square
effect of relative humidity
(Chapter 6)
crossed-bar discharge (in an air gap between two
insulating surfaces )
mica-epoxy (cured mica
tapes in the lab)
effect of temperature (Chapter 7)
1.4 Thesis disposition
This PhD thesis contains nine chapters and is based on the Papers I-IV, which are attached at the end of the thesis. The contents are organized as follows:
5
The background and the motivation for this work as a whole, the aim and the general method of the study are presented in Chapter 1. This chapter also contains the author’s scientific contributions.
The literature review of the relevant research is given in Chapter 2, which includes a review of PD activity at variable frequency and other arbitrary voltage excitations, some basic knowledge related to stator insulation system, including failure of the rotating machines, construction and materials of stator insulation, PD sources in the stator insulation system, the effect of ambient conditions on PD behavior, on-line and off-line PD diagnostics on the rotating machines.
Chapter 3 provides the descriptions of the test objects and the measurement systems. It also introduces several types of arbitrary voltage waveforms used in this work. The pulse sequential analysis method and the time delay of square voltage waveform are also explained.
Chapter 4 presents the experimental results from corona discharge stimulated by a periodic negative step-voltage waveform in the needle-plane geometry with an insulating plate introduced in the system, i.e. covered on the surface of the ground electrode, compared with the corona discharge in the case of without the insulation material in the discharge system. The effect of different material properties on the evolution of cumulative number of corona pulses was studied.
Chapter 5 compares results from measurements of surface and cavity discharges in two canonical test cells at several arbitrary voltage waveforms. Compared with the PD patterns at traditional sinusoidal voltage, an enhanced distinction method for these two discharge sources based on trapezoidal and square voltage waveforms was achieved, on the condition that the surface discharges are produced in an asymmetric test cell.
Chapter 6 investigates the effect of the relative humidity on the sphere-plane discharge, simulating slot discharge, which takes place in an air gap between a spherical metal electrode and the mica-epoxy surface of the stator insulation. Periodic trapezoidal voltage waveforms were applied. The effect of the two features of trapezoidal voltage waveform on the discharge activity was studied: these are the constant derivative of the applied voltage dU/dt, ranging from the maximum possible (square-wave) to the minimum possible (triangle-wave) for a given amplitude and period of the voltage, and second one of a period of constant voltage of peak value between rising and falling voltage periods.
Chapter 7 studies the effect of the ambient temperature on the crossed-bar discharge in the air gap between two mica-epoxy surfaces at trapezoidal voltage waveforms, including the square waveform. To verify the influence of insulation material variation with temperature on the PD behavior, the relative permittivity of the mica-epoxy insulation changing with temperature was measured. The changing of PD patterns with temperature was studied, focusing on the decreasing behavior of the PD inception voltage with temperature. The changing of the breakdown strength in air with temperature was estimated by Paschen’s law.
Chapter 8 summarizes Papers I-IV.
General conclusions and suggestions for the future work are given in Chapter 9.
6
1.5 Author’s contributions
The author is fully responsible for Papers I-X. The results in Paper I through X were developed by the author, who performed all the laboratory measurements and most of the analysis work, in collaboration with the Ph.D. students in the High Voltage Engineering and Insulation Diagnostics group. The co-authors of these papers mainly contributed to the discussion of some measurement results. The author also participated in part of the experimental work in paper XI-XIV, and revision of those papers.
The entire work was initialized and supervised by Assoc. Prof. Hans Edin, with Dr. Nathaniel Taylor as co-supervisor, who contributes a lot to the revision of the paper.
7
Chapter 2
Literature review
This chapter reviews some important previous research that is relevant for and has motivated this work. The review is divided into three sections: experimental and physical modelling of partial discharge, focused on the work that utilizes other test frequencies and waveforms than traditional 50 Hz or 60 Hz AC voltage; some basic knowledge of stator insulation systems, for instance, construction and materials of stator insulation and PD sources in stator insulation system; and finally on-line and off-line PD diagnostics on rotating machines.
2.1 PD activity at variable frequency and other arbitrary excitations
The primary aspect of using other frequencies than power frequency (50 Hz or 60 Hz) in the high voltage diagnostic field is to reduce the required power of supply source, since an external source of the size required to supply a power frequency voltage is not always practical or economically realistic, especially for highly capacitive test objects, such as a power cable or large stator windings, which requires high capacitive power at power-frequency AC stress condition. For this reason, the developed methods to reduce the capacitive charging power are to detect the presence of PD at other frequencies, which can be achieved in two ways by utilizing [5]: (1) very low frequency (VLF) method, where PD is measured at low frequency AC, like 0.1 Hz, that keeps the periodic alternation of the applied field; (2) damped AC method (DAC) or oscillating voltage waves (OVW), in the range of 20-1000 Hz, i.e. a transient with finite energy content.
Low frequency PD measurements have been covered much in previous projects at KTH [6-8]. Physical models based on PD in a dielectric bounded cavity have also been described in [7, 21-23] to compare with experimental results at variable frequencies; most of the results even cover the frequencies above 50 Hz. The variable low frequency measurements have also been applied on generator bars [24] and cables [24, 25]. With respect to the DAC method, on site PD diagnosis of power cable using oscillating wave test systems is discussed in [26, 27]. Laboratory PD measurements in particular on power cables [28, 29] and full scale stator insulation system [30] at continuous 50 Hz AC and DAC voltages with an oscillation of some hundreds of Hz show no major differences for the main PD quantities, for instance, PD inception voltage, PD magnitude and phase-resolved PD patterns. These cases are selected to demonstrate that the PD behavior is less affected by the changing of the oscillating frequency. However, PD parameters measured by VLF and DAC methods may differ from those detected at 50 or 60 Hz AC voltage.
Under certain conditions, the PD activity in a cavity is dependent on the applied frequency. This frequency dependence behavior changes with the applied voltage amplitude, the cavity
8
diameter and the cavity location, i.e. insulated or electrode bounded [31]. The influence of the frequency on the PD process is mostly due to the relation between the decay of the deposited charges on the insulating surface and the applied frequency. Surface charge decay will give rise to PD frequency dependence when the decay time constant is close to the applied voltage period; this will cause a reduction of the field in the cavity and consequently a decrease of the number of PDs. The effect is stronger at lower applied frequency, due to the longer period time. Thus, the surface charges deposited from preceding discharges have less effect on the consecutive discharge pulse [22].
There exists a large amount of studies about PD initiated by other arbitrary voltages [32-44]. As a practical matter, for instance, ramped high direct-voltage test has been used to identify stator windings that approach failure without accelerating the deterioration process [32]. To clarify the effect of arbitrary voltage with harmonics generated in the power system on insulation system, PD characteristics in a cavity under superimposed sinusoidal voltages, which was a 60Hz fundamental sinusoidal wave and a superposed high frequency sinusoidal wave, were investigated in [33]. PD analysis of system stressed by square voltage waveforms has shown much attention during recent time, as the Pulse Width Modulation (PMW) technique characterized by square waveforms has been widely used in modern power converters nowadays [34-36].
On the other hand, the application of other arbitrary waveforms is aimed to obtain more information about the discharge physics, such as PD measured at triangular voltage [37-39], trapezoidal voltage [40] and fundamental work of PD during fast rising fronts [41, 43]. It was observed in [37] that the PD amplitude was strongly affected by the instantaneous applied voltage, and the occurrence of a discharge event was determined by the time derivative of the applied voltage dU/dt by comparison of the PD patterns under sinusoidal and triangular voltages; the probability of PD occurrence decreased as the dU/dt decreased. By applying a semi-square voltage with a rise time of several microseconds, the PD measurement in [41] showed that the rise time of the applied voltage can influence the PD extinction voltage in certain insulation systems.
From this short review, it is clear that the measurements and modelling of PD activity at different frequencies and waveforms are obviously of great interest and much more relevant work can be done.
2.2 Failures in stator insulation
High-voltage rotating machine is a critical part in the electric power system. A failure in the stator insulation causes a low-impedance path between conductors that are supposed to be insulated from each other, such as those of different turns, bars, or phases, or from phase to core [8]. This section reviews some surveys and summaries about the failure of the rotating machines; then introduces the construction and materials of stator insulation, and lists some common PD sources in stator insulation system; finally the effect of ambient conditions, i.e. relative humidity and temperature, on partial discharge is reviewed.
9
2.2.1 Failures of rotating machines
The main components of a rotating machine are the stator winding, rotor winding and bearings that support the rotor. Some surveys of the distribution of failures over components have been undertaken; one study cited in [45] shows that the root causes that caused failures in motors are located in bearing (41%), stator (37%), rotor (10%) and other (12%). An IEEE working group report of problems for hydro-generators presents in [46] that stator winding insulation problems caused 43% of the failure. It is also mentioned as an opinion in [45] that contrary to the case for air-cool machines, hydrogen-cooled machines generally have a higher proportion of failures in rotors than in stators windings.
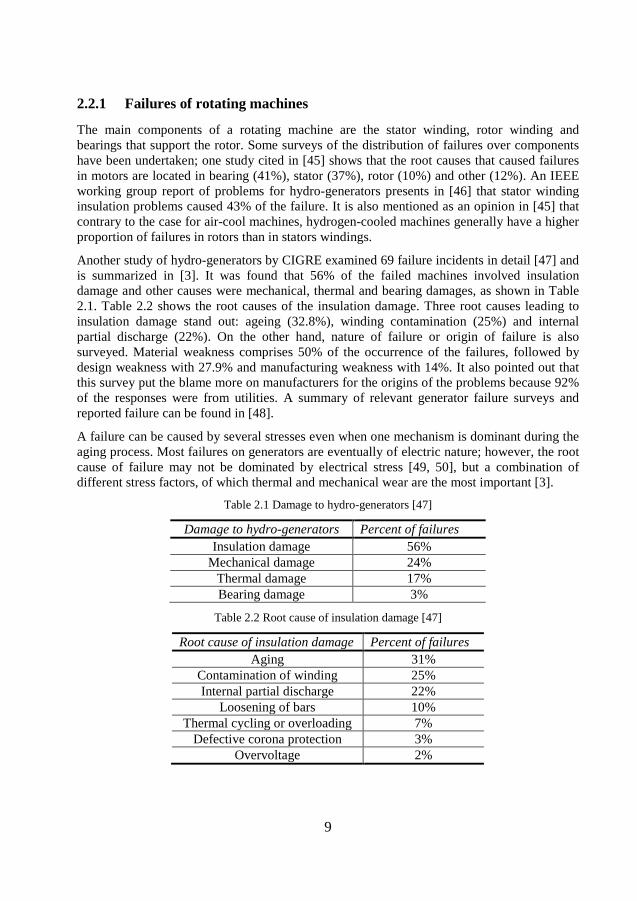
Another study of hydro-generators by CIGRE examined 69 failure incidents in detail [47] and is summarized in [3]. It was found that 56% of the failed machines involved insulation damage and other causes were mechanical, thermal and bearing damages, as shown in Table 2.1. Table 2.2 shows the root causes of the insulation damage. Three root causes leading to insulation damage stand out: ageing (32.8%), winding contamination (25%) and internal partial discharge (22%). On the other hand, nature of failure or origin of failure is also surveyed. Material weakness comprises 50% of the occurrence of the failures, followed by design weakness with 27.9% and manufacturing weakness with 14%. It also pointed out that this survey put the blame more on manufacturers for the origins of the problems because 92% of the responses were from utilities. A summary of relevant generator failure surveys and reported failure can be found in [48].
A failure can be caused by several stresses even when one mechanism is dominant during the aging process. Most failures on generators are eventually of electric nature; however, the root cause of failure may not be dominated by electrical stress [49, 50], but a combination of different stress factors, of which thermal and mechanical wear are the most important [3].
Table 2.1 Damage to hydro-generators [47]
Damage to hydro-generators Percent of failures Insulation damage 56%
Mechanical damage 24% Thermal damage 17% Bearing damage 3%
Table 2.2 Root cause of insulation damage [47]
Root cause of insulation damage Percent of failures Aging 31%
Contamination of winding 25% Internal partial discharge 22%
Loosening of bars 10% Thermal cycling or overloading 7%
Defective corona protection 3% Overvoltage 2%
10
2.2.2 Construction and materials of stator insulation
The stator of an AC rotating machine is a stationary construction which consists of three main components: a core of laminated steel that carries the magnetic fields, the copper conductors for carrying current induced by the stator’s magnetic field, and the electrical insulation with a primary purpose of preventing short circuits between the conductors or to ground. The life time of a stator winding is mostly limited by the electrical insulation rather than by the conductors or the steel core [45]. Thus the stator insulation system is of significant importance.
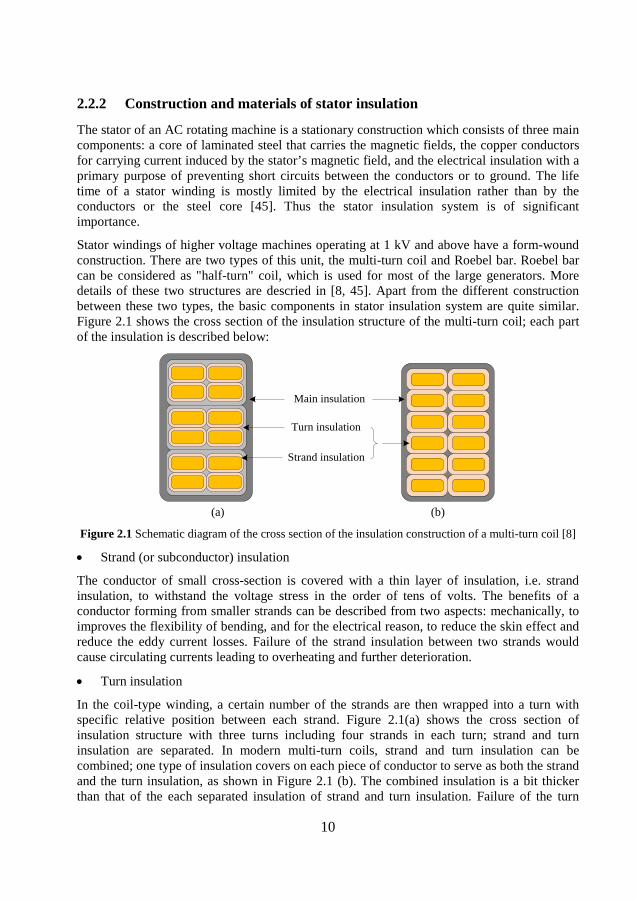
Stator windings of higher voltage machines operating at 1 kV and above have a form-wound construction. There are two types of this unit, the multi-turn coil and Roebel bar. Roebel bar can be considered as "half-turn" coil, which is used for most of the large generators. More details of these two structures are descried in [8, 45]. Apart from the different construction between these two types, the basic components in stator insulation system are quite similar. Figure 2.1 shows the cross section of the insulation structure of the multi-turn coil; each part of the insulation is described below:
Main insulation
Turn insulation
Strand insulation
(a) (b)
Figure 2.1 Schematic diagram of the cross section of the insulation construction of a multi-turn coil [8]
• Strand (or subconductor) insulation
The conductor of small cross-section is covered with a thin layer of insulation, i.e. strand insulation, to withstand the voltage stress in the order of tens of volts. The benefits of a conductor forming from smaller strands can be described from two aspects: mechanically, to improves the flexibility of bending, and for the electrical reason, to reduce the skin effect and reduce the eddy current losses. Failure of the strand insulation between two strands would cause circulating currents leading to overheating and further deterioration.
• Turn insulation
In the coil-type winding, a certain number of the strands are then wrapped into a turn with specific relative position between each strand. Figure 2.1(a) shows the cross section of insulation structure with three turns including four strands in each turn; strand and turn insulation are separated. In modern multi-turn coils, strand and turn insulation can be combined; one type of insulation covers on each piece of conductor to serve as both the strand and the turn insulation, as shown in Figure 2.1 (b). The combined insulation is a bit thicker than that of the each separated insulation of strand and turn insulation. Failure of the turn

11
insulation results in large currents, causing overheating which can melt the conductors and destroy the groundwall insulation. In addition, in a Roebel bar winding, only strand insulation is used and no turn insulation.
• Groundwall (or main) insulation
Several turns in a package are then wrapped with a thicker layer of outer insulation, i.e. groundwall insulation, to separate the conductors from the grounded stator core. Groundwall insulation is the main high-voltage insulation in the stator winding. It must meet the requirements to withstand the electrical, thermal and mechanical stresses that it is subjected to. Furthermore, it must also help to prevent the winding from vibrating under the magnetic force in the slot. Failure of the main insulation is the main type of failure, caused by continuous aging rather than by mechanical damage or severe transients [8].
With respect to the materials of groundwall insulation in the stator winding, an overview of some significant developments has been described in [45]. Nowadays, the most common materials used for groundwall insulation is as follows, with consisting of three basic components [8, 51]:
1) A barrier material that is resistant to PD and tree growth: Mica flakes 2) A support material that gives mechanical strength and heat transfer: Glass fiber 3) A binder material that fills the air gaps between the different layers of barrier and the
support material: Epoxy
These materials are produced as mica tapes and wrapped around the surface of the turn or strand insulation to form the main insulation. In order to fill any air gaps between the mica tapes, thermoset binder materials are used. There are three major technologies to get the impregnant into the main insulation [8, 51]:
1) Vacuum Pressure Impregnation (VPI) of individual stator windings: Mica tapes with a resin content of 5%-15% are used in VPI. The winding is dried and then put into a vacuum chamber to remove the air. The chamber is then flooded with impregnant under high pressure to force the impregnant into the insulation. The system is then heated to cure after cleaning off the extra impregnant.
2) Global VPI of the complete stator: The entire stator is impregnated after the windings are inserted in their slots in the core. In such a way, the air-gaps between the stator windings and the slot are also filled.
3) Resin-rich processes: The impregnant is combined in the mica tapes, with a resin content of 40%-45%, and the windings are then cured under pressure at the curing temperature.
2.2.3 PD sources in stator insulation system
Even though modern machines based on mica-epoxy insulation system have been designed to be able to withstand an appreciable level of discharges without significantly affecting the insulation properties, for instance, internal discharge in small volumes, some other PD activities are even strongly detrimental to the insulation system. Moreover, the occurrence of PD activity in high voltage machines can be efficiently used to detect the insulation aging and evaluate the insulation properties. Figure 2.2 shows the main PD sources existing in stator

12
insulation system of the high voltage rotating machines, such as internal discharge, delamination, end-winding discharge, surface tracking and slot discharge [2, 19, 50]. The typical PD patterns of each PD source are also presented in [19, 50].
HV conductor
main insulation
Laminated earthed core
voids delamination
slot exit discharge(due to bar vibration)
slot semiconductive coating field grading
slot discharge (due topoor earthing of bar surface
or inappropriate coating)
cracked insulation
tracking on surface contamination
damaged gradingend-winding discharge
to the adjacent stator bars
contact breaks
Figure 2.2 Schematic diagram of PD sources in stator insulation system of the rotating machines
• Void and delamination
Voids within the groundwall insulation due to the manufacturing process or thermal aging are usually unavoidable even in the modern mica-epoxy insulation system. Normally, they are at low risk of leading to considerable aging; a certain amount of PD activities from small voids in the main insulation is acceptable.
Delamination, wide but shallow voids between tape layers or between tape and conductors, mainly results from poor mica-paper tape, poor impregnation, or insulation expansion due to thermal overstressing. The relatively large area of a delamination is normal to the applied electric field. The delamination will reduce the thermal conductivity of the insulation which may lead to accelerated aging or even a thermal breakdown [2].
• Slot discharge
Slot discharge, which occurs in the air gap between the surface of the stator bar and the laminated magnetic core, has been considered as the most severe damage to the stator winding groundwall insulation [46]. Slot discharge only occurs in the winding operating at the higher voltage end of each phase due to the high voltage across the air gap; its typical PRPD pattern is characterized by a strongly asymmetric pattern, which is triangular with a sharp slope at the onset of the positive discharge appearing during the negative polarity of the applied voltage [50]. This pattern varies with other conditions, such as temperature and humidity in the air. There are two main mechanisms that give rise to the slot discharge activity [8, 52]:
Mechanical slot discharge is developed from loose bars in the slot due to, for instance, the shrinking of insulation over years caused by thermal aging. This allows vibration of the bar in the slot, leading to abrasion of first the semiconductive coating and then the groundwall insulation of the bar. When the bar is vibrating but most of the semicoductive coating is intact,

13
the contact sparking will occur to transfer current from the slot semiconductive coating to the earthed core, which is referred as "Stage 1 slot discharge". Then "Stage 2 slot discharge" occurs when the semiconductive coating is abraded away, leading to the PD across the air gap between the exposed groundwall insulation surface and the core. In this stage, the discharge can accelerate the degradation of the insulation beyond the effect of the mechanical abrasion, and this fast mechanism would cause a failure in a short time of two years.
Electrical slot discharge is different since the looseness of the bar is not needed; the root cause is a poorly manufactured semiconductor coating, with inappropriate surface conductivity or with voids between the groundwall insulation and the coating. If the surface conductivity is too low, a significant voltage could build up between the surface of the winding and the core in parts where the winding surface is not in direct contact with the core. The PD activity that follows may lead to the breakdown of the insulation between the winding and the core. On the other hand, poor electrical connection of the conductive coating to ground also can initiate the slot discharge. In this case, the discharges are not especially large, but the rate of PDs is higher.
One typical and systematic investigation of slot discharge in the laboratory has been presented in [53-55], including the influence of gap size, temperature and humidity, as well as the surface degradation caused by different stresses, such as electrical, thermal and mechanical stress, on the slot discharge activity. Some other work related to the slot discharge also has been done, for instance, the calculation in [56] gives a maximum acceptable surface resistivity for the surface coating of the bar. Detection of slot surface discharges in high voltage machine stator windings has been performed in [57, 58], and the method in [59] is applicable to detect the slot discharge even during the operation of the machine.
• End-winding discharge
On the end arms of a stator winding, there are three common types of discharge activity, namely, surface tracking [4], corona discharge at the semi-conductor or grading paint junction, and end-winding discharge, also known as bar-to-bar discharge [50, 60-64]. Surface degradation caused by corona discharge at the semi-conductor or grading paint interface can be observed by off-line normal visual inspections and then cleaned during scheduled maintenance; however, the insulation damage caused by bar-to-bar discharge could ultimately require repair of the windings [62]. The windings operating at high voltage in two different phases require a minimum separation to avoid PD in the air gap between them. Unfortunately, in some cases the bars are much closer to each other due to the economized design where manufacturers place the windings into a smaller volume, along with reducing the thickness of the groundwall insulation, or due to deficiencies during the manufacturing process [63, 64]. The inadequate spacing results in the air between two windings having higher electrical stress, therefore, end-winding discharge may occur in the end arm part of the winding between two high voltage bars of different phases.
In addition, PD activity can generate ozone, which results in a white power deposited on the surface of the bar, giving a clear evidence of slot discharge and end-winding discharge by visual inspections [63, 64].
14
2.2.4 Effect of humidity on PD in stator insulation
Ambient conditions, such as temperature, relative humidity and contaminations, have a significant effect on PD levels. Air humidity itself does not cause aging, but it can lead to aging when combined with other stress. The absorption of water by an in-service aged insulation can significantly deteriorate its remaining life [65].
One clear evidence about the impact of relative humidity on the PD activity in operating machines is that by monthly on-line monitoring on the generator up to 9 years, the PD activities on generators in winter were higher than that in summer by a factor greater than 100 because of the seasonal changes in humidity [66]. There exist a large number of relevant studies about this effect [55, 67-73], most of them focusing on the variation of PD inception and extinction voltage, PD intensity, breakdown strength, surface conductivity of the insulating material, surface charges accumulation on the material and the statistical time lag of discharge, and so on. From those studies, it has been recognized that humidity has a negative correlation with PD activities: the discharge activity decreases as the humidity increases. For instance, the external PD activities such as slot discharge was observed to be strongly reduced and even disappeared if the ambient air humidity goes above 50% [70]. A similar behavior in [71] shows that surface discharges on an epoxy bar disappeared at the eighth day of exposure to humidity of 80%. It has been explained that this is due to the electronegative nature of water molecules, which can capture electrons and reduce the availability of free electrons to generate electron avalanches [55]. However, lower PD activities at high humidity do not directly mean that humidity reduces damage to the insulation surface; the degradation of epoxy resin exposed to a given level of PDs can be more severe in moist air than in dry air [73].
2.2.5 Effect of temperature on PD in stator insulation
Even though PD behavior is considered as a consequence of the higher electric stress, the temperature was found to be an important factor that has significant effect on the partial discharge mechanism and accelerates the aging processes in the insulation system. There exist several mechanisms that may contribute to the effect of temperature on PD behavior:
The PD measurements during short-term test on mica-epoxy insulation performed in [74] showed that PD charges were higher at 135 °C than that at 20 °C. This was attributed to the higher field in the cavity, due to the increased permittivity εr of epoxy resin, as a polar dielectric, and easier electron emission from metal or solid dielectric traps with the increasing temperature, increasing the probability of PD occurring. Furthermore, the permittivity of epoxy was related to the temperature by approximately a power law. Temperature affected also the charge storage and charge diffusion [75].
The combined effect of PD and temperature up to 80 °C in a narrow air gap in epoxy was studied in [76]. It was found that the effect of PD on aging was strongly reduced at 80 °C, i.e. the glass transition temperature, because the softening of the epoxy decreases the effect of particle bombardment on the epoxy surface. For the same reason, the lifetime tests performed on epoxy resin samples with a flat cavity showed that the lifetime of the materials tended to increase with temperature between 30 °C to 80 °C [77].

15
A study of PD activity at 20 °C and 80 °C in a spherical void in epoxy resin system was presented in [78, 79]. The decrease of the PD repetition rate and the increase of the PD magnitude with temperature were ascribed to an increase of the material work function with increasing temperature by using a numerical model [79]. At 80 °C, the longer lifetime of charges deposited on the void "north" and "south" pole area gave the lower first electron availability for the discharge. This can produce an increase of the discharge time lag and a strong reduction of discharge rate.
In practical insulation in high voltage rotating machines, temperature has different influence on the different PD defects. For slot discharge, there is a significant increase in the amplitude and number of PD pulses with increasing temperature [19, 53, 55]. This trend was explained by the increase in the electron’s thermal energy, making ionization more effective and providing a large number of initial electrons by photoemission [80]. End-winding discharge has the same correlation with temperature, however, PD intensity of internal discharge decreases with the increasing temperature [19].
Temperature has a complex effect on the PD activity; it can decrease the breakdown strength of the air gap, but also change the property of the insulation materials, for instance, the combined effect of temperature and PD deposited by-products may change the conductivity of epoxy [81]. Therefore more work can be done to investigate the effect of temperature on PD behavior and discharge physics.
2.3 PD diagnostics on rotating machines
PD tests can help to identify stator windings that have insulation problems and evaluate the condition and remaining life of high-voltage stator winding insulation systems. A deteriorated winding could have PD pulses at least 30 times higher than a winding in good condition [82]. There are several types of PD detection methods available to apply on rotating machines, since PD are accompanied by several physical manifestations, such as electrical pulses, acoustic pulses, light and some byproducts of the chemical reactions, like ozone. A good summary of each method for PD measurements can be found in [83]. Rotating machines are unusual among high-voltage equipment; they do not have specifications of acceptable PD levels. This is due to the large magnitudes that can be tolerated by the mica-based insulation, and the great difference in acceptable magnitude between different types of PD sources in the stator winding insulation [8].
On-line PD monitoring is common on large or important machines, giving good trending and warning of rapid changes in activity. On-line PD measurement can find loose, overheated, and contaminated windings in stators of motors and generators well before these problems lead to failure; it can also determine whether the manufacturing or insulation problems are severe enough to shorten the winding life [84, 85]. However, it is difficult to obtain good PD data from on-line measurements due to some issues, such as electrical noise and attenuation [83]. When the machine is operating connected to the power grid, there is interference from signals or discharges generated by other sources such as attached equipment and disturbances from radio stations. Furthermore, the PD signal produced by the discharge propagates through the stator winding to the point where it can be measured; the amplitude and shape of the pulse

16
would be distorted during the propagation; this also gives difficulties in the measurement and interpretation of the PD pulses [83].
Off-line PD testing is a good complement to on-line PD testing, even though it has some major drawbacks. For instance, a separate power source is needed to energize the winding; the machine may be required to be partially disassembled; the ambient conditions, such as the gas composition, pressure and humidity are different from the operating conditions; in particular, the temperature of the winding is usually lower than the operating temperature. In addition, it may not detect the slot discharge or loose bars since there is no mechanical force acting within the machine. On the other hand, off-line PD test methods also provide some advantages: first of all, some noise sources, such as electromagnetic interference, can be reduced because the machine is not connected to the power grid or any other electric equipment. The inception and extinction voltage of the PD can also be determined. Furthermore, visual inspections can be carried out, helping to identify the PD sources [83, 86].
Concerning the great amount of work that has been done on the PD diagnostics on rotating machines, it is suggested that off-line PD tests could be improved, for instance, in the developing method which can give a complete physical picture of the PD source. The voltage application of variable frequency and waveforms might give the contributions to this improvement.
17
Chapter 3
Experimental
3.1 Test objects
To get a general impression of the effect of arbitrary voltage waveforms on PD activity, PD tests were first performed in the test cells for the common PD sources of corona, surface and cavity discharges; then geometries that imitate more specific PD defects based on the stator winding insulation of high-voltage machine, i.e. sphere-plane discharge and crossed-bar discharge, were used on mica-epoxy stator insulation.
3.1.1 Simple geometries for corona, surface and cavity discharges
A schematic diagram of test cells with three constructions which may generate PD within or along an insulation material is shown in Figure 3.1. These represent canonical cases of corona discharge, surface discharge and internal discharge in a cavity, respectively.
In the needle-plane geometry, as shown in Figure 3.1(a), a circular plane brass electrode with a diameter of 82 mm was used as the ground electrode; a stainless steel needle of length 20 mm with a tip radius of 15 μm was placed above the center of the ground electrode. A layer of insulating material was covered over the plane electrode. To study the influence of the insulating material on corona discharge, six different materials with the same thickness of 1 mm and the same area of 85 mm × 85 mm were used. These were polyethylene (PE), polycarbonate (PC), polyvinylchloride (PVC), polytetrafluoroethylene (PTFE), epoxy, and dry pressboard. PD activity with these various materials present was compared with the case of the corona discharge with no insulating plate in the geometry. The distance between the needle tip and the insulating material was kept to 10 mm. More details of each insulating material can be seen in paper II.
The test cell for surface discharge was designed to achieve progressive surface discharge along the insulating surface. The high-voltage brass electrode had a rod shape with a diameter of 6 mm and a straight-cut face on one end, which was pushed against the insulating surface to easily initiate surface discharge around the edge, as shown in Figure 3.1(b). The polycarbonate plate with a thickness of 0.25 mm completely covered the surface of the brass ground electrode. When the tangential electric field stress on the insulating surface reached a critical inception value, the surface discharge appears. Figure 3.1(c) shows the geometry for cavity discharge: three polycarbonate plates were pressed together to put in between two flat steel electrodes. A square hole with sides of 10 mm was made in the central plate of the stack,

18
to create a cavity with a height of 0.25 mm. Other dimensions of the components in each test cell can be seen in Figure 3.1.
10
29
Insulation material
1
HV electrode
Tip radius: 15 μm
8285
(a)
Polycarbonate plate
90100
HV electrode
6
0.25
(b)
HV electrode
Polycarbonate plates
0.25
10
45
3
3
(c)
Figure 3.1 Schematic of three test cells for PD sources in air: (a) corona discharge; (b) surface discharge; (c) cavity discharge. The figures are not drawn strictly to scale. All dimensions are in millimeters.
19
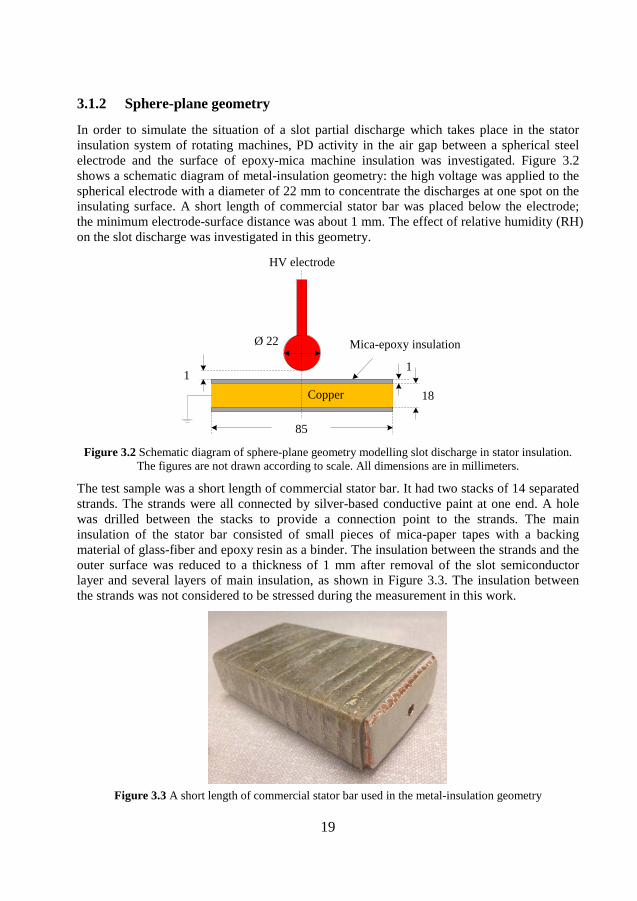
3.1.2 Sphere-plane geometry
In order to simulate the situation of a slot partial discharge which takes place in the stator insulation system of rotating machines, PD activity in the air gap between a spherical steel electrode and the surface of epoxy-mica machine insulation was investigated. Figure 3.2 shows a schematic diagram of metal-insulation geometry: the high voltage was applied to the spherical electrode with a diameter of 22 mm to concentrate the discharges at one spot on the insulating surface. A short length of commercial stator bar was placed below the electrode; the minimum electrode-surface distance was about 1 mm. The effect of relative humidity (RH) on the slot discharge was investigated in this geometry.
Mica-epoxy insulation
85
1Copper
1
Ø 22
HV electrode
18
Figure 3.2 Schematic diagram of sphere-plane geometry modelling slot discharge in stator insulation.
The figures are not drawn according to scale. All dimensions are in millimeters.
The test sample was a short length of commercial stator bar. It had two stacks of 14 separated strands. The strands were all connected by silver-based conductive paint at one end. A hole was drilled between the stacks to provide a connection point to the strands. The main insulation of the stator bar consisted of small pieces of mica-paper tapes with a backing material of glass-fiber and epoxy resin as a binder. The insulation between the strands and the outer surface was reduced to a thickness of 1 mm after removal of the slot semiconductor layer and several layers of main insulation, as shown in Figure 3.3. The insulation between the strands was not considered to be stressed during the measurement in this work.
Figure 3.3 A short length of commercial stator bar used in the metal-insulation geometry

20
3.1.3 Crossed-bar geometry
PD activity in a crossed-bar geometry was also studied. The test sample was a short length of cured stator insulation around a short copper bar, as shown in Figure 3.4. The copper bar with a dimension of 100 mm × 30 mm × 5 mm was wrapped with Isovolta CALMICAGLAS 0409 mica tape, as shown in Figure 3.5, half-lapped to give a total thickness of 6 layers. This tape consists of mica paper based on calcined muscovite, a glass cloth carrier and mixed with a thermosetting epoxy-novolac resin. The tape has a thickness of 0.18 mm and a width of 25 mm, and can be easily wrapped by hand. After that, the bar wrapped with mica tape was placed between two steel plates and squeezed on its plane surface with force from clamps distributed by means of springs along the length to give appropriate pressure for curing; a Teflon plate was added between the surface of the mica tape and the steel plate in order to separate the plates easily after curing. Then the entire structure was put into the oven for the tape’s specified curing conditions of 4 hours at 160 °C. The thickness of the insulation wrapped on the copper bar was reduced to approximately 0.7 mm on the plane sides due to the shrinking of the insulation during the curing process. The surface of the narrower sides of the sample without the pressure during curing was slightly polished to get a smooth surface, and its insulation was also brought to a thickness of 0.7 mm after reduction by the polishing. The ends of the copper bars where no tape was wrapped provide the connection points.
To form a crossed-bar configuration in open air, two such samples were placed to cross at 90°, with the narrow sides facing across an air gap distance of 0.25 mm. The area of insulation exposed to the highest field on the sides of two bars was thus approximately 6.4 mm × 6.4 mm. The top bar was connected to the high voltage by a high voltage bushing and the bottom one was set into a slot in a piece of wood and grounded, as shown in Figure 3.6. The effect of temperature on the crossed-bar discharge was investigated in this configuration.
Figure 3.4 Lab-made mica-epoxy surface of simple end-arm models used in the study

21
Figure 3.5 CALMICAGLAS 0409 Mica tape
Figure 3.6 Crossed-bar geometry based on lab-made stator bars
3.2 Measurement systems
3.2.1 Time-resolved PD measurement system
The time-resolved PD measurement system consists of an HP 33120A function generator, a TREK 20/20 high-voltage amplifier, a detection resistance, a coupling capacitance, a Yokogawa DL750 Scope Corder oscilloscope and a control computer, as shown in Figure 3.7.
The testing voltage was generated by the function generator and then amplified by the high-voltage amplifier (with a gain of 2000). The high voltage was applied to the test cell, which was in series with the detection resistance R of 50 Ω (or 1 kΩ for corona discharge). The coupling capacitance Ck was 500 pF (or 250 pF for crossed-bar discharge). The discharge pulses were acquired with the oscilloscope, with 12-bit A/D resolution, a sampling rate of 10 MSa/s, and a deep memory of 250 MSa, which permitted long-time pulse sequence analysis. The computer controlled the testing voltage and recorded the PD signals through a GPIB interface to the function generator and oscilloscope.

22
Figure 3.7 Schematic diagram of time-resolved PD measurement system
3.2.2 PD measurement system with humidity control
In two studies, the time resolved PD measurement system was used together with apparatus that could control the relative humidity in the atmosphere. In one of these, the control was needed in order to eliminate the influence of relative humidity on the surface and cavity discharge. In the other one the purpose was to investigate how the relative humidity would affect the slot partial discharge.
The entire test cell was placed into a well-sealed plastic chamber where the relative humidity could be controlled. A saturated salt solution [87] was used to control the relative humidity of the ambient air inside the chamber for the wet studies, and a silica gel desiccant was used for the dry study. The relative humidity and the temperature inside the chamber were monitored by a Testo 625 thermo hygrometer, as shown in Figure 3.8. The test sample was kept in the chamber at room temperature (22-23 ºC) for at least 15 hours in the presence of the saturated salt solution (or silica gel desiccant) in order to reach the steady state of the whole system before the measurement. After 5 or 6 hours’ continuous PD measurement, the chamber was left open at least 2 hours to release the ozone from the chamber and let it recover back to the room humidity before introducing another saturated salt. Three different relative humidity levels were chosen in this work: approximately 8% given by silica gel, 29% given by potassium acetate, and 77% given by sodium chloride.
Figure 3.8 Schematic diagram of time-resolved PD measurement system with humidity control

23
3.2.3 PD measurement system with temperature control
Figure 3.9 shows the time-resolved PD measurement system with temperature control, which was used in the study of the effect of temperature on the crossed-bar discharge activity. The high voltage was applied to one end of the top bar in the crossed-bar geometry, as shown in Figure 3.6. The entire test cell, together with the coupling capacitance of 250 pF (two 500 pF LCC ceramic capacitors in series) was placed into a Weiss Technik climate chamber where the temperature was controlled and monitored, as shown in Figure 3.10. The temperature inside the climate chamber was varied from 23 ºC to 98 ºC with roughly 20 degree steps, i.e. 23 ºC, 40 ºC, 60 ºC, 80 ºC, 98 ºC. The discharge pulses for each temperature were captured after the stator bars had been exposed to each temperature for at least 20 minutes.
Figure 3.9 Schematic diagram of time-resolved PD measurement system with temperature control
Figure 3.10 Weiss Technik climate chamber used in this work

24
3.2.4 Dielectric spectroscopy measurement system
One important parameter which could be affected by the temperature and help to interpret the variation of the PD behavior with temperature is the relative permittivity εr of the mica-epoxy insulation material. Therefore, the complex capacitance was measured by an IDAX 300 dielectric spectroscopy analyzer for the frequency range of 0.1 mHz to 10 kHz, at the maximum voltage of its internal AC voltage source, 200 Vpeak. A detailed description of IDAX 300 can be found in [8]. The results are presented in Section 7.3.
The schematic diagram of this dielectric spectroscopy measurement system connected to a test sample is shown in Figure 3.11. The test sample was wrapped with aluminum tapes on its insulation surface to provide three connection points to the high voltage and two guards, respectively, and then placed inside the climate chamber to investigate the variation of the permittivity with temperature. The impedance of the sample, Z, can be calculated by the voltage, U, across the sample, divided by the current, I, passing through the sample. Pure capacitive C′ of the complex capacitance is referred to capacitance. The permittivity εr can be calculated, as shown in equation (3.1) and (3.2) based on the measured current and voltage and the object’s geometric capacitance C0. The area for calculating C0 is the whole area of aluminum tape around the bar where the high voltage is connected.
1 (3.1)UZI j Cω
= =
0 ( ) (3.2)r rC C jC C jε ε′ ′′′ ′′= − = −
Computer with DSP-
board
ACControl voltage
Measured voltage
Measured current
V
A
Voltage divider
Electrometer
IDAX-300Hi
Lo
Guard
Test sample
Climate chamber
Figure 3.11 Schematic diagram of dielectric spectroscopy measurement system for the test sample
3.3 Arbitrary testing voltage waveforms
The voltage stimuli presented in this work were based on several types of arbitrary voltage waveforms, which were the half-sine voltage pulses with pause period, negative step voltage pulses, trapezoid-wave, triangle-wave and approximately square-wave voltages. Among those waveforms, only some of them were found to be more useful and provide more information of PD behavior; thus the main results were mainly focused on the application of negative step voltage, trapezoidal and approximately square voltages.
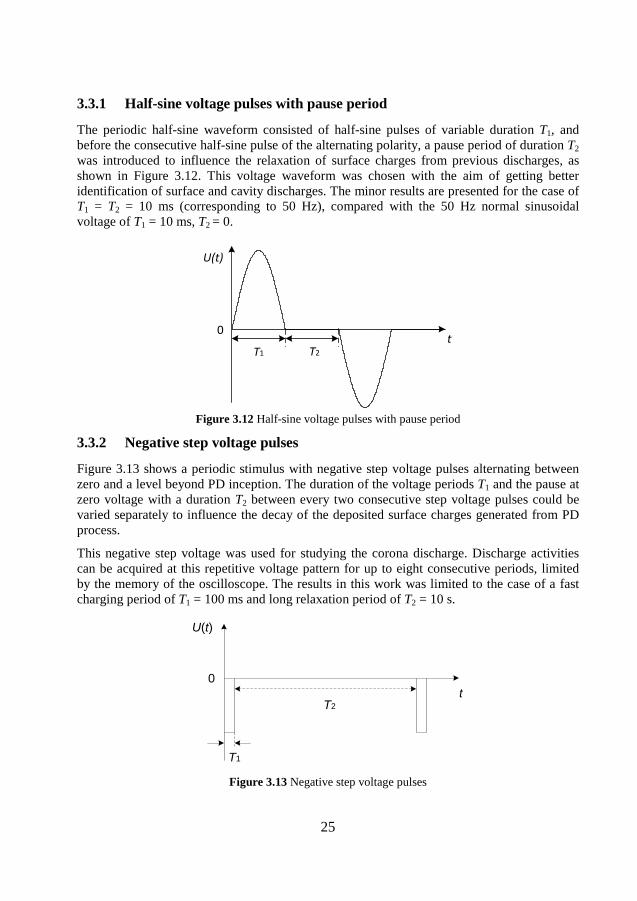
25
3.3.1 Half-sine voltage pulses with pause period
The periodic half-sine waveform consisted of half-sine pulses of variable duration T1, and before the consecutive half-sine pulse of the alternating polarity, a pause period of duration T2 was introduced to influence the relaxation of surface charges from previous discharges, as shown in Figure 3.12. This voltage waveform was chosen with the aim of getting better identification of surface and cavity discharges. The minor results are presented for the case of T1 = T2 = 10 ms (corresponding to 50 Hz), compared with the 50 Hz normal sinusoidal voltage of T1 = 10 ms, T2 = 0.
t
U(t)
T1 T2
0
Figure 3.12 Half-sine voltage pulses with pause period
3.3.2 Negative step voltage pulses
Figure 3.13 shows a periodic stimulus with negative step voltage pulses alternating between zero and a level beyond PD inception. The duration of the voltage periods T1 and the pause at zero voltage with a duration T2 between every two consecutive step voltage pulses could be varied separately to influence the decay of the deposited surface charges generated from PD process.
This negative step voltage was used for studying the corona discharge. Discharge activities can be acquired at this repetitive voltage pattern for up to eight consecutive periods, limited by the memory of the oscilloscope. The results in this work was limited to the case of a fast charging period of T1 = 100 ms and long relaxation period of T2 = 10 s.
t
T1
T2
U(t)
0
Figure 3.13 Negative step voltage pulses

26
3.3.3 Trapezoidal, triangular, square voltage waveforms
Figure 3.14 shows a set of relevant voltage waveforms, which are a trapezoidal shape, triangle-wave, and an approximately square-wave. Figure 3.14 (b) shows the trapezoidal waveform: the linearly increasing period from zero till peak voltage Upeak has duration T1; the peak voltage keeps constant for a time T2; then the voltage falls linearly back down to zero during the time T3. The negative half-cycle is in this case a mirror of the positive half-cycle. The period T of the applied voltage is therefore T = 2(T1 + T2 + T3). The waveform shown in Figure 3.14 (b) is a symmetric trapezoid, having equal magnitude of dU/dt up and down, i.e. T1 = T3. Figure 3.14 (a) shows the symmetric triangular voltage corresponding to T2 = 0 ms and Figure 3.14 (c) shows the approximately square voltage in the case where T1 = T3 ≈ 0 ms.
In reality the waveform of T1 = T3 ≈ 0 ms has a delay time in these measurements due to the high voltage amplifier. More explanation can be seen in the following section 3.4.2. Figure 3.14 (d) shows another form of triangular waveform, that is, a sawtooth wave, which was employed to compare with the effect of constant-voltage period in the square-wave voltage in some measurements since these both contain a fast rising voltage period of T1 ≈ 0 ms. The influence of each part of the trapezoidal voltage waveform, that is, time derivative of the applied voltage (dU/dt) and the constant period of T2, on the discharge behavior was also investigated in the metal-insulation geometry.
tT1
U(t)
T/2
(a)(b)
(c)
T2 T3
0
Upeak
(d)
Figure 3.14 A set of testing voltage waveforms: (a) symmetric triangular; (b) symmetric trapezoidal; (c)
approximately square; (d) sawtooth
3.4 Analysis method
3.4.1 Pulse Sequential Analysis-PSA
The sequence of PD pulses contains the important information which could reflect the discharge characteristics and its relation to the discharge physics. The main parameters to describe the PD behavior are the detected PD pulse apparent charge, q, the applied voltage, u, at the time instant of that discharge and the relative time of occurrence of the discharge pulse, t. In principle, the sequence of this matrix (ti, qi, ui) is sufficient to describe the discharge
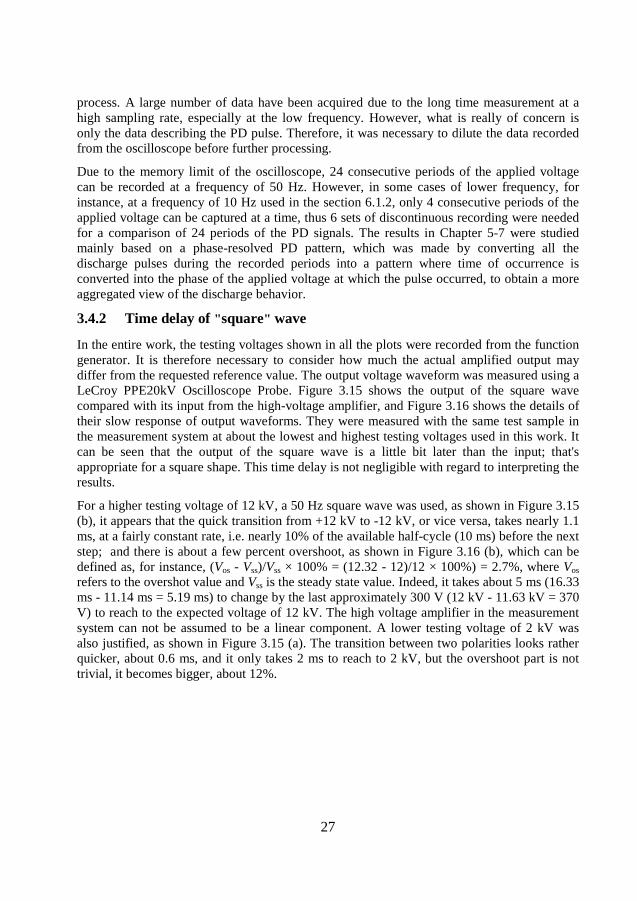
27
process. A large number of data have been acquired due to the long time measurement at a high sampling rate, especially at the low frequency. However, what is really of concern is only the data describing the PD pulse. Therefore, it was necessary to dilute the data recorded from the oscilloscope before further processing.
Due to the memory limit of the oscilloscope, 24 consecutive periods of the applied voltage can be recorded at a frequency of 50 Hz. However, in some cases of lower frequency, for instance, at a frequency of 10 Hz used in the section 6.1.2, only 4 consecutive periods of the applied voltage can be captured at a time, thus 6 sets of discontinuous recording were needed for a comparison of 24 periods of the PD signals. The results in Chapter 5-7 were studied mainly based on a phase-resolved PD pattern, which was made by converting all the discharge pulses during the recorded periods into a pattern where time of occurrence is converted into the phase of the applied voltage at which the pulse occurred, to obtain a more aggregated view of the discharge behavior.
3.4.2 Time delay of "square" wave
In the entire work, the testing voltages shown in all the plots were recorded from the function generator. It is therefore necessary to consider how much the actual amplified output may differ from the requested reference value. The output voltage waveform was measured using a LeCroy PPE20kV Oscilloscope Probe. Figure 3.15 shows the output of the square wave compared with its input from the high-voltage amplifier, and Figure 3.16 shows the details of their slow response of output waveforms. They were measured with the same test sample in the measurement system at about the lowest and highest testing voltages used in this work. It can be seen that the output of the square wave is a little bit later than the input; that's appropriate for a square shape. This time delay is not negligible with regard to interpreting the results.
For a higher testing voltage of 12 kV, a 50 Hz square wave was used, as shown in Figure 3.15 (b), it appears that the quick transition from +12 kV to -12 kV, or vice versa, takes nearly 1.1 ms, at a fairly constant rate, i.e. nearly 10% of the available half-cycle (10 ms) before the next step; and there is about a few percent overshoot, as shown in Figure 3.16 (b), which can be defined as, for instance, (Vos - Vss)/Vss × 100% = (12.32 - 12)/12 × 100%) = 2.7%, where Vos refers to the overshot value and Vss is the steady state value. Indeed, it takes about 5 ms (16.33 ms - 11.14 ms = 5.19 ms) to change by the last approximately 300 V (12 kV - 11.63 kV = 370 V) to reach to the expected voltage of 12 kV. The high voltage amplifier in the measurement system can not be assumed to be a linear component. A lower testing voltage of 2 kV was also justified, as shown in Figure 3.15 (a). The transition between two polarities looks rather quicker, about 0.6 ms, and it only takes 2 ms to reach to 2 kV, but the overshoot part is not trivial, it becomes bigger, about 12%.
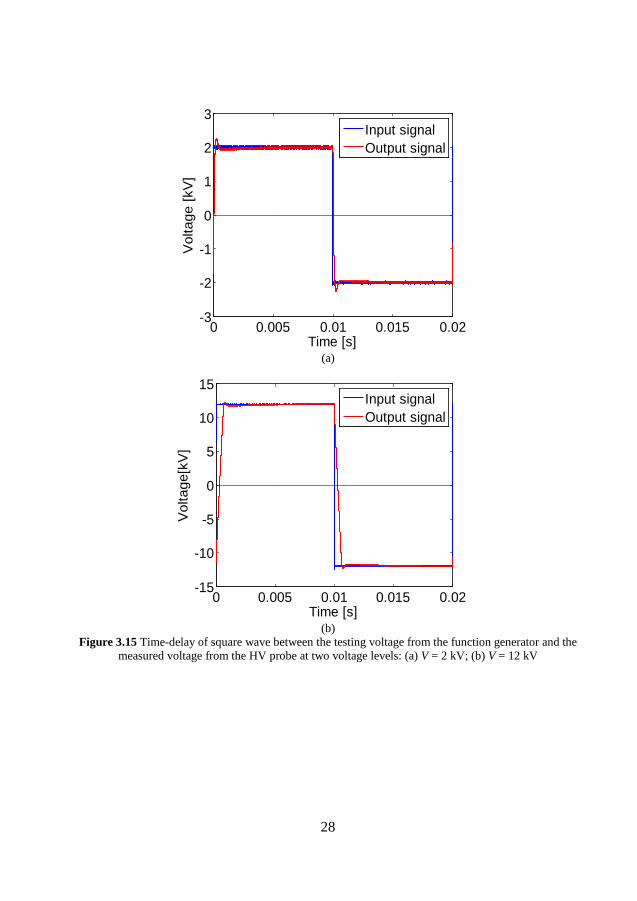
28
(a)
(b)
Figure 3.15 Time-delay of square wave between the testing voltage from the function generator and the measured voltage from the HV probe at two voltage levels: (a) V = 2 kV; (b) V = 12 kV
0 0.005 0.01 0.015 0.02-3
-2
-1
0
1
2
3
Time [s]
Vol
tage
[kV
]
Input signalOutput signal
0 0.005 0.01 0.015 0.02-15
-10
-5
0
5
10
15
Time [s]
Vol
tage
[kV
]
Input signalOutput signal

29
(a)
(b)
Figure 3.16 Slow response of the measured square wave at two voltage levels: (a) V = 2 kV; (b) V = 12 kV
0.01 0.012 0.014 0.016 0.018 0.02
-2.2
-2
-1.8
-1.6
X: 0.01315Y: -2
Time [s]
Vol
tage
[kV
]X: 0.01066Y: -1.927
X: 0.01026Y: -2.253
0.01 0.012 0.014 0.016 0.018 0.02-12.5
-12
-11.5
-11
X: 0.01633Y: -12
Time [s]
Vol
tage
[kV
]
X: 0.01114Y: -11.63
X: 0.01074Y: -12.32

30

31
Chapter 4
Corona discharge
To initiate the study in a simple way, the experiments were performed in a needle-plane setup, as shown in Figure 3.1 (a), with the needle driven by a sequence of short square pulses of negative voltage, as shown in Figure 3.10. The negative voltage was selected based on the fact that the inception voltage of negative corona is lower than that of positive one, and the pulses of negative corona tend to be regular and of very consistent magnitude, while it is not all the case for positive corona. The dynamic behavior of the pulse repetition rate of corona discharge was studied with various choices of insulating plate on the ground electrode. The effect of different materials on the corona discharge activity was compared to the case only air between the electrodes. Note that all the voltage values shown in the experimental data in the chapter are the absolute value of the applied negative voltages.
4.1 Current-voltage characteristic
In a needle-plane geometry, there exists empirical formulas to describe the current-voltage characteristic of corona discharge. The current increases with the increasing voltage following a particular current-voltage relationship. The empirical formulas are suggested, such as [88, 89]
1 0( ) (4.1)I K V V V= −
or 2
2 0( ) (4.2)I K V V= −
where V0 is the corona inception voltage and K1, K2 are constants that depend on the geometry. With the assumption that individual single corona pulse does not have a cumulative effect on the background electric field, then every corona discharge event from the needle tip should give almost the same amount of charge q0. Therefore, the cumulative corona charge Q(t) during discharge activities is
0( ) ( ) (4.3)cQ t q N t=
where Nc (t) is the cumulative number of corona pulses over time from the start. The average corona current Ic is then obtained

32
0( )( ) (4.4)c
CdN tdQ tI q
dt dt= =
A certain amount of charges will be deposited on the insulating surface by every corona discharge, causing a charge accumulation and a corresponding increase of the surface potential Vp. So the voltage difference across the air gap is then reduced to V - Vp [90], leading to the current-voltage relation with the same constant value of K, given as
20( ) (4.5)C PI K V V V= − −
The surface potential Vp is increasing as the charges from corona discharge accumulate on the insulating surface over time, thus the corona current Ic decreases and even becomes zero if Vp builds up high enough at Vp = V - V0. Therefore, the relation between the cumulative number of PD pulses Nc(t) and the surface voltage Vp can be achieved from equation (4.4) and (4.5). By studying the dynamic behavior of Nc(t) over time, or pulse repetition rate of corona discharge Nc(t)/dt, a basic understanding of how these charges behave on the insulating surface could be obtained.
4.2 Needle-plane geometry without insulating plate
For comparison, corona discharges were firstly measured in the needle-plane geometry without any insulating plate on the surface of the ground electrode. Figure 4.1 shows the evolution of the cumulative number of corona pulses Nc(t) during the first charging period of T1 = 100 ms at different applied voltages, and its evolution during eight consecutive periods at one applied voltage is shown in Figure 4.2.
It is clear that the cumulative number of corona pulses Nc(t) linearly increases with the charging time of T1 for each applied voltage level, and it indicates that corona discharge follows a constant repetition rate of dNc(t)/dt at one specific voltage. On the other hand, for one applied voltage level, all the curves in Figure 4.2 during eight applied voltage periods follow the same trend. This same PD repetition rate means the charges originating from the previous PDs almost have no effect on the following discharge activities, because charges go to the metal plane quickly and the discharge space tends to its virgin state again.
The experimental study of Nc(t) related to the applied voltage V can be fitted to the equation below, derived from equation (4.2)-(4.4)
20 1 0( ) ( ) (4.6)CN t K V V T q= − ⋅
where q0 is the mean pulse charge of each corona pulse with an approximate value of 50 pC for this specific needle-plane geometry. This value was obtained by PD calibration using another oscilloscope (Tektronix TDS 3052) with a higher sampling rate of 5 GS/s. Thus, the inception voltage V0 and constant K can be calculated by the data from Figure 4.1 according to equation (4.6) and the values are V0 = 3 kV and K = 2.65×10⁻¹² (C/(V2∙s)), respectively.

33
Figure 4.1 Evolution of the cumulative number of corona pulse Nc(t) during the first charging period at
different applied voltages in needle-plate geometry without insulating plate
Figure 4.2 Evolution of the cumulative number of corona pulse Nc(t) during the eight consecutive
periods of a applied voltage of 4.8 kV in needle-plate geometry without insulating plate
4.3 Needle-plane geometry with insulating plate
In order to understand how the insulating material would affect the corona discharge and the general behavior of surface charges on the insulating surface, an insulating plate of polycarbonate was placed on the surface of the ground electrode in the same needle-plane geometry. The thickness of the polycarbonate plate was 0.25 mm, so the small change of the gap discharge between the needle tip and the solid surface (previously the electrode surface, but now the polycarbonate surface) caused by inserting the insulating plate can be neglected.
0 0.02 0.04 0.06 0.08 0.10
2000
4000
6000
8000
10000
12000
14000
16000
Time [s]
Nc( t)
V = 4.2 kVV = 4.4 kVV = 4.8 kV
0 0.02 0.04 0.06 0.08 0.10
2000
4000
6000
8000
10000
12000
14000
16000
Time [s]
Nc( t)
1st period2nd period3rd period4th period5th period6th period7th period8th period

34
In the case when an insulating plate is limiting the discharge, the charge accumulation on the insulating surface can lead to an increase of surface potential, which will modify the behavior of the discharge system. One typical time-sequential set of corona pulses during the first charging period of the applied voltage of 4 kV is shown in Figure 4.3. It can be seen that the discharge pulses have a high repetition rate at the beginning of the voltage applied, and then discharge events gradually decrease over time. The amplitude of every pulse seems unequal; this is because of the low sampling rate of oscilloscope used in this experiment.
Figure 4.3 Time-sequential corona pulses during the first charging period of an applied voltage of 4 kV
in needle-plate geometry with polycarbonate plate on the ground electrode surface
Figure 4.4 shows a typical behavior of Nc(t) at eight consecutive periods of a applied voltage of 4 kV in this case. Compared with that in Figure 4.2, almost all the curves of Nc(t) show a exponentially increase instead of linearly increase over time. Corona discharge during the first charging period, which corresponds to the time-sequential corona pulses in Figure 4.3, is distinctly more than that during other voltage periods, and this curve tends to level off from 40 ms after the voltage has been applied. This indicates that the discharge activities are greatly reduced, not only in the same charging period but also during different charging periods. This is because the insulating surface provides the condition for charges from corona discharges to remain on it. On the other hand, the charges deposited on the insulating surface may decay due to different physical origins, for instance, gas neutralization, surface conduction, bulk conduction and diffusion. When the charge accumulation is faster than the charges relaxation process, more and more charges would accumulate on the insulating surface as the discharge develops, leading to an increasing surface potential to decelerate the discharge events, as the repetition rate dNc(t)/dt is gradually decreased in each curve. The discharge activity might stop when the duration of the applied voltage was extended to more than 100 ms. It is clear that the relaxation period of zero voltage of 10 s is too short for surface charge to disappear, otherwise each of the curves in Figure 4.4 would have the same slopes at the beginning of the voltage applied. More results of corona discharge at different voltage levels can be found in Paper I.
0 0.02 0.04 0.06 0.08 0.1-15
-10
-5
0
5
Time [s]
PD V
olta
ge [V
]

35
Figure 4.4 Evolution of the cumulative number of corona pulses Nc(t) during eight consecutive voltage
periods of 4 kV in needle-plate geometry with a polycarbonate plate on the ground electrode surface
4.4 Effect of different insulation materials on corona discharge activity
The reduction of corona discharge activity caused by the insulating plate strongly depends on how fast the surface charges may decay on the insulating surface, thus this behavior is strongly affected by the properties of insulation materials. In this study, different types of insulation materials, PVC, PC, PE, PVC, epoxy and dry pressboard, were compared. For each, a sample with thickness of 1 mm, was placed on the surface of the ground electrode, to investigate how the insulation material influences the corona discharge. From the way the PD behavior was affected by the different insulation materials, a general understanding of the insulation properties can be obtained, for instance, the conductivity of the material. The PD inception voltage was almost the same for most of the materials, V0 = 4 kV, except that it was slightly higher for the cases of PE and PTFE. Figure 4.5 shows the evolution of the cumulative number of corona pulses Nc(t) at the same applied voltage of 6.6 kV for each material. From the results presented in Paper II and the ones in Figure 4.5, it can be observed that:
In general, Nc(t) increases exponentially over time during the first charging period; the repetition rate dNc(t)/dt has the highest value at the beginning of the voltage applied, and then gradually decreases with different time constants for different materials. Expect for the case of dry pressboard, corona discharge activity for other insulation materials during this period are much higher than that in subsequent periods, as shown in Figure 4.5 (a)-(e).
0 0.02 0.04 0.06 0.08 0.10
100
200
300
400
500
Time [s]
Nc( t)
1st period2nd period3rd period4th period5th period6th period7th period8th period

36
(a) (b)
(c) (d)
(e) (f)
Figure 4.5 Evolution of the cumulative number of corona pulse Nc(t) at eight consecutive voltage periods of 6.6 kV with different insulating plates on the surface of the ground electrode:
(a) PTFE, (b) PE, (c) PVC, (d) PC, (e) epoxy, (f) dry pressboard
Regarding to the PD behavior during the other charging periods, significant difference between the dry pressboard and the other insulation materials appears. For most of the insulation materials except the dry pressboard, the discharge activity shows the same behavior
0 0.02 0.04 0.06 0.08 0.10
50
100
150
200
250
300
Time [s]
Nc( t)
Corona pulses Nc(t) on PTFE vs. charging time
1st period2nd period3rd period4th period5th period6th period7th period8th period
0 0.02 0.04 0.06 0.08 0.10
100
200
300
400
500
600
700
Time [s]
Nc( t)
Corona pulses Nc(t) on PE vs. charging time
1st period2nd period3rd period4th period5th period6th period7th period8th period
0 0.02 0.04 0.06 0.08 0.10
200
400
600
800
Time [s]
Nc( t)
Corona pulses Nc(t) on PVC vs. charging time
1st period2nd period3rd period4th period5th period6th period7th period8th period
0 0.02 0.04 0.06 0.08 0.10
200
400
600
800
1000
Time [s]
Nc( t)
Corona pulses Nc(t) on PC vs. charging time
1st period2nd period 3rd period4th period6th period7th period8th period
0 0.02 0.04 0.06 0.08 0.10
500
1000
1500
2000
2500
Time [s]
Nc( t)
Corona pulses Nc(t) on epoxy vs. charging time
1st period2nd period3rd period4th period5th period6th period7th period8th period
0 0.02 0.04 0.06 0.08 0.10
500
1000
1500
2000
2500
3000
Time [s]
Nc( t)
Corona pulses Nc(t) on pressboard vs. charging time
1st period2nd period3rd period4th period5th period6th period7th period8th period
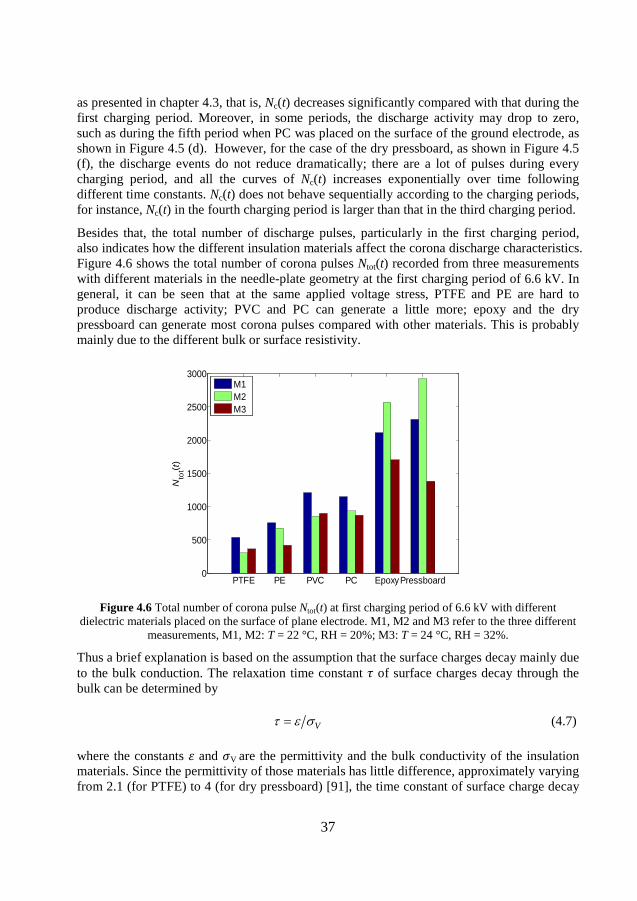
37
as presented in chapter 4.3, that is, Nc(t) decreases significantly compared with that during the first charging period. Moreover, in some periods, the discharge activity may drop to zero, such as during the fifth period when PC was placed on the surface of the ground electrode, as shown in Figure 4.5 (d). However, for the case of the dry pressboard, as shown in Figure 4.5 (f), the discharge events do not reduce dramatically; there are a lot of pulses during every charging period, and all the curves of Nc(t) increases exponentially over time following different time constants. Nc(t) does not behave sequentially according to the charging periods, for instance, Nc(t) in the fourth charging period is larger than that in the third charging period. Besides that, the total number of discharge pulses, particularly in the first charging period, also indicates how the different insulation materials affect the corona discharge characteristics. Figure 4.6 shows the total number of corona pulses Ntot(t) recorded from three measurements with different materials in the needle-plate geometry at the first charging period of 6.6 kV. In general, it can be seen that at the same applied voltage stress, PTFE and PE are hard to produce discharge activity; PVC and PC can generate a little more; epoxy and the dry pressboard can generate most corona pulses compared with other materials. This is probably mainly due to the different bulk or surface resistivity.
Figure 4.6 Total number of corona pulse Ntot(t) at first charging period of 6.6 kV with different
dielectric materials placed on the surface of plane electrode. M1, M2 and M3 refer to the three different measurements, M1, M2: T = 22 °C, RH = 20%; M3: T = 24 °C, RH = 32%.
Thus a brief explanation is based on the assumption that the surface charges decay mainly due to the bulk conduction. The relaxation time constant 𝜏 of surface charges decay through the bulk can be determined by
(4.7)Vτ ε σ=
where the constants 𝜀 and 𝜎V are the permittivity and the bulk conductivity of the insulation materials. Since the permittivity of those materials has little difference, approximately varying from 2.1 (for PTFE) to 4 (for dry pressboard) [91], the time constant of surface charge decay
PTFE PE PVC PC EpoxyPressboard0
500
1000
1500
2000
2500
3000
Nto
t( t)
M1M2M3

38
is mainly determined by their bulk conductivity. The bulk resistivity of the dry pressboard is extremely low with an approximate value of 2⨯1010 Ω⋅m, which was measured by a Keithley 6514 electrometer in the lab. Thus the relaxation time constant of the dry pressboard is shorter than the pause period of 10 s in our measurement. The surface of the dry pressboard comes close to its original state before every charging period and more discharge events can occur.
In summary, insulation materials such as PTFE and PE with a low conductivity rapidly reduce the corona level in this setup by accumulating surface charges, which then remain to affect the later periods too. This is because low conductivity (high resistivity) dielectric materials would have more surface charges deposited on their surface, and the surface charge cannot disappear during the relaxation time of 10 s, causing high surface potential to reduce the discharge events. On the other hand, the dielectric materials with high conductivity (low resistivity) such as the dry pressboard are likely to produce many discharge events during the first charging period and also for the following charging periods. This can be explained by the faster surface charge decay due to the lower resistivity of the dry pressboard: sufficient surface charges to affect the corona cannot stay after the relaxation period of 10 s.

39
Chapter 5
Surface and cavity discharges
This chapter presents surface discharge (SD) and cavity discharge (CD) in two canonical test cells, as shown in Figure 3.1 (b) and (c), at different types of testing voltage waveforms, aiming to find out a potential method to better distinguish these two discharge sources compared with traditional 50 Hz sinusoidal voltage. The experiment results presented here used half-sine pulse, symmetric trapezoidal and square voltages. The PD measurement with 50 Hz sinusoidal voltage was also performed for each test cell for the comparison. More PD patterns, such as at triangular voltage application or at another voltage stress, can be found in paper III. The analysis was mainly focused on the phase range of PD appearance in the phase resolved PD patterns, which were obtained by recording all the PD pulses in 24 consecutive recorded periods, except that the PD patterns at half-sine voltage with pause period were made by recording only 11 consecutive periods due to its longer period.
The critical inception voltage was the lowest voltage at which the stable discharge pulses occurred when an increasing alternating voltage was gradually applied to the test sample. The inception voltage of surface discharge at sinusoidal voltage was V0_SD = 2 kV, and it was approximately V0_CD = 3.2 kV for cavity discharge. In general, V0 was a little different for each waveform; it decreases slightly with the increasing dU/dt [40]. Figure 5.1 and Figure 5.2 show the typical patterns of two discharge sources at two applied voltage stresses of 50 Hz sinusoidal voltage.
(a) (b)
Figure 5.1 PD patterns at 50 Hz sinusoidal voltage of 1.3 V0: (a) SD; (b) CD
0 0.005 0.01 0.015 0.02-2
-1
0
1
2
3
Time [s]
PD
Vol
tage
[V]
SD at V = 2.6 kV
0 0.005 0.01 0.015 0.02-4
-2
0
2
4
Time [s]
PD
Vol
tage
[V]
CD at V = 4 kV

40
(a) (b)
Figure 5.2 PD patterns at 50 Hz sinusoidal voltage of 2 V0: (a) SD; (b) CD
5.1 PD activity at half-sine pulse voltage with pause period
The first attempt of the arbitrary voltage waveform was to introduce a pause period of zero voltage between two consecutive half-sine voltages of alternating polarity. The aim of the pause period was to relax the charges deposited on the insulating surface and have an initial impression of the contribution of surface charges to the discharge activity. Figure 5.3 and Figure 5.4 show the discharge behavior of SD and CD at half-sine pulse voltage with a pause period of T2 = 10 ms at two voltage stresses of 1.3 V0 and 2 V0. The PD patterns during the voltage period are quite similar to that at normal sinusoidal voltage.
PD activity during the half-sine voltage period is quite similar to that at normal sinusoidal voltage shown in Figure 5.1 and Figure 5.2, that is, most of PDs are focused during the rising voltage period. Regarding the pause period of zero voltage, one observation is that at a lower applied stress of 1.3 V0 almost no discharges occur during the pause period, as well as the decreasing voltage period of half-sine voltage, but with increasing the voltage stress to 2 V0, the discharge pulses start to appear around the area of positive or negative voltage turning to zero, and even during the pause period, for both discharge sources of CD and SD, as shown in Figure 5.4. Two discharge sources at this half-sine voltage with pause period show almost similar features of PD patterns.
The development of a discharge pulse is dependent on the magnitude of the applied field and the amount of charges deposited on the insulating surface. So an effect of the pause period in the sinusoidal voltage shows that at a lower applied electric field, the surface charge field by itself rarely can generate a discharge. However, if the applied electric field is high enough, the discharge activity during the half-sine voltage period could accumulate more charges on the insulating surface, thus the space charge field itself can produce the discharge pulse without the contribution of the applied electric field, i.e., when the voltage reaches zero after the decreasing period. The slight difference between SD and CD is that SD has some bigger discharge pulses at the zero crossings than CD as can be seen in comparison between Figure 5.4 (a) and (b). Therefore, this pause period in the sinusoidal waveform provides the general information of how the surface charges contribute to the discharge activity, as well as helping
0 0.005 0.01 0.015 0.02-4
-2
0
2
4
Time [s]
PD
Vol
tage
[V]
SD at V = 4 kV
0 0.005 0.01 0.015 0.02-4
-2
0
2
4
Time [s]
PD
Vol
tage
[V]
CD at V = 6.4 kV

41
to distinguish the two discharge sources. Without the pause period, this effect is more difficult to observe with full sinusoidal excitation, as shown in Figure 5.2.
(a) (b)
Figure 5.3 PD patterns at half-sine voltage of 1.3 V0 with a pause period of T2 = 10 ms: (a) SD; (b) CD
(a) (b)
Figure 5.4 PD patterns at half-sine voltage of 2 V0 with a pause period of T2 = 10 ms: (a) SD; (b) CD
5.2 PD activity at trapezoid-wave voltages
In this study, surface and cavity discharge were measured at 50 Hz symmetric trapezoidal voltage waveform of T1 = T3, and the approximately square-wave voltage. Figure 5.5 and Figure 5.6 show the PD patterns at a longer rising voltage period of T1 = 4 ms and a shorter rise time of T1 = 1 ms at a voltage stress of 1.3 V0. By extending the constant-voltage period in the trapezoidal voltage to T2 = 10 ms, PD behavior at the limiting case of a square-wave can be seen in Figure 5.7 and Figure 5.8 for two applied voltage stresses of 1.3 V0 and 2 V0.
From the PD patterns presented in paper III and the ones in the following figures, it can be observed that the distinction between CD and SD starts to emerge in the application of trapezoidal voltage waveform. The major difference of SD and CD exists in the discharge activity during the constant-voltage period of T2 in the recorded PD patterns.
0 0.01 0.02 0.03 0.04-2
-1
0
1
2
Time [s]
PD
Vol
tage
[V]
SD at V = 2.6 kV
0 0.01 0.02 0.03 0.04-2
-1
0
1
2
Time [s]
PD
Vol
tage
[V]
CD at V = 4 kV
0 0.01 0.02 0.03 0.04-2
-1
0
1
2
Time [s]
PD
Vol
tage
[V]
SD at V = 4 kV
0 0.01 0.02 0.03 0.04-4
-2
0
2
4
Time [s]
PD
Vol
tage
[V]
CD at V = 6.4 kV

42
• Cavity discharge: symmetric PD patterns in the two polarities
There are very few PD events during the constant-voltage period of both polarities, as shown in Figure 5.6 (b). In particular, the PD pulses during this period almost disappear at the square voltage for two of the applied voltage stresses, as shown in Figure 5.7 (b) and Figure 5.8 (b).
• Surface discharge: asymmetric PD patterns in the two polarities
The number of PD pulses during the negative constant-voltage period is a lot more than that in the positive one. For instance, Figure 5.5 (a) shows that the negative PD pulses in the period of T2 start to be a little more than positive ones at a longer duration of T1 = 4 ms. This asymmetric behavior of PD patterns for SD is greatly enhanced at approximately square-wave voltage due to its longer constant-voltage period. Plenty of discharge pulses with small amplitude appearing during the negative constant-voltage period, while no pulses during the positive constant-voltage period, as shown in Figure 5.7 (a). And this behavior is barely affected by the applied voltage stress; the same PD patterns can be seen in Figure 5.7 (a) and Figure 5.8 (a).
(a) (b)
Figure 5.5 PD patterns at symmetric trapezoid-wave voltage of 1.3 V0 with a longer duration of T1 = 4 ms: (a) SD; (b) CD
(a) (b)
Figure 5.6 PD patterns at symmetric trapezoid-wave voltage of 1.3 V0 with a shorter duration of T1 = 1 ms: (a) SD; (b) CD
0 0.005 0.01 0.015 0.02-2
-1
0
1
2
3
Time [s]
PD
Vol
tage
[V]
SD at V = 2.6 kV
0 0.005 0.01 0.015 0.02-3
-2
-1
0
1
2
3
Time [s]
PD
Vol
tage
[V]
CD at V = 4 kV
0 0.005 0.01 0.015 0.02-2
-1
0
1
2
3
4
Time [s]
PD
Vol
tage
[V]
SD at V = 2.6 kV
0 0.005 0.01 0.015 0.02-3
-2
-1
0
1
2
3
Time [s]
PD
Vol
tage
[V]
CD at V = 4 kV

43
(a) (b)
Figure 5.7 PD patterns at square-wave voltage (T1 ≈ 0 ms) of 1.3 V0: (a) SD; (b) CD
(a) (b)
Figure 5.8 PD patterns at square-wave voltage (T1 ≈ 0 ms) of 2 V0: (a) SD; (b) CD
By comparing all the PD pattern shown in Figure 5.5-5.8 with the ones at the sawtooth voltage, showing symmetric features for both discharge sources of CD and SD, as seen in Figure 5.9, therefore, the constant-voltage period of peak value in trapezoidal voltage waveforms plays an important role in distinguishing the two discharge sources of SD and CD, on the condition that the duration of constant-voltage period should be much longer than the rising voltage period in the waveform. Because of this constant-voltage period, surface discharge produced in the asymmetric test cell shows strongly asymmetric behavior compared with the cavity discharge. Thus the comparison between SD and CD at those voltage waveforms can be concluded:
• The zero voltage pause period between half-sine pulses resolves the ''back-discharges'' at the zero crossings at a higher applied voltage stress. These back-discharges are common for both SD and CD.
• The constant voltage period in the trapezoidal voltage waveforms clearly shows the asymmetry of the object during the constant voltage period where the surfaces discharge
0 0.005 0.01 0.015 0.02-4
-2
0
2
4
6
Time [s]
PD
Vol
tage
[V]
SD at V = 2.6 kV
0 0.005 0.01 0.015 0.02
-4
-2
0
2
4
6
Time [s]
PD
Vol
tage
[V]
CD at V = 4 kV
0 0.005 0.01 0.015 0.02-4
-2
0
2
4
6
Time [s]
PD
Vol
tage
[V]
SD at V = 4 kV
0 0.005 0.01 0.015 0.02-4
-2
0
2
4
6
Time [s]
PD
Vol
tage
[V]
CD at V = 6.4 kV
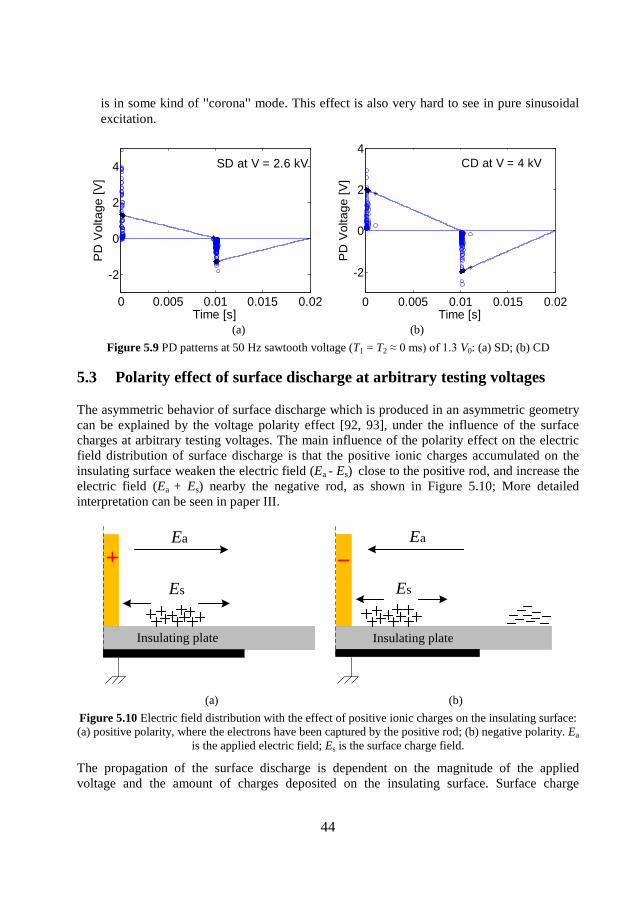
44
is in some kind of ''corona'' mode. This effect is also very hard to see in pure sinusoidal excitation.
(a) (b)
Figure 5.9 PD patterns at 50 Hz sawtooth voltage (T1 = T2 ≈ 0 ms) of 1.3 V0: (a) SD; (b) CD
5.3 Polarity effect of surface discharge at arbitrary testing voltages
The asymmetric behavior of surface discharge which is produced in an asymmetric geometry can be explained by the voltage polarity effect [92, 93], under the influence of the surface charges at arbitrary testing voltages. The main influence of the polarity effect on the electric field distribution of surface discharge is that the positive ionic charges accumulated on the insulating surface weaken the electric field (Ea - Es) close to the positive rod, and increase the electric field (Ea + Es) nearby the negative rod, as shown in Figure 5.10; More detailed interpretation can be seen in paper III.
Insulating plate
Ea
Es
Insulating plate
Ea
Es
(a) (b)
Figure 5.10 Electric field distribution with the effect of positive ionic charges on the insulating surface: (a) positive polarity, where the electrons have been captured by the positive rod; (b) negative polarity. Ea
is the applied electric field; Es is the surface charge field.
The propagation of the surface discharge is dependent on the magnitude of the applied voltage and the amount of charges deposited on the insulating surface. Surface charge
0 0.005 0.01 0.015 0.02
-2
0
2
4
Time [s]
PD
Vol
tage
[V]
SD at V = 2.6 kV
0 0.005 0.01 0.015 0.02
-2
0
2
4
Time [s]
PD
Vol
tage
[V]
CD at V = 4 kV

45
becomes more dominant as the discharge propagates away from the initiating point [94, 95]. Two parts of the voltage waveform may contribute to the PD behavior, i.e. the fast rising voltage period and the constant-voltage period, their effect is described below:
• The effect of fast rising voltage period
A short rise time of the applied voltage will lead to more surface charges accumulated on the insulating surface, because more discharge activities would appear due to the residual field along the insulating surface reaching the PD inception voltage quickly after the previous PD, as well as the less surface charge decaying during this short time, giving a higher possibility to obtain free electrons to initiate more discharge activities. On the other hand, the ionization process can be accelerated by more energy emitted from the discharge activities; it would also contribute to the generation of PD as well as the wider spread of charges on the insulating surface. Therefore, during this fast rising voltage period until the voltage reaches its peak value, a large number of positive charges have been accumulated in the vicinity of the rod, giving rise to a larger surface charge field of Es.
• The effect of constant-voltage period
The constant-voltage period of peak value in the waveform provides the maximum electric field of Ea. Meanwhile, the positive charges move quickly under the maximum Ea to produce a higher surface charge field Es close to the negative rod. Thus it would be a lot easier to generate PDs at negative voltage polarity in the asymmetric geometry during the constant-voltage period on the contribution of a maximum electric field Ea and a greater Es. However, under the decreasing electric field after the rising voltage period, such as sawtooth, symmetric triangular and even sinusoidal voltages, the velocity of the positive charges moving to the negative rod is reduced, and likewise the enhancement effect of the electric field. Thus the total electric field, which is a decreasing Ea and a weak Es, is not high enough to generate the discharge events even at the negative polarity when the peak voltage starts to decrease, compared to the case of the applied voltage remaining at its peak value.
In summary, the applied electric field Ea and surface charge field Es are both of significant importance for the generation of the discharge pulse. The major difference of SD and CD in the applied voltage waveforms could be interpreted as being that a fast rising voltage provides more surface charges on the insulating surface, leading to a higher Es adjacent to the negative rod. Meanwhile, the constant-voltage period at peak value gives a maximum Ea and also causes the faster moving of the positive charges to enhance the surface charge field.

46

47
Chapter 6
Sphere-plane partial discharge on stator insulation materials
The PD analysis at arbitrary voltage application was performed on the applications more relevant to the stator insulation of the high-voltage rotating machines. PDs were produced in an open air gap between a spherical electrode and the surface of epoxy-mica machine insulation in order to simulate a situation with the similar fundamental conditions as a slot discharge. One atmospheric factor, relative humidity (RH), was introduced into the study, aiming to investigate how it influences the PD behavior and how it would act during the discharge process. The PD measurement system with humidity control and the test object used in this chapter are described in details in Section 3.2.2 and Section 3.1.2.
The PD measurements were performed with trapezoidal voltage waveform as stimulus, which has two features: the first is a constant changing voltage dU/dt during rising and falling voltage periods; the second one is a period of constant voltage of peak value between rising and falling voltage periods. In order to understand how each parameter of the trapezoidal voltage waveform affects the discharge behavior, two studies have been performed; the parameters of each testing voltage waveform are summarized in Table 6.1. The time-sequential PD pulses were usually recorded in 24 consecutive periods of the applied voltage, however, for the applied voltage of low frequency in Study II, multiple recording are needed due to its longer voltage period; for instance, at the lowest frequency of 10 Hz, the PD pulses were captured 6 times with 4 consecutive periods each time.
Table 6.1 Parameters of trapezoidal applied voltage waveforms presented in this chapter
Study Parameters of the waveforms condition
I f/Hz 50 RH = 7%,
29%, 77% T1/ms 0 0.5 1 2 3 4 5 T2/ms 10 9 8 6 4 2 0
II T1/ms 1
RH = 29% T2/ms 0.5 1 3 8 18 48 f/Hz 200 167 100 50 25 10
Study I: to investigate the influence of the time derivative of the applied voltage (dU/dt), which was implemented by varying the value of rising voltage period of T1, from the minimum possible (square-wave) to the maximum possible (triangle-wave) for a given

48
voltage amplitude and at a constant frequency of 50 Hz. This study was performed in three relative humidity levels, 8%, 29% and 77%. The detailed results of Study I can be found in Paper IV.
Study II: to show the effect of the constant-voltage period of T2 at a fixed duration of T1 = 1 ms and a given voltage amplitude, which was equivalent to vary the voltage frequency but with the same changing voltage dU/dt. This study was only performed at RH = 29%.
6.1 PD behavior at relative humidity of 29%
6.1.1 Effect of voltage rising period in the trapezoidal waveform
In this study, the PD activities were performed at RH = 29% at the varying values of dU/dt. Figure 6.1 shows the phase resolved PD patterns at an applied voltage of V = 6 kV (≈ 1.5-1.6 V0) but with the different values of T1: 0 ms, 1 ms, 4 ms, 5 ms.
(a) (b)
(c) (d)
Figure 6.1 Phase-resolved PD patterns at V = 6 kV but with the different values of T1: (a) 0 ms; (b) 1 ms; (c) 4 ms; (d) 5 ms at RH = 29%
It can be clearly observed that for the PD behavior at square and trapezoidal voltage waveforms, PD occurrence during the voltage rising period of T1 is dominant compared with
0 0.005 0.01 0.015 0.02-4
-2
0
2
4
Time [s]
PD V
olta
ge [V
]
0 0.005 0.01 0.015 0.02-4
-2
0
2
4
Time [s]
PD
Vol
tage
[V]
0 0.005 0.01 0.015 0.02-4
-2
0
2
4
Time [s]
PD
Vol
tage
[V]
0 0.005 0.01 0.015 0.02-4
-2
0
2
4
Time [s]
PD
Vol
tage
[V]

49
the PD pulses in the constant-voltage period of T2, and no PD events were observed to appear after dU/dt was changed from zero to negative or to positive, i.e. in the voltage falling period of T3. For the case of T1 = 0, there is a significant time shift for PD occurrence from the "edge" of the square voltage, as shown in Figure 6.1 (a). The time delay is in the range of 0.3-0.6 ms, which is reasonable due to the time delay generated from the function generator, as described in section 3.4.2. All the bigger pulses only concentrate during the fast voltage period at square voltage, and discharge pulses of small amplitude are mainly located in the flat voltage period. With the decrease of dU/dt, the discharge amplitude tends to become more uniform. Moreover, at the triangular voltage waveform, the big discharges occur around the peak value of the applied voltage, as shown in Figure 6.1 (d). The PD patterns under square-wave voltage are similar to those presented in [34].
Partial discharge amplitude distribution (PDAD), which describes the relation between PD amplitudes and the repetition rate of PD, is shown in Figure 6.2 at V = 6 kV for the different values of T1. Figure 6.3 shows the comparison of PD amplitude distributions for three voltage levels. The features of PD amplitude are described as follows:
• PD charges concentrate around 350~500 pC regardless of the variation of dU/dt. The applied voltage stress, from 4.6 kV (≈ 1.1 V0) to 6 kV (≈ 1.5 V0), does not shift the "peak" of the curves too much.
• Faster rising voltage period, i.e. a bigger value of dU/dt has two effects on the discharge behavior: one is causing a great number of PD pulses, increasing from 0.7 pulses per cycle at T1 = 5 ms to 2 pulses per cycle at T1 = 0 at the peak of the curve. The other effect is leading to some PD pulses with larger amplitude; the maximum PD charge approximately varies from 2000 pC at T1 = 5 ms to 6500 pC at T1 = 0. The influence of the faster rising voltage has been discussed in Section 5.3.
Figure 6.2 PD amplitude distribution at V = 6 kV but the different values of T1 at RH = 29%
0 2000 4000 60000
0.5
1
1.5
2
X: 347.3Y: 0.7917
PD Charge [pC]
PD
Num
ber p
er c
ycle X: 511.3
Y: 1.625
X: 466Y: 1.917
X: 368.9Y: 2
T1 = 0
T1 = 1 ms
T1 = 3 ms
T1 = 5 ms

50
• The increasing of the applied voltage amplitude has an obvious effect on the PD amplitude distribution at a bigger value of dU/dt, leading to a more prominent "peak" of the curve; the number of PD pulses of around the peak is significantly increased. Besides, the maximum PD charge is also increased with the increasing applied voltage. With the decreasing of dU/dt, this enhanced effect is reduced. The increasing voltage stress cannot lead to an obvious increasing of the number of PD pulses when the dU/dt is small.
(a) (b)
(c) (d)
Figure 6.3 PD amplitude distributions for three voltage levels at the different values of T1: (a) 0 ms; (b) 1 ms; (c) 4 ms; (d) 5 ms at RH = 29%
6.1.2 Effect of constant-voltage period in the trapezoidal waveform
Study II was carried out under an applied voltage of V = 6 kV, at a given voltage rising period of T1 = T3 = 1 ms but with varied values of constant-voltage period of T2: 0.5ms, 1 ms, 3 ms, 8 ms, 18ms, 48 ms. The phase-resolved PD patterns are shown in Figure 6.4. From the phase of PD appearance, the patterns are the same as those seen previously; all the PD activities appear during the voltage rising period T1 and constant-voltage period T2.
0 2000 4000 6000 80000
0.5
1
1.5
2
PD Charge [pC]
PD
Num
ber p
er c
ycle
V = 6 kVV = 5 kVV = 4.6 kV
0 1000 2000 3000 40000
0.5
1
1.5
2
PD Charge [pC]
PD
Num
ber p
er c
ycle
V = 6 kVV = 5 kVV = 4.6 kV
0 500 1000 1500 20000
0.5
1
1.5
PD Charge [pC]
PD
Num
ber p
er c
ycle
V = 6 kVV = 5 kVV = 4.6 kV
0 500 1000 1500 20000
0.2
0.4
0.6
0.8
PD Charge [pC]
PD
Num
ber p
er c
ycle
V = 6 kVV = 5 kVV = 4.6 kV

51
(a) (b)
(c) (d)
(e) (f)
Figure 6.4 Phase-resolved PD patterns at V = 6 kV and T1 = 1 ms but with the different values of T2: (a) 0.5 ms; (b) 1 ms; (c) 3 ms; (d) 8 ms; (e) 18 ms; (f) 48 ms at RH = 29%
However, the variation of the constant-voltage period of T2 has a significant effect on the discharge amplitude with respect to the different periods of the applied voltage. With the increasing value of T2, the difference of PD amplitude during the period of T1 and T2 appears. The PD pulses with large amplitude occur during the period of T1, while the pulses during the
0 1 2 3 4 5x 10⁻³
-4
-2
0
2
4
Time [s]
PD
Vol
tage
[V]
0 2 4 6x 10⁻³
-4
-2
0
2
4
Time [s]
PD
Vol
tage
[V]
0 0.005 0.01-4
-2
0
2
4
Time [s]
PD
Vol
tage
[V]
0 0.005 0.01 0.015 0.02-4
-2
0
2
4
Time [s]
PD
Vol
tage
[V]
0 0.01 0.02 0.03 0.04-4
-2
0
2
4
Time [s]
PD
Vol
tage
[V]
0 0.05 0.1-4
-2
0
2
4
Time [s]
PD
Vol
tage
[V]
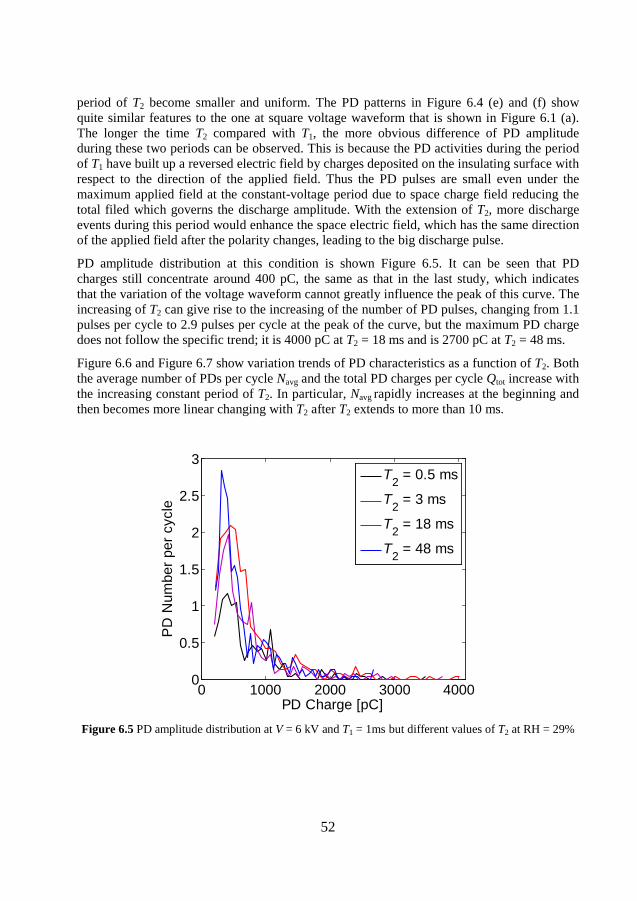
52
period of T2 become smaller and uniform. The PD patterns in Figure 6.4 (e) and (f) show quite similar features to the one at square voltage waveform that is shown in Figure 6.1 (a). The longer the time T2 compared with T1, the more obvious difference of PD amplitude during these two periods can be observed. This is because the PD activities during the period of T1 have built up a reversed electric field by charges deposited on the insulating surface with respect to the direction of the applied field. Thus the PD pulses are small even under the maximum applied field at the constant-voltage period due to space charge field reducing the total filed which governs the discharge amplitude. With the extension of T2, more discharge events during this period would enhance the space electric field, which has the same direction of the applied field after the polarity changes, leading to the big discharge pulse.
PD amplitude distribution at this condition is shown Figure 6.5. It can be seen that PD charges still concentrate around 400 pC, the same as that in the last study, which indicates that the variation of the voltage waveform cannot greatly influence the peak of this curve. The increasing of T2 can give rise to the increasing of the number of PD pulses, changing from 1.1 pulses per cycle to 2.9 pulses per cycle at the peak of the curve, but the maximum PD charge does not follow the specific trend; it is 4000 pC at T2 = 18 ms and is 2700 pC at T2 = 48 ms.
Figure 6.6 and Figure 6.7 show variation trends of PD characteristics as a function of T2. Both the average number of PDs per cycle Navg and the total PD charges per cycle Qtot increase with the increasing constant period of T2. In particular, Navg rapidly increases at the beginning and then becomes more linear changing with T2 after T2 extends to more than 10 ms.
Figure 6.5 PD amplitude distribution at V = 6 kV and T1 = 1ms but different values of T2 at RH = 29%
0 1000 2000 3000 40000
0.5
1
1.5
2
2.5
3
PD Charge [pC]
PD
Num
ber p
er c
ycle
T2 = 0.5 ms
T2 = 3 ms
T2 = 18 ms
T2 = 48 ms

53
Figure 6.6 Average number of discharge pulses per cycle Navg as a function of T2 at RH = 29%
Figure 6.7 Total discharge charges per cycle Qtot as a function of T2 at RH = 29%
6.2 PD behavior at relative humidity of 8%
In this study, the chamber was dried by the silica gel to expose the test sample to dry air. Study I was performed in this condition of RH = 8% but at a higher voltage amplitude of V = 7 kV (≈ 1.5-1.6 V0), because the PD inception voltage becomes higher with the decreasing relative humidity level. Figure 6.7 shows the PD patterns at square, trapezoidal and triangular voltage waveforms. PD behavior in dry air shows significant difference compared with that at RH = 29%; the features can be summarized in several aspects:
• PD number and amplitude
The number of PD pulses obviously decreases, reducing to only one or two discharge pulses per half cycle. But they are with quite big amplitude; especially in the case of T1 = 0 ms, the
0 10 20 30 40 5010
12
14
16
18
20
22
24
T2 [ms]
Nav
g
0 10 20 30 40 506
8
10
12
14
16
T2 [ms]
Qto
t [nC
]

54
PD pulse could reach to 10 V, as shown in Figure 6.7 (a), however, at RH = 29%, almost all the pulses in Figure 6.1 are less than 2 V.
• Phase of PD occurrence
The common feature of phase of PD occurrence between two relative humidity levels is that most of the PD pulses are located at the voltage rising period of T1, and no PD pulses appear during the voltage falling period of T3. However, the main difference exists in the period of a constant voltage, except for the case of triangular waveform. PD events are significantly reduced during the constant-voltage period of T2, and even completely disappear as T2 is long enough, such as at the square wave.
It must be mentioned that the appearance of the "pulses" of opposite polarity with their applied voltage, for instance, the dots in the red circles shown in Figure 6.7 (a) and (b), are due to the oscillation of the big discharge pulses.
(a) (b)
(c) (d)
Figure 6.7 Phase-resolved PD patterns at V = 7 kV but with the different values of T1: (a) 0 ms; (b) 1 ms; (c) 4 ms; (d) 5 ms at RH = 8%
• PD time shift tshift
0 0.005 0.01 0.015 0.02
-10
-5
0
5
10
Time [s]
PD V
olta
ge [V
]
0 0.005 0.01 0.015 0.02-10
-5
0
5
10
Time [s]
PD
Vol
tage
[V]
0 0.005 0.01 0.015 0.02-10
-5
0
5
10
Time [s]
PD
Vol
tage
[V]
0 0.005 0.01 0.015 0.02-10
-5
0
5
10
Time [s]
PD
Vol
tage
[V]

55
The PD patterns show an increasing time delay after the zero-crossing voltage with the increasing period of T1, for the two relative humidity levels of 8 % and 29 %. For instance, PD at the triangle voltage waveform in Figure 6.7 (d) shows a big time shift tshift = 1.22 ms.
6.3 PD behavior at relative humidity of 77%
A high relative humidity of RH = 77% was chosen here to obtain a significant change of PD patterns compared with the last two studies. Study I was performed at a lower voltage of V = 5 kV (≈ 1.5-1.6 V0) due to its lower PD inception voltage at the high humidity level. Figure 6.8 shows the phase-resolved PD patterns at each voltage waveform. Some distinctive features of PD activities in humid air can be observed, and they are described as follows:
• PD number and amplitude
The PD amplitude of all the pulses dramatically decreases, dropping to less than 500 mV. On the other hand, the number of PD pulses increases significantly, roughly 100-200 PD pulses per cycle.
(a) (b)
(c) (d)
Figure 6.8 Phase-resolved PD patterns at an applied voltage of 5 kV at the different values of T1: (a) 0 ms; (b) 1 ms; (c) 4 ms; (d) 5 ms at RH = 77%
0 0.005 0.01 0.015 0.02-3
-2
-1
0
1
2
3
Time [s]
PD
Vol
tage
[V]
0 0.005 0.01 0.015 0.02-3
-2
-1
0
1
2
3
Time [s]
PD
Vol
tage
[V]
0 0.005 0.01 0.015 0.02-3
-2
-1
0
1
2
3
Time [s]
PD
Vol
tage
[V]
0 0.005 0.01 0.015 0.02-3
-2
-1
0
1
2
3
Time [s]
PD
Vol
tage
[V]

56
• Phase of PD occurrence
The PD activity in humid air covers much wider range of the applied voltage compared with that at the other two humidity levels. There are a large number of PD events dispersing not only during the voltage rising period of T1, but also covering the whole constant-voltage period of T2 for both polarities, even extending a little to voltage falling period of T3, for instance, PD patterns at T1 = 4 ms shown in Figure 6.8 (c).
• PD time shift tshift
In general, the time shift tshift for the PD appearance in humid air seems longer compared with that in other two relative humidity levels. For instance, tshift at triangular voltage waveform is 1.22 ms, 1.37 ms and 2.70 ms for three conditions of increasing relative humidity levels, respectively.
Figure 6.9 shows one typical period of time-sequential PD pulses at T1 = 1 ms. When the voltage increases quickly in the period of T1, the repetition rate of PD pulses is higher and their amplitudes are a bit larger at the beginning of the voltage applied. Then the repetition rate is reduced, and the amplitudes also become smaller and tend to be uniform during the constant-voltage period. This decreasing of PD repetition rate is the result of surface potential on the insulating material caused by the deposited charges, leading to a reduction of the discharge activities.
Figure 6.9 One typical period of time-sequential PD pulses at T1 = 1 ms at RH = 77%
6.4 Effect of relative humidity on the PD activity
For modern insulation materials of large rotating machines, moisture absorption of the insulation from the ambient air is very low, thus a reduction of the bulk resistance is negligible [96]. Water contamination would affect the dielectric properties of the insulation
0 0.005 0.01 0.015 0.02-0.2
0
0.2
0.4
0.6
Time [s]
PD
Vol
tage
[V]

57
only if it is subjected to water for very long time. However, the moisture can strongly affect the surface conductivity of insulation by forming a moderately conductive layer over the insulation surface [70].
Humidity also has an influence on the discharge process by reducing the effective free electrons in air to initiate and sustain the PD activity. Due to the electronegative nature of water molecules, the effective attachment coefficient is increased, and then the effective ionization efficiency in the low field region is reduced, leading to the reduction of locally available free electrons [97]. After water molecules capture free electrons, the more stable ‘water ions’ are then formed, which have a very low probability of releasing their electrons during molecule collisions [55, 98, 99]. Also water molecules can limit photoionization by absorbing the irradiated photons [98]. As a consequence, the ionization during the discharge process is greatly weakened, giving an obvious effect on the PD activities in the air.
As mentioned previously, the PD inception voltage, which was measured at the 50 Hz, sinusoidal voltage waveform, decreases with the increasing relative humidity, with a 40% reduction from RH = 8% to RH = 77%, as shown in Figure 6.10. Although the lack of free electrons due to the presence of water vapor can be expected to increase the breakdown strength of air, the higher humidity may influence the breakdown properties of the complete object differently: condensation of water vapor on the insulating surface may enhance the electric field around the local condensation. This would lead to a reduction of the inception voltage [67].
Figure 6.10 PD inception voltage varies with the relative humidity in air
The effect of the humidity on the PD behavior can be summarized as: a few big discharge pulses in dry air turn into a large number of small pulses in humid air. This can be explained by the increased surface conductivity at the higher humidity condition, as surface charge decay is dominated by electric conduction along the insulation surface [100]. The surface area where PD charges are deposited on the insulating surface plays an important role in variation of the discharge magnitude [101]. With the increasing conductivity of the insulating surface,
0 20 40 60 802
3
4
5
6
RH [%]
V0 [k
V]

58
the surface charges would spread over a larger area on the insulating surface due to the enhanced mobility of the charges; this results in the surface potential building up well beyond many spots where surface charges have been deposited by PDs. Thus, the voltage difference between the high-voltage electrode and the insulating surface is lower, but covers a larger area of the insulating surface; this could lead to a larger number of small-amplitude discharge pulses. However, on the insulating material with a lower surface conductivity, the charges could remain on very limited area of the insulating surface, leading to a large voltage difference on other areas which are not affected by the surface charges, and thus causing several large-amplitude discharge pulses [102].
On the other hand, the appearance of PD in the constant-voltage period at higher humidity levels reflects that the electric field in the gap is not constant even during the short period of T2, but is affected by surface charge decay or lateral spread. The charges deposited by the previous PD pulses will be faster decaying due to a higher surface conductivity, causing a lower surface potential to be built up on the insulating surface with a larger area. So the voltage difference across the air gap would be higher than the inception voltage during the most of the applied voltage period. Also, there are still available free electrons left at that period which are not completely consumed during the period of T1. Therefore, the PD occurrence during the constant-voltage and the voltage falling period depends on the availability of free electrons and the spread of the charges on the insulating surface.
The variation of PD characteristics, including the average number of PDs per cycle Navg, the total PD charges per cycle Qtot and the time shift of PD occurrence tshift, with the changing of relative humidity can be seen in Figure 6.11. It can be observed that the decreasing behavior of Qtot and Navg with the increasing of T1 is enhanced in humid air, and so is the increasing behavior of time shift of PD occurrence tshift. Figure 6.11 (c) shows that with the increasing period of T1, the time shift is clearly increased at three humidity conditions; it is clear because the applied voltage increases slowly, more time will be needed to have the PD even though the free electron is available. When the relative humidity is raised, the PD events occur significantly later, probably due to the lack of free electrons caused by the existence of water molecules in the air. In general, the reduction of free electrons and the increase of surface conductivity in humid air both contribute to the changing of PD behavior.

59
(a)
(b)
(c)
Figure 6.11 PD characteristics at different values of T1 and different relative humidity levels: (a) average number of PDs per cycle Navg; (b) total PD charges per cycle Qtot; (c) time shift of PD occurrence tshift.
0 1 2 3 4 50
50
100
150
200
250
T1 [ms]
Nav
g
RH = 8 %RH = 29 %RH = 77 %
0 1 2 3 4 50
20
40
60
T1 [ms]
Qto
t [nC
]
RH = 8%RH = 29 %RH = 77 %
0 1 2 3 4 50
1
2
3
T1 [ms]
t shift
[ms]
RH = 8 %RH = 29 %RH = 77 %

60
61
Chapter 7
Crossed-bar partial discharge on stator insulation materials
This chapter presents the influence of temperature on the PD activity in air between two mica-epoxy surfaces that coated two copper bars, as shown in Section 3.1.3. The PD measurement system with temperature control used here has been described in Section 3.2.3. Based on the previous study of the effect of arbitrary voltage waveform on the behavior of PD activity, it has been recognized that the constant-voltage period of peak value in the trapezoidal and square voltage waveforms could provide more clarified information of the discharge characteristics. For this reason, the voltage waveforms applied in this chapter were mainly focused on the 50 Hz trapezoidal and square voltage waveforms.
The variation of the phase resolved PD patterns with temperature were studied, together with the PD inception voltage changing with the temperature. The ambient temperature was varied from 23 ºC to 98 ºC with roughly 20 degree steps, i.e. 23 ºC, 40 ºC, 60 ºC, 80 ºC, 98 ºC. In order to verify the effect of temperature on the insulation material, the relative permittivity of mica-epoxy insulation varying with temperature was measured by the dielectric spectroscopy measurement system, as shown in Figure 3.11. Furthermore, the changing of the breakdown strength of air caused by the increasing temperature was estimated by Paschen’s law.
7.1 Effect of temperature on the PD inception voltage
The PD inception voltage V0 at each temperature was measured at 50 Hz sinusoidal voltage. Figure 7.1 shows an obvious decreasing behavior of PD inception voltage with the increasing temperature, from 6.4 kV at 23 ºC to 4.6 kV at 98 ºC. There are two mechanisms which may lead to this change; one is that the relative permittivity of epoxy increases with the increasing temperature [74]; the other one is that the reduced breakdown strength of air at a higher temperature, and thus lower air density, may be the cause [103]. The detailed discussion of these two mechanisms is presented in Sections 7.3 and 7.4.

62
Figure 7.1 Variation of PD inception voltages with temperature at 50 Hz sinusoidal voltage. The
equation of the fitted line is y = -0.022x + 6.99
7.2 Effect of temperature on the PD patterns of the mica-epoxy sample
The test samples were exposed to the PD activity with the same applied voltage stress of V = 9.6 kV, for every voltage waveform and every temperature. This voltage corresponds to 1.5 V0 at the room temperature of 23 ºC. The PD tests with 50 Hz sinusoidal voltage were performed at each temperature, as a reference with which to compare the PD behavior at other voltage waveforms. Figure 7.2 shows the phase resolved PD patterns of the time-sequential PD pulses at 23 ºC, 60 ºC and 98 ºC. In general, the PD patterns show quite similar features at each temperature, for instance, the phase range of the PD appearance; while PD amplitude and the number of PD pulses slightly increases with the increasing temperature. Thus temperature has no obvious effect on the discharge activities at sinusoidal voltage waveform.
PD patterns at 50 Hz trapezoid-wave voltage of 9.6 kV with a shorter duration of T1 = 1 ms at different temperatures are shown in Figure 7.3. As usual, most of the PD pulses concentrate during the voltage increasing period of T1 and some PD activities spread over the constant-voltage period of T2, where exactly the effect of temperature on the discharge behavior appears in the trapezoidal voltage waveform. By comparing the PD pattern at room temperature of 23 ºC, shown in Figure 7.3 (a), with that at a high temperature of 98 ºC, as shown in Figure 7.3 (c), it is clear that there are more discharge pulses occurring during this constant-voltage period at the higher temperature.
20 40 60 80 1004.5
5
5.5
6
6.5
T [oC]
V0
[kV
]
Curve fittingData points

63
(a) (b)
(c)
Figure 7.2 Phase resolved PD patterns at 50 Hz sinusoidal voltage of 9.6 kV at different temperatures: (a) 23 ºC; (b) 60 ºC (c) 98 ºC.
Regarding the square-wave voltage application, the variation of PD patterns with the increasing temperatures is shown in Figure 7.4. The effect of temperature on the discharge behavior at this applied voltage waveform was enhanced due to the increasing constant-voltage period. In order not to miss the small discharge pulses in the period of T2, the discrimination or "filtering" level for picking out the peak values of the PD pulse was selected small enough, leading to the oscillation of discharge pulses in the period of T1 appearing in the PD patterns, for instance, the dots in the red circles as shown in Figure 7.4 (b) and (c). Regardless of those oscillation points, the appearance of PD pulses during the period of T2 with the increasing temperature deserves more attention; for instance, in the square voltage waveform, the obvious increasing trends of the number of PD pulses and PD charge appearing in the period of T2 with the increasing temperature are shown in Figure 7.5 and Figure 7.6, respectively.
The reason of the appearance of PD pulses during the constant-voltage period at a higher temperature is the decreasing PD inception voltage with temperature; the applied voltage of 9.6 kV is around 2V0 at a higher temperature of 98 ºC. Another possible reason could be the increasing charge mobility with temperature [104], leading to the faster decaying process of
0 0.005 0.01 0.015 0.02-5
0
5
Time [s]
PD V
olta
ge [V
]
0 0.005 0.01 0.015 0.02-5
0
5
Time [s]
PD
Vol
tage
[V]
0 0.005 0.01 0.015 0.02-5
0
5
Time [s]
PD V
olta
ge [V
]
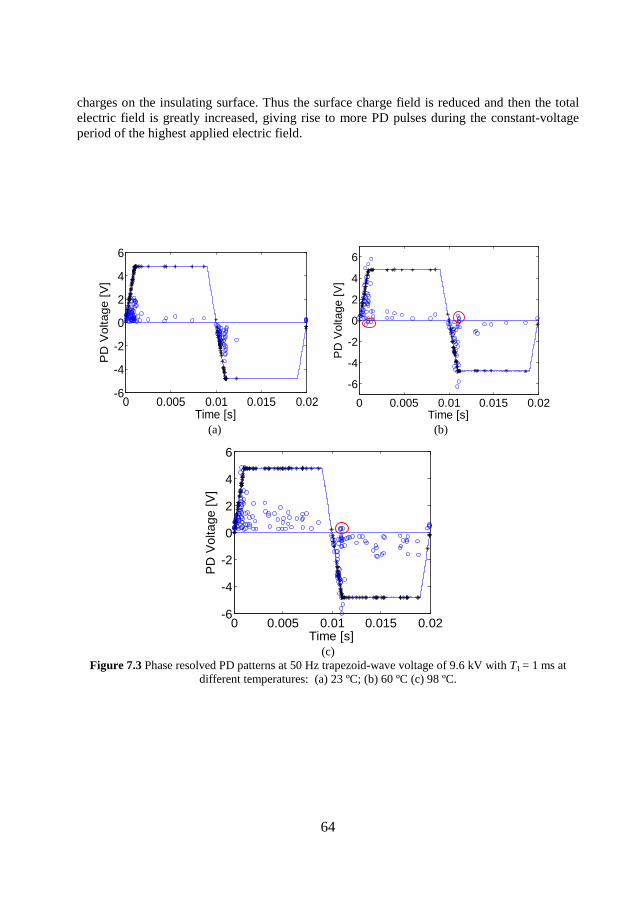
64
charges on the insulating surface. Thus the surface charge field is reduced and then the total electric field is greatly increased, giving rise to more PD pulses during the constant-voltage period of the highest applied electric field.
(a) (b)
(c)
Figure 7.3 Phase resolved PD patterns at 50 Hz trapezoid-wave voltage of 9.6 kV with T1 = 1 ms at different temperatures: (a) 23 ºC; (b) 60 ºC (c) 98 ºC.
0 0.005 0.01 0.015 0.02-6
-4
-2
0
2
4
6
Time [s]
PD
Vol
tage
[V]
0 0.005 0.01 0.015 0.02-6
-4
-2
0
2
4
6
Time [s]
PD
Vol
tage
[V]
0 0.005 0.01 0.015 0.02-6
-4
-2
0
2
4
6
Time [s]
PD
Vol
tage
[V]

65
(a) (b)
(c)
Figure 7.4 Phase resolved PD patterns at 50 Hz approximately square-wave voltage of 9.6 kV at different temperatures: (a) 23 ºC; (b) 60 ºC (c) 98 ºC.
Figure 7.5 The average number of PD pulses per cycle Navg during the constant-voltage period of T2 in
square-wave varying with the temperature.
0 0.005 0.01 0.015 0.02-5
0
5
Time [s]
PD V
olta
ge [V
]
0 0.005 0.01 0.015 0.02-10
-5
0
5
10
Time [s]
PD
Vol
tage
[V]
0 0.005 0.01 0.015 0.02-10
-5
0
5
10
Time [s]
PD
Vol
tage
[V]
20 40 60 80 1000
1
2
3
4
T [oC]
Nav
g in th
e pe
riod
of T
2

66
Figure 7.6 The total PD charges per cycle Qtot during the constant-voltage period of T2 in square wave
varying with the temperature.
7.3 Effect of temperature on the permittivity of mica-epoxy insulation
In order to confirm how much the changing of insulation material with temperature would affect the PD behavior, the capacitance C′ of mica-epoxy insulation at a frequency range of 10 mHz to 1 kHz was measured at each temperature. Figure 7.5 shows the variation of the relative permittivity εr' of mica-epoxy insulation with temperature; it was obtained by Equation (3.2) based on the value of geometric capacitance C0 of the test sample calculated as follows
110 0 2.43 10 F (7.1)SC
dε −= = ×
where S is the entire area of aluminum tape around the bar where the high voltage connected; the area on the flat surface is S1 = 32 × 25 mm2 and on the side surface is S2 = 25 × 6.4 mm2; thus S = 2 × (S1 + S2) mm2; the thickness of the insulation d is approximately 0.7 mm. ε0 is vacuum permittivity with a value of 8.854×10⁻¹² F/m.
It can be seen that the temperature has a significant effect on the permittivity εr' in the lower frequency range; it increases with the increasing temperature. But at a frequency of 50 Hz, the permittivity εr' only slightly increases with temperature, roughly from εr' = 5.6 at 23 º C to εr' = 6 at 98 º C. The similar measurement results on the capacitance of large rotating machine insulation in [105] show that it is more sensitive to the temperature variation at very low frequencies.
20 40 60 80 1000
1
2
3
4
T [oC]
Qt o
t in th
e pe
riod
of T
2

67
Figure 7.5 Variation of εr' of mica-epoxy insulation of test samples with temperature
There are two probable mechanisms that may affect the changing of PD inception voltage, as mentioned previously. In order to verify how the voltage across the air gap Vgap is affected by the changing of permittivity εr' of mica-epoxy insulation with temperature, the rough calculation was shown below when neglecting the effect of surface charges during the discharge process.
The discharge system can be simulated as two capacitances in series; one is representing the air gap between two mica-epoxy surfaces with a distance of dgap = 0.25 mm, as Cgap, and the other one is for the insulation material with a total thickness of dinsul = 1.4 mm, as Cinsul, then Vgap can be calculated as
( )( )
( )( )
( )( )
00 0
0 0
0
11 1
0.25 (7.2)
1.4 0.25
gap r insulgap
gap insul gap r insul
gap r gap r
insul r gap r
C T A dV V V
C C A d T A d
V T d TV d T d T
ε εε ε ε
ε εε ε
⋅= =
+ + ⋅
⋅ ⋅⇒ = =
+ ⋅ + ⋅
where V0 is the voltage applied to the test samples, A is the cross section of the insulating surface. From the measured values of the permittivity εr', varying from 5.6 at 23 ºC to 6 at 98 ºC, thus Vgap/V0 is varying from 0.5 to 0.517. The voltage Vgap is only 3.3% increasing with the temperature increasing from 23 ºC to 98 ºC due to the changing of permittivity εr'. Thus the temperature dependence behavior of the permittivity of mica-epoxy insulation at 50 Hz can not be the main cause for the decreasing PD inception voltage with temperature.
7.4 Effect of temperature on the breakdown strength of air
Paschen’s law reflects the Townsend breakdown mechanism in gas, that is, an avalanche of electrons is emitted by collisions in the gap and secondary electrons are extracted from the
10-2 10-1 100 101 102 103100
101
102
Frequency [Hz]
ε' r
23 oC
40 oC
60 oC
80 oC
98 oC

68
cathode by ionic bombardment, and this law presents the breakdown characteristics of a gap as a function of the product of the gas pressure p and the gap length d. The breakdown voltage for parallel plates at 20 ºC can be calculated by the Paschen’s law [106]
(7.3)ln( )
ln(1 1 )
BB pdVA pd
γ
⋅=
⋅+
where
( ) ( ); (7.4)i i iT T
VA B
kT kTσ σ
= =
where Vi is the ionization potential; every electron whose energy exceeds eVi will automatically lead to ionization. σi is the true cross-section for ionization, and k is the Boltzmann’s constant and T is the temperature. It is clear that A and B are dependent on the type of gas and the temperature. The values of A and B for air, valid for the range of E/p between 150 and 800 V∙torr-1∙cm-1, are A = 15 ion pairs torr-1∙cm-1 and B = 365 V∙torr-1∙cm-
1[106]. γ is the Townsend’s second ionization coefficient and is usually a small number in the order of 10-3-10-2. In this study, the air gap length is d = 0.025 cm, and gap pressure p is the standard atmospheric pressure in Torr, p = 760 torrs. E/p is 9600 V / (0.025 cm × 760 torrs) = 505 V∙torr-1∙cm-1, in the range of requirement for the values of A and B mentioned previously. Thus the final value is calculated as VB = 1.68 kV. Insert this breakdown voltage of the air gap back to the Equation (7.2) as Vgap, then the applied voltage to the test sample can be obtained with the permittivity value of εr' = 5.6 at room temperature, that is, V0 = 3.36 kV.
The breakdown strength of air is greatly affected by the temperature [103, 107, 108], which can vary the relative air density, causing the change of the average distance for electrons travel to find a neutral gas atom to ionize. Under the condition of uniform electric and thermal field, Paschen’s law is effective for the gas being heated up to the critical temperature around 1400 K [109]. Temperatures above this critical value will result in a faster decrease of the breakdown voltage compared with the calculated one due to the other processes, such as thermionic emission. The gas density N is related to the pressure p and temperature T as follow [106]
(7.5)p NkT=
Thus the temperature dependent terms of B·pd and A∙pd in Equation (7.3) can be replaced by B∙NkTd = Vi σi Nd and A∙NkTd = σi Nd, by inserting the Equation (7.5) and Equation (7.4), and then they change to depend on the air density N. Therefore, the effect of temperature on breakdown strength can be adjusted by the air density correction factor δ given as a general term [103, 106]
0
0
273( ) (7.4)
273tP
P tδ
+=
+
where P0 and P are the air pressure of the standard condition and test condition, respectively, in this experiment, P = P0; t0 = 20 ºC and t is the temperature in degrees Celsius at test conditions. The factor is calculated as δ = 0.79, for 98 ºC relative to standard conditions. Thus

69
the breakdown voltage of air at 98 ºC is VB = 1.33 kV, which is a 20.8% reduction from the value obtained at room temperature. The applied voltage is then V0 = 2.57 kV at 98 ºC.
In summary, the decrease of the PD inception voltage is mainly due to the decrease of breakdown strength of air at the higher temperature. However, the calculated values of the breakdown voltage are lower than the measured PD inception voltage at every temperature. The difference of two values is probably caused by, for instance, the nonuniformity of the mica-epoxy insulation from the curing process; in particular, Townsend’s second ionization coefficient γ in the Equation (7.3) usually refers for the case of the metal surface and its value is greatly affected by the nature of the cathode surface [106]. In this experiment, the mica-epoxy insulating surface instead of the metal surface could be hard to release the electrons from the cathode surface, however, this process is difficult to quantify.

70

71
Chapter 8
Summary of papers
Paper I
This paper presents corona discharges which were carried out in a needle-plane geometry where the surface of the ground electrode was covered by an insulating plate. The effect of insulation material on PD activity was investigated by the evolution of the cumulative number of corona pulses, and compared with the case without the insulation in the discharge system. The applied voltage application was a periodic negative step voltage, whose duration of the voltage period and the pause period between every two consecutive step voltage pulses could be varied separately to influence the decay of the deposited surface charges on the insulating surface. The results show that for the case of step voltage period with the duration of 100 ms and the pause time of 10 s, the PD activity during the first charging period is significantly different from the others depending on the applied voltage stress. At a lower applied voltage, the cumulative number of discharge pulses increases exponentially and then reaches a saturation level within the first charging period, however, with the increasing applied voltage stress, it becomes more linearly increasing over time.
Paper II
Continued with previous paper, the effect of material property on corona discharge in the needle-plane geometry, where an insulating plate was placed over the surface of the plane electrode, was investigated in this paper. Different types of insulation materials with the same thickness and area were used, i.e. polytetrafluoroethylene (PTFE), polyethylene (PE), polycarbonate (PC), polyvinylchloride (PVC), epoxy and dry pressboard. The corona discharges were generated by the application of periodic negative step voltage pulses. The results show that the evolution of corona pulses over time depends on the properties of the insulation materials, such as the bulk conductivity, which has a great effect on the charge accumulation and decay processes. An insulation material with a lower conductivity, such as PTFE and PE, would have more surface charges deposited on its surface during the first charging period of 100 ms, and the charges would not reduce significantly during the relaxation period of 10 s; therefore, the discharge activities can be reduced significantly after the first charging period. However, for the case of the dry and unimpregnated pressboard, there are more discharge activities for every charging period, because the surface charges would significantly decay due to its higher conductivity.

72
Paper III
Identification of surface discharge (SD) and cavity discharge (CD) may be improved by the use of several types of arbitrary testing voltages, since they are not always easy to directly distinguish from the phase resolved PD pattern at traditional power-frequency sinusoidal voltage. PD measurements were performed in two test cells representing canonical cases of SD and CD, with polycarbonate plates as the solid insulating material. Several forms of trapezoid-wave voltage were applied, including the limiting cases of triangular and approximately square-wave voltages, with the sinusoidal voltage as a comparison. The results show that the trapezoid-based voltage waveforms could be considered as a potential new off-line diagnostic method for the clear identification between PD sources of SD and CD. The constant-voltage period of peak value in trapezoidal and square voltage waveforms played an important role in the distinction. Compared with the symmetric feature of cavity discharge at every applied voltage waveform, strong asymmetric behavior was shown in the surface discharge which was produced in the asymmetric test cell during the constant-voltage period between two polarities under trapezoidal and square voltage waveforms. This obvious asymmetrical behavior of surface discharge was caused by a faster rise time and increased the duration of the constant peak-voltage part in the waveform.
Paper IV
The effect of the relative humidity in ambient air on PD activities which were generated in a metal-insulation air gap on stator winding insulation was investigated. The main insulation consists of mica, epoxy resin and glass-fiber. Periodic trapezoidal voltage waveforms were applied, focusing on the influence of the derivative of the applied voltage dU/dt. The results show that with the increasing humidity, the discharge amplitude is greatly reduced, while the average number of discharge pulses is significantly increased. This variation is mainly due to the increased surface conductivity in humid air. Furthermore, PD activities have a wider range of the applied voltage in the higher humidity level. In dry air (RH = 8%), most of PD events concentrate during the voltage increasing period; with the increasing humidity, PD will also occur and recur during the constant-voltage period in the trapezoid at RH = 29%, and in the humid air of RH = 77%, discharges even continue to appear during the voltage falling period.

73
Chapter 9
Conclusions and future work
A new off-line PD diagnostic method based on arbitrary voltage waveform stimulus is explored, in order to obtain a better understanding of PD behavior and related to the discharge physics, in particular on how the charges on an insulating surface would affect the discharge process. This work is mainly aimed at the applications to diagnostics of the stator insulation of high-voltage rotating machines. The PD activity was initiated by several arbitrary voltage waveforms, including a periodic negative step voltage, triangular voltage, trapezoidal voltage and square voltage, together with sinusoidal voltage for comparison. The PD tests include fundamental studies with corona, surface and cavity discharge, using some common insulation materials, then a practical study based on models of sphere-plane discharge and crossed-bar discharge, using the mica-epoxy stator insulation. The influence of ambient conditions of humidity and temperature was also investigated in this part. From the results of four studies presented in this thesis, the following can be concluded:
Corona discharge was studied with an insulating plate placed on the surface of the ground electrode in a needle-plate geometry at periodic negative step voltage. By using different solid insulation materials in the discharge system, and comparing with the case of just air, the results show that the PD repetition rate is strongly dependent on the properties of the insulation material, particularly the conductivity of the material, which has a significant effect on the charge decay process during the PD activities. Unlike the dry pressboard with a higher conductivity, an insulation material with a lower conductivity such as PTFE or PE allows a higher charge density to build up on its surface, leading to reduction of the discharge pulses.
Surface and cavity discharges were investigated in two canonical test cells under several forms of arbitrary voltage waveforms. At the applied half-sine voltage waveform, both SD and CD have the back discharges during zero crossings at a higher applied voltage stress. The comparison of PD patterns of two PD sources shows that cavity discharge has symmetric features at the trapezoidal voltage waveforms, while surface discharge produced in the asymmetric test cell behaves strongly asymmetrically during the constant-voltage period in the two polarities at trapezoidal and square voltage waveforms. This could provide a potential method for better identification of the two PD defects compared to traditional sinusoidal voltage.
The effect of humidity on the sphere-plane discharge that occurs in a metal-insulation air gap on mica-epoxy machine insulation was studied with trapezoidal voltage, including the limiting cases of triangular and square voltages. The results show that the humidity in air can

74
lead to a transition from a few big-amplitude pulses in dry air (RH = 8%) to a large number of small-amplitude pulses in humid air (RH = 77%). This is due to the increasing surface conductivity with the increasing humidity level.
The effect of temperature on the crossed-bar discharge which took place in the air gap between two mica-epoxy surfaces was investigated. The PD analysis was forced on the variation of PD inception voltage with temperature, causing the appearance of PD pulses during the constant-voltage period in the trapezoidal and square voltages at a higher temperature. The measured values of permittivity of mica-epoxy have not a sufficient large change with temperature; therefore, the decreasing breakdown strength of air with the increasing temperature is the main dominant mechanism for the variation of the PD patterns.
The benefit of the application of arbitrary voltage waveform on the off-line PD measurements has shown in the experimental results in this work, it certainly can provide more clear information about PD behavior than the traditional sinusoidal voltage. For the future work, some studies are of great interest: for instance, the new identification method of surface and cavity discharge could be verified for other insulation materials, such as in the transformer oil, as these two PD sources are even harder to identify in it. It would be meaningful to perform the PD measurements in the same sphere-plane and crossed-bar geometries but with different insulation materials, to verify how much the changing of the PD behavior would be caused by the properties of the insulation material. It would be also useful to apply this method to the full-scale stator bars.
Furthermore, the surface charge decay mechanism deserves a better investigation at arbitrary voltage waveforms, since its behavior is significantly important during the discharge process. It is interesting to identify the dominant mechanism of surface charge decay under specific conditions, such as bulk conduction, surface conduction and gas neutralization. This might be achieved by combining the PD measurements with other measurement methods, such as the surface potential measurement and FEM modeling.

75
Bibliography
[1] A. Haddad, D. Warne, ''Advances in High Voltage Engineering'', The Institution of Engineering and Technology, London, UK, 2004.
[2] M. Hoof and S. Lanz, ''PD diagnostics on rotating machines-possibilities and limitation'', Proceedings of Electrical Insulation Conference and Electrical Manufacturing & Coil Winding Conference, Cincinnati, OH, USA, pp. 195-200, 1999.
[3] R. Brütsch, M. Tari, K Fröhlich, T Weiers, R Vogelsang, ''Insulation failure mechanisms of power generators'', IEEE Electrical Insulation Magazine, Vol. 24, No. 4, pp.17-25, 2008.
[4] J. H. Dymond, N. Stranges, K. Younsi and E. Hayward, ''Stator winding failures: contamination, surface discharge, tracking'', IEEE Transactions on Industry Applications, Vol. 38, No. 2, pp. 577-583, 2002.
[5] R. Bodega, A. Cavallini, P.H.F. Morshuis, M. Lazzaroni and F. J. Wester, ''PD recurrence in cavities at different energizing methods'', IEEE Transactions on Dielectrics and Electrical Insulation, Vol. 53, No. 2, pp. 251-258, 2004.
[6] H. Edin, ''Partial discharge studied with variable frequency of the applied voltage'', PhD thesis, KTH, Stockholm, Sweden, 2001.
[7] C. Forssén. ''Modelling of cavity partial discharges at varible applied frequency'', PhD thesis, KTH, Stockholm, Sweden, 2008.
[8] N. Taylor. ''Dielectric response and partial discharge measurements on stator insulation at varied low frequency'', PhD thesis, KTH, Stockholm, Sweden, 2010.
[9] T. S. Sudarshan and R. A. Dougal, ''Mechanisms of surface flashover along solid dielectrics in compressed gases: a review'', IEEE Transaction on Electrical Insulation, Vol. EI-21, No. 5, pp. 727-746, 1986.
[10] J. Kindersberger and C. Lederle, ''Surface charge decay on insulators in air and sulfurhexafluorid-Part I: Simulation'', IEEE Transactions on Dielectrics and Electrical Insulation, Vol. 15, No. 4, pp. 941-948, 2008.
[11] J. Kindersberger and C. Lederle, ''Surface charge decay on insulators in air and sulfurhexafluorid-Part II: Measurements'', IEEE Transactions on Dielectrics and Electrical Insulation, Vol. 15, No. 4, pp. 949-957, 2008.
[12] G. C. Montanari, ''Bringing an insulation to failure: the role of space charge'', IEEE Transactions on Dielectrics and Electrical Insulation, Vol. 18, No. 2, pp. 339-364, 2011.
76
[13] R. Patsch and F. Berton, ''Pulse sequence analysis-a diagnostic tool based on the physics behind partial discharges'', Journal Physics D: Applied Physics, Vol. 35, pp. 25-32, 2002.
[14] M. Hoof and R. Patsch, ''A physical model, describing the nature of partial discharge pulse sequences'', Proceedings of the 5th International Conference on Properties and Applications of Dielectric Materials, Seoul, Korea, Vol. 1, pp.283-286, 1997.
[15] R. Patsch and F. Berton, ''The role of space charges in PD-processes'', Proceedings of 2001 International Symposium on Electrical Insulation Materials (ISEIM 2001), Himeji, Japan, pp. 21-24, 2001.
[16] H. Illias, T. S. Yuan, A. H. A. Bakar, H. Mokhlis, G. Chen and P. L. Lewin, ''Partial discharge patterns in high voltage insulation'', 2012 IEEE International Conference on Power and Energy, Kota Kinabalu Sabah, Malaysia, pp. 750-755, 2012.
[17] H. R. Mirzaei, A. Akbari, M. Aharezi and A. M. Jafari, ''Experimental investigation of PD diagnosis based on consecutive pulses data'', International Conference on Condition Monitoring and Diagnosis (CMD 2008), Beijing, China, pp.1262-1265, 2008.
[18] H. Kranz, ''PD pulse sequence analysis and its relevance for on-site PD defect identification and evaluation'', IEEE Transactions on Dielectrics and Electrical Insulation, Vol. 12, No. 2, pp. 276-284, 2005.
[19] M. Farahani, H. Borsi, E. Gockenbach and M. Kaufhold, ''Partial discharge and dissipation factor behavior of model insulating systems for high voltage rotating machines under different stresses'', IEEE Electrical Insulation Magazine, Vol. 21, No. 5, pp. 5-19, 2005.
[20] M. Ghaffarian Niasar, ''Partial discharge signatures of defects in insulation systems consisting of oil and oil-impregnated paper'', Licentiate Thesis, KTH, Stockholm, Sweden, 2012.
[21] A. Cavallini and G. C. Montanari, ''Effect of supply voltage frequency on testing of insulation system'', IEEE Transactions on Dielectrics and Electrical Insulation, Vol. 13, No. 1, pp. 111-121, 2006.
[22] R. Bodega, A. Cavallini, P.H.F. Morshuis, and F. J. Wester, ''The effect of voltage frequency on partial discharge activity'', 2002 Annual Report Conference Electric Insulation Dielectric Phenomena (CEIDP), pp. 685-689, 2002.
[23] H. A. Illias, G. Chen and P. L. Lewin, ''Partial discharge modelling in a spherical cavity within a dielectric insulation material as a function of frequency'', 2009 IEEE Electrical Insulation Conference (EIC 2009), Montreal, QC, Canada, pp. 55-59, 2009.
[24] B. Florkowska, P. Zydron, M. Florkowski, ''Analysis of PD phase-resolved images at low frequency of testing voltage'', Conference Record of the 2004 IEEE International Symposium Electrical Insulation, pp. 143-146, 2004.
[25] D. Pepper, W. Kalkner, ''PD-pattern of defects in XLPE cable insulation at different test voltage shapes'', 11th International Symposium on High Voltage Engineering (ISH), London, UK, Vol. 5, pp. 313-316, 1999.

77
[26] S. Brettschneider, E. Lemke, J.L. Hinkle and M. Schneider, ''Recent field experience in PD assessment of power cables using oscillating voltage waveforms'', Conference Record of the 2002 International Symposium on Electrical Insulation, Boston, MA, USA, pp. 546-552, 2002.
[27] F. Petzold, M. Beigert, E. Gulski, and H. Oetjen, ''On site PD-diagnosis of power cables using the oscillating voltage method'', IEEE 11th International Conference on Transmission and Distribution Construction, Operation and Live-Line Management, Albuquerque, NM, USA, pp. 1-7, 2006.
[28] F. J. Wester, E. Gulski and J.J. Smith, ''Detection of partial discharges at different AC voltage stresses in power cables'', IEEE Electrical Insulation Magazine, Vol. 23, No. 4, pp. 28-43, 2007.
[29] E. Gulski, F. J. Wester, J. J. Smit, P. N. Seitz and M. Turner, ''Advanced partial discharge diagnostic of MV power cable system using oscillating wave test system'', IEEE Electrical Insulation Magazine, Vol. 16, No. 2, pp. 17-25, 2000.
[30] E. Gulski, H. J. van Breen, J. J. Smit, P. N. Seitz and P. Schikarski, ''Partial discharge detection in generator stator insulation using oscillating voltage waves'', Proceedings of Electrical Insulation Conference and Electrical Manufacturing & Coil Winding Conference, Cincinnati, OH, USA, pp. 331-334, 2001.
[31] C. Forssén, H. Edin, ''Partial discharges in a cavity at variable applied frequency part 1: measurements'', IEEE Transactions on Dielectrics and Electrical Insulation, Vol. 15, No. 6, pp. 1601-1609, 2008.
[32] L. Rux and W. McDermid, ''Assessing the condition of hydrogenerator stator winding insulation using the ramped high direct-voltage test method'', IEEE Electrical Insulation Magazine, Vol. 17, No. 6, pp. 27-33, 2001.
[33] T. Kurihara, S. Tsuru, K. Imasaka, J. Suehiro and M. Hara, ''PD characteristics in an air-filled void at room temperature under superimposed sinusoidal voltages'', IEEE Transactions on Dielectrics and Electrical Insulation, Vol. 8, No. 2, pp. 269-275, 2001.
[34] D. Fabiani, G. C. Montanari, A. Cavallini and G. Mazzanti, ''Relation between space charge accumulation and partial discharge activity in enameled wires under PWM-like voltage waveform'', IEEE Transactions on Dielectrics and Electrical Insulation, Vol. 11, No. 3, pp. 393-405, 2004.
[35] K. Wu, T. Okamoto and Y. Suzuoki, ''Effects of discharge area and surface conductivity on partial discharge behavior in voids under square voltages'', IEEE Transactions on Dielectrics and Electrical Insulation, Vol. 14, No. 2, pp. 461-470, 2007.
[36] K. Zhou, G. Wu, K. Lei, J. Wu and J. Liu, ''Aging time effect on PD characteristics under continuous pulse voltage'', 2007 International Conference on Solid Dielectrics (ICSD), Winchester, UK, pp. 616-618, 2007.
[37] Suwarno, Y. Suzuoki, F. Komori and T. Mizutani, ''Partial discharges due to electrical treeing in polymers: phase-resolved and time-sequence observation and analysis'', Journal Physics D: Applied Physics, Vol. 29, pp. 2922-2931, 1996.

78
[38] Suwarno and T. Mizutani, ''Pulse-sequence analysis of discharges in air, liquid and solid insulating materials'', Journal of Electrical Engineering & Technology, Vol. 1, No. 4, pp. 528-533, 2006.
[39] Suwarno, ''Role of applied voltage waveforms on partial discharge patterns of electrical treeing in low density polyethylene'', International Journal of Electrical and Power Engineering, Vol. 3, No. 3, pp. 184-190, 2009.
[40] B. Florkowska, P. Zydron, ''Analysis of conditions of partial discharges inception and development at non-sinusoidal testing voltages'', 2006 Annual Report Conference on Electrical Insulation and Dielectric Phenomena (CEIDP), Kansas City, MO, USA, pp. 648-651, 2006.
[41] E. Lindell, T. Bengtsson, J. Blennow and S. M. Gubanski, ''Influence of rise time on partial discharge extinction voltage at semi-square voltage waveforms'', IEEE Transactions on Dielectrics and Electrical Insulation, Vol. 17, No. 1, pp. 141-148, 2010.
[42] E. Lindell, T. Bengtsson, J. Blennow and S. M. Gubanski, ''Measurement of partial discharges at rapidly changing voltages'', IEEE Transactions on Dielectrics and Electrical Insulation, Vol. 15, No. 3, pp. 823-831, 2008.
[43] F. Guastavino, G. Coletti, A. Ratto and E. Torello, ''A study about partial discharge measurements performed applying to insulating systems square voltages with different rise times'', 2005 Annual Report Conference on Electrical Insulation and Dielectric Phenomena (CEIDP), pp. 418-421, 2005.
[44] W. G. Ariastina and T. R. Blackburn, ''PD distribution in aged oil impregnated insulation using non sinusoidal voltage supply'', Proceedings of the 9th international conference on properties and applications of dielectric materials, Harbin, China, pp. 517-520, 2009.
[45] G. C. Stone, E. A. Boulter, I. Culbert and H. Dhirani, ''Electrical insulation for rotating machines, design, evaluation, aging, testing, and repair'', IEEE Press Series on Power Engineering, IEEE Press, 2004.
[46] D. L. Evans, ''IEEE working group report on problems with hydrogenerator thermoset stator windings, part I-analysis of survey'', IEEE Transactions on Power Apparatus and Systems, Vol. PAS-100, No.7, pp. 3284-3291, 1981.
[47] CIGRE Study Committee SC11, EG11.02, ''Hydrogenerator failures-results of the survey'', 2003.
[48] M. Istad, M. Runde and A. Nysveen, ''A review of results from thermal cycling tests of hydrogenerator stator windings'', IEEE Transactions on Energy Conversion, Vol. 26, No. 3, pp. 890-903, 2011.
[49] P. Tavner, L. Ran, J. Penman and H. Sedding, ''Condition monitoring of rotating electrical machines'', Power and Energy Series, IET, 2008.
[50] C. Hudon and M. Bélec, ''Partial discharge signal interpretation for generator diagnostics'', IEEE Transactions on Dielectrics and Electrical Insulation, Vol. 12, No. 2, pp. 297-319, 2005.

79
[51] R. Vogelsang, T. Weiers, K. Fröhlich and R. Brütsch, ''Electrical breakdown in high-voltage winding insulations of different manufacturing qualities'', IEEE Electrical Insulation Magazine, Vol. 22, No.3, pp. 5-12, 2006.
[52] G. C. Stone, C. V. Maughan, D. Nelson, and R. P. Schultz, ''Impact of slot discharges and vibration sparking on stator winding life in large generators'', IEEE Electrical Insulation Magazine, Vol. 24, No. 5, pp. 14-21, 2008.
[53] C. Hudon, M. Bélec and M. Lévesque, ''Study of slot partial discharges in air-cooled generators'', IEEE Transactions on Dielectrics and Electrical Insulation, Vol. 15, No. 6, pp. 1675-1690, 2008.
[54] M. Lévesque, É. David, C. Hudon, and M. Bélec, ''Effect of surface degradation on slot partial discharge activity'', IEEE Transactions on Dielectrics and Electrical Insulation, Vol. 17, No. 5, pp. 1428-1440, 2010.
[55] M. Lévesque, É. David, C. Hudon, and M. Bélec, ''Contribution of humidity to the evolution of slot partial discharges'', IEEE Transactions on Dielectrics and Electrical Insulation, Vol. 19, No. 1, pp. 61-75, 2012.
[56] R. J. Jackson, and A. Wilson, ''Slot-discharge activity in air-cooled motors and generators'', IEE Proceedings B of Electric Power Applications, Vol. 129, Pt. B, No. 3, pp. 159-167, 1982.
[57] A. Wilson, ''Slot discharge damage in air cooled stator windings'', IEE Proceeding A of Science, Measurement and Technology, Vol. 138, No. 3, pp.153-160, 1991.
[58] J. S. Johnson, ''Detection of slot surface discharges in high-voltage machine stator windings'', Electrical Engineering, Vol. 71, No. 2, pp. 143-147, 1952.
[59] J. S. Johnson and M. Warren, ''Detection of slot discharges in high-voltage stator windings during operation'', Transaction of the American Institute of Electrical Engineering, Vol. 70, No. 2, pp.1998-2000, 1951.
[60] C. Hudon, P. Guuinic and A. Audoli, ''Investigation of partial discharge signal propagation, attenuation and pattern recognition in a stator winding'', 1996 IEEE International Symposium on Electrical Insulation, Montreal, Quebec, Canada, Vol. 1, pp. 201-205, 1996.
[61] S. Li and J. M. Y. Chow, ''Partial discharge measurement on hydro generator stator windings case studies'', IEEE Electrical Insulation Magazine, Vol. 23, No. 3, pp. 5-15, 2007.
[62] M. Bélec and C. Hudon, ''Long term aging of stator bars exposed to end arm discharges'', 1998 Annual Report Conference on Electrical Insulation and Dielectric Phenomena (CEIDP), Atlanta, GA, USA, Vol. 2, pp. 550-554, 1998.
[63] G. Griffith, S. Tucker, J. Milsom and G. Stone, ''Problems with modern air-cooled generator stator winding insulation'', IEEE Electrical Insulation Magazine, Vol. 16, No. 5, pp. 6-10, 2000.

80
[64] G. C. Stone, M. Sasic, D. Dunn and I. Culbert, ''Motor and generator windings'', IEEE Industry Applications Magazine, Vol. 17, No. 6, pp. 29-36, 2011.
[65] T. Weiers, ''Symptoms of winding insulation aging after 37 years of service life in hydrogenerator'', IEEE Transactions on Energy Conversion, Vol. 25, No. 1, pp. 20-24, 2010.
[66] K. Younsi, D. Snopek, J. Hayward, P. Menard and J. C. Pellerin, ''Seasonal Changes in Partial Discharge Activity on Hydraulic Generators'', Proceedings of Electrical Insulation Conference and Electrical Manufacturing & Coil Winding, Cincinnati, OH, USA, pp. 423-428, 2001.
[67] M. Fenger, G. C. Stone. ''Investigations into the Effect of Humidity on Stator Winding Partial Discharge'', IEEE Transactions on Dielectrics and Electrical Insulation, Vol. 12, No. 2, pp. 341-346, 2005.
[68] Z. Nawawi, Y. Murakami, N. Hozumi, and M. Nagao, ''Effect of humidity on time lag of partial discharge in insulation-gap-insulation system'', 8th International Conference on Properties and Applications of Dielectric Materials, Bali, Indonesia, pp. 199-203, 2006.
[69] C. Kane, A. Golubev, C. Patterson, and R. Astasiewicz, ''The importance of correlating dynamics when performing partial discharge measurement and analysis'', Conference Record of the 2004 IEEE International Symposium on Electrical Insulation, Indianapolis, USA, pp. 117-122, 2004.
[70] R. Soltani, E. David and L. Lamarre, ''Study on the Effect of Humidity on Dielectric Response and Partial Discharge Activity of Machine Insulation Materials'', IEEE Electrical Insulation Conference (EIC 2009), Montreal, QC, Canada, pp. 343-347, 2009.
[71] E. Binder, A. Draxler, M. Muhr, S. Pack. R. Schwarz, H. Egger and A. Hummer, ''Effects of air humidity and temperature to the activities of external partial discharges of stator winding'', 11th International Symposium on High Voltage Engineering (ISH), London, UK, pp. 5.264-5.257, 1999.
[72] R. Soltani, E. David, L. Lamarre, and L. Lafortune, ''Effect of humidity on charge and discharge current of large rotating machines bar insulation'', Conference Record of the 2008 IEEE International Symposium on Electrical Insulation, Vancouver, BC, pp. 412-415, 2008.
[73] D. M. Hepburn, I. J. Kemp, A. J. Shields and J. Cooper, ''Degradation of epoxy resin by partial discharges'', IEE Proceedings of Science Measurement and Technology, Vol. 147, No. 3, pp. 97-104, 2000.
[74] B. Florkowska, ''A study of partial discharge mechanism during the aging of the epoxy/mica insulation'', 1995 Annual Report Conference on Electrical Insulation and Dielectric Phenomena (CEIDP), Virginia Beach, VA, USA, pp. 331-334, 1995.
[75] B. Florkowska, ''Assessment of temperature influence on partial discharges in epoxy/mica insulation'', Proceedings of the 1995 IEEE 5th International Conference on Condition and Breakdown in Solid Dielectrics (ICSD), Leicester, UK, pp. 356-360, 1995.

81
[76] A. C. Gjaerde, ''The combined effect of partial discharges and temperature on void surfaces'', 1997 IEEE Annual Report Conference on Electrical Insulation and Dielectric Phenomena (CEIDP), Minneapolis, MN, USA, Vol. 2, pp. 550-553, 1997.
[77] M. D. Lorenzo del Casale, ''On multistress aging of epoxy resins: PD and temperature'', IEEE Transactions on Dielectrics and Electrical Insulation, Vol. 8, No. 2, pp. 299-303, 2001.
[78] R. Schifani, ''Temperature dependence of epoxy resistance to PD'', IEEE Transactions on Dielectrics and Electrical Insulation, Vol. 2, No. 4, pp. 653-659, 1995.
[79] R. Schifani, R. Candela and P. Romano, ''On PD mechanisms at high temperature in voids included in an epoxy resin'', IEEE Transactions on Dielectrics and Electrical Insulation, Vol. 8, No. 4, pp. 589-597, 2001.
[80] H. J. Breen, E. Gulski, J. J. Smit, H. F. A. Verhaart and W. Leeuw, ''The importance of generator operating conditions on PD data evaluation'', Conference Record of the IEEE International Symposium on Electrical Insulation, Boston, MA, pp. 582-585, 2002.
[81] P. H. F. Morshuis, ''Degradation of solid dielectrics due to internal partial discharge: some thoughs on progress made and where to go now'', IEEE Transactions on Dielectrics and Electrical Insulation, Vol. 12, No. 5, pp. 905-913, 2005.
[82] G. C. Stone, H. G. Sedding and M. J. Costello, ''Application of partial discharge testing to motor and generator stator winding maintenance'', IEEE Transactions on Industry Applications, Vol. 32, No. 2, pp. 459-464, 1996.
[83] ''IEEE Trial-Use Guide to the Measurement of Partial Discharge in Rotating Machinery'', IEEE Std 1434-2000, 2000.
[84] G. C. Stone and V. Warren, ''Effect of manufacturer, winding age and insulation type on stator winding partial discharge levels'', IEEE Electrical Insulation Magazine, Vol. 20, No. 5, pp. 13-17, 2004.
[85] G. C. Stone, ''A perspective on online partial discharge monitoring for assessment of the condition of rotating machine stator winding insulation'', IEEE Electrical Insulation Magazine, Vol. 28, No. 5, pp. 8-13, 2012.
[86] M. F. Cabanas, J. G. Norniella, M. G. Melero, C. H. Rojas, J. M. Cano, F. Pedrayes and G. A. Rocajo, ''Detection of stator winding insulation failures: on-line and off-line tests'', 2013 IEEE Workshop on Electrical Machines Design Control and Diagnosis, Paris, France, pp. 210-219, 2013.
[87] L. B. Rockland, ''Saturated salt solutions for static control of relative humidity between 5 ºC and 40 ºC”, Analytical Chemistry Journal, Vol. 32, No. 10, pp. 1375-1376, 1960.
[88] X. Meng, H. Zhang, and J. Zhu, ''A general empirical formula of current-voltage characteristics for point-to-plane geometry corona discharges'', Journal Physics D: Applied Physics, Vol. 41, pp. 065209-1-065209-10, 2008.
[89] B. L. Henson, ''Toward a fundamental model for steady point-plane corona discharges'', Journal of Applied Physics, Vol. 55, No.1, pp. 150-157, 1984.

82
[90] J. A. Cross, ''Electrostatics: principles, problems and applications'', Adam Hilger, Bristol, UK, 1987.
[91] National physical laboratory, Kaye & Laby, Table of Physical & Chemical Constants, Chapter 2: General physics, Section: 2.6 Electricity and magnetism, SubSection: 2.6.3 Electrical insulating materials. url: http://www.kayelaby.npl.co.uk/general_physics/2_6/2_6_3.html., last accessed: May 14, 2013.
[92] Y. Murooka, T. Takada and K. Hidaka, ''Nanosecond surface discharge and charge density evaluation part I: review and experiments'', IEEE Electrical Insulation Magazine, Vol. 17, No. 2, pp. 6-16, 2001.
[93] H. Mu, G. Zhang, Y. Komiyama, S. Suzuki, H. Miyake, Y. Tanaka and T. Takada, ''Investigation of surface discharges on different polymeric materials under HVAC in atmospheric air'', IEEE Transactions on Dielectrics and Electrical Insulation, Vol. 18, No. 2, pp. 485-494, 2011.
[94] R. A. Fouracre, E. Santos, I. Timoshkin, M. J. Given and S. J. Macgregor, ''Surface discharge propagation: the influence of surface charge'', Conference Record of the 2006 27th International Power Modulator Symposium, Arlington, VA, USA, pp. 39-42, 2006.
[95] R. A. Fouracre, F. A. Tuema, S. J. Macgregor and M. J. Given, ''The influence of charge on surface flashover'', 11th International Symposium on High Voltage Engineering (ISH), London, UK, Vol. 3, pp. 329-332, 1999.
[96] C. Sumereder and M. Muhr, ''Humidity absorption of generator bars'', 8th International Conference on Properties and Applications of Dielectric Materials, Bali, pp. 706-709, 2006.
[97] E. Kuffel, ''Electron attachment coefficients in oxygen, dry air, humid air and water vapour'', Proceedings of the Physical Society, Vol. 74, No. 3, pp. 287-308, 1959.
[98] R. Messaoudi, A. Younsi, F. Massines, B. Despax and C. Mayoux, ''Influence of humidity on current waveform and light emission of a low-frequency discharge controlled by a dielectric barrier'', IEEE Transactions on Dielectrics and Electrical Insulation, Vol. 3, No. 4, pp. 537-543, 1996.
[99] J. M. K. MacAlpine and C. H. Zhang, ''The effect of humidity on the charge/phase-angle patterns of ac corona pulses in air'', IEEE Transactions on Dielectrics and Electrical Insulation, Vol. 10, No. 3, pp. 506-513, 2003.
[100] B. Lutz, and J. Kindersberger, ''Influence of relative humidity on surface charge decay on epoxy resin insulators'', IEEE 9th International Conference on Properties and Applications of Dielectric Materials (ICPADM 2009), pp. 883-886, Harbin, China, 2009.
[101] K. Wu, Y. Suzuoki, and L. A. Dissado, ''The contribution of discharge area variation to partial discharge patterns in disc-voids'', Journal Physics D: Applied Physics, Vol. 37, pp. 1815-1823, 2004.

83
[102] C. Hudon, R. Bartnikas and M. R. Wertheimer, ''Spark-to-glow discharge transition due to increased surface conductivity on epoxy resin specimens'', IEEE Transactions on Electrical Insulation, Vol. 28, No. 1, pp. 1-8, 1993.
[103] E. Sili, F. Koliatene and J. P. Cambronne, ''Pressure and temperature effects on the Paschen curve'', 2011 IEEE Annual Report Conference on Electrical Insulation and Dielectric Phenomena (CEIDP), Cancun, pp. 464-467, 2011.
[104] L. Lan, J. Wu, Y. Yin. X. Li and Z. Li, ''Effect of temperature on space charge trapping and conduction in cross-linked polyethylene'', IEEE Transactions on Dielectrics and Electrical Insulation, Vol. 21, No. 4, pp. 1784-1791, 2014.
[105] R. Soltani, E. David and L. Lamarre, ''Temperature effect on dielectric characteristics of large rotating machines insulation'', Conference Record of the 2008 IEEE International Symposium on Electrical Insulation (ISEI), Vancouver, BC, pp. 280-283, 2008.
[106] E. Kuffel, W. S. Zaengl and J. Kuffel, ''High voltage engineering fundamentals'', Butterworth-Heinemann, Woburn, MA, UK, 2001.
[107] E. Sili, J. Cambronne and F. Koliatene, ''Temperature dependence of electrical breakdown mechanism on the left of the Paschen minimum'', IEEE Transactions on Plasma Science, Vol. 39, No. 11, pp. 3173-3179, 2011.
[108] V. Peesapati, L. Fang, R. Giussani and I. Cotton, ''Comparison of standards requirements for clearances in aerospace'', 2013 IEEE Electrical Insulation Conference (EIC), Ottawa, ON, Canada, pp. 434-438, 2013.
[109] Y. V. Serdyuk, I. V. Bozhko and N. I. Fal’kovskii, “Electrical breakdown in nonuniformly heated gases and the upper temperature limit of the applicability of Paschen’s law'', High temperature, Vol. 38, No. 3, pp. 335-343, 2000.