part i: seismic waves and earth structuremarshallst/gly3160/labs/3_global_seismology_l… · this...
TRANSCRIPT

Lab 3: Global Seismology GLY3160 / PHY3160
Page 1 of 15
NAME: ________________________________________ LAB TIME: __________________________
LAB 3: GLOBAL SEISMOLOGY
While technically "remote" sensing, the field of seismology and its tools provide the most "direct" geophysical
observations of the geology of Earth's interior. Seismologists have discovered much about Earth’s internal
structure, although many of the subtleties remain to be fully understood. The typical cross-section of the planet
consists of the crust at the surface, followed by the mantle, the outer core, and the inner core. Information about
these layers came from seismic travel times and analysis of how the behavior of seismic waves changes as they
propagate deeper into the Earth. Today we are going to examine seismic waves in the Earth and we will take a
look at how and what seismologists know about Earth’s core. Here is a summary of the current understanding of
Earth structure:
To look into what seismic waves can tell us about the core, we need to know how they travel in the Earth. While
seismic energy travels as wavefronts, we often depict them as rays in figures and sketches. A ray is an idealized
path through the Earth and is drawn as a line traveling through the Earth. A wavefront is a surface of energy
propagating through the Earth.
We’ll begin by looking at some videos of wavefronts and rays to get a handle on how these things behave in the
Earth. These animations were made by Michael Wysession and Saadia Baker at Washington University in St. Louis.
This lab will introduce you to the basic concepts of global seismology and the Earth’s interior structure. This is a hybrid assignment:
some aspects can be done with a pencil and paper and some aspects will involve computers. Please answer all questions directly in this
lab assignment, but be neat and clear. Some of this lab came from materials provided by Anna Courtier at James Madison University.
Part I: Seismic Waves and Earth Structure
Lab 3: Global Seismology GLY3160 / PHY3160
Page 2 of 15
To view the videos:
a. Go to http://epsc.wustl.edu/~saadia/page2.html
Let’s start with the ray animations, since that is more similar to figures in your text and what we can easily draw in
class.
b. Scroll down and select “Ray Tracing-S+SS+SSS.” This will show you many ray paths for these phases
and will also plot a graph above showing the travel times and distances where the phases can be
recorded at the surface. The semi-circle you are looking at is a cross-section through half of the
Earth. The thick red lines represent the Crust and the Core-Mantle Boundary.
c. Watch the video a few times so that you can focus on different aspects of the animation.
d. Watch the video a final time, and focus on the green rays that represent the S phase. Notice how if
you connect the ends of all the rays together, they make an arc.
The wavefronts are next. The arc you saw connecting the rays together in the previous video is the wavefront. You
will see it (without the lines for the rays) in the next video. Red colors represent motion into the screen and blue
represents motion out of the screen.
a. Go back to http://epsc.wustl.edu/~saadia/page2.html
b. Select “PREM Velocity Model.” PREM is a standard seismic velocity model for the Earth. This
animation will show the wavefronts as they travel through the Earth, including their behavior in
response to changing seismic velocity with depth. If the shockwave files don’t work, try the AVI
movies. A link for them is near the bottom of the page.
c. Watch the video. This time, across the top you will see the seismograms that would be generated by
these phases for stations at three different distances from the earthquake.
d. Let the video cycle through a second time. This time the phases will be labeled along the wavefronts
they produce. Take a look at all of the different versions of the shear waves in the animation.
e. Watch the video again, and focus on the S-wavefront (the biggest arc, leading the way across the
Earth). Pay attention to the shape of the wavefront arc.
Finally, go back and look at what the wavefronts would look like if velocity in the Earth did not change with depth.
a. Go back to http://epsc.wustl.edu/~saadia/page2.html
b. Select “Homogeneous Earth Model.” Since this is their first video, it includes a short introduction
about the authors and the logistics of the animations.
c. Focus on the S-wavefront again, in particular watch for how it behaves differently than it did when it
traveled through the realistic Earth model.

Lab 3: Global Seismology GLY3160 / PHY3160
Page 3 of 15
Answer the following questions in the space provided.
Ray Animations:
1. Do the seismic rays travel in straight lines? Why? We will investigate this in more detail later in this lab.
2. About how far (in epicentral angle) can the S ray travel before it is no longer recorded at the surface?
3. What does S, SS, and SSS mean? What defines these phases? (be specific)
4. Look at the ScS and Sdiff animation. What is the definition of the ScS phase? (Don’t worry about Sdiff for
now).
Part I Questions

Lab 3: Global Seismology GLY3160 / PHY3160
Page 4 of 15
Wavefront Animations (PREM):
5. Is the wavefront a uniform arc or does it change curvature as it propagates? I.e. does the wavefront
change shape as it propagates? Why? (Hint: there are two reasons!)
6. There are lots of different labels on different wavefronts. These are all different seismic phases. How can
a single earthquake create all of these phases? What is the name of this process?
Wavefront Animations (Homogeneous Earth):
7. What is the major difference in model assumptions between this video and the one using the PREM
velocity model?
8. How do we know that the Earth does not have a homogeneous velocity structure with depth? (I talked
about this in class or you can read section 4.3 in your text)
Lab 3: Global Seismology GLY3160 / PHY3160
Page 5 of 15
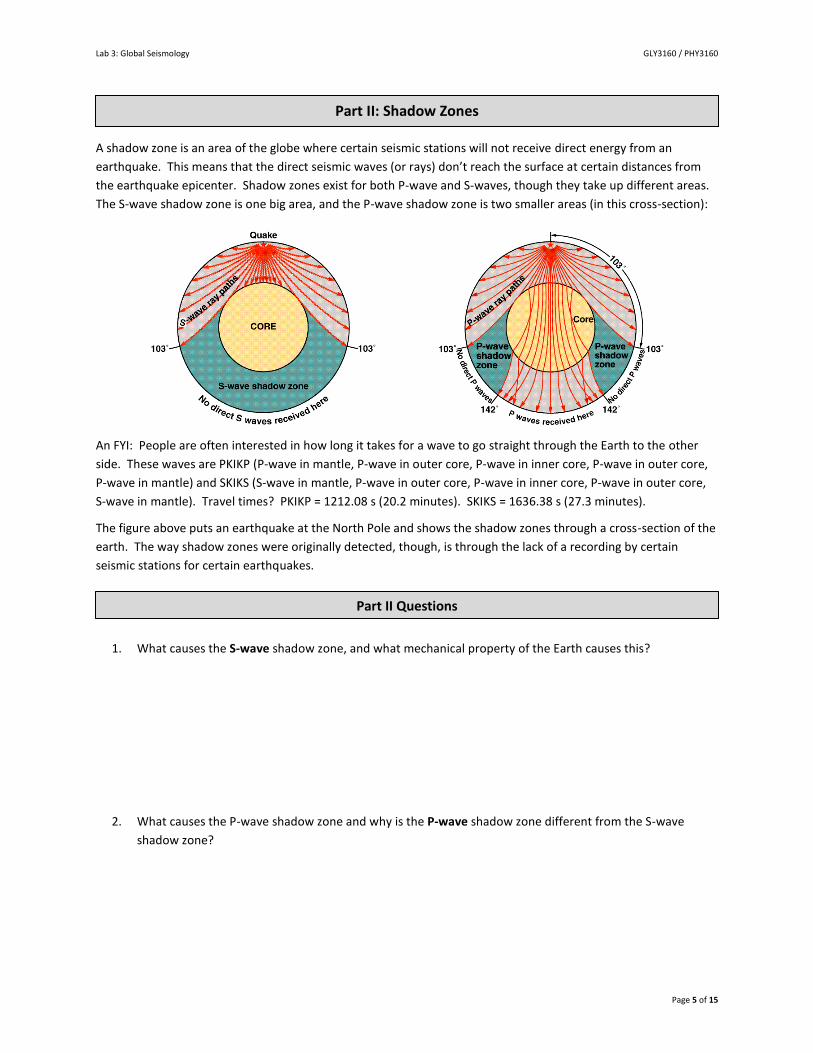
A shadow zone is an area of the globe where certain seismic stations will not receive direct energy from an
earthquake. This means that the direct seismic waves (or rays) don’t reach the surface at certain distances from
the earthquake epicenter. Shadow zones exist for both P-wave and S-waves, though they take up different areas.
The S-wave shadow zone is one big area, and the P-wave shadow zone is two smaller areas (in this cross-section):
An FYI: People are often interested in how long it takes for a wave to go straight through the Earth to the other
side. These waves are PKIKP (P-wave in mantle, P-wave in outer core, P-wave in inner core, P-wave in outer core,
P-wave in mantle) and SKIKS (S-wave in mantle, P-wave in outer core, P-wave in inner core, P-wave in outer core,
S-wave in mantle). Travel times? PKIKP = 1212.08 s (20.2 minutes). SKIKS = 1636.38 s (27.3 minutes).
The figure above puts an earthquake at the North Pole and shows the shadow zones through a cross-section of the
earth. The way shadow zones were originally detected, though, is through the lack of a recording by certain
seismic stations for certain earthquakes.
1. What causes the S-wave shadow zone, and what mechanical property of the Earth causes this?
2. What causes the P-wave shadow zone and why is the P-wave shadow zone different from the S-wave
shadow zone?
Part II: Shadow Zones
Part II Questions

Lab 3: Global Seismology GLY3160 / PHY3160
Page 6 of 15
The existence and details of seismic shadow zones led researchers to investigate Earth’s core. Richard Dixon
Oldham first suggested the presence and size of the core in 1906 using the shadow zone concept. Thirty years
later, Inge Lehmann used finer details of the shadow zone to “discover” Earth’s inner core.
Your task now is to use what you know about the shadow zone to calculate the size of the core. You can get a
rough estimate of the size of the core by estimating the path of the S-wave that is recorded at 103 (right before
the shadow zone starts) as a straight line through the Earth connecting the earthquake and the seismic station. Do
the following on the next page in the space provided. The drawing need not be exactly to scale, but it must be neat
and be reasonably close to scale or else it will be confusing.
a. Sketch out a circle to represent a cross-section of the Earth.
b. Mark a point in the center of the circle to represent the center of the Earth.
c. Draw one line connecting the center of the Earth to any point on the surface.
d. Draw another line connecting the center of the Earth to a point on the surface that is 103 epicentral
angle away from the first point you chose.
e. Draw a straight line through the Earth connecting your two surface points. This represents the path
of the S-wave. We call this the ray path.
f. Now you have a triangle drawn inside the Earth. The height of this triangle is the radius of the core.
Draw a line for the core’s radius, and then sketch out the circle with that radius that represents the
core.
g. Use a little trigonometry and the radius of the Earth (6371 km) will get you the radius of the core. Be
sure to show your work and carefully explain what you did and why. This should require a calculation
and not any measurements.
Part III: Earth’s Core

Lab 3: Global Seismology GLY3160 / PHY3160
Page 7 of 15
Cross Sectional Sketch of the Earth

Lab 3: Global Seismology GLY3160 / PHY3160
Page 8 of 15
1. What value (in km) did you calculate for the radius of the core? Show your work on the previous page.
2. Given that Earth’s core has a radius of approximately 3470 km, what was your % error?
3. Our method for calculating the size of the core was a simplification. What is the key factor that we ignored?
Given this simplification, would you expect your estimate to be too large or too small? Why?
4. Inge Lehman used shadow zones to discover that the inner core is solid. What kind of measurements from
seismograms could be used to show that the inner core is solid? I.e. what would be different on a
seismogram if the inner core were liquid? (3 sentences max)
Part III Questions

Lab 3: Global Seismology GLY3160 / PHY3160
Page 9 of 15
Answer the following questions in the space provided. You must circle your
numerical answers to get full credit.
Snell’s law states that: sin𝑖1
𝑣1=
sin𝑖2
𝑣2
where i1 is the angle of incidence of a ray as it a layer with a seismic velocity of v1
and i2 is the angle of refraction as the ray enters a new layer with a seismic velocity
of v2.
1. In the picture to the right, i1 < i2 . Which seismic velocity is faster?
2. Use the figure to the right…
a) What is the angle (i2) at which the ray will exit the interface?
b) Make a plot in Excel of angle of refraction,i2 (x-axis), vs. angle of incidence, i1 (y-axis, both in degrees), for
the two layer scenario given in part a). To do this, you will need to re-arrange the Snell’s law equation.
Plot the angle of refraction (x-axis) from 0-90 degrees in intervals of one. On this same graph also make a
plot assuming the second layer has a velocity of 10 km/s. Plot the data as two curves (of different colors)
with no symbols. Use a brief but clear legend to let the reader know which curve is which. Include a hard
copy of your graph (in color) at the back of this assignment. As always, provide a brief typed figure caption
(3 sentences max) below the plot that tells the reader what parameters were plotted for each curve and
what the curve represents. Your plot and figure caption should easily fit onto a single page.
Part IV: Refraction of Seismic Rays and Snell’s Law
Lab 3: Global Seismology GLY3160 / PHY3160
Page 10 of 15
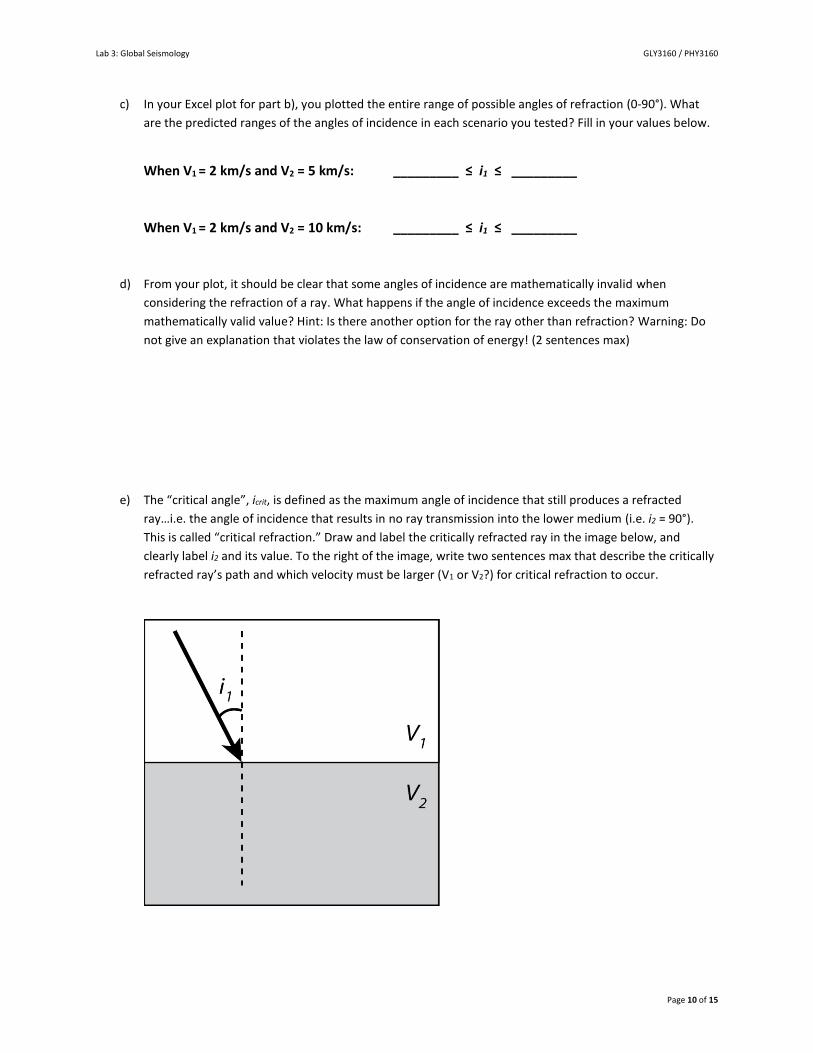
c) In your Excel plot for part b), you plotted the entire range of possible angles of refraction (0-90°). What
are the predicted ranges of the angles of incidence in each scenario you tested? Fill in your values below.
When V1 = 2 km/s and V2 = 5 km/s: _________ ≤ i1 ≤ _________
When V1 = 2 km/s and V2 = 10 km/s: _________ ≤ i1 ≤ _________
d) From your plot, it should be clear that some angles of incidence are mathematically invalid when
considering the refraction of a ray. What happens if the angle of incidence exceeds the maximum
mathematically valid value? Hint: Is there another option for the ray other than refraction? Warning: Do
not give an explanation that violates the law of conservation of energy! (2 sentences max)
e) The “critical angle”, icrit, is defined as the maximum angle of incidence that still produces a refracted
ray…i.e. the angle of incidence that results in no ray transmission into the lower medium (i.e. i2 = 90°).
This is called “critical refraction.” Draw and label the critically refracted ray in the image below, and
clearly label i2 and its value. To the right of the image, write two sentences max that describe the critically
refracted ray’s path and which velocity must be larger (V1 or V2?) for critical refraction to occur.

Lab 3: Global Seismology GLY3160 / PHY3160
Page 11 of 15
f) Derive the generalized equation for icrit given an upper layer of velocity v1 and a lower layer with a velocity
of v2 . (i.e. leave v1 and v2 as variables; do not plug in values). Make sure to algebraically simplify your
answer. Hint: start with Snell’s law and plug in the conditions for critical refraction. A term should go
away! If you get stuck, look at the chapter on refraction seismology in your text. (You will probably not
need this whole page to solve this. I just wanted the next question to start on a new page)

Lab 3: Global Seismology GLY3160 / PHY3160
Page 12 of 15
3. In the figure to the right, a P-ray traveling through a layer of quartz arenite
meets a layer of granite.
a) Determine Vp and Vs for the quartz arenite. Be careful about units! You
should get reasonable seismic velocities for both layers. Hint: what is GPa?
b) Determine Vp and Vs for the granite.
Lab 3: Global Seismology GLY3160 / PHY3160
Page 13 of 15
c) Determine the angles of reflection for the reflected P- and S-rays (i.e. i1p and i1s).
d) Determine the angles of refraction for the refracted P- and S-rays (i.e. i2p and i2s).

Lab 3: Global Seismology GLY3160 / PHY3160
Page 14 of 15
e) Make a clear hand-drawn sketch of your results and label the four resultant rays and their angles.
4. A seismic ray, traveling down from the surface of the Earth through the interior of a spherically layered
planet, encounters a spherically curved layer that extends from 3300 km to 3200 km radius. If the velocities
above, within, and below the layer are respectively 9.0, 10, and 12 km/sec, and the ray was incident to the
layer at 45o, what angle will it leave the layer? Hint: Drawing a sketch of this before you begin is very helpful.
See section 4.4.2 in your textbook, or refer to your class lecture notes if you get stuck.

Lab 3: Global Seismology GLY3160 / PHY3160
Page 15 of 15
5. An underground explosion produces a spherical expansion, so you might expect a seismogram of it to lack an
S-wave arrival. But, S-wave arrivals are recorded. What process is responsible for producing these S-waves?
6. Introductory (i.e. GLY 1101) textbooks often state that seismic velocity increases with density. This is an
admittedly confusing topic, but given your knowledge of seismic velocity equations, you can prevail.
a) Box 4.1 on page 35 of your textbook states the relationship between density and seismic velocities (i.e.
the equation). Given these equations, is the typical GLY 1110 statement true? Explain why. Please do not
talk about restoring stresses. The book’s use of this term is confusing, and will confuse you. Focus on the
equations for the seismic velocities.
b) Sandstone has a density of ~2.7 g·cm-3 and a seismic velocity of 3.5 km·s-1. Peridotite has a density of 3.3
g·cm-3 and a seismic velocity of 8 km·s-1. Explain in no more than three sentences how this could be true
and the implications of this result.
c) In your opinion, is it OK for intro textbooks to teach the general rule mentioned above? (1 sentence)