part c risk - mit - massachusetts institute of technologyweb.mit.edu/astomper/www/univie/pof/chapter...
TRANSCRIPT

Lecture Notes ©2008 Jiang Wang
15.401
Part C RiskPart C Risk
TexPoint fonts used in EMF.Read the TexPoint manual before you delete this box.: AAAAAAAAAAAAAAAAAAAAAAAA
Chapter 7: Introduction to Risk and Return
Chapter 8: Portfolio Choice
Chapter 9: Capital Asset Pricing Model

Lecture Notes
15.401 Part C Risk
Premise in Previous Discussions
1. A rich set of traded securities allow us to price a particular CF(asset) by arbitrage– Time and risk
2. Pricing of risky CFs has the following properties:– CFs with “same risk” are discounted at the same rate
– “Riskier” CFs are discounted at higher rates
Unanswered Questions
1. How do we measure risk?
2. How do financial markets determine the price of risk?
Introduction to Part CIntroduction to Part C

Lecture Notes
15.401 Part C Risk
Goals for Part C
1. Quantifying risk (Chapter 7)
2. Portfolio choice (Chapter 8):– Diversifiable risk versus non-diversifiable risk
– Optimal risk/return trade-off
3. Capital Asset Pricing Model (CAPM) (Chapter 9):– How to determine price of risk (risk adjusted discount rate)
Introduction to Part CIntroduction to Part C

Lecture Notes
15.401
15.401 Finance Theory I15.401 Finance Theory I
AlexAlex Stomper StomperMIT Sloan School of ManagementMIT Sloan School of Management
Lecture Lecture 77: Introduction to Risk and Return: Introduction to Risk and Return

Lecture Notes
15.401 Lecture 7: Intro to risk and return
_ Asset returns_ Measuring risk_ Investor preferences_ Estimating risk and return_ Historic asset returns and risks
Readings:
_ Brealy, Myers and Allen, Chapter 8.1
_ Bodie, Kane and Markus, Chapters 5.2 ‒ 5.4
5
Key conceptsKey concepts
TexPoint fonts used in EMF.Read the TexPoint manual before you delete this box.: AAAAAAAAAAAA

Lecture Notes
15.401 Lecture 6: Intro to risk and return
_ is the price at the beginning of period
_ is the price at the end of period ‒ uncertain (random variable)
_ is the dividend at the end of period ‒ uncertain
Asset returnsAsset returns
P̃1
~D1
P0
6

Lecture Notes
15.401 Lecture 6: Intro to risk and return
Monthly returns - IBM (1990 -- 2000)
Asset returnsAsset returns
7

Lecture Notes
15.401 Lecture 6: Intro to risk and return
Annual returns - S&P 500 Index (1926 -- 2004)
Asset returnsAsset returns
8

Lecture Notes
15.401 Lecture 6: Intro to risk and returnAsset returnsAsset returns
Basic statistics
_ Mean, variance, standard deviation:
_ Sample estimators:
9

Lecture Notes
15.401 Lecture 6: Intro to risk and returnAsset returnsAsset returns
Other statistics
_ Median: 50th percentile (probability of 1/2 that rt < median)
_ Skewness: Is the distribution symmetric?– Negative: big losses are more likely than big gains
– Positive: big gains are more likely than big losses
_ Kurtosis: Does the distribution have fat tails?
_ Correlation: How closely do two variables move together?
10

Lecture Notes
15.401 Lecture 6: Intro to risk and returnAsset returnsAsset returns
Negatively skewed distribution
11

Lecture Notes
15.401 Lecture 6: Intro to risk and returnAsset returnsAsset returns
0.00
0.07
0.14
0.21
-21% -15% -9% -3% 3% 9% 15% 21%
GM Monthly Returns
12

Lecture Notes
15.401 Lecture 6: Intro to risk and returnAsset returnsAsset returns
-4
-3
-2
-1
0
1
2
3
4
-4 -3 -2 -1 0 1 2 3 4
-4
-3
-2
-1
0
1
2
3
-4 -3 -2 -1 0 1 2 3 4
-4
-3
-2
-1
0
1
2
3
4
-4 -3 -2 -1 0 1 2 3 4
-4
-3
-2
-1
0
1
2
3
-4 -3 -2 -1 0 1 2 3 4
ρ = 0 ρ = .5
ρ = .8 ρ = –.5
Correlation between two random variables
13
(Slope of the scattered plot gives the beta.)

Lecture Notes
15.401 Lecture 6: Intro to risk and return
Example. Moments of return distribution. Consider three assets:
_ Between Asset 0 and 1, which one would you choose?
_ Between Asset 1 and 2, which one would you choose?
Investors care about expected return and risk.
Measuring riskMeasuring risk
Mean StDr̃0 (%) 10.0 0.00r̃1 (%) 10.0 10.00r̃2 (%) 10.0 20.00
14

Lecture Notes
15.401 Lecture 6: Intro to risk and returnMeasuring riskMeasuring risk
15

Lecture Notes
15.401 Lecture 6: Intro to risk and return
Assumptions on investor preferences for 15.401
1. Higher mean in return is preferred:
2. Higher standard deviation (StD) in return is disliked:
3. Investors care only about mean and StD (or variance)
Under 1-3, standard deviation (StD) gives a measure of risk.
Investor preferencesInvestor preferences
�r = E[r̃]
=pE[(r̃ ¡ �r)2]
16

Lecture Notes
15.401 Lecture 6: Intro to risk and returnInvestor preferencesInvestor preferences
Investor Preference for Return and Risk
-
6
@@
@@
@@
@@
@@
@@
@@I 6
increasing return
decreasing risk
Risk ( )
Expected return (�r)
17

Lecture Notes
15.401 Lecture 6: Intro to risk and return
Return Indices of Investments in the US Capital Markets
Historical return and riskHistorical return and risk
Data R eturn (% per qtr)S&P Dell
1991-Q4 11.43 9.041992-Q1 -2.55 41.951992-Q2 1.97 -25.261992-Q3 3.10 57.931992-Q4 5.10 67.681993-Q1 4.28 -26.821993-Q2 0.51 -46.621993-Q3 2.56 -11.331993-Q4 2.31 36.091994-Q1 -3.81 11.601994-Q2 0.41 4.461994-Q3 4.92 41.941994-Q4 -0.03 9.521995-Q1 9.74 6.711995-Q2 9.49 37.431995-Q3 7.95 41.371995-Q4 5.96 -21.18
18

Lecture Notes
15.401 Lecture 6: Intro to risk and returnHistorical return and riskHistorical return and risk
Average Annual Total Returns from 1926 to 2005 (Nominal)Asset Mean (%) StD (%)T-bills 3.8 3.1Long term T-bonds 5.8 9.2Long term corp. bonds 6.2 8.5Large stocks 12.3 20.2Small stocks 17.4 32.9Inflation 3.1 4.3
Average Annual Total Returns from 1926 to 2005 (Real)Asset Mean (%) StD (%)T-bills 0.7 4.0Long term T-bonds 2.9 10.4Long term corp. bonds 3.2 9.7Large stocks 9.1 20.3Small stocks 13.9 32.3
19

Lecture Notes
15.401 Lecture 6: Intro to risk and returnHistorical return and riskHistorical return and risk
Average Annual Total Returns from 1926 to 2005 (Nominal)Asset Mean (%) StD (%)T-bills 3.8 3.1Long term T-bonds 5.8 9.2Long term corp. bonds 6.2 8.5Large stocks 12.3 20.2Small stocks 17.4 32.9Inflation 3.1 4.3
Average Annual Total Returns from 1926 to 2005 (Real)Asset Mean (%) StD (%)T-bills 0.7 4.0Long term T-bonds 2.9 10.4Long term corp. bonds 3.2 9.7Large stocks 9.1 20.3Small stocks 13.9 32.3
20

Lecture Notes
15.401 Lecture 6: Intro to risk and return
Returns on risky assets can be highly correlated with each other.
Estimating risk and returnEstimating risk and return
Sample moments for S&P 500 and Dell (1991.Q4 { 1995.Q4)
Sample Moments S&P 500 DellMean 0.0373 0.1379Variance 0.0018 0.1070StD 0.0428 0.3271Skewness 0.4930 -0.5112Covariance 0.0019Beta 1.06
21
Lecture Notes
15.401 Lecture 6: intro to risk and return
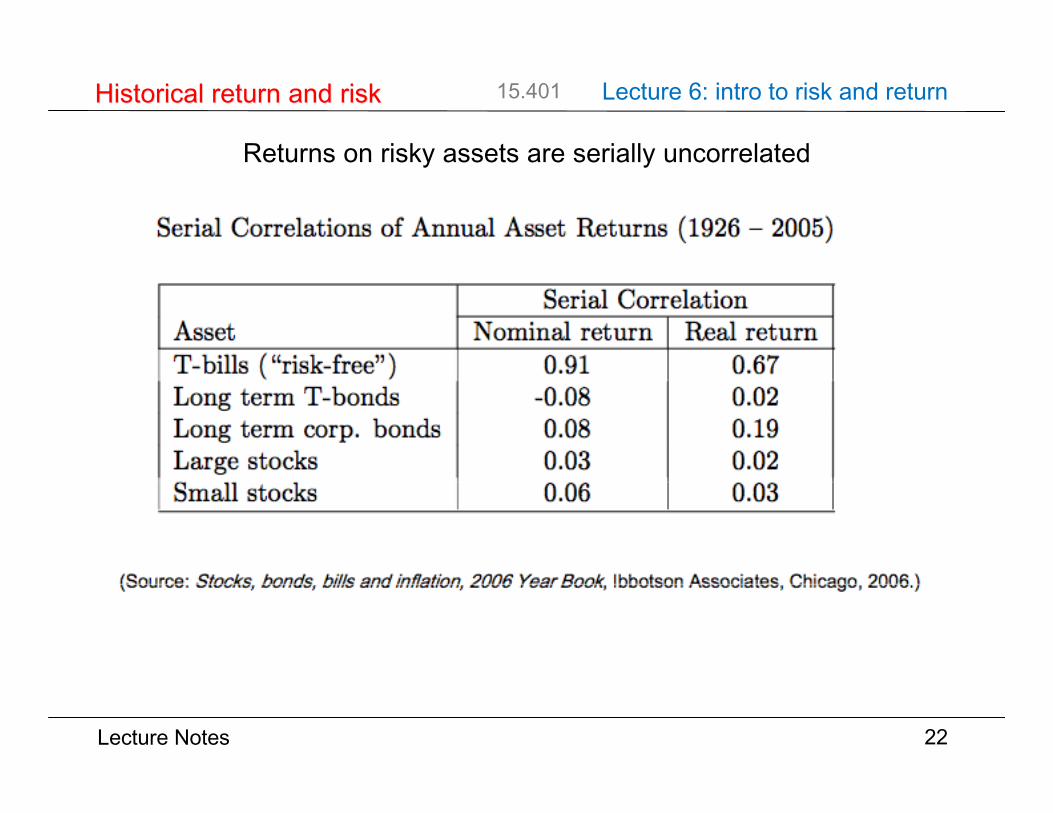
Returns on risky assets are serially uncorrelated
Historical return and riskHistorical return and risk
22
Lecture Notes
15.401 Lecture 6: intro to risk and returnHistorical return and riskHistorical return and risk
Total real returns from 1926 to 2005
Security Initial Total ReturnT-Bills $1.00 1.74Long Term T-Bonds $1.00 6.03Corporate Bonds $1.00 8.86Large Stocks $1.00 242.88Small Stocks $1.00 1,208.84
23

Lecture Notes
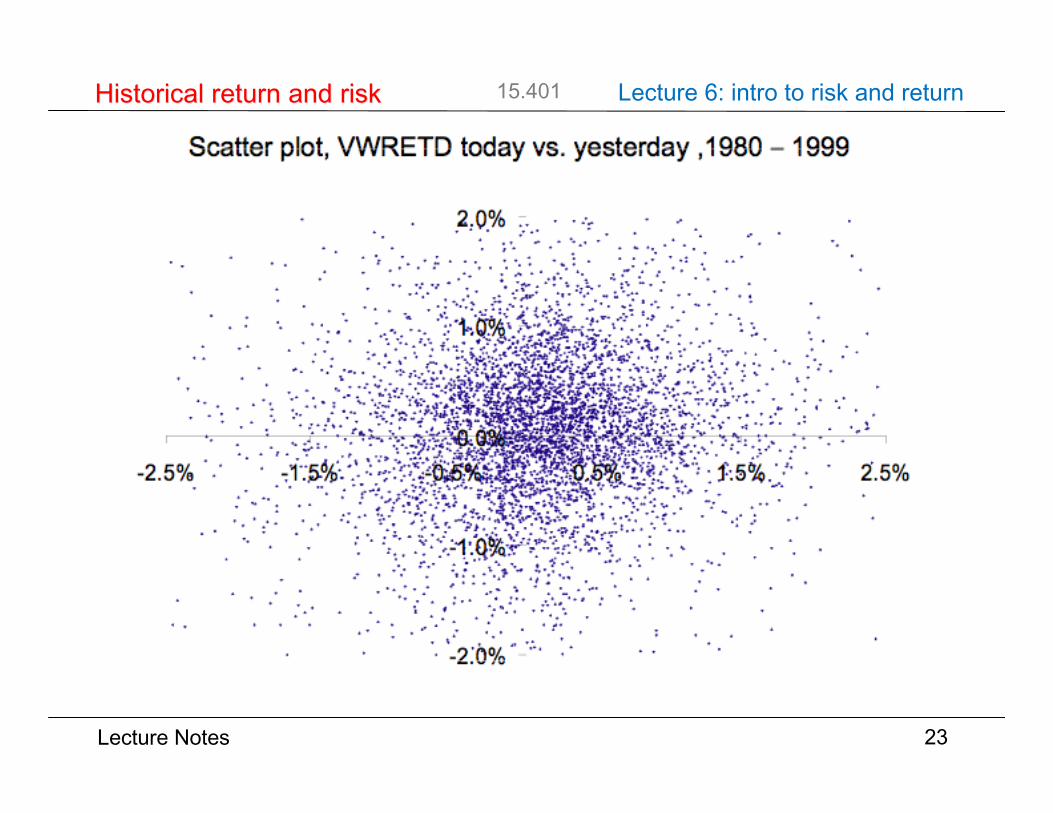
15.401 Lecture 6: Intro to risk and returnHistorical return and riskHistorical return and risk
-2.0%
-1.0%
0.0%
1.0%
2.0%
-2.5% -1.5% -0.5% 0.5% 1.5% 2.5%
Scatter plot, VWRETD today vs. yesterday ,1980 ‒ 1999
24

Lecture Notes
15.401 Lecture 7: Intro to risk and return
_ Asset returns_ Measuring risk_ Investor preferences_ Estimating risk and return_ Historic asset returns and risks
25
Key conceptsKey concepts
TexPoint fonts used in EMF.Read the TexPoint manual before you delete this box.: AAAAAAAAAAAA