part b ra hcna epidemiology - home | scotphn€¦ · 4 preface this report forms part of a wider...
TRANSCRIPT

1
Health Care Needs Assessment of Services for
Adults with Rheumatoid Arthritis
PART B Epidemiology of RA in Scotland
Scottish Public Health Network - July 2012
2
Table of Contents
Preface 4
Author 4
1 Introduction 5
11 Background 5
12 Aim of HCNA 5
13 HCNA methods 5
14 Format of this report 6
15 Scope of HCNA 6
2 Methods 7
21 Incidence and prevalence data 7
22 Primary care activity data 7
23 Secondary care activity data 8
24 Outcomes data 8
3 Epidemiology of RA 9
31 What is Rheumatoid Arthritis 9
32 Who does RA affect 9
33 What causes RA 9
34 How is RA diagnosed 10
35 How is RA treated 10
36 Prevalence of RA in Scotland 10
37 Impact of ageing population on future prevalence of RA 12
38 Incidence of RA in Scotland 15
39 Primary care activity data 17
310 Secondary care activity data - Outpatient attendances 18
311 Secondary care activity data - Hospital admissions 21
312 Impact of RA on employment 22
313 Cost effectiveness of treatment for RA 24
3
4 Summary 25
5 Recommendations 26
REFERENCES 27
ABBREVIATIONS USED 29
GLOSSARY 30
APPENDICES 34
4
Preface
This report forms part of a wider health care needs assessment (HCNA) of services
for adults with rheumatoid arthritis (RA) in Scotland
This report forms Part B of the wider HCNA report and describes the epidemiology of
RA in Scotland The following reports are also available
Part A which summarises the conclusions and recommendations of the
HCNA
Part C which describes the corporate and comparative elements of the HCNA
and
Part D which considers the cost implications of developing the delivery of RA
services in Scotland
Author
The data in this report was collated by ScotPHN on behalf of the wider RA HCNA
stakeholder group
5
1 Introduction
11 Background
In 2002 the Public Health Institute for Scotland (PHIS) undertook a needs
assessment of rheumatoid arthritis (RA)1 Since then the evidence base and policy
context have changed considerably The Scottish Public Health Network (ScotPHN)
was therefore asked by the Scottish Government to update the previous needs
assessment to take account of the current epidemiology and recent advances in the
understanding treatment and care of people with rheumatoid arthritis
12 Aim of HCNA
The aim of the updated health care needs assessment (HCNA) is to
review the epidemiology of rheumatoid arthritis in Scotland (including future
trends)
identify the views of stakeholders on current and future service provision
identify gaps in service provision and highlight priority areas for change and
make recommendations that will assist NHS Boards to plan and develop
services for those with rheumatoid arthritis in their local area
13 HCNA methods
The HCNA has been undertaken using the ScotPHN project methodology for health
care needs assessment (described in more detail in Part C of the report) and has
used elements of the following three approaches to needs assessment
Epidemiological Needs Assessment describing the incidence and prevalence
of the disease and baseline service activity
Corporate Needs Assessment reporting the views of interested parties and
stakeholders (including professionals and service users and their carers) and
Comparative Needs Assessment comparing and contrasting current RA
services in Scotland with those provided elsewhere
6
This report describes the epidemiological needs assessment and forms Part B of the
overall report The corporate and comparative elements of the needs assessment are
described in Part C The cost implications are described in Part D and the HCNArsquos
conclusions and recommendations are summarised in Part A
14 Format of this report
This report is intended to be a technical document A patient version of the HCNArsquos
overall findings will also be produced
15 Scope of HCNA
Of note the HCNA covers adults (aged 16 years and over) only
7
2 Methods
The purpose of the epidemiological element of the HCNA was to describe the
epidemiology of rheumatoid arthritis in Scotland including future scenarios
During the process the following issues were identified in relation to the data
available
21 Incidence and prevalence data
It is important to note that there is no robust epidemiological study of RA which
directly relates to Scotland Indeed this is a recognised lack within the wider context
of the evidence base for the condition To address this a review of the research
literature was undertaken to identify new UK or international studies published since
the publication of the previous PHIS report in 2002 which could be used to inform an
updated epidemiological statement Unfortunately little epidemiological research has
been published during this period Within the UK the work of the research team
associated with the Arthritis Research UK funded Norfolk Arthritis Register (NOAR)
remains the only major source of epidemiological data As a result the basis of the
descriptive epidemiology presented here is primarily based on studies derived from
NOAR
Given the current lack of Scottish RA data consideration should be given to
developing robust Scottish epidemiological data (eg by establishing a Scottish
Registry for RA) to examine the epidemiology of RA and its consequences in
Scotland However this would require additional resources which in the current
difficult economic climate are likely to be difficult to achieve
22 Primary care activity data
Discussion with the Information Services Division (ISD) of NHS National Services
Scotland did not identify any useable primary care data on which to base estimates of
primary care activity for RA RA is not currently contained within the Quality and
Outcomes Framework (QOF) and it was not possible to generate robust data from the
8
Practice Team Information (PTI) database Data from England and Wales has
therefore been used instead
23 Secondary care activity data
Securing data on service use specific to RA is not straight-forward Whilst ISD publish
activity data on rheumatology outpatient attendances and day case and inpatient
admissions (as part of the Scottish Morbidity Record) this is not specific to RA As a
general indicator of rheumatology activity however these data have been included in
the descriptive epidemiology
24 Outcomes data
Little outcome data is available Scottish audit data from the Clinical Audit of Care in
Rheumatoid Arthritis (CARA)2 and the Scottish National Audit of Early RA (SNARE)3
is discussed in Part C of the HCNA report
9
3 Epidemiology of RA
31 What is Rheumatoid Arthritis
Rheumatoid arthritis is a disease of the joints and may involve other organs of the
body It causes swelling stiffness and pain in joints which can result in difficulties
with many aspects of everyday life such as washing and dressing housework
cooking and gardening participation in hobbies and sport walking childcare and the
ability to work effectively
Untreated rheumatoid arthritis can cause irreversible joint damage tendon rupture
and loss of muscle These gradually affect the range of movement of joints affecting
quality of life More general effects such as fatigue weight loss and fever can also be
experienced Lung involvement (eg pleural effusion or interstitial pneumonia) can
cause breathlessness Other problems may include inflammation in the eye (scleritis)
or heart (pericarditis) and patients with rheumatoid arthritis have an increased risk of
ischaemic heart disease some malignancies and fractures due to osteoporosis
The health impact of RA is described further in Part C of the report
32 Who does RA affect
Overall the occurrence of RA is two to four times greater in women than men4 There
can be a family history of the disease or other autoimmune conditions It can develop
at any age unlike some other forms of rheumatic disease but has a peak incidence
in the 5th and 6th decades of life (ie in a patientrsquos 40s and 50s)
33 What causes RA
The exact cause of RA is not known It appears that in someone who is genetically
susceptible an environmental trigger initiates a complex series of changes in the
immune system Instead of being able to tell the difference between its own body
tissues and foreign tissue the immune system becomes dysfunctional and creates a
response to the bodyrsquos natural tissues This is called lsquoautoimmunityrsquo and is manifest
10
by inflammation in the joints and tendons producing symptoms of pain stiffness and
swelling
34 How is RA diagnosed
The European League Against Rheumatism (EULAR) and the American College of
Rheumatology (ACR) have recently updated the diagnostic criteria for RA (Appendix
1) These use a combination of a patientrsquos symptoms examination findings and blood
tests to make the diagnosis No one single lsquotestrsquo can diagnose the condition The
diagnosis of RA is discussed further in Part C of the report
35 How is RA treated
The treatment of RA includes both drug treatments and non-drug approaches (eg
patient education physiotherapy occupational therapy and podiatry) with early
identification and treatment leading to better patient outcomes The treatment of RA is
discussed further in Part C of the report
36 Prevalence of RA in Scotland
It is difficult to ascertain current levels of prevalence of RA in Scotland The largest
study of prevalence remains the Norfolk based NOAR study which monitored both
primary and secondary care to capture new cases Table 1 shows the estimated
number of men and women (aged 20 years and over) with RA in Scotland by NHS
Board area These estimates are based on prevalence figures developed by Arthritis
Research UK using NOAR data (given in Appendix 2) applied to General Register
Office (GRO) population estimates for Scotland in 2009
11
Table 1 Estimated number of men and women (aged 20 years and over) with rheumatoid arthritis in 2009 by age group and NHS Board area
Population 20-34 35-44 45-54 55-64 65-74 75+ Total Population 20-34 35-44 45-54 55-64 65-74 75+ Total
Ayrshire amp Arran 175871 6 5 150 141 203 257 761 191289 36 32 475 434 520 574 2072
Borders 54538 1 2 49 46 67 90 255 58142 9 10 149 138 167 180 652
Dumfries amp Galloway 71849 2 2 62 64 97 130 357 76661 12 12 195 188 236 260 903
Fife 175422 7 5 147 132 183 237 711 187963 39 32 447 406 467 531 1923
Forth Valley 140770 5 4 119 104 142 173 547 150613 31 27 360 316 368 383 1485
Grampian 270863 11 8 235 202 256 349 1059 274117 60 48 673 578 629 738 2726
Greater Glasgow amp Clyde 576389 27 16 483 376 501 671 2074 622637 156 108 1530 1150 1404 1679 6026
Highland 153070 5 4 136 130 180 232 688 157460 26 27 405 383 442 486 1768
Lanarkshire 270451 10 8 231 190 259 320 1019 291764 61 53 730 588 708 722 2862
Lothian 399208 19 12 319 259 337 476 1422 427023 117 76 979 793 892 1076 3933
Orkney 9829 0 0 9 8 13 14 45 10131 2 2 26 24 29 30 112
Shetland 11214 0 0 10 9 12 14 46 10996 2 2 28 24 27 30 112
Tayside 192960 8 5 159 147 214 307 839 206590 43 33 492 449 538 663 2218
Western Isles 12854 0 0 12 11 16 21 61 13326 2 2 32 31 40 50 157
SCOTLAND 2515288 101 72 2120 1821 2479 3291 9883 2678712 596 465 6522 5501 6466 7402 26952
Age (years) Age (years)
Women Men
NHS Board Area
Calculated by applying Arthritis Research UK prevalence rates (Appendix 2) to General Register Office for Scotland mid-2009 Population Estimates
Source httpwwwarthritisresearchorg Accessed 21012011
Symmons D Turner G Webb R Asten P Barrett E Lunt M et al The prevalence of rheumatoid arthritis in the United Kingdom new estimates for a new century Rheumatology 2002 41(7) 793-800 5
Totals stated may vary slightly from the numbers given within the table due to rounding error
12
Table 1 shows
An estimated 36 835 adults in Scotland have RA
RA is two to three times more common among women than men (with an
estimated 9883 men having RA compared with 26952 women) and
The prevalence of RA increases considerably with age
Care should be taken to not over-interpret these crude estimates as they are based
on figures from NOAR and may not fully reflect the position in Scotland (since the
epidemiology of the NOAR population may not accurately reflect that of the Scottish
population) However these are the best estimates available at present
Of note the National Institute for Health and Clinical Excellence (NICE) use an overall
prevalence estimate for RA of 08 of all adults aged 18 years and over in their cost
estimates4 This is also based on data from Symmons et al 20025 The cost
calculations in Part D of this HCNA use the NICE prevalence figure of 08 to
ensure consistency with previous NICE cost calculations
There is very little data on the prevalence of rheumatoid arthritis in ethnic minorities
37 Impact of ageing population on future prevalence of RA
Looking to the future as the Scottish population as a whole ages the prevalence of
RA will increase Table 2 provides estimates of the projected numbers of adults with
RA in 2010 2015 and 2020 These prevalence estimates simply reflect the impact of
the population changes which are predicted by the GRO to occur in Scotland over the
next ten years Table 2 shows that the number of adults in Scotland with RA is
expected to rise from 37539 in 2010 to 42505 in 2020 (ie a 13 increase over 10
years)
As the Scottish population ages the number of people with RA will increase This is
likely to be most pronounced in areas where the population over the age of 65 years
13
is expected to grow considerably More detailed information on the projected
prevalence of RA by age group and NHS Board area is provided in Appendix 3
14
Table 2 The projected number of men and women aged 16 years and over with rheumatoid arthritis in 2010 2015
and 2020 by NHS Board area
2010 2015 2020
NHS Board Area Males Females Total Males Females Total Males Females Total
Ayrshire amp Arran 778 2107 2885 853 2227 3079 908 2300 3209
Borders 261 665 926 293 723 1017 320 771 1091
Dumfries amp Galloway 364 919 1283 402 973 1375 429 1007 1436
Fife 731 1965 2696 817 2117 2934 888 2229 3117
Forth Valley 562 1514 2076 628 1641 2270 680 1742 2422
Grampian 1088 2789 3877 1225 3012 4237 1343 3203 4546
Greater Glasgow amp Clyde 2098 6094 8192 2223 6304 8527 2324 6430 8754
Highland 706 1812 2518 788 1961 2749 863 2077 2940
Lanarkshire 1038 2915 3953 1147 3121 4268 1231 3272 4503
Lothian 1457 4013 5470 1620 4325 5945 1767 4593 6361
Orkney 46 116 162 53 127 180 58 137 195
Shetland 47 114 161 54 122 176 60 131 191
Tayside 859 2261 3120 941 2394 3336 1008 2488 3496
Western Isles 62 159 220 67 168 235 72 174 246
SCOTLAND 10096 27444 37539 11112 29216 40328 11951 30554 42505
Calculated by applying Arthritis Research UK prevalence rates (Appendix 2) to General Register Office for Scotland mid-2009 Population Estimates
Source httpwwwarthritisresearchorg Accessed 210111
Symmons D Turner G Webb R Asten P Barrett E Lunt M et al The prevalence of rheumatoid arthritis in the United Kingdom new estimates for a new century Rheumatology 2002 41(7) 793-800 5
Totals stated may vary slightly from the numbers given within the table due to rounding error
15
38 Incidence of RA in Scotland
Again there is little current data on the incidence of rheumatoid arthritis in Scotland
Table 3 shows the estimated annual number of new cases of RA by age sex and
NHS Board in Scotland These estimates have been calculated using incidence rates
developed by Arthritis Research UK using NOAR data (Appendix 4) applied to GRO
population estimates for Scotland for 2009 As with the prevalence estimates these
incidence estimates must be treated with a degree of caution since they are derived
from NOAR data and are likely to be subject to variation based on diagnostic and
presentation biases As such the numbers given may underestimate the true
incidence in any given area Be that as it may they still provide useful information and
show that an estimated 549 men and 1302 women in Scotland develop RA each
year
Of note current incidence rate estimates for RA vary NICE for example estimate
that 15 males and 36 females per 10000 population become affected by RA
annually4 In this report we have used the Arthritis Research UK rates (Appendix 4)
to allow calculation of age-specific estimates for each Board in Table 3 However the
NICE rates have been used in the economic analysis in Part D to ensure consistency
with previous NICE cost calculations
For the purposes of planning incidence rates for RA (including the peak age of onset)
appear to be stable (unlike RA prevalence which is predicted to rise considerably over
the next ten years)
Although the number of new cases of RA may be relatively low compared with other
conditions given the chronic nature of RA and the effectiveness of early treatment
the numbers are important
16
Table 3 Estimated number of new cases of rheumatoid arthritis in males and females in 2009 by age and NHS Board area
NHS Board Area Population 15-44 45-54 55-64 65-74 75+ Total Population 15-44 45-54 55-64 65-74 75+ Total
Ayrshire amp Arran 175871 5 8 10 12 7 42 191289 23 26 23 19 6 97
Borders 54538 1 3 3 4 2 14 58142 7 8 7 6 2 30
Dumfries amp Galloway 71849 2 3 5 6 3 19 76661 8 11 10 9 3 40
Fife 175422 5 8 10 11 6 39 187963 23 25 21 17 5 92
Forth Valley 140770 4 6 8 8 5 31 150613 19 20 17 14 4 73
Grampian 270863 8 13 15 15 9 59 274117 35 37 30 23 7 133
Greater Glasgow amp Clyde 576389 17 26 27 29 18 117 622637 83 84 61 52 17 296
Highland 153070 4 7 9 11 6 37 157460 18 22 20 16 5 82
Lanarkshire 270451 8 12 14 15 8 58 291764 37 40 31 26 7 142
Lothian 399208 13 17 19 20 12 81 427023 60 54 42 33 11 199
Orkney 9829 0 0 1 1 0 2 10131 1 1 1 1 0 5
Shetland 11214 0 1 1 1 0 3 10996 1 2 1 1 0 5
Tayside 192960 5 9 11 12 8 45 206590 24 27 24 20 7 102
Western Isles 12854 0 1 1 1 1 3 13326 1 2 2 1 1 7
SCOTLAND 2515288 72 114 132 145 86 549 2678712 341 359 290 238 74 1302
Age (years)
Women Men
Age (years)
Calculated by applying Arthritis Research UK incidence rates (Appendix 4) to General Register Office for Scotland mid-2009 Population Estimates
Source httpwwwarthritisresearchorg Accessed 21012011
Wiles N Symmons DPM Harrison B Barrett E Barrett JH Scott DGI et al Estimating the incidence of rheumatoid arthritis - Trying to hit a moving target Arthritis Rheum 1999 42(7) 1339-46 6
Totals stated may vary slightly from the numbers given within the table due to rounding error
17
39 Primary care activity data
As discussed in section 22 ISD does not have robust Scottish data on primary care
activity for RA Data from England and Wales has therefore been used instead in this
assessment
In England and Wales NICE has estimated that in a ldquostandardrdquo GP practice of 10000
people (with 8000 being adults over the age of 18 years) there will be 8 people per
year referred for RA assessment (01 of the adult population) of which 2 will be
diagnosed with the condition (0025 of the adult population)4 7 NICE estimate that
at any given time 08 of the adult population over 18 years will be in ongoing
management for RA equating to 60 people per year in the standard practice The
impact of these estimates for NHS Boards in Scotland is shown in Table 4
Table 4 Estimated number of people being assessed for RA diagnosed with RA or in ongoing treatment for RA each year by NHS Board area
NHS Board Area RA
Assessment RA
Diagnosis RA
Ongoing care
Ayrshire amp Arran 294 73 2348
Borders 90 23 720
Dumfries amp Galloway 120 30 961
Fife 289 72 2310
Forth Valley 229 57 1833
Grampian 436 109 3486
Greater Glasgow amp Clyde 959 240 7675
Highland 250 62 1996
Lanarkshire 441 110 3531
Lothian 665 166 5318
Orkney 16 4 128
Shetland 17 4 139
Tayside 321 80 2567
Western Isles 21 5 169
SCOTLAND 4148 1037 33183
Source NICE (2010) Determining local service levels for a service for the diagnosis and management of rheumatoid arthritis in adults Benchmarks for a standard population7 Calculated using General Register Office for Scotland mid 2009 Population Estimates
18
310 Secondary care activity data - Outpatient attendances
Table 5 and Table 6 present ISD SMR00 data on outpatient attendances for
Rheumatology as a specialty Table 5 shows the total number of attendances and
Table 6 shows the number of new patient attendances Of note
Data is shown by NHS Board of treatment (not Board of residence)
The data do not separate out RA from other reasons to attend a Rheumatology
outpatient clinic As a general rule of thumb clinical experience suggests that
RA accounts for up to 75 of a rheumatologistrsquos outpatient workload
The data covers consultant-led clinics only Clinics led by a nurse or allied
health professionals are not included in the data shown and
The quality of the data available is variable and data for some Boards should
be treated with a high degree of caution
As with all activity data care needs to be exercised in its interpretation particularly
when comparing different geographical areas For example in areas with a higher
recorded activity the data may reflect a fully developed rheumatology service
provision or simply a wider catchment area for what service provision exists Equally
in smaller health board areas the relatively low levels of attendance may be a
reflection of smaller populations being served or of a more generalist approach to
care with fewer patients being seen by a specialist in rheumatology rather than a
general physician
The quality of the data for some Boards limits its interpretation However what is
clear from the data is that across Scotland as a whole both the number of new
patients attending Rheumatology outpatient clinics and the total number of
attendances has grown over the ten years of reported activity
Additional data on the returnnew ratio and DNA (did not attend) rates are provided in
Appendix 5 and Appendix 6 respectively A summary of SMR00 data collated by
Board is provided in Appendix 7
19
Table 5 Outpatient and AampE Summary by NHS Board of Treatment Rheumatology Total Attendances
NHS Board of Treatment Financial Year Ending 31st March
2001 2002 2003 2004 2005 2006 2007 2008 2009 2010p
Ayrshire amp Arran 156 159 176 113 0 0 0 0 0 0
Borders 0 0 81 0 1117 1140 1240 1172 1145 823
Dumfries amp Galloway 2475 2352 2412 2888 3049 3234 3903 4032 3706 3668
Fife 3827 4504 4977 7001 5405 4613 4573 4874 5341 5906
Forth Valley 2515 2335 2345 2502 2083 2020 2356 2768 3379 3258
Golden Jubilee National Hospital x x x x 0 0 0 0 0
Grampian 8671 8690 8919 9097 9129 9389 9138 9097 9234 9519
Greater Glasgow amp Clyde 34081 35868 36576 33896 32525 35090 36377 37471 39257 39687
Highland 1720 1668 1693 1788 1823 1826 2684 3418 3475 3708
Lanarkshire 10031 8970 9214 9660 9666 10245 10840 10840 10840 10840
Lothian 9589 10519 10856 10794 9840 10397 10051 10660 11225 12328
Orkney Islands 86 87 113 134 121 158 141 93 146 214
Shetland Islands 133 268 516 654 662 587 696 957 1205 902
Tayside 6705 6684 6710 7252 6997 6077 6687 6296 8088 8370
Western Isles 0 0 0 0 0 0 0 0 0 0
NHS Scotland 79989 82104 84588 85779 82417 84776 88686 91678 97041 99223
Source ISD(S)1 SMR00 As at December 2010 Accessed 21212
x = not applicable = not available p = provisional
ISD notes re data issues Outpatient data for the Golden Jubilee National Hospital for the year ending 31st March 2005 is not currently available due to system problems There are long standing unresolved data issues for NHS Lanarkshire NHS Tayside and NHS Forth Valley Additional notes In addition to the caution from ISD above re data issues for NHS Lanarkshire NHS Tayside and NHS Forth Valley data for other Boards (eg Ayrshire amp Arran) should also be treated with caution
20
Table 6 Outpatient and AampE Summary by NHS Board of Treatment Rheumatology New Patients
NHS Board of Treatment
Financial Year Ending 31st March
2001 2002 2003 2004 2005 2006 2007 2008 2009 2010p
Ayrshire amp Arran 37 19 37 26 0 0 0 0 0 0
Borders 0 0 19 0 269 300 283 313 294 198
Dumfries amp Galloway 512 454 434 541 526 552 659 691 695 749
Fife 713 786 865 1311 985 1076 954 1264 1199 1322
Forth Valley 576 503 485 654 530 604 775 684 767 709
Golden Jubilee National Hospital x x x x 0 0 0 0 0
Grampian 1874 1958 1907 1945 1935 2039 2028 2041 2318 2384
Greater Glasgow amp Clyde 4864 4874 4994 4352 4562 5646 5535 6538 6814 6845
Highland 262 269 281 311 318 358 547 662 797 759
Lanarkshire 1655 1508 1711 1689 1822 1728 1728 1728 1728 1728
Lothian 2738 3056 2814 2751 2465 2798 3178 3518 3684 3792
Orkney Islands 27 34 41 53 27 53 49 31 58 50
Shetland Islands 54 72 151 150 109 93 132 184 241 191
Tayside 1151 1188 1249 1454 1348 1336 1493 1276 1815 2107
Western Isles 0 0 0 0 0 0 0 0 0 0
NHS Scotland 14463 14721 14988 15237 14896 16583 17361 18930 20410 20834
Source ISD(S)1 SMR00 As at December 2010 Accessed 21212
x = not applicable = not available p = provisional
ISD notes re data issues Outpatient data for the Golden Jubilee National Hospital for the year ending 31st March 2005 is not currently available due to system problems There are long standing unresolved data issues for NHS Lanarkshire NHS Tayside and NHS Forth Valley
Additional notes In addition to the caution from ISD above re data issues for NHS Lanarkshire NHS Tayside and NHS Forth Valley data for other Boards (eg Ayrshire amp Arran) should also be treated with caution
21
311 Secondary care activity data - Hospital admissions
Table 7 shows the total number of Continuous Spells of Treatment (CIS) in hospital
for Rheumatology as a specialty for all Scottish Boards combined It shows a slight
reduction in the overall inpatient activity (all patient types) from 200506 to 200910
with a fall in emergency inpatient admissions but a rise in elective inpatient
admissions (a description of how these terms are defined is provided in the glossary)
However the data do not separate out RA from other rheumatological reasons for
admission and this should be borne in mind when interpreting the data
Table 7 Continuous Spells of Treatment (CIS) in hospital for Rheumatology for
Scotland (all Boards) by financial year
20052006 20062007 20072008 20082009 20092010p
Day Cases 5017 5140 5208 3927 4695
Elective Inpatients 1054 1169 1232 1329 1238
Emergency Inpatients 623 460 429 445 313
Transfers 6 12 13 14 8
All Patient Types 6700 6781 6882 5715 6254
Source ISD SMR01 data Accessed 5312 p = provisional Inpatient activity data for individual NHS
boards is available from the ISD website (wwwisdscotlandorg)
Note the data in the table should be interpreted cautiously due to concerns that it does not accurately
represent the true level of rheumatology activity (see text below)
The data in Table 7 is based on SMR01 data from ISD However during the needs
assessment concern was expressed by some clinicians that the data does not
accurately reflect the true level of rheumatology inpatientday case activity For
example patients admitted with RA related problems may have their admission
coded under general medicine or other acute specialities leading to an
underestimation of the number of in-patient admissions for rheumatology The
number of rheumatology day cases is also thought to be underestimated The data in
22
Table 7 should therefore be interpreted cautiously and consideration should be given
to how future data collection can be improved
312 Impact of RA on employment
One of the important consequences of RA is loss of employment due to increased
pain and disability It is estimated that up to 40 of patients lose their jobs within five
years of being diagnosed with RA three quarters for reasons directly related to their
arthritis8
Table 8 shows the estimated number of people of working age who are newly
diagnosed with RA in Scotland in a particular year (in this example 2009) who will
subsequently leave work prematurely due to RA using work disability incidence data
from a UK study by Barrett et al9 As shown the proportion stopping work varies
during the course of the disease with many stopping work early in the course of their
disease Of those working at the time of diagnosis a third (33) will have stopped
within 5 years due to their condition
Of note the estimates given in Table 8 assume that all adults aged 16-64 years who
are diagnosed with RA in a particular year are working at the time of diagnosis This
will not however be the case since a large proportion of people will not be working at
the time of diagnosis (eg students full time carers the unemployed those who have
retired early etc) This should be borne in mind when interpreting the estimates and
the figures adjusted as required to take account of local data regarding disability
benefit recipients for example In future the impact of the Welfare Reform Act 2012
(which replaces the Disability Living Allowance with a Personal Independence
Payment) may make such adjustments more problematic
ScotPHN is currently collating locally collected data from Fife which will be compared against the data presented in Table 7 to try to estimate the degree to which the data in Table 7 may underestimate the number of rheumatology inpatient admissions amp day cases This analysis was not available at the time of publishing this report but will be available from the ScotPHN office in due course
23
Table 8 Estimated premature stopping of work among those newly diagnosed
with RA in 2009 (for adults aged 16-64 years) by NHS Board area
Year 1
14
Year 2
26
Year 5
33
Year 10
39
Men
NHS Board Area
Ayrshire amp Arran 23 3 6 8 9
Borders 7 1 2 2 3
Dumfries amp Galloway 10 1 3 3 4
Fife 22 3 6 7 9
Forth Valley 18 3 5 6 7
Grampian 35 5 9 12 14
Greater Glasgow amp Clyde 71 10 18 23 28
Highland 21 3 5 7 8
Lanarkshire 34 5 9 11 13
Lothian 49 7 13 16 19
Orkney 1 0 0 0 1
Shetland 2 0 0 0 1
Tayside 24 3 6 8 9
Western Isles 2 0 0 1 1
SCOTLAND 319 45 83 105 124
Women
NHS Board Area
Ayrshire amp Arran 72 10 19 24 28
Borders 22 3 6 7 9
Dumfries amp Galloway 29 4 8 10 11
Fife 69 10 18 23 27
Forth Valley 56 8 15 18 22
Grampian 103 14 27 34 40
Greater Glasgow amp Clyde 228 32 59 75 89
Highland 60 8 16 20 24
Lanarkshire 109 15 28 36 42
Lothian 155 22 40 51 61
Orkney 4 1 1 1 2
Shetland 4 1 1 1 2
Tayside 75 11 20 25 29
Western Isles 5 1 1 2 2
SCOTLAND 990 139 257 327 386
Work disability rates amp number affected byhellip
Number of new
cases of RA
(aged 16-64)
Work disability rates are taken from cohort 1 of the following study Barrett EM Scott DG Wiles NJ Symmons DP The impact of rheumatoid arthritis on employment status in the early years of disease a UK community-based study Rheumatology 2000 39(12)1403-99
24
The number of new cases of RA by Board in 2009 was calculated by applying Arthritis Research UK incidence rates (Appendix 4) to Scottish GRO mid-2009 population estimates
Please note The estimates shown assume a 100 employment rate at the time of diagnosis ndash this is unlikely to be the case however and the estimates given in the table should be adjusted as required to take account of local employment rates
Totals stated may vary slightly from the numbers given within the table due to rounding error
313 Cost effectiveness of treatment for RA
Early recognition of rheumatoid arthritis is a crucial component of good patient care
Without timely assessment both the human and financial cost of rheumatoid arthritis
can be high delays in treatment are associated not only with greater joint damage
and morbidity related to RA but also greater work instability and socioeconomic
cost10 A recent health economic analysis by the National Audit Office (NAO)
suggests that investment in the early diagnosis and treatment of RA results in
medium term savings11
The cost implications of developing the delivery of RA services in Scotland is
discussed further in Part D of the HCNA report
25
4 Summary
There is no robust epidemiological study of RA which directly relates to
Scotland Data from the Norfolk Arthritis Register (NOAR) has therefore been
used in this report to estimate the prevalence and incidence of RA in Scotland
RA is two to four times more common among women than men
RA can develop at any age but tends to have a peak incidence in the 5th and
6th decades (ie in a patientrsquos 40s and 50s)
Over 36000 adults in Scotland have RA
The prevalence of RA increases considerably with age Looking to the future
as the Scottish population ages the number of people with RA will also
increase The number of adults with RA in Scotland is predicted to rise from
37539 in 2010 to 42505 in 2020 (ie a 13 increase over 10 years)
There are over 1800 new cases of RA in Scotland every year Early diagnosis
and treatment can significantly improve outcomes
At any given time 08 of the adult population over 18 years will be in
ongoing management for RA
The number of outpatient attendances (both new patient and total
attendances) for Rheumatology as a specialty (ie for all reasons including
RA) has increased over the last ten years
Nationally there has been a slight reduction in the overall inpatient activity for
Rheumatology as a specialty from 200506 to 200910 with a fall in
emergency inpatient admissions but a rise in elective inpatient admissions
26
This data is not specific to RA however and concerns have been raised as to
whether current routinely collected hospital admission data accurately reflects
rheumatology day case and in-patient activity The data should therefore be
interpreted with caution
Work disability is an important consequence of RA and often occurs early on
in the disease Up to 40 of patients lose their jobs within five years of being
diagnosed with RA three quarters for reasons directly related to their arthritis
Health economic analysis by the National Audit Office suggests that
investment in the early diagnosis and treatment of RA results in medium term
savings (the cost implications of developing the delivery of RA services in
Scotland is discussed further in Part D of the report)
5 Recommendations
The planning of future RA services should take into account the impact that the
ageing of the Scottish population will have on the need for services (with an
ageing population leading to an increase in the prevalence of RA and an
accompanying increase in the need for services)
Consideration should be given to how data collection for rheumatology hospital
admissions (day cases and inpatients) can be improved
27
REFERENCES
(1) Gray R Muirie J Public Health Institute of Scotland - Rheumatoid arthritis in adults Gaining health from effective treatment Public Health Institute of Scotland 2002 Dec httpwwwscotphnnetpdfrheumatoid_reportpdf
(2) Porter D McEntegart A Clinical Audit of Care in Rheumatoid Arthritis (CARA) Glasgow CARA Study Team 2008 httpwwwhealthcareimprovementscotlandorgprevious_resourcesaudit_reportcara_rheumatoid_arthritisaspx
(3) Murphy EA Scottish Society for Rheumatology Scottish National Audit of Early Rheumatoid Arthritis (SNARE) 2012 Personal Communication
(4) National Institute for Health and Clinical Excellence NICE Guideline 79 - Rheumatoid Arthritis - The management of rheumatoid arthritis in adults National Institute for Health and Clinical Excellence 2009 Feb httpwwwniceorguknicemediapdfCG79NICEGuidelinepdf
(5) Symmons D Turner G Webb R Asten P Barrett E Lunt M et al The prevalence of rheumatoid arthritis in the United Kingdom new estimates for a new century Rheumatology 200241(7)793-800 httprheumatologyoxfordjournalsorgcontent417793abstract
(6) Wiles N Symmons D Harrison B Barrett E Barrett JH Scott DGI et al Estimating the incidence of rheumatoid arthritis - Trying to hit a moving target Arthritis Rheum 1999 Jan 742(7)1339-46 httpukpmcacukabstractMED10403260
(7) Determining local service levels for a service for the diagnosis and management of rheumatoid arthritis in adults Benchmarks for a standard population National Institute for Health and Clinical Excellence (NICE) 2010 httpwwwniceorgukusingguidancecommissioningguidesraadultsraservicejsp httpwwwniceorgukusingguidancecommissioningguidesraadultsradetermininglocalservicelevelsjsp
(8) Young A Dixey J Kulinskaya E Cox N Davies P Devlin J et al Which patients stop working because of rheumatoid arthritis Results of five years follow up in 732 patients from the Early RA Study (ERAS) Annals of Rheumatic Diseases 200261(4)335-40 httpardbmjcomcontent614335abstract httpardbmjcomcontent614335fullpdf+html
(9) Barrett EM Scott DG Wiles NJ Symmons DP The impact of rheumatoid arthritis on employment status in the early years of disease a UK community-based study Rheumatology 200039(12)1403-9 httprheumatologyoxfordjournalsorgcontent39121403 httprheumatologyoxfordjournalsorgcontent39121403full
(10) Bykerk V Unmet needs in rheumatoid arthritis Journal of Rheumatology 200936(82)42-6 httpwwwjrheumorgcontentsupplements8242abstract httpwwwjrheumorgcontentsupplements8242full
28
(11) National Audit Office Services for people with rheumatoid arthritis 2009 httpwwwnaoorgukpublications0809services_for_people_with_rheumaspx
29
ABBREVIATIONS USED
ACR American College of Rheumatology
CARA Clinical Audit of Care in Rheumatoid Arthritis
CIS Continuous Inpatient Stay
EULAR European League Against Rheumatism
GP General Practitioner
GRO General Register Office for Scotland
HCNA Health Care Needs Assessment
ISD Information Services Division
NAO National Audit Office
NICE National Institute for Health and Clinical Excellence (previously known as the National Institute for Clinical Excellence)
NHS National Health Service
NOAR Norfolk Arthritis Register
PHIS Public Health Institute for Scotland
PTI Practice Team Information
QOF Quality and Outcomes Framework
RA Rheumatoid Arthritis
ScotPHN Scottish Public Health Network
SMR Scottish Morbidity Record
SNARE Scottish National Audit of Early RA
UK United Kingdom
30
GLOSSARY
Continuous
Inpatient Stay
(CIS)
A continuous inpatient stay is an unbroken period of time that a
patient spends as an inpatient It is calculated using SMR01
data
An SMR01 is generated for patients receiving care in the
GeneralAcute specialties as an inpatient or day case An
SMR01 episode is generated when a patient is discharged
from hospital but also when a patient is transferred between
hospitals significant facilities specialties or to the care of a
different consultant
Probability matching methods are used to link together
individual SMR01 hospital episodes for each patient thereby
creating linked patient histories ndash called a Continuous Spell of
Treatment in hospital Within these patient histories SMR01
episodes are grouped according to whether they form part of a
continuous spell of treatment (whether or not this involves
transfer between hospitals or even Health Boards)
The number of Continuous Spells of Treatment can therefore
be a more useful measure of inpatient activity than the total
number of episodes
Full data definitions are available from the ISD data dictionary
wwwdatadictionaryadminscotnhsuk
Day case This is when a patient makes a planned attendance to a
specialty for clinical care sees a doctor or dentist or nurse (as
the consultantrsquos representative) and requires the use of a bed
31
or trolley in lieu of a bed The patient is not expected to and
does not remain overnight
Full data definitions are available from the ISD data dictionary
wwwdatadictionaryadminscotnhsuk
Incidence The number of new cases of a disease that occur in a defined
population during a specified period of time (expressed as a
rate) eg the number of new cases of RA per 1000 population
per year
Note Incidence measures the number of new cases of a
disease (not the number of existing cases) Itrsquos a useful
measure of the risk of developing the disease and is useful for
example to help plan the services required to manage new
cases It doesnrsquot measure the total burden of the disease within
a population however for which prevalence is a better
measure (see below)
Inpatient This is when a patient occupies an available staffed bed in a
hospital and
EITHER - remains overnight whatever the original
intention OR
at admission is expected to remain overnight but is
discharged earlier
Inpatient admissions can be further broken down into
Emergency admissions (this occurs when for clinical
reasons a patient is admitted at the earliest possible
time after seeing a doctor The patient may or may not
be admitted through Accident amp Emergency)
Elective (planned) admissions (this is when the patient
32
has already been given a date to come to hospital for
some kind of procedure) and
Transfers (where a patient will already have been
admitted to hospital and is either transferred between
specialties or hospital and will be part of the same
continuous inpatient stay)
Full data definitions are available from the ISD data dictionary
wwwdatadictionaryadminscotnhsuk
Need The capacity to benefit from an intervention
Prevalence The total number of cases of a disease in a given population at
a particular point in time eg the number of people with RA per
1000 population at a specific point in time
Note Prevalence is a useful indicator of the lsquoburden of diseasersquo
within a population (particularly for long term conditions such
as RA) as it takes account of the duration of the disease
SMR00 SMR00 is part of the Scottish Morbidity Record (SMR) datasets
collated by ISD and considers Outpatient Attendances
An SMR00 is generated for outpatients receiving care in the
specialties listed when
they attend a consultant or other medical outpatient
clinic or
they meet with a consultant or senior member of hisher
team outwith an outpatient clinic session (including the
patients home)
For joint specialty clinics an SMR00 is completed for each
involved specialty unless there is an agreed main specialty in
33
which case only one SMR00 need be completed
If the patient is a new outpatient then the attendance is a new
outpatient attendance otherwise it is a follow-up (return)
outpatient attendance
Full data definitions are available from the ISD data dictionary
wwwdatadictionaryadminscotnhsuk
SMR01 SMR01 is part of the Scottish Morbidity Record (SMR) datasets
collated by ISD and considers inpatient and day case activity
for GeneralAcute specialties
Full data definitions are available from the ISD data dictionary
wwwdatadictionaryadminscotnhsuk
34
APPENDICES
Appendix 1 The 2010 ACR-EULAR classification criteria for rheumatoid
arthritis
Score
Target population (Who should be tested) Patients who
1 have at least 1 joint with definite clinical synovitis (swelling)
2 with the synovitis not better explained by another diseasedagger
Classification criteria for RA (score-based algorithm add score of categories AndashD
a score of ge610 is needed for classification of a patient as having definite RA) Dagger
A Joint involvement sect
1 large joint para 0
2-10 large joints 1
1-3 small joints (with or without involvement of large joints) 2
4-10 small joints (with or without involvement of large joints) 3
gt10 joints (at least 1 small joint) 5
B Serology (at least 1 test result is needed for classification) daggerdagger
Negative RF and negative ACPA 0
Low-positive RF or low-positive ACPA 2
High-positive RF or high-positive ACPA 3
C Acute-phase reactants (at least 1 test result is needed for classification) DaggerDagger
Normal CRP and normal ESR 0
Abnormal CRP or abnormal ESR 1
D Duration of symptoms sectsect
lt6 weeks 0
ge6 weeks 1
35
The criteria are aimed at classification of newly presenting patients In addition patients with erosive disease typical of rheumatoid arthritis (RA) with a history compatible with prior fulfillment of the 2010 criteria should be classified as having RA Patients with longstanding disease including those whose disease is inactive (with or without treatment) who based on retrospectively available data have previously fulfilled the 2010 criteria should be classified as having RA
dagger Differential diagnoses vary among patients with different presentations but may include conditions such as systemic lupus erythematosus psoriatic arthritis and gout If it is unclear about the relevant differential diagnoses to consider an expert rheumatologist should be consulted
Dagger Although patients with a score of lt610 are not classifiable as having RA their status can be reassessed and the criteria might be fulfilled cumulatively over time
sect Joint involvement refers to any swollen or tender joint on examination which may be confirmed by imaging
evidence of synovitis Distal interphalangeal joints first carpometacarpal joints and first metatarsophalangeal joints are excluded from assessment Categories of joint distribution are classified according to the location and number of involved joints with placement into the highest category possible based on the pattern of joint involvement
para Large joints refers to shoulders elbows hips knees and ankles
Small joints refers to the metacarpophalangeal joints proximal interphalangeal joints second through fifth metatarsophalangeal joints thumb interphalangeal joints and wrists
In this category at least 1 of the involved joints must be a small joint the other joints can include any combination of large and additional small joints as well as other joints not specifically listed elsewhere (eg temporomandibular acromioclavicular sternoclavicular etc)
daggerdagger Negative refers to IU values that are less than or equal to the upper limit of normal (ULN) for the laboratory and assay low-positive refers to IU values that are higher than the ULN but le3 times the ULN for the laboratory and assay high-positive refers to IU values that are gt3 times the ULN for the laboratory and assay Where rheumatoid factor (RF) information is only available as positive or negative a positive result should be scored as low-positive for RF ACPA = anti-citrullinated protein antibody
DaggerDagger Normalabnormal is determined by local laboratory standards CRP = C-reactive protein ESR = erythrocyte sedimentation rate
sectsect Duration of symptoms refers to patient self-report of the duration of signs or symptoms of synovitis (eg pain swelling tenderness) of joints that are clinically involved at the time of assessment regardless of treatment status
Reference
The American College of Rheumatology
httpwwwrheumatologyorgpracticeclinicalclassificationrara_2010asp
36
Appendix 2 Prevalence rates for RA (produced by Arthritis Research UK)
This appendix provides details of the prevalence rates for RA produced by Arthritis
Research UK using data from the Norfolk Arthritis Register (NOAR)
How many existing cases of rheumatoid arthritis are there in the UK
Age Males () UK estimate Females () UK estimate
16ndash44 002 2500 012 15100
45ndash64 058 42900 167 126900
64ndash74 114 27100 256 67800
75+ 218 39100 299 85700
Total adult population 044 106500 116 297600
Source Symmons D Turner G Webb R Asten P Barrett E Lunt M et al The prevalence of rheumatoid
arthritis in the United Kingdom new estimates for a new century Rheumatology 2002 41(7)793ndash800
Males aged 16ndash44 werent included in the survey This figure was calculated by assuming that the
femalemale ratio of rheumatoid arthritis in the 16ndash44 age group is the same as that observed in NOAR for
the incidence of rheumatoid arthritis in the same age group
httpwwwarthritisresearchukorgarthritis-informationdata-and-statisticsrheumatoid-
arthritisaspx Accessed 070212
37
Appendix 3 Projected prevalence of RA among men and women aged 16 years
and over by age and NHS Board area (2010 2015 2020)
2010
Males Females Males Females Males Females Males Females
SCOTLAND 199 1207 3993 12232 2514 6501 3390 7503 37539
Ayrshire amp Arran 13 79 293 921 205 527 267 580 2885
Borders lt5 22 97 292 69 169 91 181 926
Dumfries amp Galloway 5 28 127 387 99 241 133 264 1283
Fife 13 82 283 867 188 477 247 539 2696
Forth Valley 11 68 226 686 144 371 181 390 2076
Grampian 21 123 444 1278 260 637 362 751 3877
Greater Glasgow amp Clyde 49 297 869 2723 501 1384 680 1689 8192
Highland 11 60 269 805 186 449 240 497 2518
Lanarkshire 21 130 427 1340 262 709 328 736 3953
Lothian 35 217 588 1809 343 894 491 1092 5470
Orkney lt5 lt5 18 51 12 30 15 31 162
Shetland lt5 lt5 19 51 12 27 15 31 161
Tayside 14 88 310 956 217 544 317 673 3120
Western Isles lt5 5 23 64 16 40 22 50 220
2015
Males Females Males Females Males Females Males Females
SCOTLAND 196 1164 4056 12682 2902 7257 3958 8113 40328
Ayrshire amp Arran 12 73 288 932 234 593 318 629 3079
Borders lt5 22 99 303 82 198 109 200 1017
Dumfries amp Galloway lt5 26 123 387 114 268 161 292 1375
Fife 13 79 288 895 223 556 294 588 2934
Forth Valley 11 65 231 723 168 417 218 435 2270
Grampian 21 120 456 1322 317 753 431 817 4237
Greater Glasgow amp Clyde 48 282 879 2842 551 1440 745 1740 8527
Highland 11 58 269 823 218 519 290 561 2749
Lanarkshire 21 123 441 1404 294 765 392 829 4268
Lothian 36 218 616 1907 401 1026 567 1174 5945
Orkney lt5 lt5 19 54 15 34 19 36 180
Shetland lt5 lt5 19 53 15 31 19 34 176
Tayside 14 86 306 970 250 613 371 725 3336
Western Isles lt5 lt5 23 66 19 44 25 54 235
2020
Males Females Males Females Males Females Males Females
SCOTLAND 194 1138 4021 12757 3116 7753 4620 8905 42505
Ayrshire amp Arran 12 69 278 914 244 614 375 703 3209
Borders lt5 22 98 310 88 209 131 230 1091
Dumfries amp Galloway lt5 25 117 377 117 273 191 332 1436
Fife 13 77 286 898 234 589 355 664 3117
Forth Valley 11 65 233 742 177 443 259 492 2422
Grampian 21 117 456 1335 358 840 508 910 4546
Greater Glasgow amp Clyde 47 272 860 2826 595 1536 823 1796 8754
Highland 11 57 263 817 232 561 358 641 2940
Lanarkshire 20 119 436 1410 316 815 459 928 4503
Lothian 36 219 637 1986 438 1112 655 1278 6361
Orkney lt5 lt5 18 55 16 35 23 43 195
Shetland lt5 lt5 18 53 17 34 24 41 191
Tayside 14 85 299 967 263 646 431 790 3496
Western Isles lt5 lt5 22 66 20 46 28 59 246
TOTAL
TOTAL
TOTAL
65-74 75+
16-44 45-64 65-74 75+
16-44 45-64 65-74 75+
16-44 45-64
Please note caution is required when interpreting projected data particularly where the number of cases is small Where the number of projected cases is less than 5 this is indicated as lt5 Calculated by applying Arthritis Research UK prevalence rates (Appendix 2) to General Register Office for Scotland mid-2009 Population Estimates
38
httpwwwarthritisresearchorg Accessed 210111 Symmons D Turner G Webb R Asten P Barrett E Lunt M et al The prevalence of rheumatoid arthritis in the United Kingdom new estimates for a new century Rheumatology 2002 41(7) 793-800 Totals stated may vary slightly from the numbers given within the table due to rounding error
39
Appendix 4 Incidence rates for RA (produced by Arthritis Research UK)
This appendix provides details of the incidence rates for RA produced by Arthritis
Research UK using data from the Norfolk Arthritis Register (NOAR)
How many new cases of rheumatoid arthritis are there in the UK per year
Age Males100000 UK estimate Females100000 UK estimate
15ndash24 30 120 155 610
25ndash34 56 220 290 1150
35ndash44 121 560 506 2370
45ndash54 313 1210 919 3640
55ndash64 421 1480 881 3210
65ndash74 666 1590 944 2500
75+ 570 1020 298 850
Source Wiles N Symmons DPM Harrison B Barrett E Barrett JH Scott DGI et al Estimating the incidence
of rheumatoid arthritis ndash Trying to hit a moving target Arthritis Rheum 1999 42(7)1339ndash46
httpwwwarthritisresearchukorgarthritis-informationdata-and-statisticsrheumatoid-
arthritisaspx Accessed 070212
40
Appendix 5 Outpatient and AampE Summary by NHS Board of Treatment Rheumatology ReturnNew Ratio
NHS Board of Treatment Financial Year Ending 31st March
2001 2002 2003 2004 2005 2006 2007 2008 2009 2010p
NHS Scotland 45 46 46 46 45 41 41 38 38 38
Ayrshire amp Arran 32 74 38 33 x x x x x x
Borders 00 00 33 00 32 28 34 27 29 32
Dumfries amp Galloway 38 42 46 43 48 49 49 48 43 39
Fife 44 47 48 43 45 33 38 29 35 35
Forth Valley 34 36 38 28 29 23 20 30 34 36
Golden Jubilee National Hospital x x x x x x x x
Grampian 36 34 37 37 37 36 35 35 30 30
Greater Glasgow amp Clyde 60 64 63 68 61 52 56 47 48 48
Highland 56 52 50 47 47 41 39 42 34 39
Lanarkshire 51 49 44 47 43 49 53 53 53 53
Lothian 25 24 29 29 30 27 22 20 20 23
Orkney Islands 22 16 18 15 35 20 19 20 15 33
Shetland Islands 15 27 24 34 51 53 43 42 40 37
Tayside 48 46 44 40 42 35 35 39 35 30
Western Isles x x x x x x x x x x
Source ISD(S)1 SMR00 As at December 2010 Accessed 21212
x = not applicable = not available p = provisional
ISD(S)1 Data issues Outpatient data for the Golden Jubilee National Hospital for the year ending 31st March 2005 is not currently available due to system problems There are long standing unresolved data issues for NHS Lanarkshire NHS Tayside and NHS Forth Valley
41
Appendix 6 Outpatient and AampE Summary by NHS Board of Treatment Rheumatology DNAs (for New
Appointments)
NHS Board of Treatment Financial Year Ending 31st March
2001 2002 2003 2004 2005 2006 2007 2008 2009 2010p
NHS Scotland 92 94 99 98 93 83 79 93 95 87
Ayrshire amp Arran 56 250 159 71 x x x x x x
Borders 32 43 47 49 33 47 41 25 31 42
Dumfries amp Galloway 43 38 25 32 26 54 51 36 43 51
Fife 99 110 88 80 91 84 97 109 87 85
Forth Valley 84 104 94 83 70 68 58 43 62 54
Golden Jubilee National Hospital x x x x x x x x
Grampian 55 49 54 49 46 34 31 45 61 62
Greater Glasgow amp Clyde 130 128 139 151 138 124 109 121 115 104
Highland 54 60 80 71 72 70 81 91 86 57
Lanarkshire 112 132 137 111 107 81 75 95 108 98
Lothian 53 58 60 80 71 49 66 89 115 99
Orkney Islands 69 56 24 19 100 36 39 00 33 20
Shetland Islands 37 28 57 33 59 47 70 56 69 57
Tayside 83 72 64 59 64 72 65 85 62 63
Western Isles x x x x x x x x x x
Source ISD(S)1 SMR00 As at December 2010 Accessed 21212
x = not applicable = not available p = provisional DNA = Did Not Attend
ISD(S)1 Data issues Outpatient data for the Golden Jubilee National Hospital for the year ending 31st March 2005 is not currently available due to system problems There are long standing unresolved data issues for NHS Lanarkshire NHS Tayside and NHS Forth Valley
42
Appendix 7 SMR00 Data (Outpatient and AampE Summary) for Rheumatology - collated by NHS Board of Treatment
NHS SCOTLAND Financial Year Ending 31st March
Indicator 2001 2002 2003 2004 2005 2006 2007 2008 2009 2010p
New Patients 14463 14721 14988 15237 14896 16583 17361 18930 20410 20834
Total Attendances 79989 82104 84588 85779 82417 84776 88686 91678 97041 99223
ReturnNew Ratio 45 46 46 46 45 41 41 38 38 38
DNAs (for New Appointments) 92 94 99 98 93 83 79 93 95 87
Ayrshire amp Arran Financial Year Ending 31st March
Indicator 2001 2002 2003 2004 2005 2006 2007 2008 2009 2010p
New Patients 37 19 37 26 0 0 0 0 0 0
Total Attendances 156 159 176 113 0 0 0 0 0 0
ReturnNew Ratio 32 74 38 33 x x x x x x
DNAs (for New Appointments) 56 250 159 71 x 0 x x x x
Borders Financial Year Ending 31st March
Indicator 2001 2002 2003 2004 2005 2006 2007 2008 2009 2010p
New Patients 0 0 19 0 269 300 283 313 294 198
Total Attendances 0 0 81 0 1117 1140 1240 1172 1145 823
ReturnNew Ratio 00 00 33 00 32 28 34 27 29 32
DNAs (for New Appointments) 32 43 47 49 33 47 41 25 31 42
Dumfries amp Galloway Financial Year Ending 31st March
Indicator 2001 2002 2003 2004 2005 2006 2007 2008 2009 2010p
New Patients 512 454 434 541 526 552 659 691 695 749
Total Attendances 2475 2352 2412 2888 3049 3234 3903 4032 3706 3668
ReturnNew Ratio 38 42 46 43 48 49 49 48 43 39
DNAs (for New Appointments) 43 38 25 32 26 54 51 36 43 51
43
Fife Financial Year Ending 31st March
Indicator 2001 2002 2003 2004 2005 2006 2007 2008 2009 2010p
New Patients 713 786 865 1311 985 1076 954 1264 1199 1322
Total Attendances 3827 4504 4977 7001 5405 4613 4573 4874 5341 5906
ReturnNew Ratio 44 47 48 43 45 33 38 29 35 35
DNAs (for New Appointments) 99 110 88 80 91 84 97 109 87 85
Forth Valley Financial Year Ending 31st March
Indicator 2001 2002 2003 2004 2005 2006 2007 2008 2009 2010p
New Patients 576 503 485 654 530 604 775 684 767 709
Total Attendances 2515 2335 2345 2502 2083 2020 2356 2768 3379 3258
ReturnNew Ratio 34 36 38 28 29 23 20 30 34 36
DNAs (for New Appointments) 84 104 94 83 70 68 58 43 62 54
Golden Jubilee National Hospital
Financial Year Ending 31st March
Indicator 2001 2002 2003 2004 2005 2006 2007 2008 2009 2010p
New Patients x x x x 0 0 0 0 0
Total Attendances x x x x 0 0 0 0 0
ReturnNew Ratio x x x x x x x x x
DNAs (for New Appointments) x x x x 0 x x x x
Grampian Financial Year Ending 31st March
Indicator 2001 2002 2003 2004 2005 2006 2007 2008 2009 2010p
New Patients 1874 1958 1907 1945 1935 2039 2028 2041 2318 2384
Total Attendances 8671 8690 8919 9097 9129 9389 9138 9097 9234 9519
ReturnNew Ratio 36 34 37 37 37 36 35 35 30 30
DNAs (for New Appointments) 55 49 54 49 46 34 31 45 61 62
44
Greater Glasgow amp Clyde Financial Year Ending 31st March
Indicator 2001 2002 2003 2004 2005 2006 2007 2008 2009 2010p
New Patients 4864 4874 4994 4352 4562 5646 5535 6538 6814 6845
Total Attendances 34081 35868 36576 33896 32525 35090 36377 37471 39257 39687
ReturnNew Ratio 60 64 63 68 61 52 56 47 48 48
DNAs (for New Appointments) 130 128 139 151 138 124 109 121 115 104
Highland Financial Year Ending 31st March
Indicator 2001 2002 2003 2004 2005 2006 2007 2008 2009 2010p
New Patients 262 269 281 311 318 358 547 662 797 759
Total Attendances 1720 1668 1693 1788 1823 1826 2684 3418 3475 3708
ReturnNew Ratio 56 52 50 47 47 41 39 42 34 39
DNAs (for New Appointments) 54 60 80 71 72 70 81 91 86 57
Lanarkshire Financial Year Ending 31st March
Indicator 2001 2002 2003 2004 2005 2006 2007 2008 2009 2010p
New Patients 1655 1508 1711 1689 1822 1728 1728 1728 1728 1728
Total Attendances 10031 8970 9214 9660 9666 10245 10840 10840 10840 10840
ReturnNew Ratio 51 49 44 47 43 49 53 53 53 53
DNAs (for New Appointments) 112 132 137 111 107 81 75 95 108 98
Lothian Financial Year Ending 31st March
Indicator 2001 2002 2003 2004 2005 2006 2007 2008 2009 2010p
New Patients 2738 3056 2814 2751 2465 2798 3178 3518 3684 3792
Total Attendances 9589 10519 10856 10794 9840 10397 10051 10660 11225 12328
ReturnNew Ratio 25 24 29 29 30 27 22 20 20 23
DNAs (for New Appointments) 53 58 60 80 71 49 66 89 115 99
Orkney Islands Financial Year Ending 31st March
Indicator 2001 2002 2003 2004 2005 2006 2007 2008 2009 2010p
New Patients 27 34 41 53 27 53 49 31 58 50
Total Attendances 86 87 113 134 121 158 141 93 146 214
ReturnNew Ratio 22 16 18 15 35 20 19 20 15 33
DNAs (for New Appointments) 69 56 24 19 100 36 39 00 33 20
45
Shetland Islands Financial Year Ending 31st March
Indicator 2001 2002 2003 2004 2005 2006 2007 2008 2009 2010p
New Patients 54 72 151 150 109 93 132 184 241 191
Total Attendances 133 268 516 654 662 587 696 957 1205 902
ReturnNew Ratio 15 27 24 34 51 53 43 42 40 37
DNAs (for New Appointments) 37 28 57 33 59 47 70 56 69 57
Tayside Financial Year Ending 31st March
Indicator 2001 2002 2003 2004 2005 2006 2007 2008 2009 2010p
New Patients 1151 1188 1249 1454 1348 1336 1493 1276 1815 2107
Total Attendances 6705 6684 6710 7252 6997 6077 6687 6296 8088 8370
ReturnNew Ratio 48 46 44 40 42 35 35 39 35 30
DNAs (for New Appointments) 83 72 64 59 64 72 65 85 62 63
Western Isles Financial Year Ending 31st March
Indicator 2001 2002 2003 2004 2005 2006 2007 2008 2009 2010p
New Patients 0 0 0 0 0 0 0 0 0 0
Total Attendances 0 0 0 0 0 0 0 0 0 0
ReturnNew Ratio x x x x x x x x x x
DNAs (for New Appointments) x x x x x 0 x x x x
Source ISD(S)1 SMR00 As at December 2010 Accessed 21212
x = not applicable = not available p = provisional DNA = Did Not Attend
ISD(S)1 Data issues Outpatient data for the Golden Jubilee National Hospital for the year ending 31st March 2005 is not currently available due to system problems There are long standing unresolved data issues for NHS Lanarkshire NHS Tayside and NHS Forth Valley
Information on DNAs (Did Not Attends) is recorded separately from the other figures shown in the table and comparisons between information from the different data sources should be made with caution
DNA rates are based on actual submissions of SMR00 records no estimation is made to account for shortfalls in data submission
46
For further information contact
ScotPHN co NHS Health Scotland Elphinstone House 65 West Regent Street Glasgow G2 2AF
Email nhshealthscotland-scotphnnhsnet
Web wwwscotphnnet
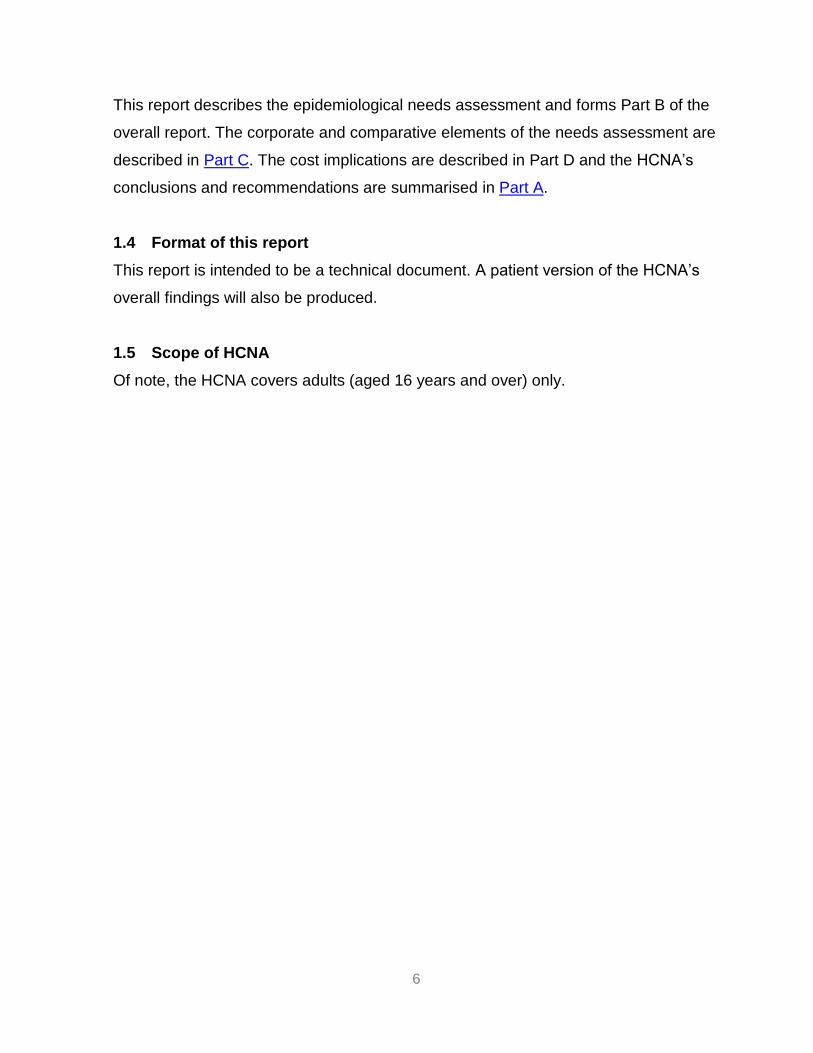
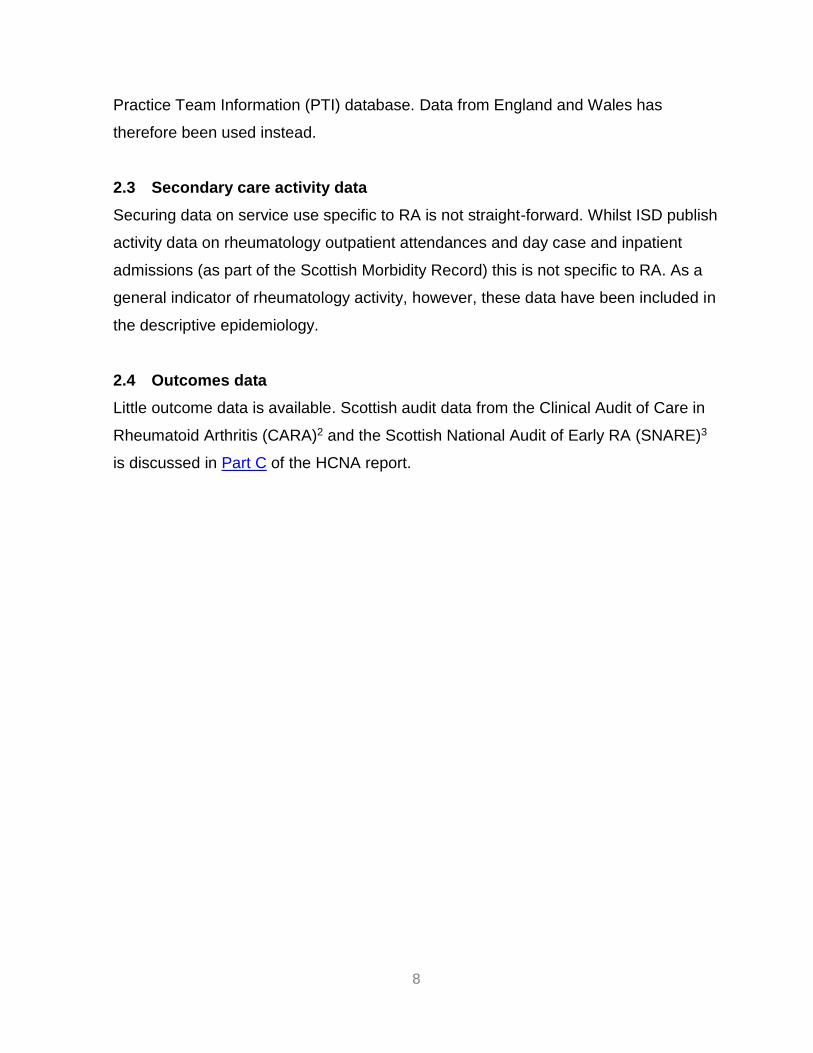
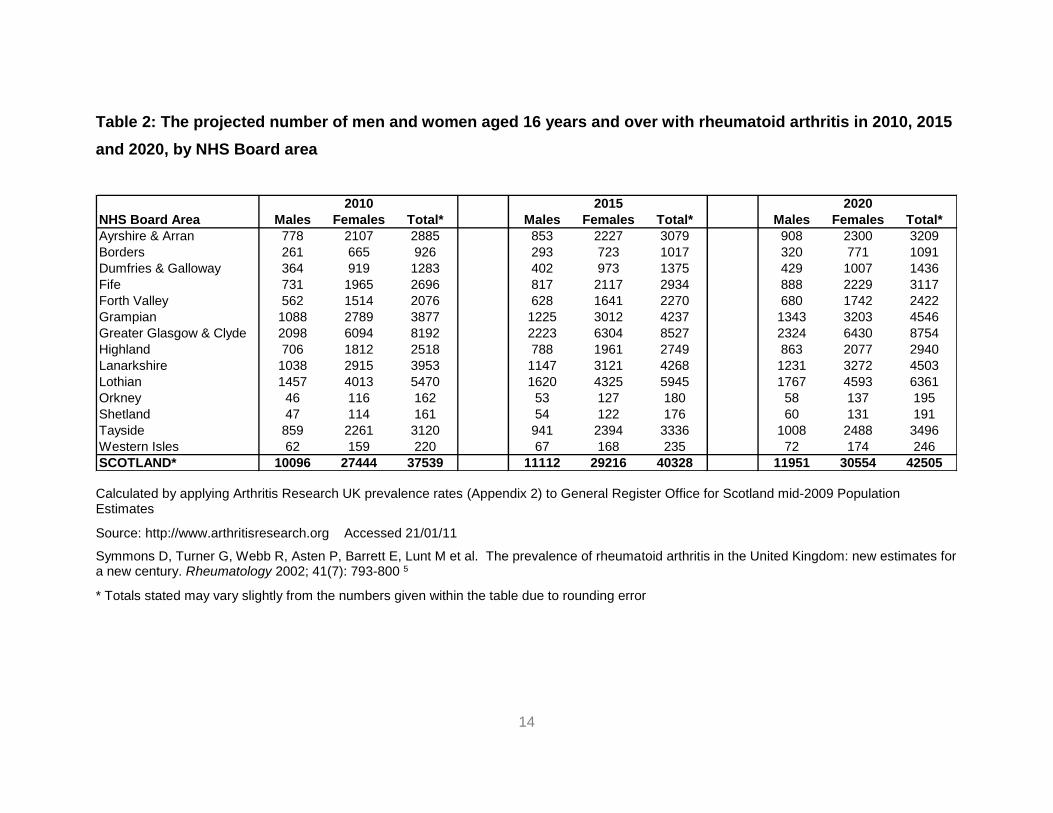
14
Table 2 The projected number of men and women aged 16 years and over with rheumatoid arthritis in 2010 2015
and 2020 by NHS Board area
2010 2015 2020
NHS Board Area Males Females Total Males Females Total Males Females Total
Ayrshire amp Arran 778 2107 2885 853 2227 3079 908 2300 3209
Borders 261 665 926 293 723 1017 320 771 1091
Dumfries amp Galloway 364 919 1283 402 973 1375 429 1007 1436
Fife 731 1965 2696 817 2117 2934 888 2229 3117
Forth Valley 562 1514 2076 628 1641 2270 680 1742 2422
Grampian 1088 2789 3877 1225 3012 4237 1343 3203 4546
Greater Glasgow amp Clyde 2098 6094 8192 2223 6304 8527 2324 6430 8754
Highland 706 1812 2518 788 1961 2749 863 2077 2940
Lanarkshire 1038 2915 3953 1147 3121 4268 1231 3272 4503
Lothian 1457 4013 5470 1620 4325 5945 1767 4593 6361
Orkney 46 116 162 53 127 180 58 137 195
Shetland 47 114 161 54 122 176 60 131 191
Tayside 859 2261 3120 941 2394 3336 1008 2488 3496
Western Isles 62 159 220 67 168 235 72 174 246
SCOTLAND 10096 27444 37539 11112 29216 40328 11951 30554 42505
Calculated by applying Arthritis Research UK prevalence rates (Appendix 2) to General Register Office for Scotland mid-2009 Population Estimates
Source httpwwwarthritisresearchorg Accessed 210111
Symmons D Turner G Webb R Asten P Barrett E Lunt M et al The prevalence of rheumatoid arthritis in the United Kingdom new estimates for a new century Rheumatology 2002 41(7) 793-800 5
Totals stated may vary slightly from the numbers given within the table due to rounding error
15
38 Incidence of RA in Scotland
Again there is little current data on the incidence of rheumatoid arthritis in Scotland
Table 3 shows the estimated annual number of new cases of RA by age sex and
NHS Board in Scotland These estimates have been calculated using incidence rates
developed by Arthritis Research UK using NOAR data (Appendix 4) applied to GRO
population estimates for Scotland for 2009 As with the prevalence estimates these
incidence estimates must be treated with a degree of caution since they are derived
from NOAR data and are likely to be subject to variation based on diagnostic and
presentation biases As such the numbers given may underestimate the true
incidence in any given area Be that as it may they still provide useful information and
show that an estimated 549 men and 1302 women in Scotland develop RA each
year
Of note current incidence rate estimates for RA vary NICE for example estimate
that 15 males and 36 females per 10000 population become affected by RA
annually4 In this report we have used the Arthritis Research UK rates (Appendix 4)
to allow calculation of age-specific estimates for each Board in Table 3 However the
NICE rates have been used in the economic analysis in Part D to ensure consistency
with previous NICE cost calculations
For the purposes of planning incidence rates for RA (including the peak age of onset)
appear to be stable (unlike RA prevalence which is predicted to rise considerably over
the next ten years)
Although the number of new cases of RA may be relatively low compared with other
conditions given the chronic nature of RA and the effectiveness of early treatment
the numbers are important
16
Table 3 Estimated number of new cases of rheumatoid arthritis in males and females in 2009 by age and NHS Board area
NHS Board Area Population 15-44 45-54 55-64 65-74 75+ Total Population 15-44 45-54 55-64 65-74 75+ Total
Ayrshire amp Arran 175871 5 8 10 12 7 42 191289 23 26 23 19 6 97
Borders 54538 1 3 3 4 2 14 58142 7 8 7 6 2 30
Dumfries amp Galloway 71849 2 3 5 6 3 19 76661 8 11 10 9 3 40
Fife 175422 5 8 10 11 6 39 187963 23 25 21 17 5 92
Forth Valley 140770 4 6 8 8 5 31 150613 19 20 17 14 4 73
Grampian 270863 8 13 15 15 9 59 274117 35 37 30 23 7 133
Greater Glasgow amp Clyde 576389 17 26 27 29 18 117 622637 83 84 61 52 17 296
Highland 153070 4 7 9 11 6 37 157460 18 22 20 16 5 82
Lanarkshire 270451 8 12 14 15 8 58 291764 37 40 31 26 7 142
Lothian 399208 13 17 19 20 12 81 427023 60 54 42 33 11 199
Orkney 9829 0 0 1 1 0 2 10131 1 1 1 1 0 5
Shetland 11214 0 1 1 1 0 3 10996 1 2 1 1 0 5
Tayside 192960 5 9 11 12 8 45 206590 24 27 24 20 7 102
Western Isles 12854 0 1 1 1 1 3 13326 1 2 2 1 1 7
SCOTLAND 2515288 72 114 132 145 86 549 2678712 341 359 290 238 74 1302
Age (years)
Women Men
Age (years)
Calculated by applying Arthritis Research UK incidence rates (Appendix 4) to General Register Office for Scotland mid-2009 Population Estimates
Source httpwwwarthritisresearchorg Accessed 21012011
Wiles N Symmons DPM Harrison B Barrett E Barrett JH Scott DGI et al Estimating the incidence of rheumatoid arthritis - Trying to hit a moving target Arthritis Rheum 1999 42(7) 1339-46 6
Totals stated may vary slightly from the numbers given within the table due to rounding error
17
39 Primary care activity data
As discussed in section 22 ISD does not have robust Scottish data on primary care
activity for RA Data from England and Wales has therefore been used instead in this
assessment
In England and Wales NICE has estimated that in a ldquostandardrdquo GP practice of 10000
people (with 8000 being adults over the age of 18 years) there will be 8 people per
year referred for RA assessment (01 of the adult population) of which 2 will be
diagnosed with the condition (0025 of the adult population)4 7 NICE estimate that
at any given time 08 of the adult population over 18 years will be in ongoing
management for RA equating to 60 people per year in the standard practice The
impact of these estimates for NHS Boards in Scotland is shown in Table 4
Table 4 Estimated number of people being assessed for RA diagnosed with RA or in ongoing treatment for RA each year by NHS Board area
NHS Board Area RA
Assessment RA
Diagnosis RA
Ongoing care
Ayrshire amp Arran 294 73 2348
Borders 90 23 720
Dumfries amp Galloway 120 30 961
Fife 289 72 2310
Forth Valley 229 57 1833
Grampian 436 109 3486
Greater Glasgow amp Clyde 959 240 7675
Highland 250 62 1996
Lanarkshire 441 110 3531
Lothian 665 166 5318
Orkney 16 4 128
Shetland 17 4 139
Tayside 321 80 2567
Western Isles 21 5 169
SCOTLAND 4148 1037 33183
Source NICE (2010) Determining local service levels for a service for the diagnosis and management of rheumatoid arthritis in adults Benchmarks for a standard population7 Calculated using General Register Office for Scotland mid 2009 Population Estimates
18
310 Secondary care activity data - Outpatient attendances
Table 5 and Table 6 present ISD SMR00 data on outpatient attendances for
Rheumatology as a specialty Table 5 shows the total number of attendances and
Table 6 shows the number of new patient attendances Of note
Data is shown by NHS Board of treatment (not Board of residence)
The data do not separate out RA from other reasons to attend a Rheumatology
outpatient clinic As a general rule of thumb clinical experience suggests that
RA accounts for up to 75 of a rheumatologistrsquos outpatient workload
The data covers consultant-led clinics only Clinics led by a nurse or allied
health professionals are not included in the data shown and
The quality of the data available is variable and data for some Boards should
be treated with a high degree of caution
As with all activity data care needs to be exercised in its interpretation particularly
when comparing different geographical areas For example in areas with a higher
recorded activity the data may reflect a fully developed rheumatology service
provision or simply a wider catchment area for what service provision exists Equally
in smaller health board areas the relatively low levels of attendance may be a
reflection of smaller populations being served or of a more generalist approach to
care with fewer patients being seen by a specialist in rheumatology rather than a
general physician
The quality of the data for some Boards limits its interpretation However what is
clear from the data is that across Scotland as a whole both the number of new
patients attending Rheumatology outpatient clinics and the total number of
attendances has grown over the ten years of reported activity
Additional data on the returnnew ratio and DNA (did not attend) rates are provided in
Appendix 5 and Appendix 6 respectively A summary of SMR00 data collated by
Board is provided in Appendix 7
19
Table 5 Outpatient and AampE Summary by NHS Board of Treatment Rheumatology Total Attendances
NHS Board of Treatment Financial Year Ending 31st March
2001 2002 2003 2004 2005 2006 2007 2008 2009 2010p
Ayrshire amp Arran 156 159 176 113 0 0 0 0 0 0
Borders 0 0 81 0 1117 1140 1240 1172 1145 823
Dumfries amp Galloway 2475 2352 2412 2888 3049 3234 3903 4032 3706 3668
Fife 3827 4504 4977 7001 5405 4613 4573 4874 5341 5906
Forth Valley 2515 2335 2345 2502 2083 2020 2356 2768 3379 3258
Golden Jubilee National Hospital x x x x 0 0 0 0 0
Grampian 8671 8690 8919 9097 9129 9389 9138 9097 9234 9519
Greater Glasgow amp Clyde 34081 35868 36576 33896 32525 35090 36377 37471 39257 39687
Highland 1720 1668 1693 1788 1823 1826 2684 3418 3475 3708
Lanarkshire 10031 8970 9214 9660 9666 10245 10840 10840 10840 10840
Lothian 9589 10519 10856 10794 9840 10397 10051 10660 11225 12328
Orkney Islands 86 87 113 134 121 158 141 93 146 214
Shetland Islands 133 268 516 654 662 587 696 957 1205 902
Tayside 6705 6684 6710 7252 6997 6077 6687 6296 8088 8370
Western Isles 0 0 0 0 0 0 0 0 0 0
NHS Scotland 79989 82104 84588 85779 82417 84776 88686 91678 97041 99223
Source ISD(S)1 SMR00 As at December 2010 Accessed 21212
x = not applicable = not available p = provisional
ISD notes re data issues Outpatient data for the Golden Jubilee National Hospital for the year ending 31st March 2005 is not currently available due to system problems There are long standing unresolved data issues for NHS Lanarkshire NHS Tayside and NHS Forth Valley Additional notes In addition to the caution from ISD above re data issues for NHS Lanarkshire NHS Tayside and NHS Forth Valley data for other Boards (eg Ayrshire amp Arran) should also be treated with caution
20
Table 6 Outpatient and AampE Summary by NHS Board of Treatment Rheumatology New Patients
NHS Board of Treatment
Financial Year Ending 31st March
2001 2002 2003 2004 2005 2006 2007 2008 2009 2010p
Ayrshire amp Arran 37 19 37 26 0 0 0 0 0 0
Borders 0 0 19 0 269 300 283 313 294 198
Dumfries amp Galloway 512 454 434 541 526 552 659 691 695 749
Fife 713 786 865 1311 985 1076 954 1264 1199 1322
Forth Valley 576 503 485 654 530 604 775 684 767 709
Golden Jubilee National Hospital x x x x 0 0 0 0 0
Grampian 1874 1958 1907 1945 1935 2039 2028 2041 2318 2384
Greater Glasgow amp Clyde 4864 4874 4994 4352 4562 5646 5535 6538 6814 6845
Highland 262 269 281 311 318 358 547 662 797 759
Lanarkshire 1655 1508 1711 1689 1822 1728 1728 1728 1728 1728
Lothian 2738 3056 2814 2751 2465 2798 3178 3518 3684 3792
Orkney Islands 27 34 41 53 27 53 49 31 58 50
Shetland Islands 54 72 151 150 109 93 132 184 241 191
Tayside 1151 1188 1249 1454 1348 1336 1493 1276 1815 2107
Western Isles 0 0 0 0 0 0 0 0 0 0
NHS Scotland 14463 14721 14988 15237 14896 16583 17361 18930 20410 20834
Source ISD(S)1 SMR00 As at December 2010 Accessed 21212
x = not applicable = not available p = provisional
ISD notes re data issues Outpatient data for the Golden Jubilee National Hospital for the year ending 31st March 2005 is not currently available due to system problems There are long standing unresolved data issues for NHS Lanarkshire NHS Tayside and NHS Forth Valley
Additional notes In addition to the caution from ISD above re data issues for NHS Lanarkshire NHS Tayside and NHS Forth Valley data for other Boards (eg Ayrshire amp Arran) should also be treated with caution
21
311 Secondary care activity data - Hospital admissions
Table 7 shows the total number of Continuous Spells of Treatment (CIS) in hospital
for Rheumatology as a specialty for all Scottish Boards combined It shows a slight
reduction in the overall inpatient activity (all patient types) from 200506 to 200910
with a fall in emergency inpatient admissions but a rise in elective inpatient
admissions (a description of how these terms are defined is provided in the glossary)
However the data do not separate out RA from other rheumatological reasons for
admission and this should be borne in mind when interpreting the data
Table 7 Continuous Spells of Treatment (CIS) in hospital for Rheumatology for
Scotland (all Boards) by financial year
20052006 20062007 20072008 20082009 20092010p
Day Cases 5017 5140 5208 3927 4695
Elective Inpatients 1054 1169 1232 1329 1238
Emergency Inpatients 623 460 429 445 313
Transfers 6 12 13 14 8
All Patient Types 6700 6781 6882 5715 6254
Source ISD SMR01 data Accessed 5312 p = provisional Inpatient activity data for individual NHS
boards is available from the ISD website (wwwisdscotlandorg)
Note the data in the table should be interpreted cautiously due to concerns that it does not accurately
represent the true level of rheumatology activity (see text below)
The data in Table 7 is based on SMR01 data from ISD However during the needs
assessment concern was expressed by some clinicians that the data does not
accurately reflect the true level of rheumatology inpatientday case activity For
example patients admitted with RA related problems may have their admission
coded under general medicine or other acute specialities leading to an
underestimation of the number of in-patient admissions for rheumatology The
number of rheumatology day cases is also thought to be underestimated The data in
22
Table 7 should therefore be interpreted cautiously and consideration should be given
to how future data collection can be improved
312 Impact of RA on employment
One of the important consequences of RA is loss of employment due to increased
pain and disability It is estimated that up to 40 of patients lose their jobs within five
years of being diagnosed with RA three quarters for reasons directly related to their
arthritis8
Table 8 shows the estimated number of people of working age who are newly
diagnosed with RA in Scotland in a particular year (in this example 2009) who will
subsequently leave work prematurely due to RA using work disability incidence data
from a UK study by Barrett et al9 As shown the proportion stopping work varies
during the course of the disease with many stopping work early in the course of their
disease Of those working at the time of diagnosis a third (33) will have stopped
within 5 years due to their condition
Of note the estimates given in Table 8 assume that all adults aged 16-64 years who
are diagnosed with RA in a particular year are working at the time of diagnosis This
will not however be the case since a large proportion of people will not be working at
the time of diagnosis (eg students full time carers the unemployed those who have
retired early etc) This should be borne in mind when interpreting the estimates and
the figures adjusted as required to take account of local data regarding disability
benefit recipients for example In future the impact of the Welfare Reform Act 2012
(which replaces the Disability Living Allowance with a Personal Independence
Payment) may make such adjustments more problematic
ScotPHN is currently collating locally collected data from Fife which will be compared against the data presented in Table 7 to try to estimate the degree to which the data in Table 7 may underestimate the number of rheumatology inpatient admissions amp day cases This analysis was not available at the time of publishing this report but will be available from the ScotPHN office in due course
23
Table 8 Estimated premature stopping of work among those newly diagnosed
with RA in 2009 (for adults aged 16-64 years) by NHS Board area
Year 1
14
Year 2
26
Year 5
33
Year 10
39
Men
NHS Board Area
Ayrshire amp Arran 23 3 6 8 9
Borders 7 1 2 2 3
Dumfries amp Galloway 10 1 3 3 4
Fife 22 3 6 7 9
Forth Valley 18 3 5 6 7
Grampian 35 5 9 12 14
Greater Glasgow amp Clyde 71 10 18 23 28
Highland 21 3 5 7 8
Lanarkshire 34 5 9 11 13
Lothian 49 7 13 16 19
Orkney 1 0 0 0 1
Shetland 2 0 0 0 1
Tayside 24 3 6 8 9
Western Isles 2 0 0 1 1
SCOTLAND 319 45 83 105 124
Women
NHS Board Area
Ayrshire amp Arran 72 10 19 24 28
Borders 22 3 6 7 9
Dumfries amp Galloway 29 4 8 10 11
Fife 69 10 18 23 27
Forth Valley 56 8 15 18 22
Grampian 103 14 27 34 40
Greater Glasgow amp Clyde 228 32 59 75 89
Highland 60 8 16 20 24
Lanarkshire 109 15 28 36 42
Lothian 155 22 40 51 61
Orkney 4 1 1 1 2
Shetland 4 1 1 1 2
Tayside 75 11 20 25 29
Western Isles 5 1 1 2 2
SCOTLAND 990 139 257 327 386
Work disability rates amp number affected byhellip
Number of new
cases of RA
(aged 16-64)
Work disability rates are taken from cohort 1 of the following study Barrett EM Scott DG Wiles NJ Symmons DP The impact of rheumatoid arthritis on employment status in the early years of disease a UK community-based study Rheumatology 2000 39(12)1403-99
24
The number of new cases of RA by Board in 2009 was calculated by applying Arthritis Research UK incidence rates (Appendix 4) to Scottish GRO mid-2009 population estimates
Please note The estimates shown assume a 100 employment rate at the time of diagnosis ndash this is unlikely to be the case however and the estimates given in the table should be adjusted as required to take account of local employment rates
Totals stated may vary slightly from the numbers given within the table due to rounding error
313 Cost effectiveness of treatment for RA
Early recognition of rheumatoid arthritis is a crucial component of good patient care
Without timely assessment both the human and financial cost of rheumatoid arthritis
can be high delays in treatment are associated not only with greater joint damage
and morbidity related to RA but also greater work instability and socioeconomic
cost10 A recent health economic analysis by the National Audit Office (NAO)
suggests that investment in the early diagnosis and treatment of RA results in
medium term savings11
The cost implications of developing the delivery of RA services in Scotland is
discussed further in Part D of the HCNA report
25
4 Summary
There is no robust epidemiological study of RA which directly relates to
Scotland Data from the Norfolk Arthritis Register (NOAR) has therefore been
used in this report to estimate the prevalence and incidence of RA in Scotland
RA is two to four times more common among women than men
RA can develop at any age but tends to have a peak incidence in the 5th and
6th decades (ie in a patientrsquos 40s and 50s)
Over 36000 adults in Scotland have RA
The prevalence of RA increases considerably with age Looking to the future
as the Scottish population ages the number of people with RA will also
increase The number of adults with RA in Scotland is predicted to rise from
37539 in 2010 to 42505 in 2020 (ie a 13 increase over 10 years)
There are over 1800 new cases of RA in Scotland every year Early diagnosis
and treatment can significantly improve outcomes
At any given time 08 of the adult population over 18 years will be in
ongoing management for RA
The number of outpatient attendances (both new patient and total
attendances) for Rheumatology as a specialty (ie for all reasons including
RA) has increased over the last ten years
Nationally there has been a slight reduction in the overall inpatient activity for
Rheumatology as a specialty from 200506 to 200910 with a fall in
emergency inpatient admissions but a rise in elective inpatient admissions
26
This data is not specific to RA however and concerns have been raised as to
whether current routinely collected hospital admission data accurately reflects
rheumatology day case and in-patient activity The data should therefore be
interpreted with caution
Work disability is an important consequence of RA and often occurs early on
in the disease Up to 40 of patients lose their jobs within five years of being
diagnosed with RA three quarters for reasons directly related to their arthritis
Health economic analysis by the National Audit Office suggests that
investment in the early diagnosis and treatment of RA results in medium term
savings (the cost implications of developing the delivery of RA services in
Scotland is discussed further in Part D of the report)
5 Recommendations
The planning of future RA services should take into account the impact that the
ageing of the Scottish population will have on the need for services (with an
ageing population leading to an increase in the prevalence of RA and an
accompanying increase in the need for services)
Consideration should be given to how data collection for rheumatology hospital
admissions (day cases and inpatients) can be improved
27
REFERENCES
(1) Gray R Muirie J Public Health Institute of Scotland - Rheumatoid arthritis in adults Gaining health from effective treatment Public Health Institute of Scotland 2002 Dec httpwwwscotphnnetpdfrheumatoid_reportpdf
(2) Porter D McEntegart A Clinical Audit of Care in Rheumatoid Arthritis (CARA) Glasgow CARA Study Team 2008 httpwwwhealthcareimprovementscotlandorgprevious_resourcesaudit_reportcara_rheumatoid_arthritisaspx
(3) Murphy EA Scottish Society for Rheumatology Scottish National Audit of Early Rheumatoid Arthritis (SNARE) 2012 Personal Communication
(4) National Institute for Health and Clinical Excellence NICE Guideline 79 - Rheumatoid Arthritis - The management of rheumatoid arthritis in adults National Institute for Health and Clinical Excellence 2009 Feb httpwwwniceorguknicemediapdfCG79NICEGuidelinepdf
(5) Symmons D Turner G Webb R Asten P Barrett E Lunt M et al The prevalence of rheumatoid arthritis in the United Kingdom new estimates for a new century Rheumatology 200241(7)793-800 httprheumatologyoxfordjournalsorgcontent417793abstract
(6) Wiles N Symmons D Harrison B Barrett E Barrett JH Scott DGI et al Estimating the incidence of rheumatoid arthritis - Trying to hit a moving target Arthritis Rheum 1999 Jan 742(7)1339-46 httpukpmcacukabstractMED10403260
(7) Determining local service levels for a service for the diagnosis and management of rheumatoid arthritis in adults Benchmarks for a standard population National Institute for Health and Clinical Excellence (NICE) 2010 httpwwwniceorgukusingguidancecommissioningguidesraadultsraservicejsp httpwwwniceorgukusingguidancecommissioningguidesraadultsradetermininglocalservicelevelsjsp
(8) Young A Dixey J Kulinskaya E Cox N Davies P Devlin J et al Which patients stop working because of rheumatoid arthritis Results of five years follow up in 732 patients from the Early RA Study (ERAS) Annals of Rheumatic Diseases 200261(4)335-40 httpardbmjcomcontent614335abstract httpardbmjcomcontent614335fullpdf+html
(9) Barrett EM Scott DG Wiles NJ Symmons DP The impact of rheumatoid arthritis on employment status in the early years of disease a UK community-based study Rheumatology 200039(12)1403-9 httprheumatologyoxfordjournalsorgcontent39121403 httprheumatologyoxfordjournalsorgcontent39121403full
(10) Bykerk V Unmet needs in rheumatoid arthritis Journal of Rheumatology 200936(82)42-6 httpwwwjrheumorgcontentsupplements8242abstract httpwwwjrheumorgcontentsupplements8242full
28
(11) National Audit Office Services for people with rheumatoid arthritis 2009 httpwwwnaoorgukpublications0809services_for_people_with_rheumaspx
29
ABBREVIATIONS USED
ACR American College of Rheumatology
CARA Clinical Audit of Care in Rheumatoid Arthritis
CIS Continuous Inpatient Stay
EULAR European League Against Rheumatism
GP General Practitioner
GRO General Register Office for Scotland
HCNA Health Care Needs Assessment
ISD Information Services Division
NAO National Audit Office
NICE National Institute for Health and Clinical Excellence (previously known as the National Institute for Clinical Excellence)
NHS National Health Service
NOAR Norfolk Arthritis Register
PHIS Public Health Institute for Scotland
PTI Practice Team Information
QOF Quality and Outcomes Framework
RA Rheumatoid Arthritis
ScotPHN Scottish Public Health Network
SMR Scottish Morbidity Record
SNARE Scottish National Audit of Early RA
UK United Kingdom
30
GLOSSARY
Continuous
Inpatient Stay
(CIS)
A continuous inpatient stay is an unbroken period of time that a
patient spends as an inpatient It is calculated using SMR01
data
An SMR01 is generated for patients receiving care in the
GeneralAcute specialties as an inpatient or day case An
SMR01 episode is generated when a patient is discharged
from hospital but also when a patient is transferred between
hospitals significant facilities specialties or to the care of a
different consultant
Probability matching methods are used to link together
individual SMR01 hospital episodes for each patient thereby
creating linked patient histories ndash called a Continuous Spell of
Treatment in hospital Within these patient histories SMR01
episodes are grouped according to whether they form part of a
continuous spell of treatment (whether or not this involves
transfer between hospitals or even Health Boards)
The number of Continuous Spells of Treatment can therefore
be a more useful measure of inpatient activity than the total
number of episodes
Full data definitions are available from the ISD data dictionary
wwwdatadictionaryadminscotnhsuk
Day case This is when a patient makes a planned attendance to a
specialty for clinical care sees a doctor or dentist or nurse (as
the consultantrsquos representative) and requires the use of a bed
31
or trolley in lieu of a bed The patient is not expected to and
does not remain overnight
Full data definitions are available from the ISD data dictionary
wwwdatadictionaryadminscotnhsuk
Incidence The number of new cases of a disease that occur in a defined
population during a specified period of time (expressed as a
rate) eg the number of new cases of RA per 1000 population
per year
Note Incidence measures the number of new cases of a
disease (not the number of existing cases) Itrsquos a useful
measure of the risk of developing the disease and is useful for
example to help plan the services required to manage new
cases It doesnrsquot measure the total burden of the disease within
a population however for which prevalence is a better
measure (see below)
Inpatient This is when a patient occupies an available staffed bed in a
hospital and
EITHER - remains overnight whatever the original
intention OR
at admission is expected to remain overnight but is
discharged earlier
Inpatient admissions can be further broken down into
Emergency admissions (this occurs when for clinical
reasons a patient is admitted at the earliest possible
time after seeing a doctor The patient may or may not
be admitted through Accident amp Emergency)
Elective (planned) admissions (this is when the patient
32
has already been given a date to come to hospital for
some kind of procedure) and
Transfers (where a patient will already have been
admitted to hospital and is either transferred between
specialties or hospital and will be part of the same
continuous inpatient stay)
Full data definitions are available from the ISD data dictionary
wwwdatadictionaryadminscotnhsuk
Need The capacity to benefit from an intervention
Prevalence The total number of cases of a disease in a given population at
a particular point in time eg the number of people with RA per
1000 population at a specific point in time
Note Prevalence is a useful indicator of the lsquoburden of diseasersquo
within a population (particularly for long term conditions such
as RA) as it takes account of the duration of the disease
SMR00 SMR00 is part of the Scottish Morbidity Record (SMR) datasets
collated by ISD and considers Outpatient Attendances
An SMR00 is generated for outpatients receiving care in the
specialties listed when
they attend a consultant or other medical outpatient
clinic or
they meet with a consultant or senior member of hisher
team outwith an outpatient clinic session (including the
patients home)
For joint specialty clinics an SMR00 is completed for each
involved specialty unless there is an agreed main specialty in
33
which case only one SMR00 need be completed
If the patient is a new outpatient then the attendance is a new
outpatient attendance otherwise it is a follow-up (return)
outpatient attendance
Full data definitions are available from the ISD data dictionary
wwwdatadictionaryadminscotnhsuk
SMR01 SMR01 is part of the Scottish Morbidity Record (SMR) datasets
collated by ISD and considers inpatient and day case activity
for GeneralAcute specialties
Full data definitions are available from the ISD data dictionary
wwwdatadictionaryadminscotnhsuk
34
APPENDICES
Appendix 1 The 2010 ACR-EULAR classification criteria for rheumatoid
arthritis
Score
Target population (Who should be tested) Patients who
1 have at least 1 joint with definite clinical synovitis (swelling)
2 with the synovitis not better explained by another diseasedagger
Classification criteria for RA (score-based algorithm add score of categories AndashD
a score of ge610 is needed for classification of a patient as having definite RA) Dagger
A Joint involvement sect
1 large joint para 0
2-10 large joints 1
1-3 small joints (with or without involvement of large joints) 2
4-10 small joints (with or without involvement of large joints) 3
gt10 joints (at least 1 small joint) 5
B Serology (at least 1 test result is needed for classification) daggerdagger
Negative RF and negative ACPA 0
Low-positive RF or low-positive ACPA 2
High-positive RF or high-positive ACPA 3
C Acute-phase reactants (at least 1 test result is needed for classification) DaggerDagger
Normal CRP and normal ESR 0
Abnormal CRP or abnormal ESR 1
D Duration of symptoms sectsect
lt6 weeks 0
ge6 weeks 1
35
The criteria are aimed at classification of newly presenting patients In addition patients with erosive disease typical of rheumatoid arthritis (RA) with a history compatible with prior fulfillment of the 2010 criteria should be classified as having RA Patients with longstanding disease including those whose disease is inactive (with or without treatment) who based on retrospectively available data have previously fulfilled the 2010 criteria should be classified as having RA
dagger Differential diagnoses vary among patients with different presentations but may include conditions such as systemic lupus erythematosus psoriatic arthritis and gout If it is unclear about the relevant differential diagnoses to consider an expert rheumatologist should be consulted
Dagger Although patients with a score of lt610 are not classifiable as having RA their status can be reassessed and the criteria might be fulfilled cumulatively over time
sect Joint involvement refers to any swollen or tender joint on examination which may be confirmed by imaging
evidence of synovitis Distal interphalangeal joints first carpometacarpal joints and first metatarsophalangeal joints are excluded from assessment Categories of joint distribution are classified according to the location and number of involved joints with placement into the highest category possible based on the pattern of joint involvement
para Large joints refers to shoulders elbows hips knees and ankles
Small joints refers to the metacarpophalangeal joints proximal interphalangeal joints second through fifth metatarsophalangeal joints thumb interphalangeal joints and wrists
In this category at least 1 of the involved joints must be a small joint the other joints can include any combination of large and additional small joints as well as other joints not specifically listed elsewhere (eg temporomandibular acromioclavicular sternoclavicular etc)
daggerdagger Negative refers to IU values that are less than or equal to the upper limit of normal (ULN) for the laboratory and assay low-positive refers to IU values that are higher than the ULN but le3 times the ULN for the laboratory and assay high-positive refers to IU values that are gt3 times the ULN for the laboratory and assay Where rheumatoid factor (RF) information is only available as positive or negative a positive result should be scored as low-positive for RF ACPA = anti-citrullinated protein antibody
DaggerDagger Normalabnormal is determined by local laboratory standards CRP = C-reactive protein ESR = erythrocyte sedimentation rate
sectsect Duration of symptoms refers to patient self-report of the duration of signs or symptoms of synovitis (eg pain swelling tenderness) of joints that are clinically involved at the time of assessment regardless of treatment status
Reference
The American College of Rheumatology
httpwwwrheumatologyorgpracticeclinicalclassificationrara_2010asp
36
Appendix 2 Prevalence rates for RA (produced by Arthritis Research UK)
This appendix provides details of the prevalence rates for RA produced by Arthritis
Research UK using data from the Norfolk Arthritis Register (NOAR)
How many existing cases of rheumatoid arthritis are there in the UK
Age Males () UK estimate Females () UK estimate
16ndash44 002 2500 012 15100
45ndash64 058 42900 167 126900
64ndash74 114 27100 256 67800
75+ 218 39100 299 85700
Total adult population 044 106500 116 297600
Source Symmons D Turner G Webb R Asten P Barrett E Lunt M et al The prevalence of rheumatoid
arthritis in the United Kingdom new estimates for a new century Rheumatology 2002 41(7)793ndash800
Males aged 16ndash44 werent included in the survey This figure was calculated by assuming that the
femalemale ratio of rheumatoid arthritis in the 16ndash44 age group is the same as that observed in NOAR for
the incidence of rheumatoid arthritis in the same age group
httpwwwarthritisresearchukorgarthritis-informationdata-and-statisticsrheumatoid-
arthritisaspx Accessed 070212
37
Appendix 3 Projected prevalence of RA among men and women aged 16 years
and over by age and NHS Board area (2010 2015 2020)
2010
Males Females Males Females Males Females Males Females
SCOTLAND 199 1207 3993 12232 2514 6501 3390 7503 37539
Ayrshire amp Arran 13 79 293 921 205 527 267 580 2885
Borders lt5 22 97 292 69 169 91 181 926
Dumfries amp Galloway 5 28 127 387 99 241 133 264 1283
Fife 13 82 283 867 188 477 247 539 2696
Forth Valley 11 68 226 686 144 371 181 390 2076
Grampian 21 123 444 1278 260 637 362 751 3877
Greater Glasgow amp Clyde 49 297 869 2723 501 1384 680 1689 8192
Highland 11 60 269 805 186 449 240 497 2518
Lanarkshire 21 130 427 1340 262 709 328 736 3953
Lothian 35 217 588 1809 343 894 491 1092 5470
Orkney lt5 lt5 18 51 12 30 15 31 162
Shetland lt5 lt5 19 51 12 27 15 31 161
Tayside 14 88 310 956 217 544 317 673 3120
Western Isles lt5 5 23 64 16 40 22 50 220
2015
Males Females Males Females Males Females Males Females
SCOTLAND 196 1164 4056 12682 2902 7257 3958 8113 40328
Ayrshire amp Arran 12 73 288 932 234 593 318 629 3079
Borders lt5 22 99 303 82 198 109 200 1017
Dumfries amp Galloway lt5 26 123 387 114 268 161 292 1375
Fife 13 79 288 895 223 556 294 588 2934
Forth Valley 11 65 231 723 168 417 218 435 2270
Grampian 21 120 456 1322 317 753 431 817 4237
Greater Glasgow amp Clyde 48 282 879 2842 551 1440 745 1740 8527
Highland 11 58 269 823 218 519 290 561 2749
Lanarkshire 21 123 441 1404 294 765 392 829 4268
Lothian 36 218 616 1907 401 1026 567 1174 5945
Orkney lt5 lt5 19 54 15 34 19 36 180
Shetland lt5 lt5 19 53 15 31 19 34 176
Tayside 14 86 306 970 250 613 371 725 3336
Western Isles lt5 lt5 23 66 19 44 25 54 235
2020
Males Females Males Females Males Females Males Females
SCOTLAND 194 1138 4021 12757 3116 7753 4620 8905 42505
Ayrshire amp Arran 12 69 278 914 244 614 375 703 3209
Borders lt5 22 98 310 88 209 131 230 1091
Dumfries amp Galloway lt5 25 117 377 117 273 191 332 1436
Fife 13 77 286 898 234 589 355 664 3117
Forth Valley 11 65 233 742 177 443 259 492 2422
Grampian 21 117 456 1335 358 840 508 910 4546
Greater Glasgow amp Clyde 47 272 860 2826 595 1536 823 1796 8754
Highland 11 57 263 817 232 561 358 641 2940
Lanarkshire 20 119 436 1410 316 815 459 928 4503
Lothian 36 219 637 1986 438 1112 655 1278 6361
Orkney lt5 lt5 18 55 16 35 23 43 195
Shetland lt5 lt5 18 53 17 34 24 41 191
Tayside 14 85 299 967 263 646 431 790 3496
Western Isles lt5 lt5 22 66 20 46 28 59 246
TOTAL
TOTAL
TOTAL
65-74 75+
16-44 45-64 65-74 75+
16-44 45-64 65-74 75+
16-44 45-64
Please note caution is required when interpreting projected data particularly where the number of cases is small Where the number of projected cases is less than 5 this is indicated as lt5 Calculated by applying Arthritis Research UK prevalence rates (Appendix 2) to General Register Office for Scotland mid-2009 Population Estimates
38
httpwwwarthritisresearchorg Accessed 210111 Symmons D Turner G Webb R Asten P Barrett E Lunt M et al The prevalence of rheumatoid arthritis in the United Kingdom new estimates for a new century Rheumatology 2002 41(7) 793-800 Totals stated may vary slightly from the numbers given within the table due to rounding error
39
Appendix 4 Incidence rates for RA (produced by Arthritis Research UK)
This appendix provides details of the incidence rates for RA produced by Arthritis
Research UK using data from the Norfolk Arthritis Register (NOAR)
How many new cases of rheumatoid arthritis are there in the UK per year
Age Males100000 UK estimate Females100000 UK estimate
15ndash24 30 120 155 610
25ndash34 56 220 290 1150
35ndash44 121 560 506 2370
45ndash54 313 1210 919 3640
55ndash64 421 1480 881 3210
65ndash74 666 1590 944 2500
75+ 570 1020 298 850
Source Wiles N Symmons DPM Harrison B Barrett E Barrett JH Scott DGI et al Estimating the incidence
of rheumatoid arthritis ndash Trying to hit a moving target Arthritis Rheum 1999 42(7)1339ndash46
httpwwwarthritisresearchukorgarthritis-informationdata-and-statisticsrheumatoid-
arthritisaspx Accessed 070212
40
Appendix 5 Outpatient and AampE Summary by NHS Board of Treatment Rheumatology ReturnNew Ratio
NHS Board of Treatment Financial Year Ending 31st March
2001 2002 2003 2004 2005 2006 2007 2008 2009 2010p
NHS Scotland 45 46 46 46 45 41 41 38 38 38
Ayrshire amp Arran 32 74 38 33 x x x x x x
Borders 00 00 33 00 32 28 34 27 29 32
Dumfries amp Galloway 38 42 46 43 48 49 49 48 43 39
Fife 44 47 48 43 45 33 38 29 35 35
Forth Valley 34 36 38 28 29 23 20 30 34 36
Golden Jubilee National Hospital x x x x x x x x
Grampian 36 34 37 37 37 36 35 35 30 30
Greater Glasgow amp Clyde 60 64 63 68 61 52 56 47 48 48
Highland 56 52 50 47 47 41 39 42 34 39
Lanarkshire 51 49 44 47 43 49 53 53 53 53
Lothian 25 24 29 29 30 27 22 20 20 23
Orkney Islands 22 16 18 15 35 20 19 20 15 33
Shetland Islands 15 27 24 34 51 53 43 42 40 37
Tayside 48 46 44 40 42 35 35 39 35 30
Western Isles x x x x x x x x x x
Source ISD(S)1 SMR00 As at December 2010 Accessed 21212
x = not applicable = not available p = provisional
ISD(S)1 Data issues Outpatient data for the Golden Jubilee National Hospital for the year ending 31st March 2005 is not currently available due to system problems There are long standing unresolved data issues for NHS Lanarkshire NHS Tayside and NHS Forth Valley
41
Appendix 6 Outpatient and AampE Summary by NHS Board of Treatment Rheumatology DNAs (for New
Appointments)
NHS Board of Treatment Financial Year Ending 31st March
2001 2002 2003 2004 2005 2006 2007 2008 2009 2010p
NHS Scotland 92 94 99 98 93 83 79 93 95 87
Ayrshire amp Arran 56 250 159 71 x x x x x x
Borders 32 43 47 49 33 47 41 25 31 42
Dumfries amp Galloway 43 38 25 32 26 54 51 36 43 51
Fife 99 110 88 80 91 84 97 109 87 85
Forth Valley 84 104 94 83 70 68 58 43 62 54
Golden Jubilee National Hospital x x x x x x x x
Grampian 55 49 54 49 46 34 31 45 61 62
Greater Glasgow amp Clyde 130 128 139 151 138 124 109 121 115 104
Highland 54 60 80 71 72 70 81 91 86 57
Lanarkshire 112 132 137 111 107 81 75 95 108 98
Lothian 53 58 60 80 71 49 66 89 115 99
Orkney Islands 69 56 24 19 100 36 39 00 33 20
Shetland Islands 37 28 57 33 59 47 70 56 69 57
Tayside 83 72 64 59 64 72 65 85 62 63
Western Isles x x x x x x x x x x
Source ISD(S)1 SMR00 As at December 2010 Accessed 21212
x = not applicable = not available p = provisional DNA = Did Not Attend
ISD(S)1 Data issues Outpatient data for the Golden Jubilee National Hospital for the year ending 31st March 2005 is not currently available due to system problems There are long standing unresolved data issues for NHS Lanarkshire NHS Tayside and NHS Forth Valley
42
Appendix 7 SMR00 Data (Outpatient and AampE Summary) for Rheumatology - collated by NHS Board of Treatment
NHS SCOTLAND Financial Year Ending 31st March
Indicator 2001 2002 2003 2004 2005 2006 2007 2008 2009 2010p
New Patients 14463 14721 14988 15237 14896 16583 17361 18930 20410 20834
Total Attendances 79989 82104 84588 85779 82417 84776 88686 91678 97041 99223
ReturnNew Ratio 45 46 46 46 45 41 41 38 38 38
DNAs (for New Appointments) 92 94 99 98 93 83 79 93 95 87
Ayrshire amp Arran Financial Year Ending 31st March
Indicator 2001 2002 2003 2004 2005 2006 2007 2008 2009 2010p
New Patients 37 19 37 26 0 0 0 0 0 0
Total Attendances 156 159 176 113 0 0 0 0 0 0
ReturnNew Ratio 32 74 38 33 x x x x x x
DNAs (for New Appointments) 56 250 159 71 x 0 x x x x
Borders Financial Year Ending 31st March
Indicator 2001 2002 2003 2004 2005 2006 2007 2008 2009 2010p
New Patients 0 0 19 0 269 300 283 313 294 198
Total Attendances 0 0 81 0 1117 1140 1240 1172 1145 823
ReturnNew Ratio 00 00 33 00 32 28 34 27 29 32
DNAs (for New Appointments) 32 43 47 49 33 47 41 25 31 42
Dumfries amp Galloway Financial Year Ending 31st March
Indicator 2001 2002 2003 2004 2005 2006 2007 2008 2009 2010p
New Patients 512 454 434 541 526 552 659 691 695 749
Total Attendances 2475 2352 2412 2888 3049 3234 3903 4032 3706 3668
ReturnNew Ratio 38 42 46 43 48 49 49 48 43 39
DNAs (for New Appointments) 43 38 25 32 26 54 51 36 43 51
43
Fife Financial Year Ending 31st March
Indicator 2001 2002 2003 2004 2005 2006 2007 2008 2009 2010p
New Patients 713 786 865 1311 985 1076 954 1264 1199 1322
Total Attendances 3827 4504 4977 7001 5405 4613 4573 4874 5341 5906
ReturnNew Ratio 44 47 48 43 45 33 38 29 35 35
DNAs (for New Appointments) 99 110 88 80 91 84 97 109 87 85
Forth Valley Financial Year Ending 31st March
Indicator 2001 2002 2003 2004 2005 2006 2007 2008 2009 2010p
New Patients 576 503 485 654 530 604 775 684 767 709
Total Attendances 2515 2335 2345 2502 2083 2020 2356 2768 3379 3258
ReturnNew Ratio 34 36 38 28 29 23 20 30 34 36
DNAs (for New Appointments) 84 104 94 83 70 68 58 43 62 54
Golden Jubilee National Hospital
Financial Year Ending 31st March
Indicator 2001 2002 2003 2004 2005 2006 2007 2008 2009 2010p
New Patients x x x x 0 0 0 0 0
Total Attendances x x x x 0 0 0 0 0
ReturnNew Ratio x x x x x x x x x
DNAs (for New Appointments) x x x x 0 x x x x
Grampian Financial Year Ending 31st March
Indicator 2001 2002 2003 2004 2005 2006 2007 2008 2009 2010p
New Patients 1874 1958 1907 1945 1935 2039 2028 2041 2318 2384
Total Attendances 8671 8690 8919 9097 9129 9389 9138 9097 9234 9519
ReturnNew Ratio 36 34 37 37 37 36 35 35 30 30
DNAs (for New Appointments) 55 49 54 49 46 34 31 45 61 62
44
Greater Glasgow amp Clyde Financial Year Ending 31st March
Indicator 2001 2002 2003 2004 2005 2006 2007 2008 2009 2010p
New Patients 4864 4874 4994 4352 4562 5646 5535 6538 6814 6845
Total Attendances 34081 35868 36576 33896 32525 35090 36377 37471 39257 39687
ReturnNew Ratio 60 64 63 68 61 52 56 47 48 48
DNAs (for New Appointments) 130 128 139 151 138 124 109 121 115 104
Highland Financial Year Ending 31st March
Indicator 2001 2002 2003 2004 2005 2006 2007 2008 2009 2010p
New Patients 262 269 281 311 318 358 547 662 797 759
Total Attendances 1720 1668 1693 1788 1823 1826 2684 3418 3475 3708
ReturnNew Ratio 56 52 50 47 47 41 39 42 34 39
DNAs (for New Appointments) 54 60 80 71 72 70 81 91 86 57
Lanarkshire Financial Year Ending 31st March
Indicator 2001 2002 2003 2004 2005 2006 2007 2008 2009 2010p
New Patients 1655 1508 1711 1689 1822 1728 1728 1728 1728 1728
Total Attendances 10031 8970 9214 9660 9666 10245 10840 10840 10840 10840
ReturnNew Ratio 51 49 44 47 43 49 53 53 53 53
DNAs (for New Appointments) 112 132 137 111 107 81 75 95 108 98
Lothian Financial Year Ending 31st March
Indicator 2001 2002 2003 2004 2005 2006 2007 2008 2009 2010p
New Patients 2738 3056 2814 2751 2465 2798 3178 3518 3684 3792
Total Attendances 9589 10519 10856 10794 9840 10397 10051 10660 11225 12328
ReturnNew Ratio 25 24 29 29 30 27 22 20 20 23
DNAs (for New Appointments) 53 58 60 80 71 49 66 89 115 99
Orkney Islands Financial Year Ending 31st March
Indicator 2001 2002 2003 2004 2005 2006 2007 2008 2009 2010p
New Patients 27 34 41 53 27 53 49 31 58 50
Total Attendances 86 87 113 134 121 158 141 93 146 214
ReturnNew Ratio 22 16 18 15 35 20 19 20 15 33
DNAs (for New Appointments) 69 56 24 19 100 36 39 00 33 20
45
Shetland Islands Financial Year Ending 31st March
Indicator 2001 2002 2003 2004 2005 2006 2007 2008 2009 2010p
New Patients 54 72 151 150 109 93 132 184 241 191
Total Attendances 133 268 516 654 662 587 696 957 1205 902
ReturnNew Ratio 15 27 24 34 51 53 43 42 40 37
DNAs (for New Appointments) 37 28 57 33 59 47 70 56 69 57
Tayside Financial Year Ending 31st March
Indicator 2001 2002 2003 2004 2005 2006 2007 2008 2009 2010p
New Patients 1151 1188 1249 1454 1348 1336 1493 1276 1815 2107
Total Attendances 6705 6684 6710 7252 6997 6077 6687 6296 8088 8370
ReturnNew Ratio 48 46 44 40 42 35 35 39 35 30
DNAs (for New Appointments) 83 72 64 59 64 72 65 85 62 63
Western Isles Financial Year Ending 31st March
Indicator 2001 2002 2003 2004 2005 2006 2007 2008 2009 2010p
New Patients 0 0 0 0 0 0 0 0 0 0
Total Attendances 0 0 0 0 0 0 0 0 0 0
ReturnNew Ratio x x x x x x x x x x
DNAs (for New Appointments) x x x x x 0 x x x x
Source ISD(S)1 SMR00 As at December 2010 Accessed 21212
x = not applicable = not available p = provisional DNA = Did Not Attend
ISD(S)1 Data issues Outpatient data for the Golden Jubilee National Hospital for the year ending 31st March 2005 is not currently available due to system problems There are long standing unresolved data issues for NHS Lanarkshire NHS Tayside and NHS Forth Valley
Information on DNAs (Did Not Attends) is recorded separately from the other figures shown in the table and comparisons between information from the different data sources should be made with caution
DNA rates are based on actual submissions of SMR00 records no estimation is made to account for shortfalls in data submission
46
For further information contact
ScotPHN co NHS Health Scotland Elphinstone House 65 West Regent Street Glasgow G2 2AF
Email nhshealthscotland-scotphnnhsnet
Web wwwscotphnnet
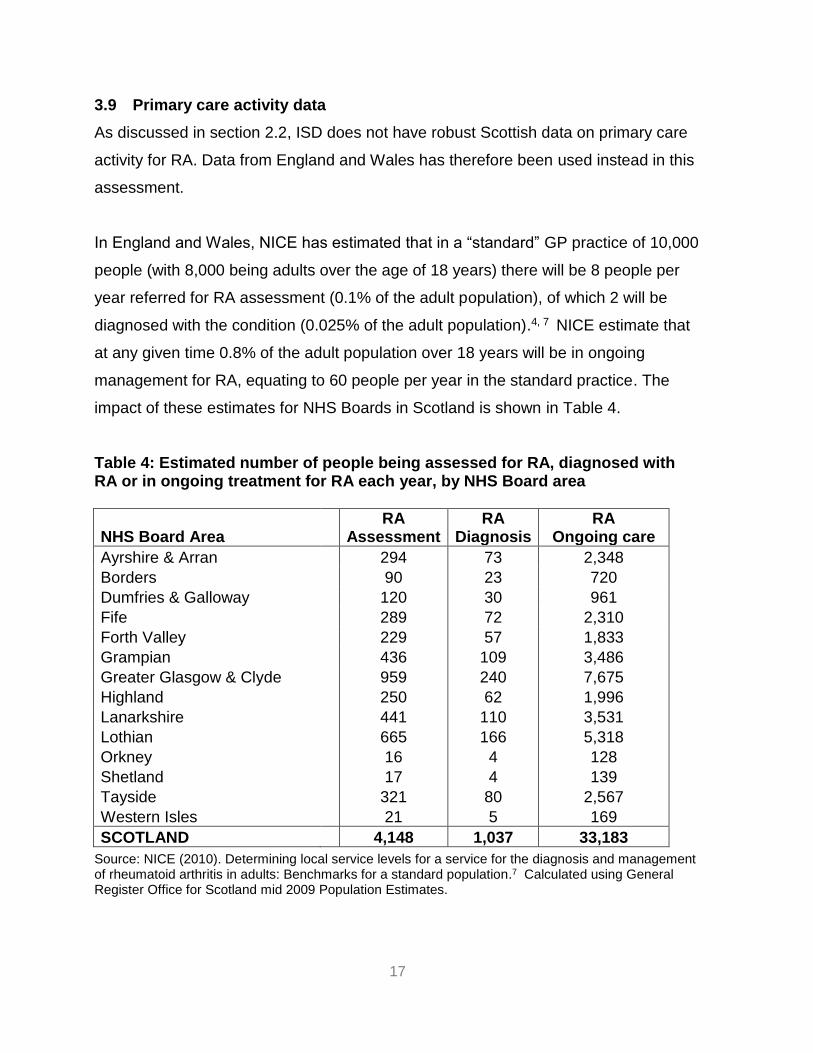
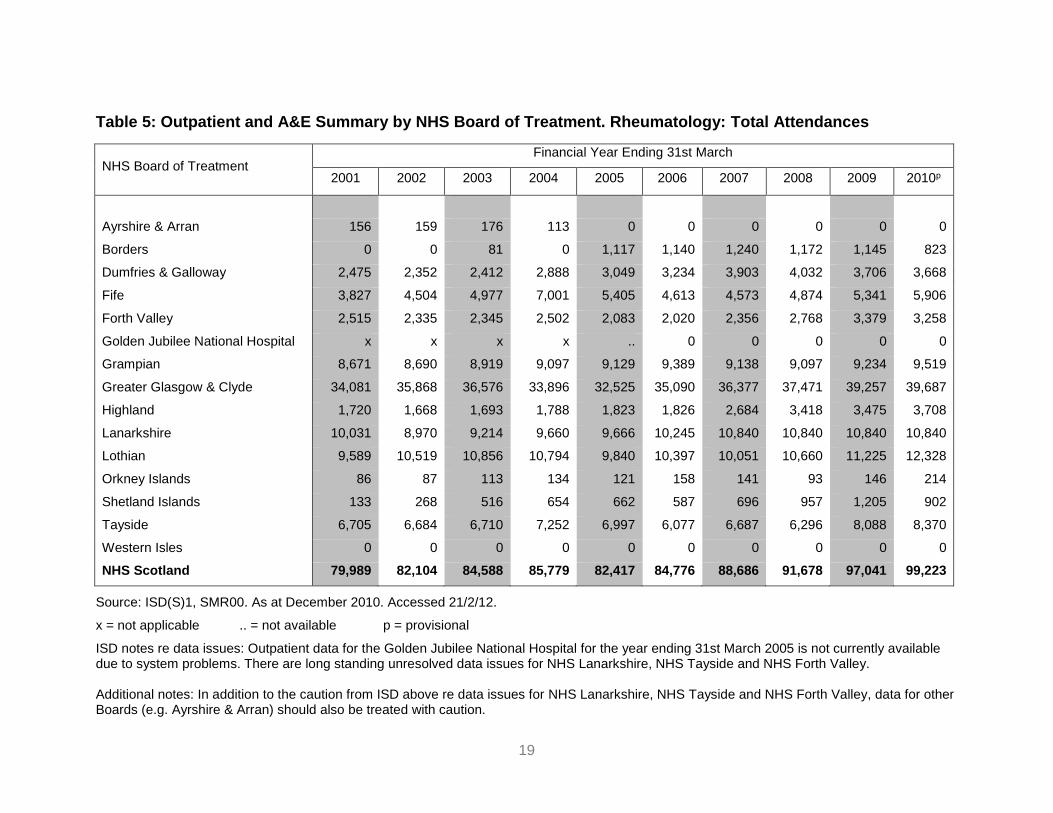
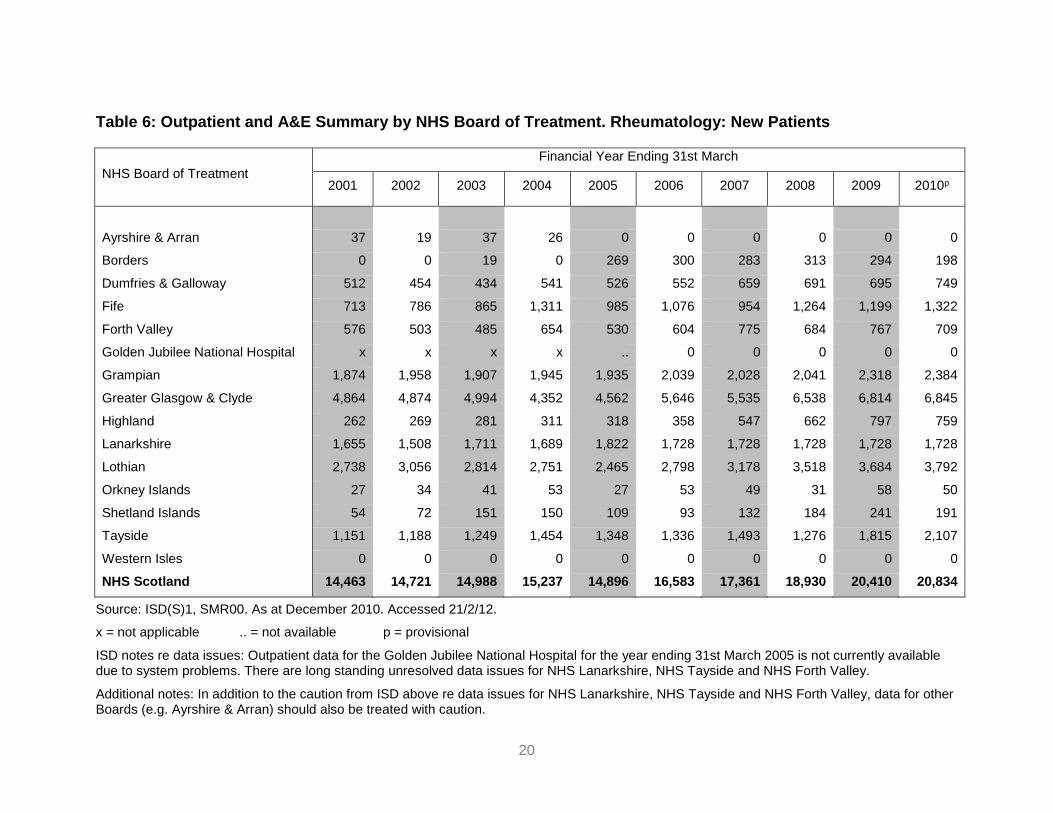
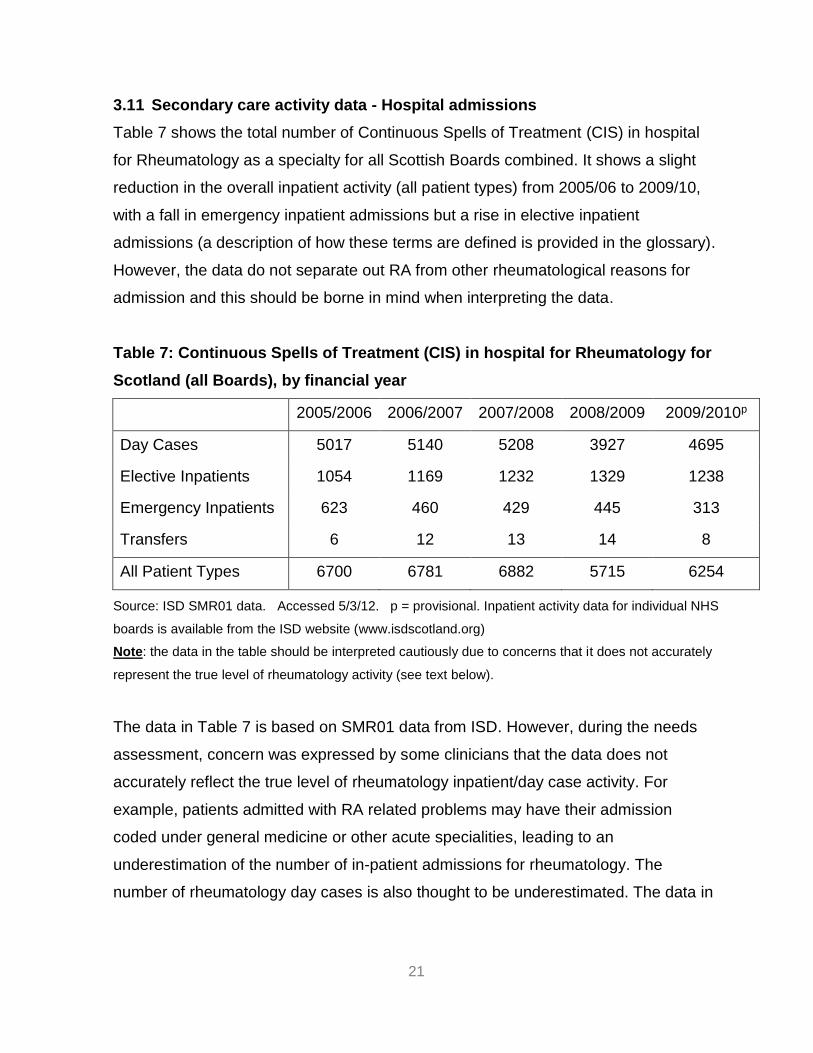
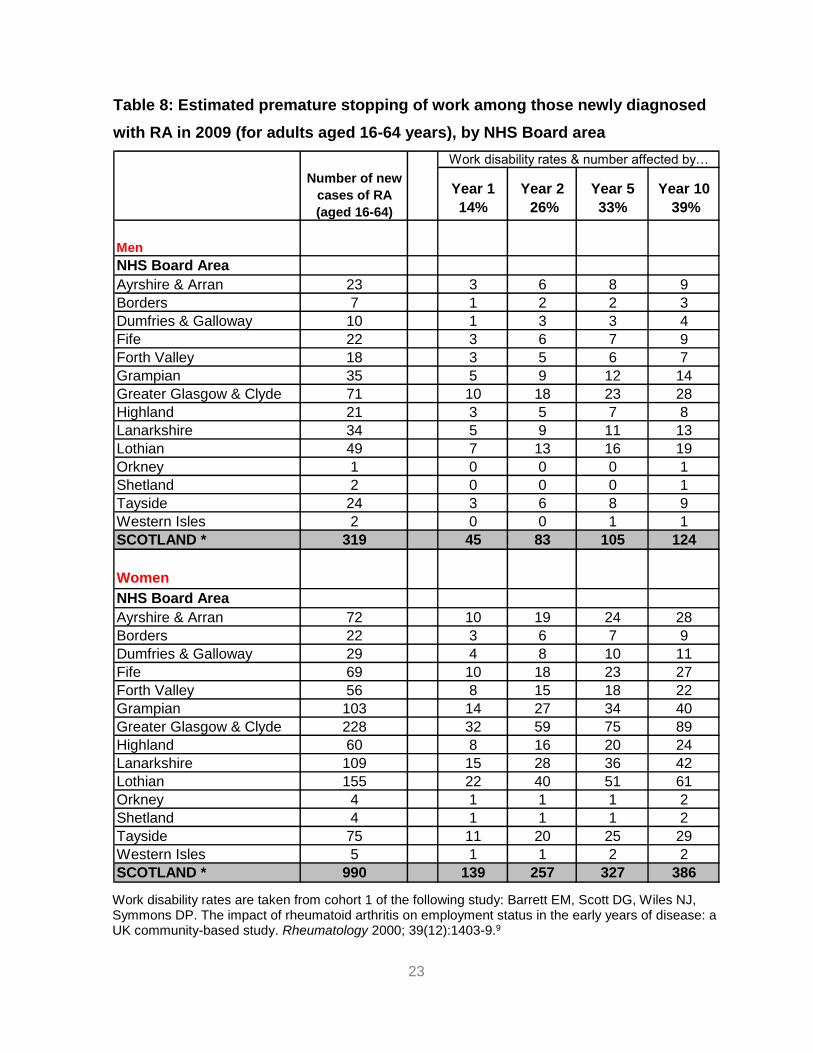
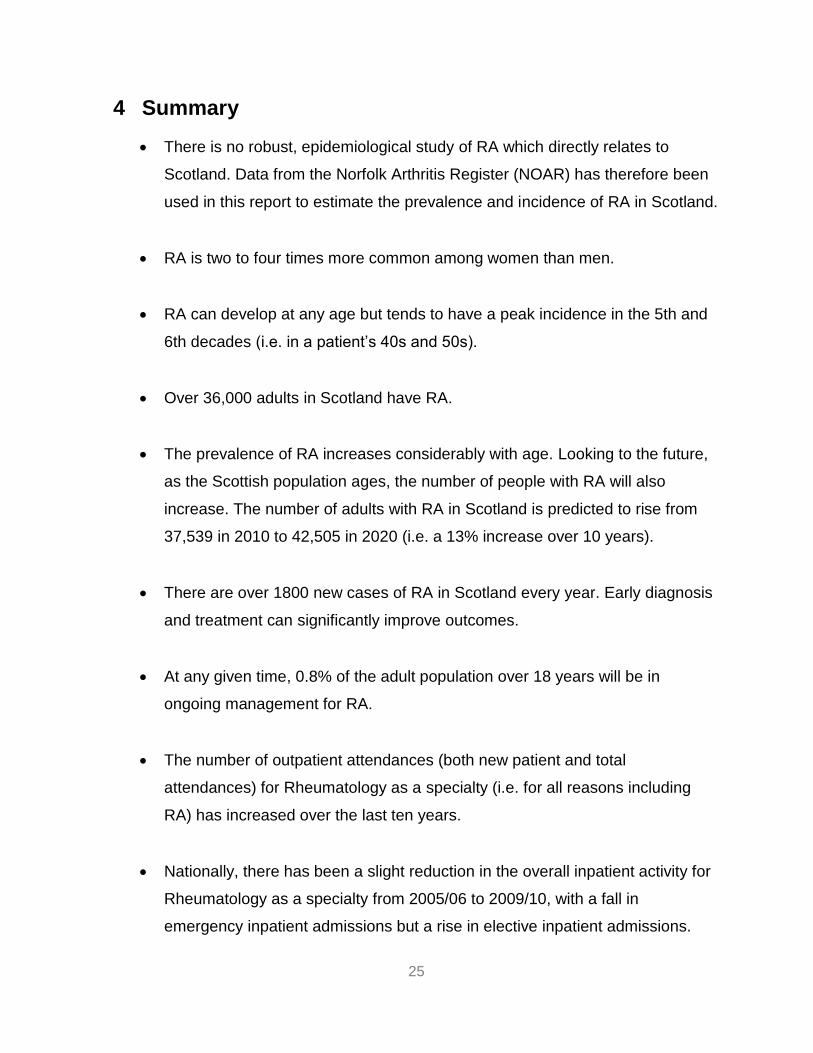
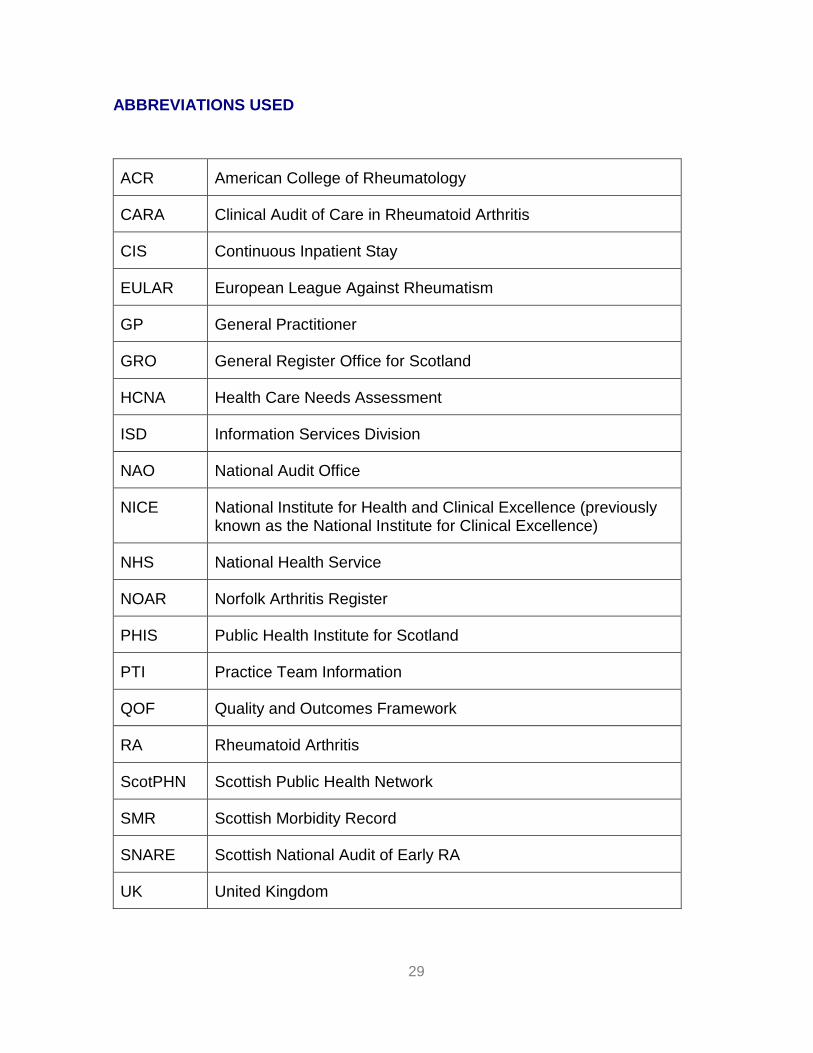
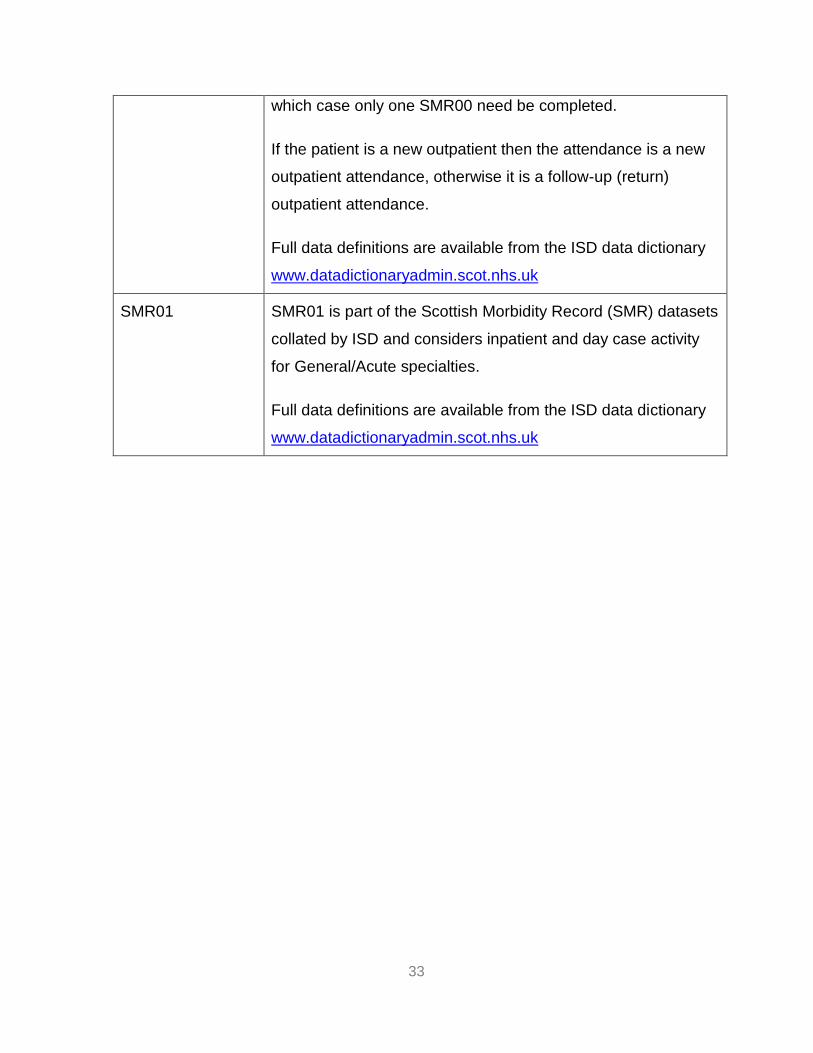
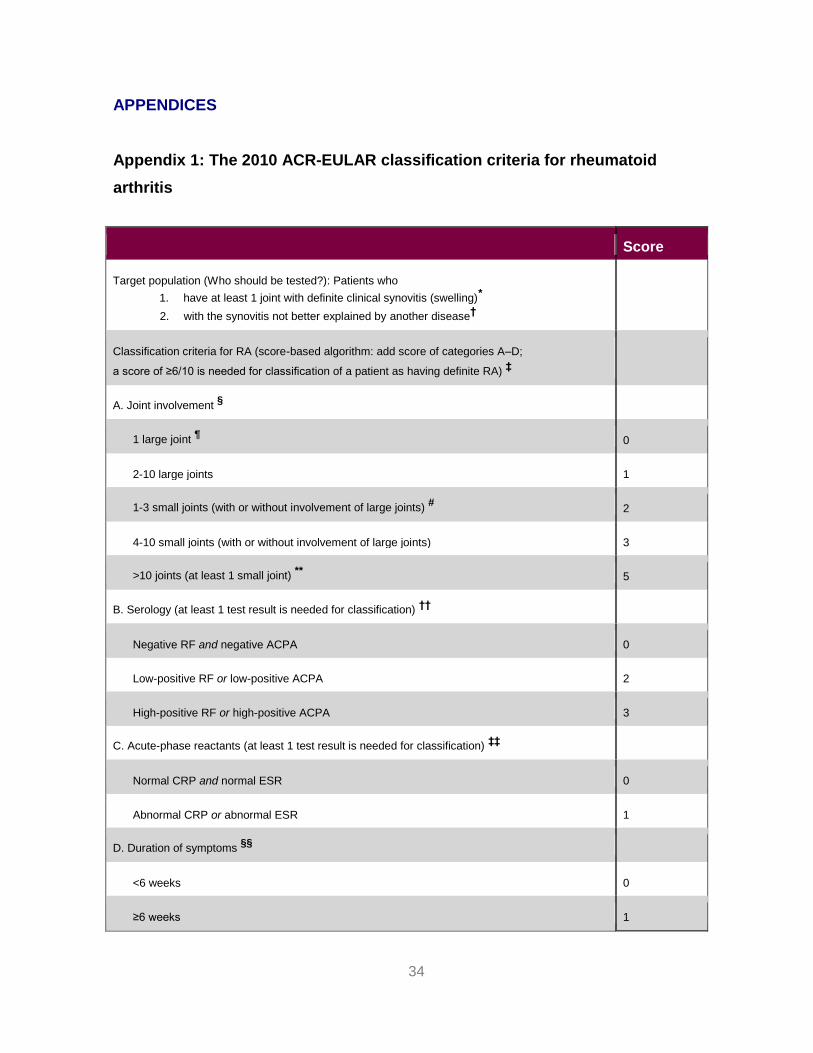
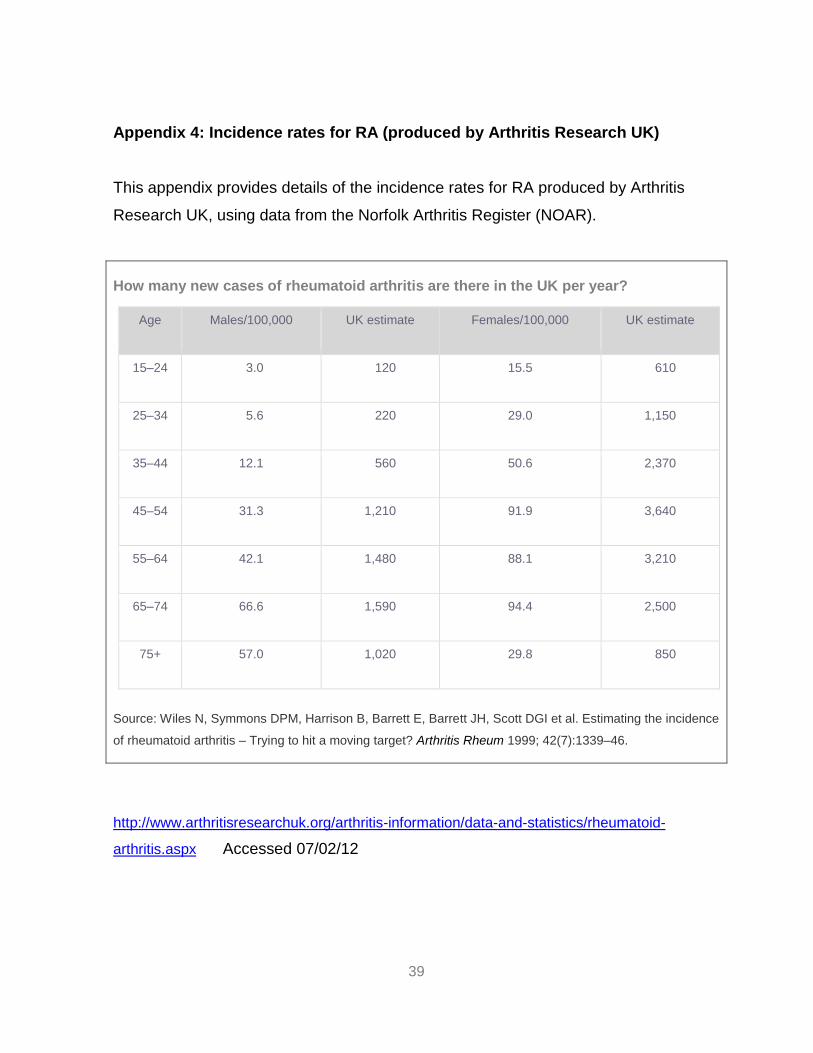
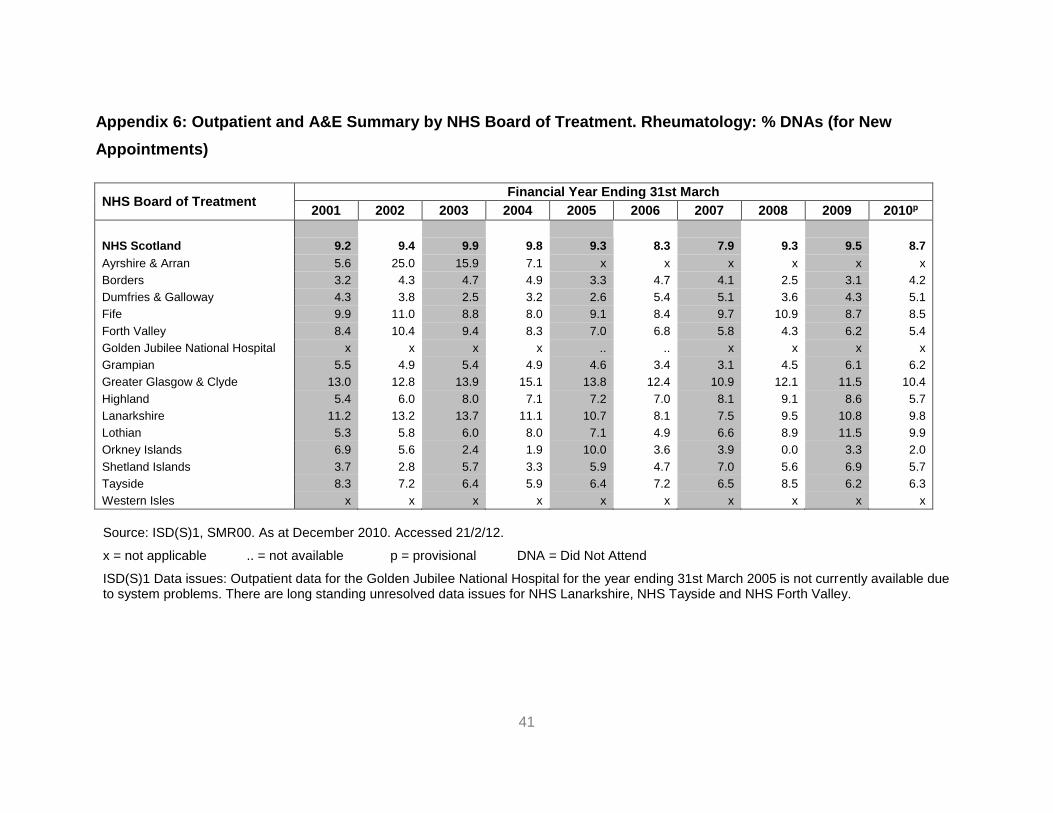
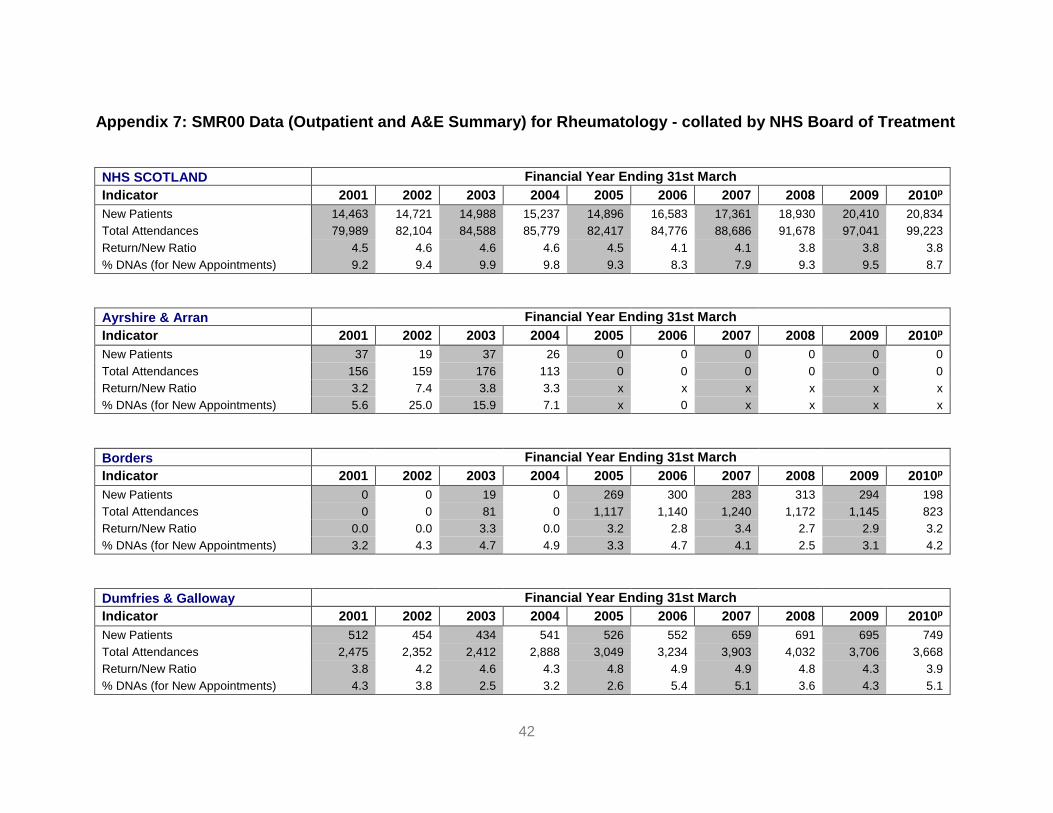
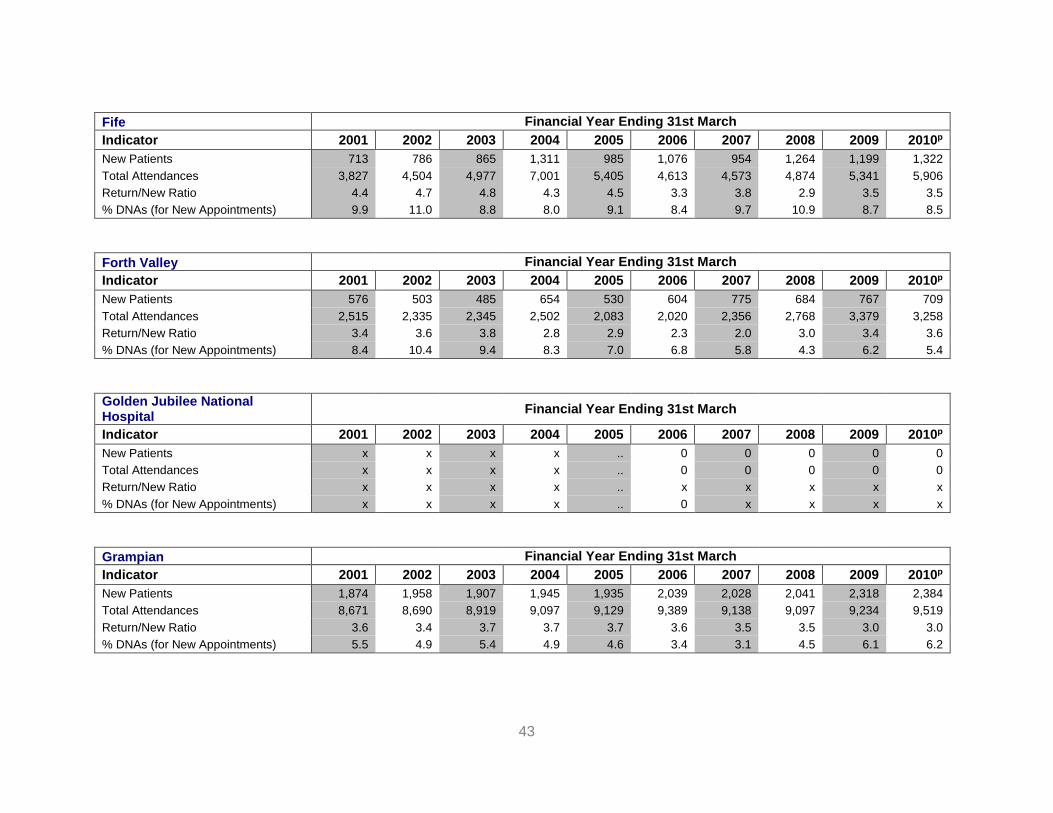

46
For further information contact
ScotPHN co NHS Health Scotland Elphinstone House 65 West Regent Street Glasgow G2 2AF
Email nhshealthscotland-scotphnnhsnet
Web wwwscotphnnet