part 5 report: the nqt year revisited march 2011
TRANSCRIPT

NQT Quality Improvement Study for the Training and Development Agency for
Schools
Part 5 Report: The NQT year revisited
March 2011
Centre for Education and Inclusion Research Sheffield Hallam University

1
Contents
Contents ................................................................................................................................ 1
Acknowledgements ................................................................................................................ 3
Glossary of Acronyms and Key Terms ................................................................................... 4
Executive summary ................................................................................................................ 6Routes into the profession ................................................................................................. 6NQT recruitment ................................................................................................................ 7NQT induction ................................................................................................................... 8Quality and performance ................................................................................................. 10NQT retention .................................................................................................................. 12Discussion ....................................................................................................................... 13Recommendations for schools and senior leaders .......................................................... 13Recommendations for policy makers ............................................................................... 14Recommendations for ITE providers ............................................................................... 14
1. Introduction ...................................................................................................................... 151.1 Project overview ........................................................................................................ 151.2 The NQT year: key issues emerging from our previous research .............................. 151.3 Timetable ................................................................................................................... 171.4 Methods .................................................................................................................... 17
2. Routes into the profession ................................................................................................ 20Chapter Summary ........................................................................................................... 202.2 Actual routes taken by newly qualified teachers ......................................................... 222.3 Views of effectiveness of different routes overall ....................................................... 222.4 Views on the level of effective classroom experience offered by ITE routes .............. 23
3. NQT recruitment .............................................................................................................. 25Chapter summary ............................................................................................................ 253.1 Placement of advertising ........................................................................................... 273.2 Advertising media used to look for posts ................................................................... 303.3 Placement of advertising and advertising media where NQTs look for posts ............. 333.4 Use of the LA pool for recruitment ............................................................................. 333.5 Targeted recruitment ................................................................................................. 343.6 Application, interview and job offer patterns ............................................................... 343.7 Interview and job offer patterns .................................................................................. 363.8 Appointing NQTs ....................................................................................................... 363.9 Difficulties in Recruitment .......................................................................................... 373.10 Difficulties in the recruitment process ...................................................................... 41
4. NQT induction .................................................................................................................. 42Chapter Summary ........................................................................................................... 424.1 Induction support ....................................................................................................... 434.2 Induction processes ................................................................................................... 504.3 Local authority induction programmes - ratings of usefulness .................................... 534.4 Local authority induction programmes - suggested changes to the local authority
statutory induction process ....................................................................................... 544.5 Participation in a PPD programmes ........................................................................... 55
5. Quality and performance .................................................................................................. 56

2
Chapter Summary ........................................................................................................... 565.1 NQT quality ............................................................................................................... 575.2 Perceptions of the quality of NQTs over time ............................................................. 595.3 NQTs' perceptions of the value of their ITE in preparing them for the role ................. 61
6. NQT retention .................................................................................................................. 65Chapter Summary ........................................................................................................... 656.1 Retention of NQTs overall ......................................................................................... 666.2 Roles taken after leaving and reasons for leaving ...................................................... 686.3 Perceptions of problems ............................................................................................ 706.4 Intentions to stay in or leave teaching ........................................................................ 71
7. Conclusion ....................................................................................................................... 737.1 Concluding discussion ............................................................................................... 737.2 Recommendations ..................................................................................................... 757.3 Next steps ................................................................................................................. 767.4 Project Website ......................................................................................................... 76
Appendix 1 Scrutinising the sample representativeness of the senior leader survey ........... 77
Appendix 2 Statistical methods detail ................................................................................... 80Statistical Significance ..................................................................................................... 80Chi-square test of association ......................................................................................... 80Cramer's V ...................................................................................................................... 81Confidence Intervals ........................................................................................................ 81

3
Acknowledgements
The authors of this report are Mike Coldwell, Joanne Davies, Bronwen Maxwell, Colin McCaig and Anna Stevens. The authors would like to thank the project steering group which has provided guidance and advice on project design and project reports:
Jude Belsham The Department for Education
Sara Bubb Institute of Education, University of London
Sue Hopkinson Dore Primary School
Alison Hramiak Sheffield Hallam University
Terry Hudson Sheffield Hallam University
Sarah Jennings GTCE
Jonathan Johnson TDA
Owen Neal GTCE
Marj Royles Tapton School
Ann Whorton Sheffield University
Sally Yates
UCET / Newman University College
Tricia Young Sheffield Hallam University
Centre for Education and Inclusion Research Unit 7 Science Park Sheffield Hallam University Howard Street Sheffield S1 1WB website: www.shu.ac.uk/ceir e-mail: [email protected]

4
Glossary of Acronyms and Key Terms
BaT Becoming a Teacher project - This six year longitudinal project was funded by DCSF, TDA and GTCE and discusses teachers' experiences of teacher training, induction and early professional development.
BEd/BA (QTS)Bachelor of Education – undergraduate route into teaching, most common for primary schools; Bachelor of Arts in Education Studies with Qualified Teacher Status.
CEDP Career entry and development profile - primarily an online resource aimed at trainee and newly qualified teachers (NQTs) to enable them to focus on achievements and goals, and discuss professional development needs. It is organised into three transition points. Transition point one is towards the end of initial teacher training (ITE), point two is at the beginning of the induction year, and point three is towards the end of induction.
CPD Continuing Professional Development - training and development support (for qualified teachers).
D&T Design and Technology - Subject area in the English national curriculum offered from primary onward. It is split into different areas including: textiles, food, graphic products, resistant materials, product design, electronic products, and systems and controls.
EBR Employment-Based Routes to Qualified Teacher Status, such as GTP (see below) and School Centred ITE.
FSM Free School Meals - eligibility for free school meals is dependent on family income, so the percentage of pupils eligible to receive free school meals in a school is a crude measure of poverty or deprivation facing the pupils attending a school. Despite its crudity, it is the only widely available measure of parental income available that is easily matched to school and pupil outcomes, so it is very often used as a proxy for poverty/deprivation in quantitative school research studies.
GCSE General Certificate of Secondary Education - set of British qualifications, taken by secondary school students normally at the age of 16 in England, Wales, and Northern Ireland.
GTCE General Teaching Council for England - the professional body for teachers in England. The GTC registers teachers, maintains professional standards and gives advice to the government. The GTC provisionally registers those starting a course of initial teacher training in England which leads to the award of QTS.
GTP Graduate Teacher Programme - route into teaching that involves the trainee being placed predominantly in a school setting. This is the most common 'employment-based route' into teaching.
ITE Initial Teacher Education – routes into teaching that lead to Qualified Teacher Status.
LA Local Authority.
MTL The masters in teaching and learning (MTL) - a fully government-funded practice-based masters programme designed to help teachers gain the knowledge and skills they need to have a real impact in the classroom.

5
NQT Newly Qualified Teacher – teacher in the first year after completing their ITE.
OFSTED Office for Standards in Education, Children's Services and Skills - government agency responsible for the management of the system of school inspection defined originally by the Education (Schools) Act 1992.
OTTP Overseas Trained Teacher Programme provides overseas trained teachers with the opportunity to gain qualified teacher status (QTS) while working as a teacher.
PGCE Post Graduate Certificate in Education – a one or two year route into teaching for those with a previous undergraduate degree, the most common route into secondary teaching.
PPA Planning, Preparation and Assessment - protected non-contact time available to teachers.
PSHE Personal, Social and Health Education - Subject area in the English national curriculum offered from primary onward. PSHE education equips children and young people with the knowledge and skills to deal with a range issues they face as they grow up.
PD Professional development - activities undertaken by teachers to support their development.
QTS Qualified Teacher Status - Accreditation for teachers to teach in state maintained and special schools in England and Wales.
RQT Recently Qualified Teacher - teacher in their second, third or fourth year after completing their ITE.
SEN Special Educational Needs - in England, refers to a legal definition of individuals with learning difficulties or disabilities that make it harder for them to learn or access education than most children of the same age.
SL Senior Leader - a member of the Senior Leadership Team responsible for the strategic direction of the school.
SLT Senior Leadership Team – senior group responsible for the strategic direction of the school, consisting usually of the Headteacher, and Deputy Headteacher(s) and/or Assistant Headteacher(s) and in some cases a Business Manager.
SSAT Specialist Schools and Academies Trust.
TA Teaching Assistant - staff that support teachers and pupils individually or on a group basis. Some are subject specialists, for example in numeracy, English as an additional language or creative arts as well as Special Education Needs.
TDA Training and Development Agency for Schools – government agency responsible for ITE and continuing training and development of teachers and the whole school workforce.
TLR Teaching and Learning Responsibility payments - additional salary payable to teachers who fulfil specific roles in leading and managing teaching and learning within a school.

6
Executive summary
Sheffield Hallam University was commissioned by the Training and Development Agency for Schools (TDA) in 2007 to explore whether school leadership teams (SLTs) are able to recruit and retain enough quality Newly Qualified Teachers (NQTs). The project was commissioned with the aim of identifying the factors that impact on the recruitment and retention of newly qualified teachers (NQTs), senior leader needs in relation to high quality NQTs and early career teachers (ECTs), their preparation for their role and performance over time and how schools measure the performance and progression of ECTs over time. This report relates to Part 5 of the study, which revisited the NQT year, and focuses on changes from Parts 1 and 2. The analysis below presents findings relating to five key themes: routes into the profession; NQT recruitment; NQT induction; quality and performance; and NQT retention. A quantitative approach to data collection was used in Part 5 utilising a postal and online national survey of senior leaders and teachers who had just completed their NQT year. The sampling and response rates were as follows:
• The sample for the part 5 survey was drawn from a combination of respondents who had responded to the previous surveys and from those who were in the original part 1 sample. Questionnaires were dispatched to one senior leader in each school in the sample, giving a total sample of 2,090 schools. A total of 734 (155 online and 579 hard copy) senior leader responses were returned giving an overall response rate of 35%. The achieved sample was tested for representativeness by region and by percentage of pupils eligible for free school meals (used as a proxy measure for deprivation).
• The same methodology applied in previous surveys was used for the NQT sample.
Senior leaders were asked to pass surveys on to NQTs in their schools via a hard copy or email link to the online survey. In total 386 (206 online and 180 hard copy) NQT responses were received for analysis.
Routes into the profession
Senior leaders' appointment of NQTs from various ITE routes • In primary schools there is a clear preference for NQTs from the undergraduate route;
almost two-thirds expressed this preference. However, only just over a third of vacancies were filled by candidates from this route.
• Among secondary-based respondents, while a third expressed a preference for employment-based routes this was not reflected in appointments made (approximately one sixth came from this route). A similar but smaller disconnect occurred in the primary sector.
Routes taken by NQTs in our survey
• Three-quarters of secondary NQT respondents and half of primary NQT respondents came from the PGCE route, a very similar picture to our 2008 survey.
• Forty percent of primary NQT respondents came from undergraduate routes, compared with less than five percent of secondary NQT respondents.
• Fourteen percent of secondary respondents compared with seven percent of primary respondents came from employment-based routes.

7
Senior leaders' perceptions of effectiveness of ITE routes • Senior leaders responding to our 2010 survey viewed the undergraduate route as the
most effective route in preparing NQTs to work in their school in comparison with the PGCE and employment based routes.
• Analysis by route and school type reveals clear preferences among primary respondents for the undergraduate route, followed by PGCE and employment based routes when thinking about their relative effectiveness.
• Secondary respondents found the PGCE to be the most effective route; employment-based routes were also highly valued with the undergraduate route seen as the least effective.
Senior leaders' perspectives on level of classroom experience among NQTs from various ITE routes
• Among respondents to our 2010 survey there was a clear recognition that employment-based routes offered the most appropriate level of classroom experience for trainees, and this was especially the case for our secondary respondents.
• Among secondary respondents the PGCE was rated the second most appropriate route in terms of classroom experience, but among primary respondents the undergraduate route was rated second.
NQT recruitment
Advertising for NQTs • Just over three-quarters of all schools regularly placed adverts suitable for NQTs on
the local authority website or in local authority bulletins and just over two-fifths used the TES Online or TES hard copy. Primary schools made greater use of local authority websites and bulletins, secondary schools made greater use of TES Online and hard copy.
• There was some mismatch between where senior leaders placed adverts for posts suitable for NQTs and sources used by NQTs themselves. NQTs rely heavily on internet sources to locate adverts, making the greatest use of TES Online (regularly used by 75% of NQTs) and local authority websites (63%). Primary NQTs make greatest use of local authority websites while secondary NQTs make greatest use of TES online.
• Local authorities do not operate recruitment pools in all areas, but where they do senior leaders are largely positive about their usefulness for recruiting good quality NQTs.
• Most schools (74%) do not target NQTs in adverts but advertise for main scale teachers, although primaries target NQTs more frequently than secondary schools.

8
Application, interview and job offer patterns • Most NQTs (69%) apply for five or fewer posts. Primary NQTs apply for more posts
than secondary NQTs. Just over half of NQTs were invited to attend one or two interviews and just over a third attended between three and five interviews.
• The majority of NQTs (68%) attended one or two interviews and a further 27% attended between three and five interviews. The vast majority of NQTs (95%) were offered one or two posts. There was no significant variation in application, interview and job offer patterns by school type.
NQT appointments • Primary schools were more likely to have appointed NQTs recently to KS2 (80% of
primaries) or KS1 (71%) compared with the Foundation Stage (54%). Secondary schools were most likely to have appointed NQTs in English, Mathematics and General/Combined Science (more than 75% of secondaries in each case) and least likely to have appointed NQTs to teach PSHE, Physics or Chemistry (less than 40% in each case).
• Sixty percent of primary schools and 50% of secondary schools had recruited at least some NQTs to temporary posts. The least deprived schools appointed significantly fewer NQTs to temporary posts compared with other schools.
Difficulties in recruitment • Primary schools found it slightly harder to recruit to Foundation Stage posts
compared with KS1 and KS2, although for each key stage over 75% of primary schools reported it was not very or not at all difficult to recruit to posts in each key stage.
• The most deprived schools faced the greatest difficulties recruiting NQTs to the Foundation Stage.
• The most difficult subjects to recruit NQTs to in secondary schools are Physics (45% of schools that recruited physics teachers reporting difficulties), Mathematics (43% reporting difficulties), Chemistry (38%) and General/Combined Science (31%). Given that over three quarters of secondary schools had recruited an NQT to teach Mathematics and the same to teach General/Combined Science this is clearly a particular problem of supply in these subjects.
• Whilst there were few differences in difficulty of recruitment to different key stages in primary schools between 2008 and 2010, the picture overall was better in 2010 in secondaries. For almost all secondary subjects, a smaller proportion of senior leaders reported difficulties in recruiting in 2010 compared with 2008. The difference was particularly significant for Physics (76% of schools that recruited NQTs to teach Physics in 2008 reported difficulties, compared with 45% in 2010) and ICT (54% in 2008, 43% in 2010).
• Nearly a fifth of schools (18%) of schools reported difficulties in recruitment because they had to appoint to temporary rather than permanent posts. This was perceived as a significantly more difficult problem in primary schools.
NQT induction
Common induction programme • In 2010 nearly all schools had a common induction programme in place. There had
been a significant increase in the number of secondary schools having a common

9
induction programme in place since 2008 to the point of almost universal coverage in 2010.
Induction support • In 2010 senior leaders in over 90% of all schools reported that those aspects of
induction set out in the induction statutory guidance, i.e.10% release from NQTs' timetables, provision of an induction tutor, opportunities to observe other teachers, training courses and use of TDA standards, were always available to NQTs.
• Primary schools provided more opportunities for NQTs to visit other schools and greater access to local authority training programmes than secondary schools. Secondary schools more often enabled NQTs to undertake masters work, offered in-house induction programmes, support from mentors and coaches, and used the career entry development profile more than primary schools.
• Greater use of local authority induction programmes was made by schools in more deprived areas.
• Broadly NQT respondents agreed with senior leaders about the relative availability of different types of support, however they perceived that less support was available than their senior leaders claimed was offered.
• Comparison of senior leader responses in the 2008 and 2010 surveys revealed a statistically significant decline in the use of the TDA standards, the career entry development profile, written individual programmes and the provision of support from a mentor or coach who was not the NQT’s designated induction tutor over time. The decline in the use of an additional mentor or coach and of written programmes was particularly marked in primary schools.
Induction processes • Senior leaders reported that in most schools one member of the teaching staff
oversees NQT induction and in nearly three quarters of schools other staff are also designated to support NQTs. Fewer NQTs in primary schools were provided with access to an additional mentor than in secondary schools.
• Senior leaders in around three quarters of all schools reported that there were explicit processes for monitoring and evaluating NQT induction. Fewer NQTs were aware of these processes. More secondary schools had processes for formal monitoring and evaluation of induction than primary schools.
• Just under half of all schools’ senior leaders, and around a third of all NQTs, reported that there were explicit processes for supporting NQTs to work with support staff. Support for working with support staff was more frequently available in primary than secondary schools.
• Governors rarely had involvement in NQT induction.
• There were no significant differences over time in relation to induction processes. Local authority induction programmes
• Sixty one percent of senior leaders thought that local authority induction programmes were useful and a further twenty nine percent had a neutral opinion. Primary senior leaders were more positive about the usefulness of local authority programmes than senior leaders in secondary schools.

10
• Senior leaders thought that local authority induction programmes could be improved
by:
o More formal and informal opportunities for NQTs to network with each other o More content related to behaviour management, chid protection, special
educational needs, and working with support staff o Differentiating training o More consultation and collaboration between schools and the local authority
to design and deliver the training o Organising training at times that provide greater accessibility for NQTs (e.g.
twilights) o Practical sessions that are delivered by skilled practitioners with recent school
experience o Clearer communication of dates and times o Less paperwork
Participation in Postgraduate professional development (PPD) programmes
• Just under a third of all NQTs were participating in a PPD programme. More NQTs in secondary schools were participating than in primary schools.
Quality and performance
Senior leaders' views on the quality of NQTs • Senior leaders responding to our 2010 survey were asked to rate NQTs' qualities
against a range of competences. Overall they were most satisfied with NQTs' IT skills, commitment to children, their team working skills with teaching colleagues, ability to meet the professional standards, lesson planning, awareness of what the job entails and ability to deal with children.
• Senior leaders were least satisfied with NQTs' ability to deal with parents, preparedness to teach phonics (relevant only in primary schools), team-working skills with non-school colleagues and administrative work.
• Senior leaders in the secondary sector generally rated the abilities of NQTs more highly than primary-based senior leaders. There were statistically significant differences between secondary and primary responses in relation to subject specialism, lesson planning, awareness of what the job entails, meeting the professional standards for teaching and pupil assessment/assessment for learning.
• There were no significant changes in senior leaders' views about the qualities of NQTs between the 2008 and the 2010 surveys.
Senior leaders' perceptions of changes in quality of NQTs over time
• Among senior leaders responding to our 2010 survey almost half believed that the quality of NQTs had increased or slightly increased over the previous three years. Almost half detected no difference and less than ten percent believed there had been a decrease in quality.
• Secondary-based senior leaders were significantly less likely to report a decrease in the general quality of NQTs in the 2010 survey than in the 2008 survey. Among respondents from the primary sector the picture was unchanged.

11
Satisfaction of senior leaders with their choice of NQTs • Almost three-quarters of senior leaders responding to our 2010 survey were satisfied
or very satisfied with their choice of NQTs over the last three years. • Analysis by school type shows that secondary respondents were more positive about
an increase in quality and less likely than primary respondents to report declining quality.
• There were no significant changes in senior leaders' satisfaction with the choice of NQT candidates between the 2008 and the 2010 surveys.
NQTs perceptions of the value of their ITE in preparing them for the role • NQTs responding to our 2010 survey rated their initial teacher education highly
across most of the criteria listed in our survey. Almost half of respondents rated the effectiveness of their preparation for the role as very good in four areas- moving towards meeting the professional standards, commitment to children, working with/in charge of a full class of children and lesson planning. For each of these criteria - and for awareness of what the job entails - over three-quarters of respondents rated their preparation as good or very good.
• The areas identified by NQTs as the weakest in terms of preparation for the role of classroom teacher were administrative work, commitment to parents, team working with non-school colleagues and the ability to deal with parents; in each of these, less than a fifth felt that their ITE offered very good preparation.
• Secondary respondents rated their ITE more highly than primary respondents as good for preparation; four of these differences were significant: subject/specialism knowledge; pupil assessment/assessment for learning; ability to deal with parents; and commitment to parents. In three areas - team working skills with support staff, team working skills with non school colleagues and working with/in charge of a full class of children - primary respondents felt themselves more adequately prepared than secondary peers.
Comparing senior leaders' and NQTs' perceptions of the value of ITE in preparation for the role
• Comparative analysis of NQTs' perceptions of the effectiveness of their ITE with senior leaders' evaluations of their quality using the same criteria shows a relatively high degree of congruence in our 2010 survey data.
• Of the top eight highest ranked criteria in the NQT survey, seven appear in the top eight ranking from the senior leader survey, with three occupying the same position in both rankings.
• However there were some interesting variations. Working with a full class/in charge of a whole class had the third highest rating in the NQT survey, but for senior leaders, NQTs' skills in this area were rated only 10th. Similarly, while NQTs believed that they were relatively well prepared for pupil assessment/assessment for learning; senior leaders found this area one of the weaknesses of NQTs.
• Conversely, IT skills was the highest placed criterion in terms of skills that NQTs exhibit according to senior leaders, but were only placed twelfth in NQTs' ranking of criteria that benefited from their ITE experience.

12
NQT retention
Retention overall • The overall picture in 2010 is of stability – in most cases few NQTs in their first two to
three years of teaching had left the schools involved since 2005; and 92% of schools said that retention of NQTs was not a problem.
• Fourteen percent of leaders in more deprived schools stated that retention of NQTs was a problem compared with 5% of leaders in the least deprived schools.
• Primary schools were more likely to report some leaving after one year. After that, though, stability was higher in primary schools than in secondaries. Slightly higher proportions of NQTs were leaving more deprived schools compared with others.
• There were some indications that there was greater stability in 2010 compared with 2008, with significantly higher proportions of senior leaders indicating that none of their NQTs had left after two or more years in 2010. This difference was particularly large in primary schools, where almost half of schools reported no NQTs leaving after two or more years in 2010 compared with less than 29% in 2008.
• Where NQTs did leave, they were overwhelmingly likely to be moving on to other jobs in teaching (although this was slightly less likely in primary schools).
Reasons for leaving the school • The most common reasons given for NQTs leaving were promotion and contracts
ending.
• Among secondary school senior leaders 68% cited promotion as a reason for leaving, compared with 33% of primary school leaders. Senior leaders in more deprived schools were more likely to mention pupil behaviour, types of class taught and mismatch between skills and the demands of the job, although the strength of the link between deprivation and reasons for leaving was quite weak in each case.
• In 2010, senior leaders were less likely to cite promotion as a reason for NQTs leaving (43% of leaders in 2010) compared with 2008 (51%) and also - encouragingly - they were less likely to mention pupil behaviour in 2010 (7% in 2010 compares with 12% in 2008).
• When asked an open question regarding measures that supported retention, most responses cited ensuring staff were supported, via measures including providing a supportive environment, mentoring, induction, professional development, protected time and career opportunities. Other measures mentioned included financial incentives/permanent contracts and classroom issues especially pupil behaviour and teaching a preferred age range/subject/level.
NQT intentions relating to staying in or leaving the profession • Ninety-four percent of the NQTs we spoke with intended to stay in teaching in 2010,
a slight increase from the 91% who intend to stay in teaching in 2008.
• Of the teachers intending to stay, 78% intended to stay in teaching for the rest of their career, 21% for between two and ten years and only one individual intended to leave in the next year.

13
• Of the 22 teachers that intended to leave, heavy workload was by far the most common reason given, with 68% of the 22 reporting this.
Discussion
• In the discussion, we draw out some of the most important findings from the report, and attempt to link these where possible providing an analysis of the reasons behind some of these findings. To begin with, we discuss the generally positive findings regarding recruitment and retention overall. We move on to discuss routes into teaching, and the picture overall in relation to leaders’ and NQTs' views on these. We then turn to induction, considering the findings in relation to standards and support for induction, before looking at the relationship between issues of concern regarding both ITE preparation and induction.
Recommendations for schools and senior leaders
On routes into teaching: • The implications in this respect are for senior leaders to maintain their approach of
shortlisting candidates from a plurality of ITE routes to reflect their diverse needs. On recruitment and retention:
• Schools should review their advertising strategies to align them with the sources most used by NQTs to search for posts, in particular making greater use of electronic media.
On induction and support:
• Schools should make particular efforts to meet NQT needs in relation to behaviour management and working with support staff, seen as areas of weakness by NQTs in our survey.
• Schools should identify opportunities for NQTs to network with other schools, since this is valued by senior leaders, particularly as a basis for professional development through collaboration in following years.
On performance and teacher quality: • Some senior leaders currently see their role as correcting the weaknesses of
particular ITE routes from which they employ NQTs; we suggest that they deal with this issue by working more closely with ITE providers in programme and course design.
• Primary senior leaders should in particular work with providers to address perceived weaknesses in subject specialism, lesson planning, awareness of what the job entails, meeting the professional standards for teaching and pupil assessment/assessment for learning.
• Senior leaders should continue to increase the emphasis they place on lesson observations as an aspect of performance management as these are found to be valued by NQTs.

14
Recommendations for policy makers
On routes into teaching: • PGCE and employment-based routes are both highly valued by secondary school
leaders. Undergraduate and PGCE routes are the most valued routes into primary education. Therefore the study supports the view that these routes should continue to be used as routes into the profession. Any changes made should ensure that the positive features of these routes are incorporated into future ITE.
• Policy-makers should work with ITE providers to continue to address perceived weakness in ITE preparation for aspects of the teacher's role, in particular working with parents and administrative work which are found to be weakest among NQTs from the shortest routes
On recruitment and retention: • There are specific difficulties faced by secondary schools in relation to filling posts in
Physics, Chemistry, Mathematics and General/Combined Science. These last two subjects are also subjects that large numbers of schools recruit to. This means that for all of these subjects - and particularly General/Combined Science and Mathematics - policy-makers should continue to support initiatives to increase the supply of teachers.
• Schools with more deprived student populations have more difficulties recruiting and retaining teachers. For primary schools, this is particularly an issue in the Foundation Stage. Therefore policy-makers should continue to support such schools in recruiting and retaining NQTs.
On induction and support: • Policy-makers should review the standards for induction, in light of our findings that a
number of schools are not using particular aspects of them, and the number using them has declined over time.
• Schools, particularly primary schools, value LA induction support. Policy-makers should consider how to ensure support for induction is provided effectively and efficiently as LA support declines.
Recommendations for ITE providers
On routes into teaching: • ITE providers should continue to address perceived weaknesses in ITE preparation
for aspects of the teachers' role, in particular working with parents and administrative work which are found to be weakest among NQTs from the shortest routes.

15
1. Introduction
1.1 Project overview
Sheffield Hallam University was commissioned by the Training and Development Agency for Schools (TDA) in 2007 to explore whether school leadership teams (SLTs) are able to recruit and retain enough quality Newly Qualified Teachers (NQTs). An NQT is a teacher in their induction year following the completion of their initial teacher education (ITE). The four year study aims to identify:
• the factors that impact on recruitment and retention of NQTs;
• senior leaders needs in relation to high quality NQTs;
• how far NQTs meet these needs; their preparation for their role; their integration into schools and performance over time; how these are affected by the ITE route taken;
• how schools measure the performance and progress of NQTs. The study utilises a longitudinal survey of around 700 school senior leaders and NQTs in their schools (at the start of the project), and 50 case studies in a sample of these schools. As the study progresses, the focus moves on to the second and third years of teaching, before returning to consider any changes in senior leader and NQT views on the NQT year in the final stage. The study is divided into five parts as follows:
• Part 1: environment map - focus on ITE routes and NQT recruitment with some focus on NQT retention, induction, quality (March 2008).
• Part 2: the NQT year - focus [from case studies] on ITE route, recruitment, with more detail [including from survey] on induction, retention and quality (November 2008).
• Part 3: the second year of teaching - focus on perceived teacher quality/performance; professional development and support; career development; and progression from the NQT year/retention in second year [largely from case studies] (November 2009).
• Part 4: the third year in teaching - focus on progression from post-NQT year; performance; EPD; promotion (December 2010).
• Part 5: the NQT year revisited - focus on changes from Parts 1 and 2 in issues relating to ITE route, recruitment, retention, induction, and quality - potential link to the new Masters in Teaching and Learning qualification (March 2011) .
1.2 The NQT year: key issues emerging from our previous research
The following gives a brief overview of previous findings from all our data collected during the course of the research project around the NQT year.
Routes into the profession
• Findings suggest that primary schools prefer the undergraduate route and PGCE route whilst secondary schools prefer the PGCE route and employment based route into the profession.
• Current or previous NQTs were known to the school prior to starting their NQT year; this may be because the NQT had previously undertaken a placement at the school, was employed as a teaching assistant or had previously done supply work at the school.

16
• The majority of schools that commented were in partnership with local ITE providers and many commented on how they had well established links and contacts with good working relationships. Secondary schools were more likely to be linked with several institutions than were primary schools.
NQT recruitment
• When schools place advertisements they are more likely to use the internet and, when looking for vacancies, trainees are even more likely to look online. LA job bulletins, the LA pool and local press, as well as hardcopy advertisements in the TES, are still used widely.
• The findings also do not support the contention that recruitment is more difficult in deprived schools. The findings suggest that, although there are issues for some subject specialisms in secondary schools, senior leaders generally do not find it difficult to recruit NQTs. Physics is seen by far as the most difficult subject to recruit for. The findings also indicate that senior leaders are generally satisfied with candidates.
NQT induction
• The majority of schools included an in-house induction process including 10% reduction in timetable, observations, NQT mentors and regular meetings in their NQT induction programme.
• In virtually all respects, the NQTs experienced a more limited induction than the senior leaders told us they provided.
• LA induction was part of NQT induction for the majority of schools. Generally, the comments made by primary case study school senior leaders were more positive than secondary regarding LA induction.
• Whilst schools are of prime importance in the induction of NQTs, ITE providers and local authorities might also have important roles in providing or facilitating support.
Quality and performance
• Across secondary and primary schools the majority of senior leaders who responded believed that the quality of NQTs had improved over time.
• Senior leaders were positive about NQTs' commitment, enthusiasm and ability to handle the workload, although workload management was more of a concern for those from the PGCE route.
• On subject knowledge there was a balance between those that believed NQTs were adequately prepared and those who thought that there was too much to be learned in one year.
• NQTs in secondary schools and some senior leaders/mentors also thought classroom management and behaviour management were areas of concern.
• The proportions responding using the ‘adequate’ category suggests there are a number of aspects of ITE that might be usefully reviewed by the providers.
• Written comments by senior leaders suggest quality aspects that the questionnaire did not specify, including creativity and flexibility, classroom and behaviour management.
NQT retention
• It is difficult to make the case, based on the data collected, that there is a serious,

17
widespread problem with retention.
• Most schools felt that there was either no problem or that problems were related to a limited number of issues, and most saw that providing good quality support and development opportunities in a friendly environment was the key to retaining staff for the first few years of their careers.
• NQTs supported these views, in the main. Most intended to stay in teaching, and looked forward to promotion internally or externally at some point, in some cases to very senior positions.
• In a minority of schools, there was a more or less serious problem with retention of NQTs, and these schools were some of those facing the most challenging circumstances.
• Reasons for NQTs’ leaving are short term contracts, workload and pupil discipline, although financial reasons did not emerge in the findings.
1.3 Timetable
The survey design phase took place over the summer of 2010. For the most part questions were kept in line with the surveys conducted in part 1 and part 2 of the study to enable the comparison of data collected in this phase. The survey was administered to schools in autumn 2010 with collection finalised in December 2010. Following this analysis of the data took place between January and March 2010. Details of the timetable are given below. Table 1.1 Part 5 Project Timetable Month Work undertaken June 10 - September 10 Telephone interviews, questionnaires designed and finalised. October 10 - January 11 Part 5 questionnaires despatched, responses monitored and survey
closed. January 11 - March 11 Part 5 survey responses captured and analysed, drawing comparisons
with previous surveys. Part 5 report writing, draft submitted and report finalised.
1.4 Methods
Part 5 Sampling and response rates The sample for the part 5 survey was drawn from a combination of respondents who had responded to the previous surveys and from those who were in the original part 1 sample. This gave a total sample of 2,090 schools. A total of 734 (155 online and 579 hard copy) senior leader responses were returned giving an overall response rate of 35%. The achieved sample was tested for representativeness by region and by percentage of pupils eligible for free school meals (used as a proxy measure for deprivation). This is described in the sample scrutiny section below. The same methodology applied in previous surveys was used for the NQT sample. Senior leaders were asked to pass surveys on to NQTs in their schools via a hard copy or email link to the online survey. In total 386 (206 online and 180 hard copy) NQT responses were received for analysis. Response rate details by school type are given below.

18
Table 1.2 SL responses School type Number of
responses %
Primary 462 63 Secondary 211 29 Special 15 2 Independent 44 6 Total 734 100
Table 1.3 NQT responses
School type Number of responses
%
Primary 193 50 Secondary 160 42 Special 14 4 Independent 16 4 Total 386 100
Sample scrutiny Finally, for quality control, the samples were compared and scrutinized alongside data from the Annual School Census. This was to assess how representative the samples were and whether there was notable fluctuation in the composition of the samples. In essence this was to examine whether the findings discussed in this report might be a result of sampling problems rather than a genuine reflection of the population. An overview of this can be found in appendix 1. Overall the sample was found to be representative in terms of percentage of pupils eligible for free school meals (used as a proxy measure for deprivation level of the school). The findings suggest that there was some geographical bias evident in all of the senior leader samples. However, when this was corrected for (using weighting), the impact on the research findings was little to none. This suggests that geography is not a major influence on the outcome variables considered in this report. We decided to use un-weighted data throughout the analyses in this report. This maintains consistency so that the statistical findings can be directly compared with those reported previously. We simply note that the samples have undergone scrutiny, some evidence of geographical bias identified but that this bias has little / no impact on the findings and their final interpretation.
Analysis The statistical analyses in chapters 2-6 draw on data collected for the senior leader and NQT surveys for 2008 and 2010. These analyses are structured so that the 2010 findings are presented first. Following this, the 2010 findings are compared with the 2008 findings. The 2010 findings are presented initially for the whole sample of senior leader and NQT respondents respectively. Following this, differences relating to school type (i.e. primary and secondary school) are examined. Analysis is also given by independent and special schools where numbers are sufficient. In addition to this, analysis by percentage of pupils eligible for free school meals is presented. This scale variable was split into quartiles to produce a categorical variable with four categories (least deprived, lower middle, upper middle and most deprived). Chi-square tests of association are used to assess whether these differences are statistically significant (and hence expected to be found within the respective populations represented by the 2010 senior leader and NQT surveys). In addition to Chi-square tests, Cramer's V statistics are used to add detail on the strengths of association (see appendix 2 for details of these tests).

19
Examining changes / difference between the 2010 and 2008 findings is done using cross-sectional comparison for both the senior leader and the NQT surveys1. Where there is a statistically significant change this is presented in a table2
. Statistically significant change between 2008 and 2010 is identified through the use of 95% confidence intervals. If these intervals do not overlap, the change can be stated as being statistically significant (and hence be expected to reflect the pattern found within the wider senior leader / NQT populations) (see appendix 2 for detail on confidence intervals).
11 There is an element of longitudinality for the SLT surveys (where the same SLT completed the 2008 and 2010 surveys). However, this longitudinality is not consistent enough to allow the valid use of longitudinal statistical analysis techniques and so a cross-sectional approach is adopted. 2 A caveat here relates to whether a comparison is actually possible. If the nature/wording of a questionnaire item was changed between the 2008 and 2010 surveys this is possible (for example, see the 'routes into the profession' chapter, section 2)

20
2. Routes into the profession
Chapter Summary
Senior leaders' appointment of NQTs from various ITE routes • In primary schools there is a clear preference for NQTs from the undergraduate route;
almost two-thirds expressed this preference. However, only just over a third of vacancies were filled by candidates from this route.
• Among secondary-based respondents, while a third expressed a preference for employment-based routes this was not reflected in appointments made (approximately one sixth came from this route). A similar but smaller disconnect occurred in the primary sector.
Routes taken by NQTs in our survey
• Three-quarters of secondary NQT respondents and half of primary NQT respondents came from the PGCE route, a very similar picture to our 2008 survey.
• Forty percent of primary NQT respondents came from undergraduate routes, compared with less than five percent of secondary NQT respondents.
• Fourteen percent of secondary respondents compared with seven percent of primary respondents came from employment-based routes.
Senior leaders' perceptions of effectiveness of ITE routes
• Senior leaders responding to our 2010 survey viewed the undergraduate route as the most effective route in preparing NQTs to work in their school in comparison with the PGCE and employment based routes.
• Analysis by route and school type reveals clear preferences among primary respondents for the undergraduate route, followed by PGCE and employment based routes when thinking about their relative effectiveness.
• Secondary respondents found the PGCE to be the most effective route; employment-based routes were also highly valued with the undergraduate route seen as the least effective.
Senior leaders' perspectives on level of classroom experience among NQTs from various ITE routes
• Among respondents to our 2010 survey there was a clear recognition that employment-based routes offered the most appropriate level of classroom experience for trainees, and this was especially the case for our secondary respondents.
• Among secondary respondents the PGCE was rated the second most appropriate route in terms of classroom experience, but among primary respondents the undergraduate route was rated second.

21
2.1.1 Senior leaders' responses Our 2010 survey of school senior leaders asked two related questions: from which ITE route do the majority of applicants for your NQT vacancies come through; and which route do you prefer them to have taken. Previous years' surveys allowed respondents to indicate a preference for more than one route making comparison across the data problematic. This raises issues in identifying preferred routes from this survey data alone. The differences between route preferred and route come from suggest that senior leaders have a difficulty selecting one route as their preferred route. Our qualitative data provides a much richer picture of the issues here indicating that senior leaders often select applicants for interview on the basis of the strength of their application and/or the ITE provider rather than route per se, indeed interviewees often discussed the advantages and disadvantages of each route when asked about preferences.
Route
Table 2.1 Routes come from and routes preferred (SL responses) Route come
from % Route
preferred % PGCE 63 37 UG teaching course 27 41 Employment based route 8 18 Other 2 4 Total n 657 541
Overall, as we can see from Table 2.1 senior leaders were far more likely to appoint from the PGCE route than the undergraduate route which reverses the picture suggested by their preferred route. Another indication that preferred route is not always the decisive factor when it comes to recruitment is the difference between the two figures for the employment based routes. We analysed route come from and route preferred by school type, revealing significantly different patterns for primary and secondary respondents. Note there were a high number of missing answers for route preferred (193), also there were a number of open comments indicating no preference. The reason for the missing answers may be that respondents found it hard to state one preferred route since each has its advantages and disadvantages (as revealed from the qualitative data).
School type
Table 2.2 ITE route come from by school type (SL responses) PGCE % UG teaching
course % Employment
based route % Total n P Cramer's V
Primary 54 40 6 402 p<0.01 0.34
Secondary 85 7 9 194
School type
Table 2.3 ITE route preferred by school type (SL responses) PGCE
% UG teaching
course % Employment
based route % Total
n P Cramer's V
Primary 26 60 14 330 p<0.01 0.48
Secondary 62 8 30 144
Tables 2.2 and 2.3 show that the disconnect between preferred route and routes come from is larger in the primary sector where there is a significant preference for those from the undergraduate route (60%) but only 40% of vacancies were filled by candidates from this route. Among secondary-based respondents, while 30% expressed a preference for

22
employment based routes this was not reflected in appointments made. A similar but smaller disconnect occurred in the primary sector.
2.1.2 Senior leaders' responses - comparison of 2008 and 2010 surveys As we noted above, in the previous senior leader survey in 2008 respondents indicated preferences for more than one route. The 2010 survey asked respondents to express a preference for one route only, and therefore direct comparisons cannot be easily made. However the overall picture indicates that the pattern is similar to previous years; primary schools tend to prefer the undergraduate route whilst secondary schools tend to favour the PGCE route. The PGCE route is the most common route for NQTs (63%) followed by the undergraduate route (27%). Fewer NQTs come from employment based routes. Two of the key questions asked in the 2010 survey - asking respondents to tell us about their perceptions of the effectiveness of each route in preparing NQTs to work in their school and to rate ITE routes on the level of classroom experience provided - were not asked in 2008 and thus are not available for comparison.
2.2 Actual routes taken by newly qualified teachers
2.2.1 NQT responses Our survey of NQTs enabled us to gather data on the actual route taken by our respondents.
ITE route Table 2.4 NQT respondents by route overall
% PGCE 62 Undergraduate teaching course 23 Employment based route 11 Other 4 Total n 376
School type
Table 2.5 NQT respondents by route and school type PGCE
% Undergraduate
teaching course %
Employment based
route %
Other %
Total n
Primary 49 41 7 3 189
Secondary 75 4 14 7 157 Our NQT respondents came overwhelmingly from the PGCE route with almost two-thirds of all respondents (Table 2.4) and three-quarters of secondary respondents (Table 2.5) from that route. While the undergraduate route is the second most common overall (23% of all respondents, Table 2.4) NQTs from that route are far more commonly employed by primary schools where they make up 41% of respondents. This situation is reversed for those from employment based routes who are twice as likely to be working in the secondary as the primary sector (Table 2.5). Comparative analysis reveals no significant difference from our 2008 survey.
2.3 Views of effectiveness of different routes overall
2.3.1 Senior leaders' responses We asked respondents to tell us about their perceptions of the effectiveness of each route in preparing NQTs to work in their school, and further analysed this by school type.

23
Route Table 2.6 Perspectives on effectiveness by ITE route (SL responses)
Very effective
%
Effective %
Adequate %
Ineffective %
Very ineffective
%
Total n
PGCE 18 52 27 2 0 684 Undergraduate teaching course e.g. BA, BSc
25 54 17 4 0 571
Employment based route eg. GTP, RTP
26 42 27 4 1 547
Senior leaders viewed the undergraduate route as the most effective route in preparing NQTs to work in their school (combining very effective and effective) in relation to the PGCE and employment based routes (Table 2.6). Table 2.7 Perspectives on effectiveness by ITE route and school type (SL responsesRoute
) School
type Very
effective/ effective
%
Adequate %
Ineffective/ Very
ineffective %
Total n
Sig C's V
PGCE Primary 62 34 3 429
p<0.01 0.26 Secondary 87 13 0 203 Undergraduate teaching e.g. BA, BSc
Primary 86 12 2 388 p<0.01 0.3 Secondary 60 29 11 140
Employment based route e.g. GTP, RTP
Primary 61 31 8 315 p<0.01 0.19 Secondary 78 20 2 190
It is clear from our data that each of the three main ITE routes are rated highly in appropriate contexts. Even where there was a clear preference for one route over the others the percentages that highly rated the alternative routes (to their first preference) never fell below 60% when very effective and effective were combined. Analysis by route and school type reveals significant preferences among primary respondents for the undergraduate route (86%), followed by PGCE (62%) and employment based routes (61%), when thinking about their relative effectiveness. There was also a significant difference in the views of secondary respondents' who found the PGCE to be the most effective (87%) . Employment based routes were also highly valued (78%) with only 60% rating the undergraduate route most effective.
2.4 Views on the level of effective classroom experience offered by ITE routes
2.4.1 Senior leaders' responses We asked respondents to rate ITE routes on the extent to which each route provided an effective level of classroom experience.

24
Table 2.8 Responses to the question 'to what extent does each route provide an effective level of classroom experience for NQTs?' (SL responses)
Route To a large extent %
To some extent %
Not at all %
Total n
PGCE 39 59 2 688 Undergraduate teaching e.g.BA, BSc 54 43 3 597 Employment based e.g. GTP, RTP 73 26 1 584
There was a clear recognition among our respondents that the employment based routes offered the most effective level of classroom experience, though when to a large extent and to some extent are combined there is little variation.
Table 2.9 Responses to the question 'to what extent does each route provide an effective level of classroom experience for NQTs?' by school type (SL responses
Route
) School
type To a large
extent %
To some extent
%
Not at all %
Total n
Sig C's V
PGCE Pri 28 70 3 435
p<0.01 0.32 Sec 60 40 0 202
Undergraduate teaching course e.g. BA, BSc
Pri 65 35 1 405 p<0.01 0.34 Sec 29 64 7 150
Employment based route e.g. GTP, RTP
Pri 68 30 2 344 p<0.01 0.18 Sec 83 17 0 196
Analysis by school type shows that respondents from both sectors believed that employment based routes offered the most effective level of classroom experience for NQTs. However, by looking at the differential between the most and least effective we can see that secondary respondents expressed support for the notion that employment based routes offered the most effective level of classroom experience far more strongly than did primary respondents. There was also a reversal of the route rated second; among secondary respondents the PGCE was believed by 60% to offer the most effective level of classroom experience (but only 28% of primary respondents), while among primary respondents 65% believed that the undergraduate route offered the most effective level of classroom experience (compared with only 29% of secondary respondents). Among secondary respondents the undergraduate route was found not at all effective by 7% of respondents.

25
3. NQT recruitment
Chapter summary
This chapter presents senior leader and NQT responses to the 2010 surveys on recruitment processes and outcomes. We present findings on where schools place adverts suitable for NQTs and where NQTs look for adverts and the pattern of applications, interviews and job offers as reported by NQTs. We then present the pattern of recruitment by key stage for primary schools and by subject for secondary schools and the difficulties encountered as reported by senior leaders. Differences by school type and FSM quartile are reported where the differences are statistically significant. Where appropriate, comparisons are made between senior leader and NQT responses. Where we have comparable data in the 2008 and 2010 surveys comparisons are reported. The key findings were: Advertising for NQTs
• Just over three-quarters of all schools regularly placed adverts suitable for NQTs on the local authority website or in local authority bulletins and just over two-fifths used the TES Online or TES hard copy. Primary schools made greater use of local authority websites and bulletins, secondary schools made greater use of TES Online and hard copy.
• There was some mismatch between where senior leaders placed adverts for posts suitable for NQTs and sources used by NQTs themselves. NQTs rely heavily on internet sources to locate adverts, making the greatest use of TES Online (regularly used by 75% of NQTs) and local authority websites (63%). Primary NQTs make greatest use of local authority websites while secondary NQTs make greatest use of TES online.
• Local authorities do not operate recruitment pools in all areas, but where they do senior leaders are largely positive about their usefulness for recruiting good quality NQTs.
• Most schools (74%) do not target NQTs in adverts but advertise for main scale teachers, although primaries target NQTs more frequently than secondary schools.
Application, interview and job offer patterns • Most NQTs (69%) apply for five or fewer posts. Primary NQTs apply for more posts
than secondary NQTs. Just over half of NQTs were invited to attend one or two interviews and just over a third attended between three and five interviews.
• The majority of NQTs (68%) attended one or two interviews and a further 27% attended between three and five interviews. The vast majority of NQTs (95%) were offered one or two posts. There was no significant variation in application, interview and job offer patterns by school type.
NQT appointments • Primary schools were more likely to have appointed NQTs recently to KS2 (80% of
primaries) or KS1 (71%) compared with the Foundation Stage (54%). Secondary schools were most likely to have appointed NQTs in English, Mathematics and General/Combined Science (more than 75% of secondaries in each case) and least

26
likely to have appointed NQTs to teach PSHE, Physics or Chemistry (less than 40% in each case).
• Sixty percent of primary schools and 50% of secondary schools had recruited at least some NQTs to temporary posts. The least deprived schools appointed significantly fewer NQTs to temporary posts compared with other schools.
Difficulties in recruitment • Primary schools found it slightly harder to recruit to Foundation Stage posts
compared with KS1 and KS2, although for each key stage over 75% of primary schools reported it was not very or not at all difficult to recruit to posts in each key stage.
• The most deprived schools faced the greatest difficulties recruiting NQTs to the Foundation Stage.
• The most difficult subjects to recruit NQTs to in secondary schools are Physics (45% of schools that recruited physics teachers reporting difficulties), Mathematics (43% reporting difficulties), Chemistry (38%) and General/Combined Science (31%). Given that over three quarters of secondary schools had recruited an NQT to teach Mathematics and the same to teach General/Combined Science this is clearly a particular problem of supply in these subjects.
• Whilst there were few differences in difficulty of recruitment to different key stages in primary schools between 2008 and 2010, the picture overall was better in 2010 in secondaries. For almost all secondary subjects, a smaller proportion of senior leaders reported difficulties in recruiting in 2010 compared with 2008. The difference was particularly significant for Physics (76% of schools that recruited NQTs to teach Physics in 2008 reported difficulties, compared with 45% in 2010) and ICT (54% in 2008, 43% in 2010).
• Nearly a fifth of schools (18%) of schools reported difficulties in recruitment because they had to appoint to temporary rather than permanent posts. This was perceived as a significantly more difficult problem in primary schools.

27
3.1 Placement of advertising
3.1.1 Senior leaders' responses We asked senior leaders where they placed adverts when they had vacancies for NQTs, and asked NQTs which of these sources they used in searching for jobs. Their responses are shown below.
Figure 3.1 Advert placement (SL responses)
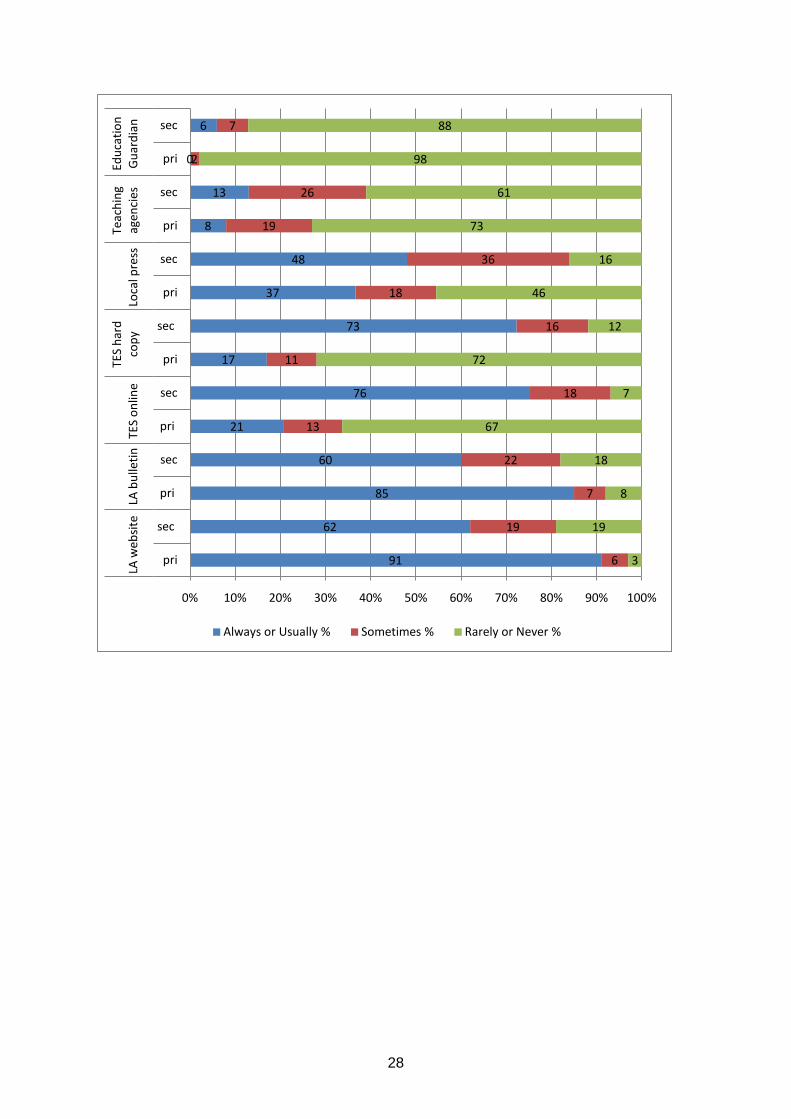
Figure 3.1 illustrates that schools most frequently use either a local authority website (used always or usually by 80% of schools) or a local authority bulletin (used always or usually - 75%) to place adverts that are suitable for NQTs. The next most frequently used medium is the TES. TEs Online advertising is used always or usually by 44% of schools and TES hard copy advertising by 41%. The local press is used nearly as frequently as the TES hard copy (always or usually by 40% of schools). Teaching agencies are used infrequently, only being used always or usually by 10% of schools, however a further 21% use them sometimes - which may indicate that they are used for harder to fill vacancies. Very few schools place adverts suitable for NQTs in the Education Guardian (95% rarely or never use the Education Guardian). Figure 3.2 Placement of recruitment advertising by school type (SL responses)
28
91
62
85
60
21
76
17
73
37
48
8
13
0
6
6
19
7
22
13
18
11
16
18
36
19
26
2
7
3
19
8
18
67
7
72
12
46
16
73
61
98
88
0% 10% 20% 30% 40% 50% 60% 70% 80% 90% 100%
pri
sec
pri
sec
pri
sec
pri
sec
pri
sec
pri
sec
pri
secLA
web
site
LA
bul
letin
TES
onlin
e TE
S ha
rd
copy
Lo
cal p
ress
Te
achi
ng
agen
cies
Ed
ucat
ion
Gua
rdia
n
Always or Usually % Sometimes % Rarely or Never %

29
Table 3.1 Placement of recruitment advertising by school type (SL responses) Advert placement
School type
Always %
Usually %
Sometimes %
Rarely %
Never %
Total n
Sig C's V
Local authority website
pri 79 12 6 0 3 407 p<0.01 0.40
sec 40 22 19 6 13 146
Local authority bulletin
pri 73 12 7 2 6 395 p<0.01 0.36
sec 34 26 22 5 13 148
TES online pri 8 13 13 18 49 341
p<0.01 0.63 sec 51 25 18 4 3 194
TES hard copy
pri 7 10 11 18 54 319 p<0.01 0.62
sec 46 27 16 7 5 177
Local press pri 24 13 18 12 34 331
p<0.01 0.34 sec 21 27 36 6 10 159
Teaching agencies
pri 4 4 19 15 58 293 p<0.01 0.24
sec 4 9 26 28 33 121
Education Guardian
pri 0 0 2 15 83 268 NS
sec 3 3 7 22 66 105 As Figure 3.2 and Table 3.1 illustrate there were significant differences between primary and secondary schools in relation to the media they use to place recruitment adverts that are suitable for NQTs. The Cramer's V measure of effect size indicates that the differences are substantial. Secondary schools make much greater use of the TES, both online and in hard copy to place adverts suitable for NQTs than primary schools. Secondary schools also make more use of their local press. Conversely, primary schools make much more use of the local authority websites and bulletins than secondary schools. Although few primary and secondary schools make regular use of teaching agencies, far more primaries never use them (58%) than secondaries (33%). We examined the degree of overlap in use of LA channels (bulletin and website) and TES channels (hard-copy and online). All primary schools in our study who used TES channels were also using LA channels. Approximately one quarter of the primary schools (24.5%) who were using LA channels (n=245) used TES channels as well. This may indicate that TES channels are used by primary schools where LA channels have not been successful in recruiting NQTs. We found a very different picture for secondary schools. 91.5% of those who used LA channels (n=82) also used TES channels and of all those who used TES channels (n=94) 20% did not use any LA channels. This appears to indicate that for secondary schools the TES is most routinely used alongside or even instead of LA channels. In turn this may indicate that primary schools tend to focus on the local recruitment whereas secondary schools adopt a national recruitment strategy.

30
Table 3.2 Placement of recruitment advertising by FSM (senior leader responses) Advert place-ment
FSM category
Always %
Usually %
Some-times
%
Rarely %
Never %
Total n
Sig C's V
TES hard copy
Least deprived 33 14 10 12 31 140
p<0.05 0.39
Lower middle 22 20 16 7 36 133
Upper middle 20 22 10 19 29 133
Most deprived 22 13 14 16 34 126
Local authority bulletin
Least deprived 57 10 7 2 23 134
p<0.01 0.15
Lower middle 66 14 12 2 6 139
Upper middle 57 20 10 3 9 143
Most deprived 57 17 15 5 6 145
Local authority website
Least deprived 62 11 6 2 18 143
p<0.01 0.13
Lower middle 71 13 10 2 4 143
Upper middle 66 18 8 2 6 145
Most deprived 63 14 13 3 7 136
Table 3.2 summarises the data for the three forms of media where there were significant differences by FSM - TES hard copy, local authority bulletins and local authority websites. The tables provide a fairly complex picture overall, but do clearly show that schools in the least deprived areas always used the TES hard copy to advertise posts suitable for NQTs more frequently than schools in less deprived areas and a higher proportion of schools in the least deprived areas never used local authority bulletins or websites than other schools.
3.2 Advertising media used to look for posts
3.2.1 NQT responses In this section we report on the advertising media that NQTs draw on to find recruitment opportunities. NQTs use internet sources more frequently than other media to look for posts (Figure 3.3). The most frequently used source, used always or usually by 75% of NQTs, is the TES Online. In addition 62% of NQTs always or sometimes make use of local authority websites and 37% always or sometimes use the government's school recruitment service web site. Paper-based advertising sources were used less frequently by NQTs to look for posts. For example the difference in use of the TES hard copy (used always or usually by only 20% of NQTs) is substantially less than for the TES online. 55% of NQTs never use teaching agencies to look for posts and only 13% always or usually do.
31
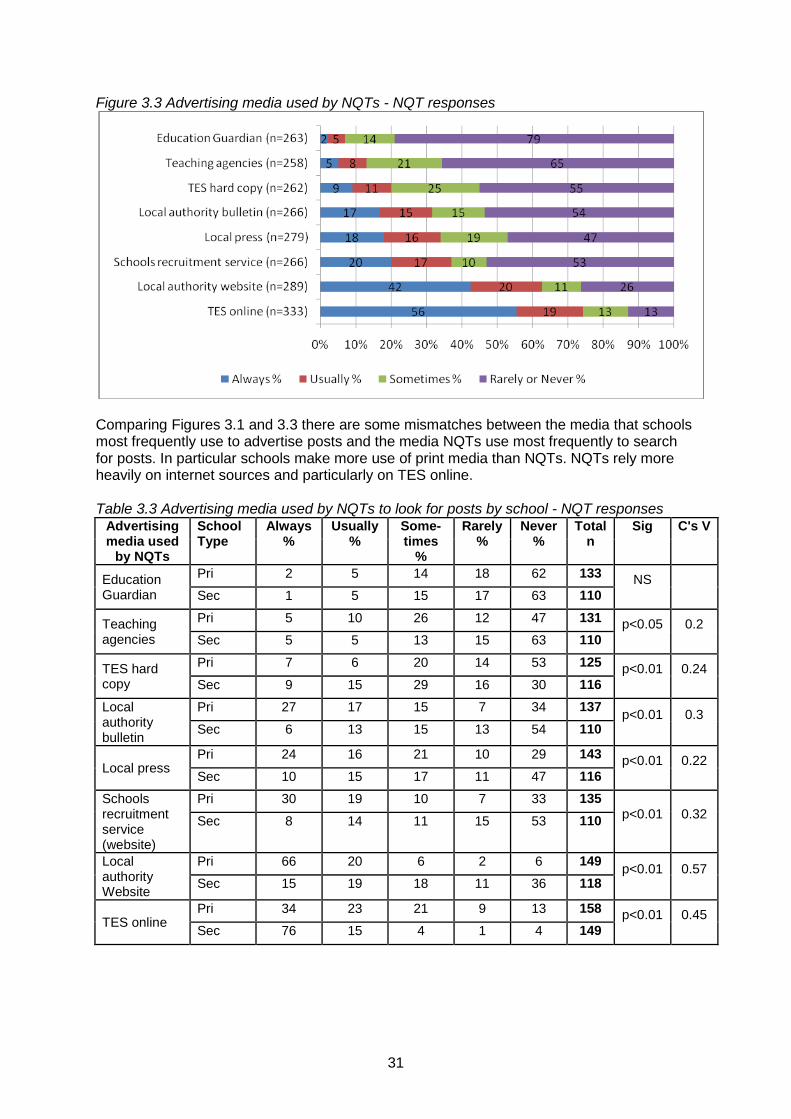
Figure 3.3 Advertising media used by NQTs - NQT responses
Comparing Figures 3.1 and 3.3 there are some mismatches between the media that schools most frequently use to advertise posts and the media NQTs use most frequently to search for posts. In particular schools make more use of print media than NQTs. NQTs rely more heavily on internet sources and particularly on TES online. Table 3.3 Advertising media used by NQTs to look for posts by school - NQT responses
Advertising media used
by NQTs
School Type
Always %
Usually %
Some-times
%
Rarely %
Never %
Total n
Sig C's V
Education Guardian
Pri 2 5 14 18 62 133 NS
Sec 1 5 15 17 63 110
Teaching agencies
Pri 5 10 26 12 47 131 p<0.05
0.2 Sec 5 5 13 15 63 110
TES hard copy
Pri 7 6 20 14 53 125 p<0.01
0.24 Sec 9 15 29 16 30 116
Local authority bulletin
Pri 27 17 15 7 34 137 p<0.01
0.3 Sec 6 13 15 13 54 110
Local press Pri 24 16 21 10 29 143 p<0.01
0.22
Sec 10 15 17 11 47 116 Schools recruitment service (website)
Pri 30 19 10 7 33 135 p<0.01
0.32
Sec 8 14 11 15 53 110
Local authority Website
Pri 66 20 6 2 6 149 p<0.01
0.57 Sec 15 19 18 11 36 118
TES online Pri 34 23 21 9 13 158 p<0.01
0.45
Sec 76 15 4 1 4 149
32
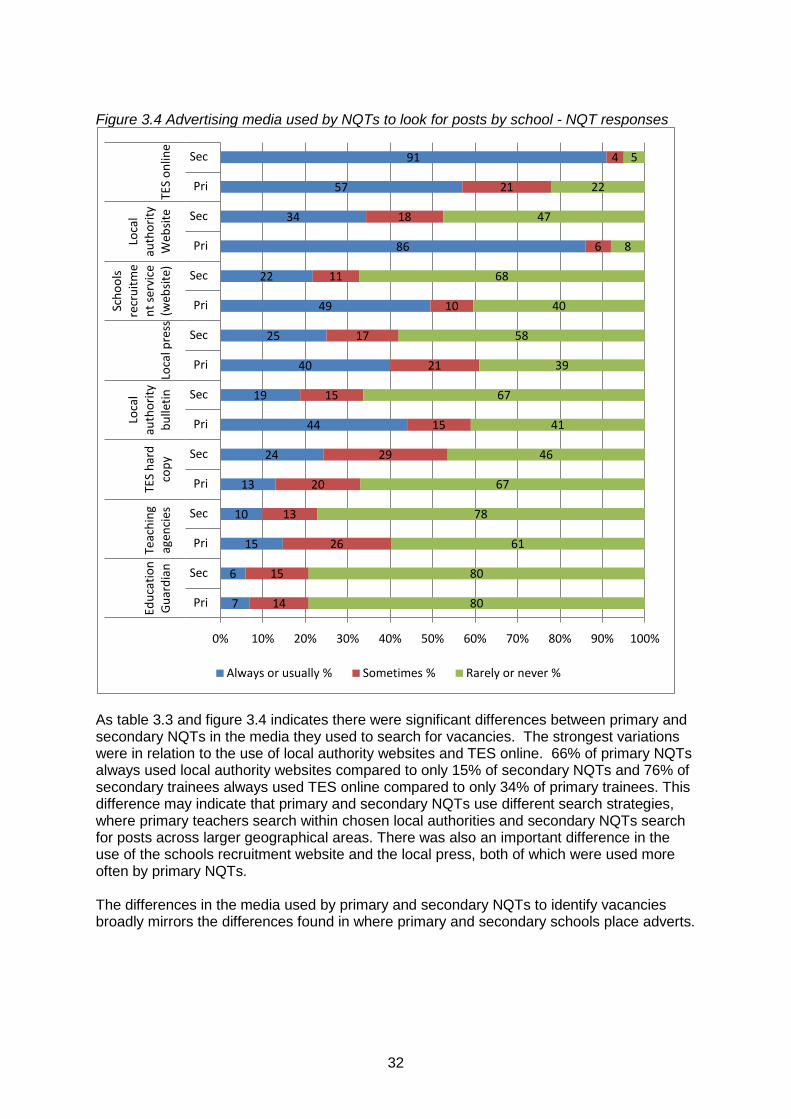
Figure 3.4 Advertising media used by NQTs to look for posts by school - NQT responses
As table 3.3 and figure 3.4 indicates there were significant differences between primary and secondary NQTs in the media they used to search for vacancies. The strongest variations were in relation to the use of local authority websites and TES online. 66% of primary NQTs always used local authority websites compared to only 15% of secondary NQTs and 76% of secondary trainees always used TES online compared to only 34% of primary trainees. This difference may indicate that primary and secondary NQTs use different search strategies, where primary teachers search within chosen local authorities and secondary NQTs search for posts across larger geographical areas. There was also an important difference in the use of the schools recruitment website and the local press, both of which were used more often by primary NQTs. The differences in the media used by primary and secondary NQTs to identify vacancies broadly mirrors the differences found in where primary and secondary schools place adverts.
7
6
15
10
13
24
44
19
40
25
49
22
86
34
57
91
14
15
26
13
20
29
15
15
21
17
10
11
6
18
21
4
80
80
61
78
67
46
41
67
39
58
40
68
8
47
22
5
0% 10% 20% 30% 40% 50% 60% 70% 80% 90% 100%
Pri
Sec
Pri
Sec
Pri
Sec
Pri
Sec
Pri
Sec
Pri
Sec
Pri
Sec
Pri
SecEd
ucat
ion
Gua
rdia
nTe
achi
ng
agen
cies
TE
S ha
rd
copy
Loca
l au
thor
ity
bulle
tinLo
cal p
ress
Scho
ols
recr
uitm
ent
ser
vice
(w
ebsi
te)
Loca
l au
thor
ity
Web
site
TES
onlin
e
Always or usually % Sometimes % Rarely or never %

33
3.3 Placement of advertising and advertising media where NQTs look for posts
3.3.1 Comparison of 2008 and 2010 surveys We compared senior leader responses to where they placed adverts suitable for NQTs in 2008 to those given in 2010. There were no significant differences. Table 3.4 Advertising media used by NQTs to look for posts - (NQT responses) -comparison 2008 and 2010
Always
% Usually
% Some-times
%
Rarely %
Never %
Total n
Lower 95% CI
Upper 95% CI
Local authority bulletin 2008 28.2 15.4 17.9 9.2 29.2 195 21.9 34.5
Local authority bulletin 2010 17.3 14.7 14.7 9.8 43.6 266 12.8 21.8
We also compared the 2008 and 2010 surveys in relation to where NQTs said they looked for posts. The only significant difference that was found was in their use of the local authority bulletin which had reduced over time.
3.4 Use of the LA pool for recruitment
3.4.1 Senior leaders' responses Around a fifth of senior leaders indicated through an open question that they had used the LA pool for recruitment to some extent. These comments ranged from single case use or historical involvement, through to those who used the pool regularly as their primary mechanism for recruitment. It was clear from some comments that an LA pool no longer existed in certain areas or local authorities. Where the scheme did operate and a comment on its effectiveness had been made, around two-thirds of the senior leader respondents (101) stated that they found the LA pool for recruitment to be of at least a satisfactory standard, and in the vast majority of these cases they thought it highly effective. They highlighted reasons such as providing good quality NQTs, 'it helps to narrow the search for NQTs', and 'the NQTs we have interviewed from the pool are able to understand the diversity and needs of the local area'. A very small minority of comments (seven) explicitly stated that the quality of the pool was variable or ineffectual and two senior leaders downplayed the scale of the pool - ' more a puddle than a pool - we have to be self sufficient'. A further seven senior leaders thought that candidates from the LA pool were of inferior quality since the 'best' candidates inevitably got recruited earliest. Other comments suggested that the LA pool although helpful, formed just one of many different strategies utilised by schools to enable them to find a suitable candidate. For example one senior leader commented that ' it works in tandem with TES on line'. Other issues raised by just a few respondents each were: that the usefulness of the pool depends on the time of year; information on the availability of recruits from the pool is not always kept up to date; schools still need to observe and conduct interviews themselves; and schools involved in the LA interviewing process are able recruit the highest quality candidates from the pool. Only a few senior leaders (14) commented on changes in the effectiveness of particular LA recruiting pools since 2008. There responses were mixed, some reporting improvements,

34
for example in the rigour of LA processes and others charting the decline or loss of what was an effective LA pool for reasons such as discontinuation, merger or privatisation.
3.5 Targeted recruitment
3.5.1 Senior leaders' responses We asked senior leaders if they specifically advertised for NQTs or recruited generally for main scale teachers in their recruitment advertising. We found that the majority (74%) advertise for main scale teachers and do not specifically highlight posts, 22% specifically targeted NQTs, and 4% targeted both NQTs and main scale teachers (n=641). Figure 3.5 Targeted recruitment by school type (SL responses)
p=<0.01, CV=0.12 There was a significant difference in recruitment targeting between primary and secondary schools (Figure 3.5).Primary schools more often specifically targeted NQTs than secondary schools. There were no significant differences in senior leader responses in targeting recruitment by FSM.
3.6 Application, interview and job offer patterns
3.6.1 NQT responses We asked NQTs a set of questions to ascertain the number of posts they applied for, the number of interviews they had been invited to and had attended and the number of jobs they were offered. It is important to note here that the responses are all from NQTs who were in post and do not take account of trainee teachers who were unsuccessful in securing an NQT post. The unsuccessful trainees may well have a different pattern of applications to successful trainees. The responses are summarised below.
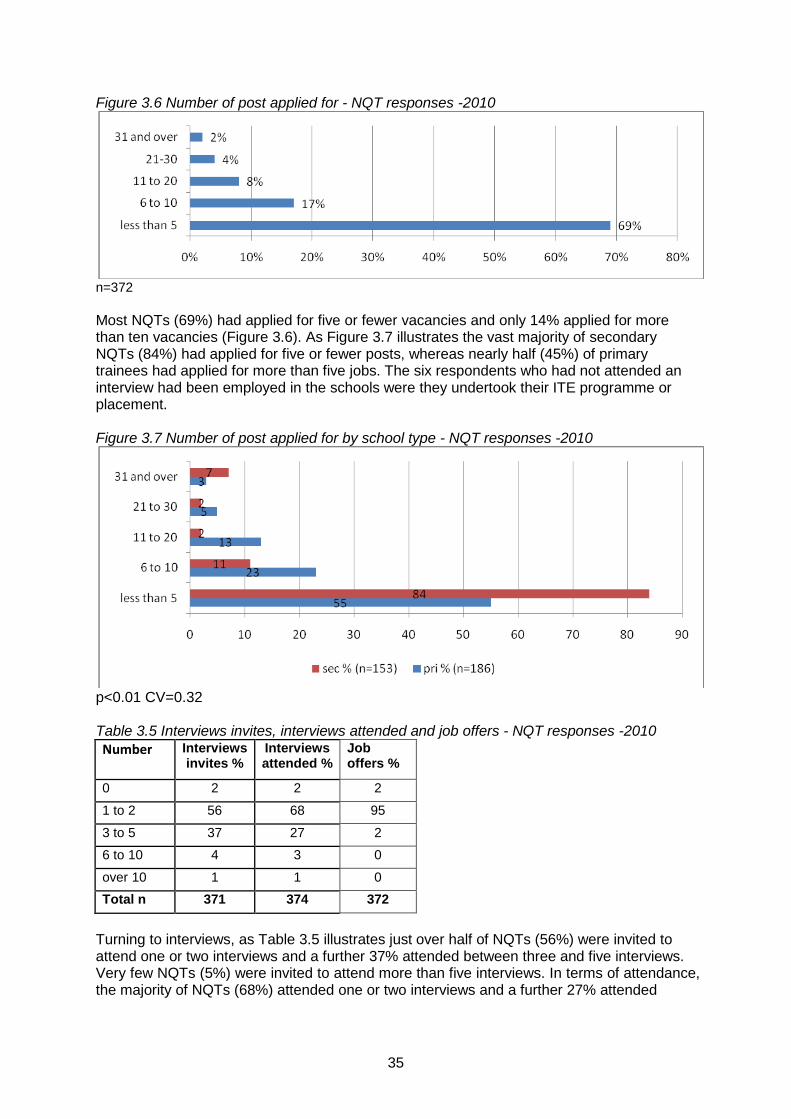
35
Figure 3.6 Number of post applied for - NQT responses -2010
n=372 Most NQTs (69%) had applied for five or fewer vacancies and only 14% applied for more than ten vacancies (Figure 3.6). As Figure 3.7 illustrates the vast majority of secondary NQTs (84%) had applied for five or fewer posts, whereas nearly half (45%) of primary trainees had applied for more than five jobs. The six respondents who had not attended an interview had been employed in the schools were they undertook their ITE programme or placement. Figure 3.7 Number of post applied for by school type - NQT responses -2010
p<0.01 CV=0.32 Table 3.5 Interviews invites, interviews attended and job offers - NQT responses -2010 Number Interviews
invites % Interviews attended %
Job offers %
0 2 2 2
1 to 2 56 68 95
3 to 5 37 27 2
6 to 10 4 3 0
over 10 1 1 0 Total n 371 374 372
Turning to interviews, as Table 3.5 illustrates just over half of NQTs (56%) were invited to attend one or two interviews and a further 37% attended between three and five interviews. Very few NQTs (5%) were invited to attend more than five interviews. In terms of attendance, the majority of NQTs (68%) attended one or two interviews and a further 27% attended

36
between three and five interviews. Very few (4%) attended more than five. The vast majority of NQTs (95%) were offered one or two posts and none were offered more than five. There were no significant differences in the pattern of interview invitation, attendance or job offers by school type.
3.7 Interview and job offer patterns
3.7.1 NQT responses - comparison of 2008 and 2010 surveys We compared NQTs responses on interview invitations, interview attendance and job offers made between the 2008 and 2010 surveys and found no significant differences.
3.8 Appointing NQTs
3.8.1 Senior leader responses Senior leaders were asked if they had recruited any NQTs to different key stages and subjects. Figure 3.8 Proportion of primary schools that had recruited an NQT in particular key stages since 2008 (SL responses) - %
Figure 3.9 Proportion of secondary schools that had recruited an NQT in particular subjects since 2008 (SL responses) - %
80
71
54
0 10 20 30 40 50 60 70 80 90
KS2 (n=358)
KS1 (n=373)
Foundation (n=358)
84
78
76
64
59
59
51
45
42
39
32
14
0 10 20 30 40 50 60 70 80 90
English (n=202)
Mathematics (n=179)
General Science (n=188)
MFL (n=171)
ICT (n=179)
DT (n=192)
History (n=170)
Geography (n=163)
Biology (n=132)
Chemistry (n=128)
Physics (n=124)
PSHE (n=152)
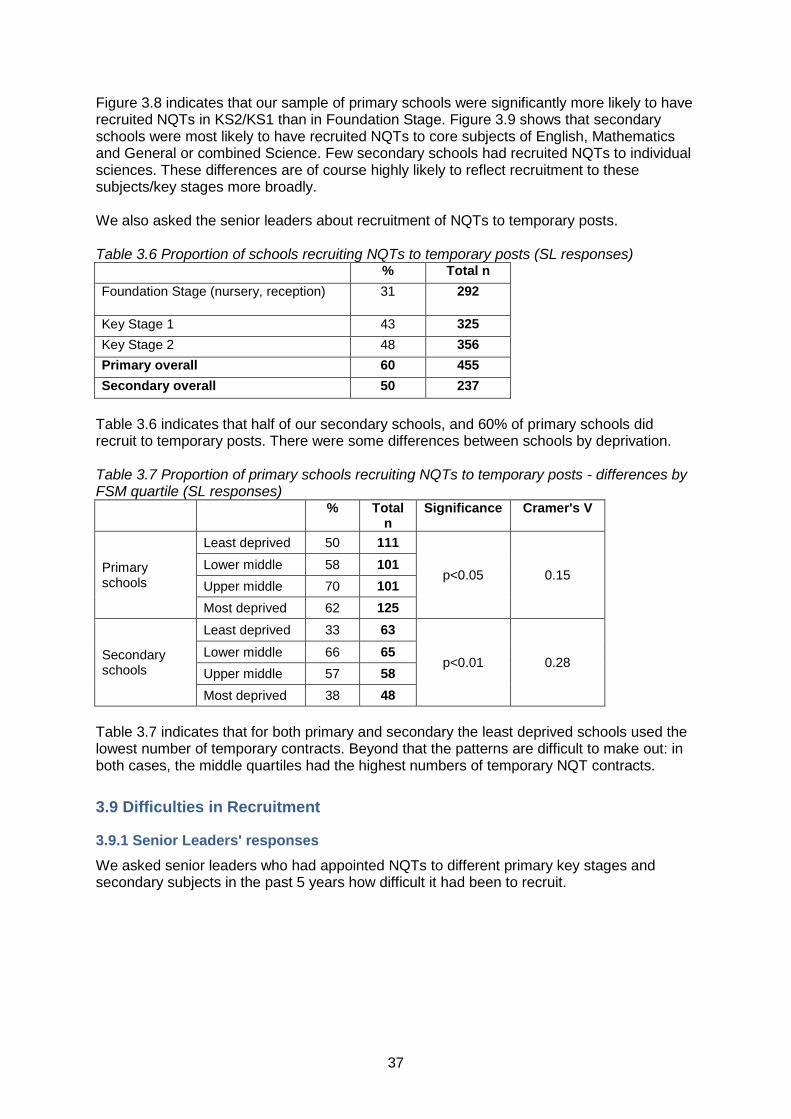
37
Figure 3.8 indicates that our sample of primary schools were significantly more likely to have recruited NQTs in KS2/KS1 than in Foundation Stage. Figure 3.9 shows that secondary schools were most likely to have recruited NQTs to core subjects of English, Mathematics and General or combined Science. Few secondary schools had recruited NQTs to individual sciences. These differences are of course highly likely to reflect recruitment to these subjects/key stages more broadly. We also asked the senior leaders about recruitment of NQTs to temporary posts. Table 3.6 Proportion of schools recruiting NQTs to temporary posts (SL responses) % Total n Foundation Stage (nursery, reception) 31 292
Key Stage 1 43 325 Key Stage 2 48 356 Primary overall 60 455 Secondary overall 50 237
Table 3.6 indicates that half of our secondary schools, and 60% of primary schools did recruit to temporary posts. There were some differences between schools by deprivation. Table 3.7 Proportion of primary schools recruiting NQTs to temporary posts - differences by FSM quartile (SL responses)
% Total
n Significance Cramer's V
Primary schools
Least deprived 50 111
p<0.05 0.15 Lower middle 58 101 Upper middle 70 101 Most deprived 62 125
Secondary schools
Least deprived 33 63
p<0.01 0.28 Lower middle 66 65 Upper middle 57 58 Most deprived 38 48
Table 3.7 indicates that for both primary and secondary the least deprived schools used the lowest number of temporary contracts. Beyond that the patterns are difficult to make out: in both cases, the middle quartiles had the highest numbers of temporary NQT contracts.
3.9 Difficulties in Recruitment
3.9.1 Senior Leaders' responses We asked senior leaders who had appointed NQTs to different primary key stages and secondary subjects in the past 5 years how difficult it had been to recruit.
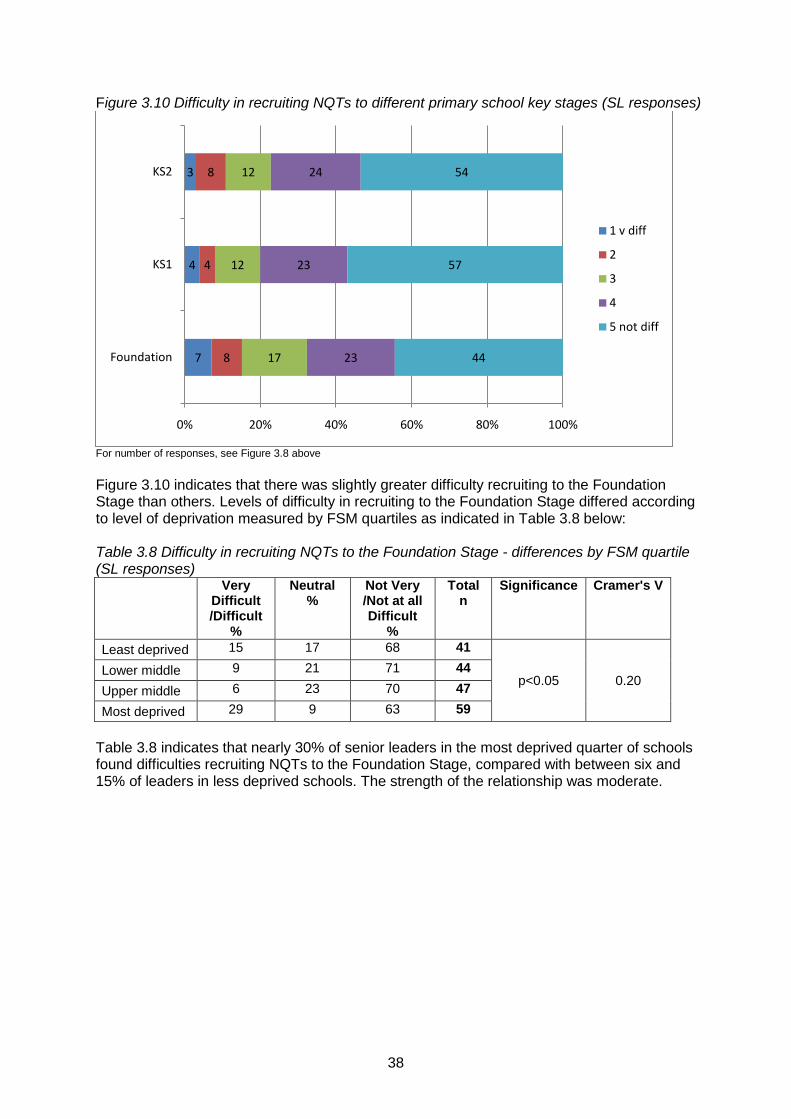
38
Figure 3.10 Difficulty in recruiting NQTs to different primary school key stages (SL responses)
For number of responses, see Figure 3.8 above Figure 3.10 indicates that there was slightly greater difficulty recruiting to the Foundation Stage than others. Levels of difficulty in recruiting to the Foundation Stage differed according to level of deprivation measured by FSM quartiles as indicated in Table 3.8 below: Table 3.8 Difficulty in recruiting NQTs to the Foundation Stage - differences by FSM quartile (SL responses)
Very Difficult /Difficult
%
Neutral %
Not Very /Not at all Difficult
%
Total n
Significance Cramer's V
Least deprived 15 17 68 41
p<0.05 0.20 Lower middle 9 21 71 44
Upper middle 6 23 70 47
Most deprived 29 9 63 59 Table 3.8 indicates that nearly 30% of senior leaders in the most deprived quarter of schools found difficulties recruiting NQTs to the Foundation Stage, compared with between six and 15% of leaders in less deprived schools. The strength of the relationship was moderate.
7
4
3
8
4
8
17
12
12
23
23
24
44
57
54
0% 20% 40% 60% 80% 100%
Foundation
KS1
KS2
1 v diff
2
3
4
5 not diff

39
Figure 3.11 Difficulty in recruiting NQTs to different secondary subjects (SL responses)
For number of responses, see Figure 3.9 above Figure 3.11 above indicates that the most difficult subjects to recruit NQTs to in secondary schools are Physics, Mathematics, Chemistry and General/Combined Science. Given that 78% of secondary schools had recruited an NQT to teach Mathematics and 76% to teach General/Combined Science (See Figure 3.9), this is clearly a particular problem in these subjects.
3.9.2 Senior leaders' responses - comparison of 2008 and 2010 surveys We were able to make comparisons between the perceived difficulty in recruiting to different key stages and different subjects in 2008 and 2010. The statistical comparison we used compared the proportions of respondents agreeing that recruitment to each key stage or subject was difficult or very difficult. Table 3.9 Proportion of SLs reporting difficulty in recruiting NQTs to different primary key stages - comparisons over time (SL responses) Key Stage 2008
% 2010
% Foundation Stage 13 16 Key Stage 1 7 8 Key Stage 2 11 11
The differences in reported difficulty recruiting to the different primary key stages were small - they appeared to have increased slightly in each case - and did not approach statistical significance as indicated in Table 3.9 above.
1
1
2
8
6
7
6
7
13
22
19
32
5
8
11
8
10
11
17
16
18
16
24
13
18
15
32
40
20
25
19
19
26
24
16
13
33
33
25
28
32
31
30
26
21
20
20
23
43
42
30
16
32
26
29
32
22
16
22
19
0% 20% 40% 60% 80% 100%
History
Geography
Biology
PSHE
English
MFL
ICT
DT
Science
Chemistry
Maths
Physics
1 v diff
2
3
4
5 not diff
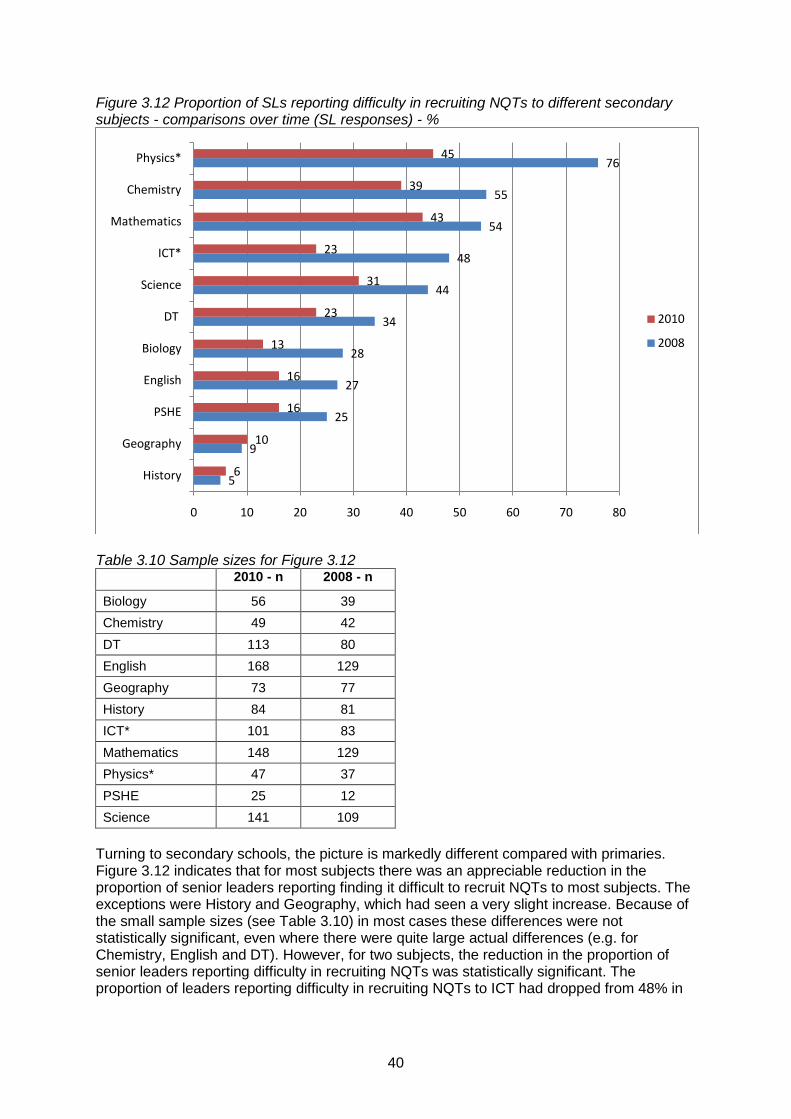
40
Figure 3.12 Proportion of SLs reporting difficulty in recruiting NQTs to different secondary subjects - comparisons over time (SL responses) - %
Table 3.10 Sample sizes for Figure 3.12 2010 - n 2008 - n
Biology 56 39 Chemistry 49 42 DT 113 80 English 168 129 Geography 73 77 History 84 81 ICT* 101 83 Mathematics 148 129 Physics* 47 37 PSHE 25 12 Science 141 109
Turning to secondary schools, the picture is markedly different compared with primaries. Figure 3.12 indicates that for most subjects there was an appreciable reduction in the proportion of senior leaders reporting finding it difficult to recruit NQTs to most subjects. The exceptions were History and Geography, which had seen a very slight increase. Because of the small sample sizes (see Table 3.10) in most cases these differences were not statistically significant, even where there were quite large actual differences (e.g. for Chemistry, English and DT). However, for two subjects, the reduction in the proportion of senior leaders reporting difficulty in recruiting NQTs was statistically significant. The proportion of leaders reporting difficulty in recruiting NQTs to ICT had dropped from 48% in
5
9
25
27
28
34
44
48
54
55
76
6
10
16
16
13
23
31
23
43
39
45
0 10 20 30 40 50 60 70 80
History
Geography
PSHE
English
Biology
DT
Science
ICT*
Mathematics
Chemistry
Physics*
2010
2008
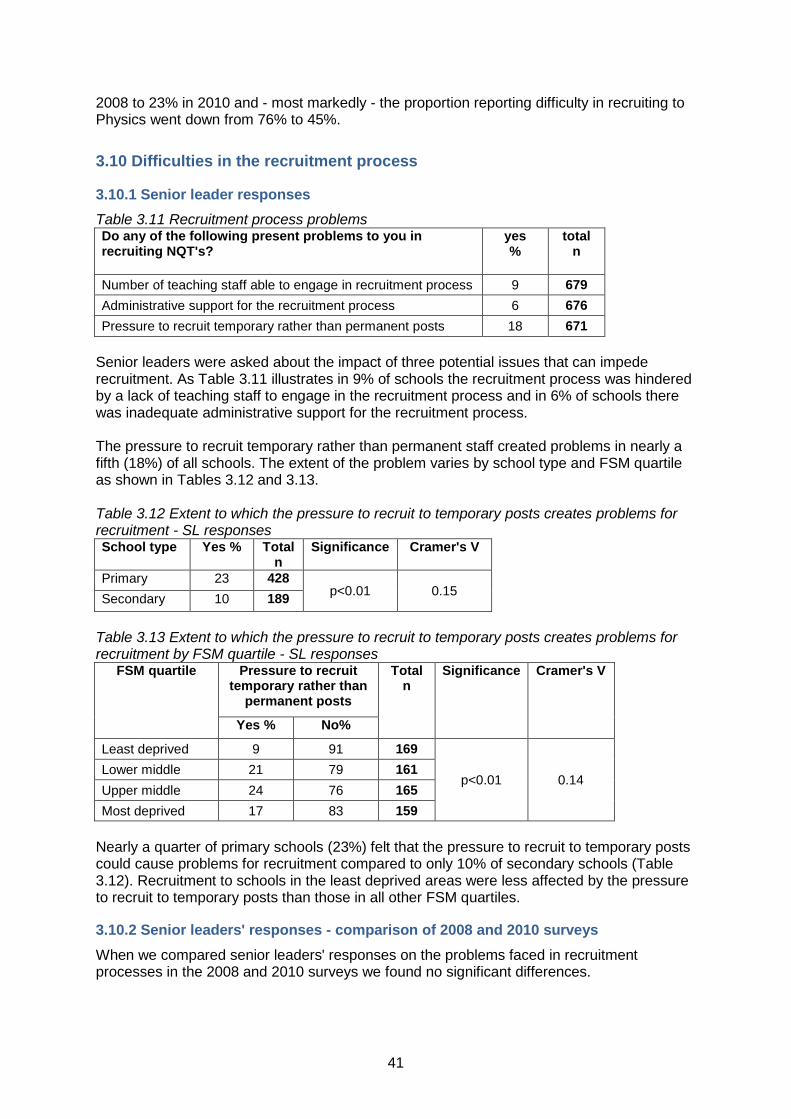
41
2008 to 23% in 2010 and - most markedly - the proportion reporting difficulty in recruiting to Physics went down from 76% to 45%.
3.10 Difficulties in the recruitment process
3.10.1 Senior leader responses Table 3.11 Recruitment process problems Do any of the following present problems to you in recruiting NQT's?
yes %
total n
Number of teaching staff able to engage in recruitment process 9 679 Administrative support for the recruitment process 6 676 Pressure to recruit temporary rather than permanent posts 18 671
Senior leaders were asked about the impact of three potential issues that can impede recruitment. As Table 3.11 illustrates in 9% of schools the recruitment process was hindered by a lack of teaching staff to engage in the recruitment process and in 6% of schools there was inadequate administrative support for the recruitment process. The pressure to recruit temporary rather than permanent staff created problems in nearly a fifth (18%) of all schools. The extent of the problem varies by school type and FSM quartile as shown in Tables 3.12 and 3.13. Table 3.12 Extent to which the pressure to recruit to temporary posts creates problems for recruitment - SL responses School type Yes % Total
n Significance Cramer's V
Primary 23 428 p<0.01 0.15 Secondary 10 189
Table 3.13 Extent to which the pressure to recruit to temporary posts creates problems for recruitment by FSM quartile - SL responses
FSM quartile Pressure to recruit temporary rather than
permanent posts
Total n
Significance Cramer's V
Yes % No%
Least deprived 9 91 169
p<0.01 0.14 Lower middle 21 79 161 Upper middle 24 76 165 Most deprived 17 83 159
Nearly a quarter of primary schools (23%) felt that the pressure to recruit to temporary posts could cause problems for recruitment compared to only 10% of secondary schools (Table 3.12). Recruitment to schools in the least deprived areas were less affected by the pressure to recruit to temporary posts than those in all other FSM quartiles.
3.10.2 Senior leaders' responses - comparison of 2008 and 2010 surveys When we compared senior leaders' responses on the problems faced in recruitment processes in the 2008 and 2010 surveys we found no significant differences.

42
4. NQT induction
Chapter Summary
This chapter presents senior leader responses to the 2010 survey on induction support and processes and usefulness of local authority induction programmes. It also presents NQT responses to the 2010 survey in relation to induction support and processes, and participation in the PPD programme. Differences by school type and FSM quartile on all these measures are reported where the differences are statistically significant. Where appropriate, comparisons are made between senior leader and NQT responses. The chapter also compares responses to similar questions on induction in the 2008 and 2010 surveys and reports items where analysis indicates that there are statistically significant differences. The key findings were: Common induction programme
• In 2010 nearly all schools had a common induction programme in place. There had been a significant increase in the number of secondary schools having a common induction programme in place since 2008 to the point of almost universal coverage in 2010.
Induction support • In 2010 senior leaders in over 90% of all schools reported that those aspects of
induction set out in the induction statutory guidance, i.e.10% release from NQTs' timetables, provision of an induction tutor, opportunities to observe other teachers, training courses and use of TDA standards, were always available to NQTs.
• Primary schools provided more opportunities for NQTs to visit other schools and greater access to local authority training programmes than secondary schools. Secondary schools more often enabled NQTs to undertake masters work, offered in-house induction programmes, support from mentors and coaches, and used the career entry development profile more than primary schools.
• Greater use of local authority induction programmes was made by schools in more deprived areas.
• Broadly NQT respondents agreed with senior leaders about the relative availability of different types of support, however they perceived that less support was available than their senior leaders claimed was offered.
• Comparison of senior leader responses in the 2008 and 2010 surveys revealed a statistically significant decline in the use of the TDA standards, the career entry development profile, written individual programmes and the provision of support from a mentor or coach who was not the NQT’s designated induction tutor over time. The decline in the use of an additional mentor or coach and of written programmes was particularly marked in primary schools.
Induction processes • Senior leaders reported that in most schools one member of the teaching staff
oversees NQT induction and in nearly three quarters of schools other staff are also designated to support NQTs. Fewer NQTs in primary schools were provided with access to an additional mentor than in secondary schools.

43
• Senior leaders in around three quarters of all schools reported that there were explicit
processes for monitoring and evaluating NQT induction. Fewer NQTs were aware of these processes. More secondary schools had processes for formal monitoring and evaluation of induction than primary schools.
• Just under half of all schools’ senior leaders, and around a third of all NQTs, reported that there were explicit processes for supporting NQTs to work with support staff. Support for working with support staff was more frequently available in primary than secondary schools.
• Governors rarely had involvement in NQT induction.
• There were no significant differences over time in relation to induction processes. Local authority induction programmes
• Sixty one percent of senior leaders thought that local authority induction programmes were useful and a further twenty nine percent had a neutral opinion. Primary senior leaders were more positive about the usefulness of local authority programmes than senior leaders in secondary schools.
• Senior leaders thought that local authority induction programmes could be improved by:
o More formal and informal opportunities for NQTs to network with each other o More content related to behaviour management, chid protection, special
educational needs, and working with support staff o Differentiating training o More consultation and collaboration between schools and the local authority
to design and deliver the training o Organising training at times that provide greater accessibility for NQTs (e.g.
twilights) o Practical sessions that are delivered by skilled practitioners with recent school
experience o Clearer communication of dates and times o Less paperwork
Participation in Postgraduate professional development (PPD) programmes
• Just under a third of all NQTs were participating in a PPD programme. More NQTs in secondary schools were participating than in primary schools.
4.1 Induction support
4.1.1 Senior leader responses We asked senior leaders about whether they had a common induction programme for NQTs and the types of induction support they provided for NQTs in their schools. Their responses are set out below:

44
Figure 4.1 Provision of a common induction programme all schools and by school type (SL responses)
Figure 4.1 indicates that 97% of all schools provided a common induction for NQTs (n=627). Special schools used a standard induction slightly less frequently than other types of school. Figure 4.2 Types of induction support (SL responses)
As Figure 4.2 shows, in the vast majority of schools (98%) NQTs were always given 10% release from their timetable, had an induction tutor (96%), had opportunities to observe other teachers (94%), attended training courses (92%) and were supported through the use of

45
TDA standards (91%). Most schools (86%) provided an in-house induction programme and approximately three-quarters (76%) provided their NQTs with access to a local authority induction programme. Other forms of support - use of the career entry development profile, provision of another mentor or coach, a written individual programme, support in working with teaching assistants and visits to other schools - were also used to support trainees in most schools. However, these forms of support were not made available as consistently as timetable release, provision of an induction tutor, opportunities to observe, attend training or use of the TDA standards. Few schools (9%) always provided NQTs with opportunities for masters study. This was sometimes made available in a further 41% of schools. Table 4.1 Types of induction support by school type (SL responses) Type of induction support
School type
Always include
%
Some-times
include %
Never include
%
Total n
Sig C's V
10% time release from timetable
Pri 99 1 1 455 NV Sec 98 1 0 207
Induction tutor Pri 95 3 2 449
NV
Sec 99 1 0 207
Observing other teachers
Pri 94 6 0 451 NS
Sec 93 7 0 208
Training courses Pri 95 4 0 453
NV
Sec 85 15 0 206
Using TDA standards
Pri 90 8 2 449 NV
Sec 94 6 0 206
In house induction programme
Pri 81 15 4 435 p<0.01 0.19 Sec 95 5 0 206
Local Authority Induction programme
Pri 89 10 1 451 p<0.01 0.35 Sec 59 32 10 205
Career Entry Development Profile (CEDP)
Pri 75 17 8 440 p<0.05 0.11 Sec 77 21 2 202
Other mentor/coach
Pri 68 26 6 428 p<0.01 0.18 Sec 84 15 1 205
Written individual programme
Pri 69 24 7 434 NS
Sec 65 31 4 202
Help/support in working with Teaching Assistants
Pri 61 34 4 450 NS
Sec
54 42 4 202
Visits to other schools
Pri 67 32 1 450 p<0.01 0.38 Sec 30 60 10 205
Masters work supported by HEI
Pri 4 34 62 382 p<0.01 0.35 Sec 16 56 27 195
Table 4.1 shows that there were some variations in the types of induction support offered in primary and secondary schools. Using Cramer's V as an indicator of effect size, variation was greatest between primary and secondary schools in relation to the provision of opportunities for visits to other schools, participation in local authority training programmes and participation in masters study. Primary schools provided more opportunities for NQTs to
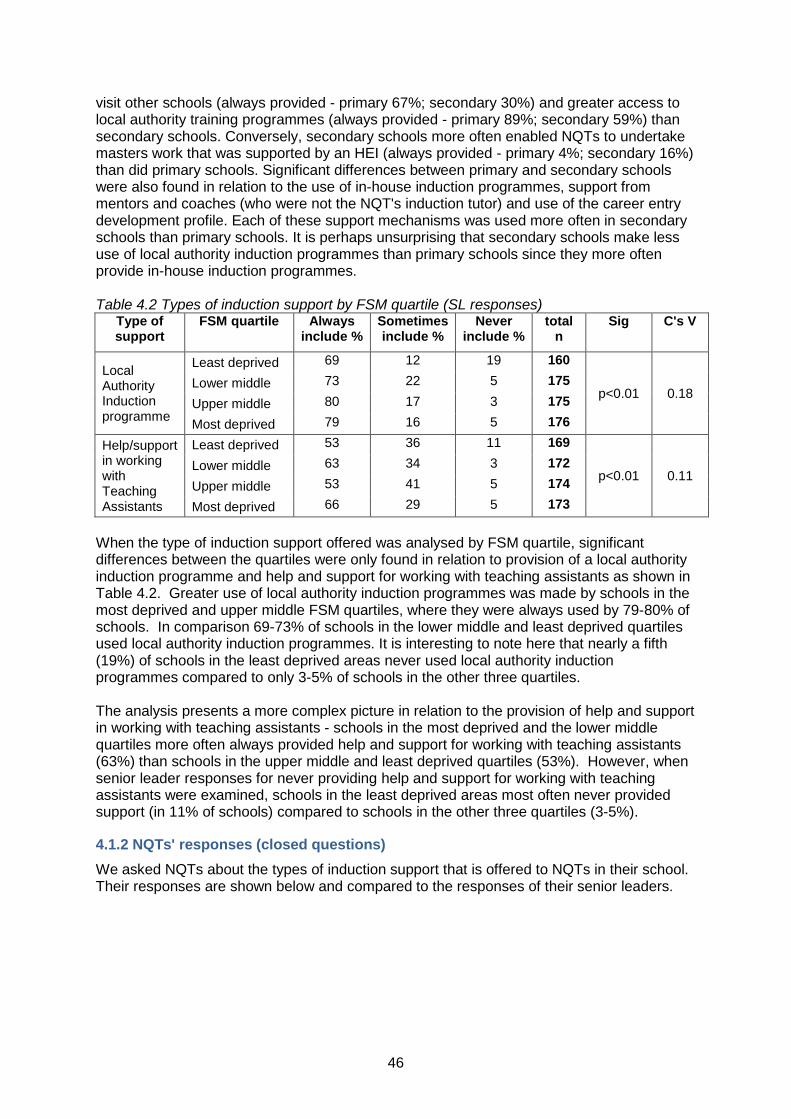
46
visit other schools (always provided - primary 67%; secondary 30%) and greater access to local authority training programmes (always provided - primary 89%; secondary 59%) than secondary schools. Conversely, secondary schools more often enabled NQTs to undertake masters work that was supported by an HEI (always provided - primary 4%; secondary 16%) than did primary schools. Significant differences between primary and secondary schools were also found in relation to the use of in-house induction programmes, support from mentors and coaches (who were not the NQT's induction tutor) and use of the career entry development profile. Each of these support mechanisms was used more often in secondary schools than primary schools. It is perhaps unsurprising that secondary schools make less use of local authority induction programmes than primary schools since they more often provide in-house induction programmes. Table 4.2 Types of induction support by FSM quartile (SL responses)
Type of support
FSM quartile Always include %
Sometimes include %
Never include %
total n
Sig C's V
Local Authority Induction programme
Least deprived 69 12 19 160
p<0.01 0.18 Lower middle 73 22 5 175
Upper middle 80 17 3 175
Most deprived 79 16 5 176
Help/support in working with Teaching Assistants
Least deprived 53 36 11 169
p<0.01 0.11 Lower middle 63 34 3 172
Upper middle 53 41 5 174
Most deprived 66 29 5 173 When the type of induction support offered was analysed by FSM quartile, significant differences between the quartiles were only found in relation to provision of a local authority induction programme and help and support for working with teaching assistants as shown in Table 4.2. Greater use of local authority induction programmes was made by schools in the most deprived and upper middle FSM quartiles, where they were always used by 79-80% of schools. In comparison 69-73% of schools in the lower middle and least deprived quartiles used local authority induction programmes. It is interesting to note here that nearly a fifth (19%) of schools in the least deprived areas never used local authority induction programmes compared to only 3-5% of schools in the other three quartiles. The analysis presents a more complex picture in relation to the provision of help and support in working with teaching assistants - schools in the most deprived and the lower middle quartiles more often always provided help and support for working with teaching assistants (63%) than schools in the upper middle and least deprived quartiles (53%). However, when senior leader responses for never providing help and support for working with teaching assistants were examined, schools in the least deprived areas most often never provided support (in 11% of schools) compared to schools in the other three quartiles (3-5%).
4.1.2 NQTs' responses (closed questions) We asked NQTs about the types of induction support that is offered to NQTs in their school. Their responses are shown below and compared to the responses of their senior leaders.

47
Figure 4.3 Types of induction support (NQT responses) – percent and comparison to SL responses
NQT n=383; SL n as Figure 4.2 Figure 4.3 shows that NQT’s perceptions were that the most frequently available types of support were: 10% release from timetable (97%); induction tutor (93%); observing other tutors (87%); and training courses (84%). Just over three quarters of the NQT respondents reported using the TDA standards and the Career Entry Development profile as part of induction. Broadly NQT and senior leader data shows agreement about the relative availability of different types of support i.e., which types of support are more and less frequently available. However, as we have consistently found in our surveys and case studies for this project, NQTs perceive that less support is available than their senior leaders claim is offered. The comparison being made in Figure 4.3 is between the percentage of NQTs answering yes to whether the type of support is offered and the percentage of senior leaders reporting that the type of support is always available in their school. This difference in perceptions was most
97
93
87
84
79
77
69
64
64
48
43
42
20
98
96
94
92
91
75
75
76
86
68
56
59
9
0 20 40 60 80 100 120
10% time release from timetable
Induction tutor
Observing other teachers
Training courses
Using TDA standards
Career entry development profile (CEDP)
Other mentor/coach e.g. member of SLT responsible for CPD
Local authority induction programme
In house induction programme
Written individual programme
Visits to other schools
Help/support in working with teaching assistants
Masters work supported by HEI
SL-always provide % NQT %

48
marked in relation to in-house induction (NQTs 64%, senior leaders 86%), written individual programme (NQTs 48%, SLs 68%), and help/support in working with teaching assistants (NQTs 42%, SLs 59%). There was also at least a 10% difference in perceptions in relation to visits to other schools (NQTs 43%, senior leaders 56%), local authority induction programme (NQTs 64%, senior leaders 76%), and using TDA standards (NQTs 79%, senior leaders 91%). However, in relation to master's level work supported by an HEI, a much higher proportion of NQTs (20%) than senior leaders (9%) reported that it was offered. This may, in part, be accounted for by some NQTs initiating participation in master's level courses themselves and not seeking school support for this. Table 4.3, below, analyses NQTs responses on the types of induction support offered by school type. Table 4.3 Types of induction support by school type (NQT responses) Type of Support School
Type* % Significance Cramer's V
10% Time Release From Timetable
pri 97 NS sec 97
Induction Tutor pri 92 p<0.05 0.12 sec 97
Observing Other Teachers pri 91 p<0.05 0.13 sec 82
Training Courses pri 92 p<0.01 0.25 sec 73
Using TDA Standards pri 82 NS sec 77
Career Entry Development Profile (CEDP)
pri 83 p<0.05 0.13 sec 72
Other Mentor/Coach i.e Member Of SLT Responsible For CPD
pri 58 p<0.01 0.25 sec 81
Local Authority Induction Programme
pri 78 p<0.01 0.26 sec 53
In House Induction Programme
pri 51 p<0.01 0.32 sec 81
Written Individual Programme
pri 58 p<0.01 0.19 sec 38
Visits To Other Schools pri 60 p<0.01 0.4 sec 21
Help/Support In Working With Teaching Assistants
pri 53 p<0.01 0.22 sec 31
Masters Work Supported By HEI
pri 16 p<0.05 0.13 sec 26
* pri n=191, sec n=159 Table 4.3 shows that there was a significant difference between the responses from NQTs in primary schools and the NQTs in secondary schools in relation to all types of support, with the exception of 10% release from timetable and using TDA standards. Use of Cramer’s V indicates that the variations were greatest in relation to in-house induction programmes,
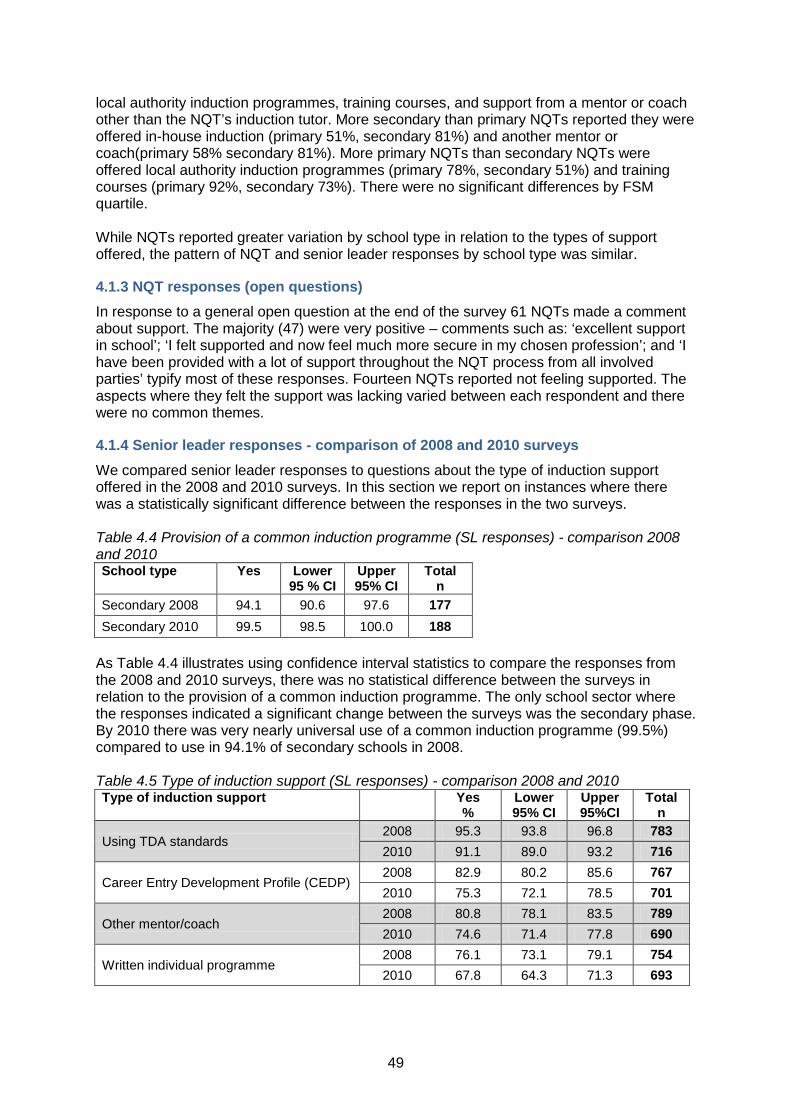
49
local authority induction programmes, training courses, and support from a mentor or coach other than the NQT’s induction tutor. More secondary than primary NQTs reported they were offered in-house induction (primary 51%, secondary 81%) and another mentor or coach(primary 58% secondary 81%). More primary NQTs than secondary NQTs were offered local authority induction programmes (primary 78%, secondary 51%) and training courses (primary 92%, secondary 73%). There were no significant differences by FSM quartile. While NQTs reported greater variation by school type in relation to the types of support offered, the pattern of NQT and senior leader responses by school type was similar.
4.1.3 NQT responses (open questions) In response to a general open question at the end of the survey 61 NQTs made a comment about support. The majority (47) were very positive – comments such as: ‘excellent support in school’; ‘I felt supported and now feel much more secure in my chosen profession’; and ‘I have been provided with a lot of support throughout the NQT process from all involved parties’ typify most of these responses. Fourteen NQTs reported not feeling supported. The aspects where they felt the support was lacking varied between each respondent and there were no common themes.
4.1.4 Senior leader responses - comparison of 2008 and 2010 surveys We compared senior leader responses to questions about the type of induction support offered in the 2008 and 2010 surveys. In this section we report on instances where there was a statistically significant difference between the responses in the two surveys. Table 4.4 Provision of a common induction programme (SL responses) - comparison 2008 and 2010 School type Yes Lower
95 % CI Upper 95% CI
Total n
Secondary 2008 94.1 90.6 97.6 177 Secondary 2010 99.5 98.5 100.0 188
As Table 4.4 illustrates using confidence interval statistics to compare the responses from the 2008 and 2010 surveys, there was no statistical difference between the surveys in relation to the provision of a common induction programme. The only school sector where the responses indicated a significant change between the surveys was the secondary phase. By 2010 there was very nearly universal use of a common induction programme (99.5%) compared to use in 94.1% of secondary schools in 2008. Table 4.5 Type of induction support (SL responses) - comparison 2008 and 2010 Type of induction support Yes
% Lower 95% CI
Upper 95%CI
Total n
Using TDA standards 2008 95.3 93.8 96.8 783 2010 91.1 89.0 93.2 716
Career Entry Development Profile (CEDP) 2008 82.9 80.2 85.6 767 2010 75.3 72.1 78.5 701
Other mentor/coach 2008 80.8 78.1 83.5 789 2010 74.6 71.4 77.8 690
Written individual programme 2008 76.1 73.1 79.1 754 2010 67.8 64.3 71.3 693

50
Turning to the type of induction support offered, Table 4.5 shows that in schools overall there was a statistically significant difference in the use of the TDA standards (2008 - 95.3%, 2010 - 91.1%),. the career entry development profile (2008 - 82.9%, 2010 - 75.3%) written individual programmes (2008 - 76.1%, 2010 - 67.8%) and the provision of support from an additional mentor or coach (2008 - 80.8, 2010 - 74.6) between the surveys. Each of these types of support was offered less frequently in 2010 than in 2008. Table 4.6 Type of induction support by school type (SL responses) - comparison 2008 and 2010 Type of induction support School
type Always
include% Lower 95% CI
Upper 95% CI
Total n
Other mentor/coach 2008 Pri 77.3 73.7 80.9 507 Other mentor/coach 2010 Pri 68.5 64.1 72.9 428 Written individual programme 2008 Pri 78.9 75.4 82.4 512 Written individual programme 2010 Pri 68.7 64.3 73.1 434
Table 4.6 reports those types of induction support where there was a significant difference between the two surveys when examined at the level of school type. In primary schools there has been a significant decline in the use of written individual programmes (2008 - 78.9%, 2010 - 68.7%) and the provision of support from an additional mentor or coach (2008 -77.3%, 2010 - 68.5%).
4.1.5 NQT responses - comparison of 2008 and 2010 surveys There were no significant changes in the NQT responses to the types of induction support offered over time.
4.2 Induction processes
4.2.1 Senior leaders' responses We asked senior leaders about the induction processes for NQTs in their school. Their responses are shown below. Table 4.7 Induction processes (SL responses) Induction process % (n=725) One member of teaching staff overseeing NQT induction 93 Other teaching staff designated to support NQTs 73 Governors involved in induction 13 Explicit monitoring of NQT induction 81 Explicit evaluation of NQT induction 72 Explicitly supporting NQTs in working with support staff 44
As the senior leader responses summarised in Table 4.7 indicate, in most schools (93%) one member of the teaching staff oversaw NQT induction and in nearly three-quarters of schools (73%) other staff were also designated to support NQTs. Governor involvement in NQT induction was low, only occurring in 13% of schools. Monitoring and evaluation of NQT induction was undertaken in around three quarters of all schools (81% and 72% respectively). In just under half of all schools (44%) induction includes explicit processes for supporting NQTs working with support staff.

51
Table 4.8 Induction processes by school type (SL responses) Induction Process School
type % Significance Cramer's V
One member of teaching staff overseeing NQT induction
Pri 91 p<0.01 0.13
Sec 98
Other teaching staff designated to support NQTs
Pri 66 p<0.01 0.21
Sec 86
Governors involved in induction Pri 14
NS Sec 12
Explicit monitoring of NQT induction
Pri 78 p<0.05 0.1
Sec 86
Explicit evaluation of NQT induction
Pri 68 p<0.01 0.12
Sec 80
Explicitly supporting NQTs in working with support staff
Pri 46 NS
Sec 39 pri n=457, sec n=207 The effect size calculations in Table 4.8 indicate that the greatest variation found between primary and secondary schools, is in respect of whether other teaching staff are designated to support NQTs. This occurred less frequently in primary schools than secondary schools (primary 66%, secondary 86%), and may reflect the smaller staffing base in primary schools. There were also fewer instances of one member of staff overseeing NQT induction in primary than secondary schools (primary 91%, secondary 98%), again this may reflect difference in the staffing base and the number of NQTs in the school. Significantly more secondary schools than primary schools had formal processes for monitoring and evaluating NQT induction. There was no significant difference by school type in relation to whether governors were involved in induction. There were no significant differences in induction processes by FSM.
4.2.2 NQT responses We asked NQTs similar questions about their perceptions of induction processes. Table 4.9 Induction processes (NQT responses) –comparison to SL responses Induction process NQT %
(n=377) SL %
(n=725) one member of teaching staff overseeing my induction 95 NA* other teaching staff designated to support me 50 NA* governors involved in my induction 4 13 explicit monitoring of my induction 57 81 explicit evaluation of my induction 60 72 being supported to work effectively with teaching assistants 38 46 being supported to work effectively with other support staff 33
*These items are not directly comparable as they are likely to be interpreted differently by NQTs and SLs, for example SLs are likely to interpret ‘one member of teaching staff overseeing induction’ as a managerial/ co-ordinating role whereas NQTs are likely to interpret this as meaning their mentor. As Table 4.9 illustrates the vast majority (95%) reported that one member of staff oversaw their induction and half (50%) reported that other teaching staff were also designated to offer support. NQTs rarely (4%) reported any governor involvement in their induction. Just over

52
half of NQTs were aware that their induction was explicitly being monitored (57%) and evaluated (60%). Around a third of NQTs reported that they were being supported to work effectively with teaching assistants (38%) and other support staff (33%). Again there is a discrepancy between NQTs’ and senior leaders’ perceptions. Only 4% of NQTs thought that governors were involved in their induction, whereas 13% of senior leaders claimed that this was the case in their schools. Senior leaders also more often stated that there were explicit monitoring and evaluation processes for induction than did NQTs. Table 4.10 Induction processes (NQT responses) by school type Induction Process School
type % Significance Cramer's V
One member of teaching staff overseeing my induction
Pri 97 NS Sec 92
Other teaching staff designated to support me
Pri 43 p<0.01 0.14 Sec 58
Governors involved in my induction
Pri 4 NS Sec 5
Explicit monitoring of my induction
Pri 63 p<0.01 0.17 Sec 47
Explicit evaluation of my induction Pri 67
p<0.01 0.16 Sec 51 Being supported to work effectively with teaching assistants
Pri 51 p<0.01 0.27 Sec 25
Being supported to work effectively with other support staff
Pri 41 p<0.01 0.18 Sec 24
Turning to differences in responses between NQTs in primary and secondary schools, Table 4.10 shows that there was a significant difference in relation to whether NQTs received wider support from staff members (primary 43%, secondary 58%). NQTs in secondary schools more frequently reported receiving support from staff other than the staff member designated to oversee their induction. This mirrors the senior leaders’ responses and aligns with our case study findings that showed that secondary teachers frequently drew on a network of support from departmental staff, whereas the opportunities for primary NQTs to do this was more limited. NQTs in primary schools were more aware of explicit processes for the monitoring and evaluation of induction. This difference was significant. This is the reverse of the senior leader responses where secondary senior leaders more frequently claimed that explicit monitoring and evaluation processes were in place than primary senior leaders. These differences may reflect a distinction that needs to be drawn between whether or not processes are in place, which it appears may more frequently be the case in secondary schools, and whether they are visible to NQTs, which given the smaller size of most primary schools may account for the NQT responses. There were no differences in responses by FSM quartile. Aligning with the pattern in senior leaders responses, primary NQTs more frequently reported that they were supported in working with teaching assistants and other support staff than secondary NQTs. However, it is important to note that in primary schools where the

53
proportion of support staff is greatest, still only 51% of NQTs are supported in working with teaching assistants and 41% are supported in working with other support staff. Only a quarter of secondary NQTs are supported in working with teaching assistants (25%) and other support staff (24%).
4.2.3 Senior leader and NQT responses - comparison 2008 and 2010 surveys Our analysis showed that there were no statistically significant differences between the responses given in the 2008 and 2010 surveys in relation to induction processes.
4.3 Local authority induction programmes - ratings of usefulness
4.3.1 Senior leader responses We asked senior leaders how useful they found local authority induction programmes. Figure 4.4 Usefulness of local authority induction programme (SL responses)
n=607 As Figure 4.4 shows, the majority of senior leader respondents thought that local authority training programmes were useful (61% rated their usefulness as point 1 or 2 on a 5 point scale, where 1 is very useful and 5 is not useful at all). Only 11% of senior leaders rated local authority programmes at point 4 or 5 indicating that they did not think them useful. However nearly a third (29%) had a neutral view - rating the programmes at point 3. Table 4.11 Usefulness of local authority induction programme by school type (SL responses)
Very
useful %
2 %
3 %
4 %
Not at all useful
%
Total n
Primary
23 43 28 6 1 418
Secondary
13 38 32 13 5 168
p<0.01, CV=0.21 As Table 4.11 illustrates, senior leaders in primary schools were more positive about the usefulness of local authority induction programmes than senior leaders in secondary schools. 23% of primary senior leaders rated local authority programmes very useful compared to only 13% of senior leaders in secondary schools. The stronger valuing of local authority programmes by senior leaders in primary schools aligns with the earlier finding that primary schools more frequently provide access to local authority induction programme for NQTs than secondary schools. There were no significant differences in the rating of the usefulness of local authority induction programmes by FSM quartile.

54
4.4 Local authority induction programmes - suggested changes to the local authority statutory induction process
4.4.1 Senior leader responses We asked if senior leaders would recommend any changes to the local authority statutory induction process in an open question. A large proportion of the responses indicated a high degree of satisfaction with the current LA induction process, although some mentioned they were fearful of future funding cuts. A few senior leaders (3) felt that their LA did not always provide good value for money or quality with some, such as this leader in an Academy, asserting they would welcome other organisations being involved – ‘I would like to put a stop to the LA's monopoly on being the recognised awarding body, this is now expensive since we converted to academy status’. A further 5 schools had schools had already established alternative arrangements for induction outside of the LA. This was done for a variety of reasons including perceived greater value for money, enhanced quality or because individual schools felt they had sufficient internal expertise. Suggestions for improvement were made about the organisation and costing of the local authority induction process. These included:
• less courses in school time • more twilight sessions • less half day training –combine half days into full days • more funding to cover the costs of release • releasing/paying for NQT release for only specific aspects of the induction sessions
not the whole programme • varied locations • course places should not be restricted • more opportunities for induction throughout the year – not just September
Suggestions were also made about the content of the induction programme. Senior leaders recommended that more observations were organised and that greater attention was paid to:
• behaviour management • child protection issues • special educational needs • working with support staff
A further group of suggestions related to the need for more differentiation of the induction programme. Some local authority inductions were said to replicate the content of ITE courses. Senior leaders wanted an approach more tailored to individuals' needs, one suggesting that a needs analysis should be conducted at the first training session. Another group of suggestions focused around communications and the relationship with the local authority. Senior leaders wanted clearer communication of dates and times and more consultation and collaboration between schools and the local authority, as illustrated by this response – ‘Involve schools in leading the training - ask schools what NQTs need rather than impose what LA think they need’. Senior leaders also wanted more formal and informal opportunities for NQTs to network with each other. This was deemed to be important beyond their first year in teaching - the implication being that if these networks could be set up during students' NQT year they could become ongoing relationships. Alongside this was the suggestion for building cross school observations into the induction process.

55
Inevitably some comments indicated that the induction is only as good as the members of staff delivering the sessions. Senior leaders recommend that sessions should be practical and delivered by skilled practitioners with recent school experience – for example one senior leader stated that ‘It needs to be delivered by recent practitioners to have any credibility and needs to provide practical classroom strategies and subject knowledge’. Other recommendations were less paperwork and greater transparency about what the programme entails. The issue of transparency links to a related point made by a few senior leaders that the LA induction sessions sometimes lacked focus.
4.5 Participation in a PPD programmes
4.5.1 NQT responses We asked NQTs if they were currently participating in a PPD programme - just under a third (29%) were currently participating (n=319). Table 4.12 Current participation in a PPD programme by school type (NQT responses)
School type
Current participation in a PPD course
%
Total n
Significance Cramer's V
yes no pri 21 79 149
p<0.01 0.19 sec 38 62 141
As Table 4.12 shows, significantly more NQTs in secondary schools were undertaking a PPD course than in primary schools (primary 21%, secondary 38%. This aligns with the finding that more secondary than primary NQTs were offered a master programme linked to an HEI.

56
5. Quality and performance
Chapter Summary
This chapter presents senior leader views of the quality of NQTs in relation to a series of performance criteria, and examines to what extent these views differ in 2010 compared with 2008. We then examine senior leaders' perceptions of changes in NQT quality over time, and their satisfaction regarding the choice of NQTs. Finally, we examine NQTs' own views of the value of each ITE route in preparing them for each of the performance criteria, and compare senior leader and NQT views in relation to these criteria. Senior leaders' views on the quality of NQTs
• Senior leaders responding to our 2010 survey were asked to rate NQTs' qualities against a range of competences. Overall they were most satisfied with NQTs' IT skills, commitment to children, their team working skills with teaching colleagues, ability to meet the professional standards, lesson planning, awareness of what the job entails and ability to deal with children.
• Senior leaders were least satisfied with NQTs' ability to deal with parents, preparedness to teach phonics (relevant only in primary schools), team-working skills with non-school colleagues and administrative work.
• Senior leaders in the secondary sector generally rated the abilities of NQTs more highly than primary-based senior leaders. There were statistically significant differences between secondary and primary responses in relation to subject specialism, lesson planning, awareness of what the job entails, meeting the professional standards for teaching and pupil assessment/assessment for learning.
• There were no significant changes in senior leaders' views about the qualities of NQTs between the 2008 and the 2010 surveys.
Senior leaders' perceptions of changes in quality of NQTs over time
• Among senior leaders responding to our 2010 survey almost half believed that the quality of NQTs had increased or slightly increased over the previous three years. Almost half detected no difference and less than ten percent believed there had been a decrease in quality.
• Secondary-based senior leaders were significantly less likely to report a decrease in the general quality of NQTs in the 2010 survey than in the 2008 survey. Among respondents from the primary sector the picture was unchanged.
Satisfaction of senior leaders with their choice of NQTs
• Almost three-quarters of senior leaders responding to our 2010 survey were satisfied or very satisfied with their choice of NQTs over the last three years.
• Analysis by school type shows that secondary respondents were more positive about an increase in quality and less likely than primary respondents to report declining quality.
• There were no significant changes in senior leaders' satisfaction with the choice of NQT candidates between the 2008 and the 2010 surveys.

57
NQTs perceptions of the value of their ITE in preparing them for the role • NQTs responding to our 2010 survey rated their initial teacher education highly
across most of the criteria listed in our survey. Almost half of respondents rated the effectiveness of their preparation for the role as very good in four areas- moving towards meeting the professional standards, commitment to children, working with/in charge of a full class of children and lesson planning. For each of these criteria - and for awareness of what the job entails - over three-quarters of respondents rated their preparation as good or very good.
• The areas identified by NQTs as the weakest in terms of preparation for the role of classroom teacher were administrative work, commitment to parents, team working with non-school colleagues and the ability to deal with parents; in each of these, less than a fifth felt that their ITE offered very good preparation.
• Secondary respondents rated their ITE more highly than primary respondents as good for preparation; four of these differences were significant: subject/specialism knowledge; pupil assessment/assessment for learning; ability to deal with parents; and commitment to parents. In three areas - team working skills with support staff, team working skills with non school colleagues and working with/in charge of a full class of children - primary respondents felt themselves more adequately prepared than secondary peers.
Comparing senior leaders' and NQTs' perceptions of the value of ITE in preparation for the role
• Comparative analysis of NQTs' perceptions of the effectiveness of their ITE with senior leaders' evaluations of their quality using the same criteria shows a relatively high degree of congruence in our 2010 survey data.
• Of the top eight highest ranked criteria in the NQT survey, seven appear in the top eight ranking from the senior leader survey, with three occupying the same position in both rankings.
• However there were some interesting variations. Working with a full class/in charge of a whole class had the third highest rating in the NQT survey, but for senior leaders, NQTs' skills in this area were rated only 10th. Similarly, while NQTs believed that they were relatively well prepared for pupil assessment/assessment for learning; senior leaders found this area one of the weaknesses of NQTs.
• Conversely, IT skills was the highest placed criterion in terms of skills that NQTs exhibit according to senior leaders, but were only placed twelfth in NQTs' ranking of criteria that benefited from their ITE experience.
5.1 NQT quality
5.1.1 Senior leaders' responses We asked senior leaders' about how they would evaluate the quality of NQTs against a list of criteria. Their responses are set out in Figure 5.1:

58
Figure 5.1 Evaluation of the quality of NQTs (SL responses)
In addition to IT skills, senior leaders were most impressed by NQTs' commitment to children, their team working skills with teaching colleagues, their ability to meet the core professional standards, lesson planning, awareness of what the job entails and ability to deal with children, all of which scored values of 75% or more when very good and good were combined. Combining adequate, poor and very poor values shows that NQTs were perceived by senior leaders to be least prepared to deal with parents, to teach phonics, team-working skills with non school colleagues and administrative work (Figure 5.1). We next analysed these values by school type, looking specifically at statistically significant differences between the responses from senior leaders' in the primary and secondary sectors (Table 5.1).
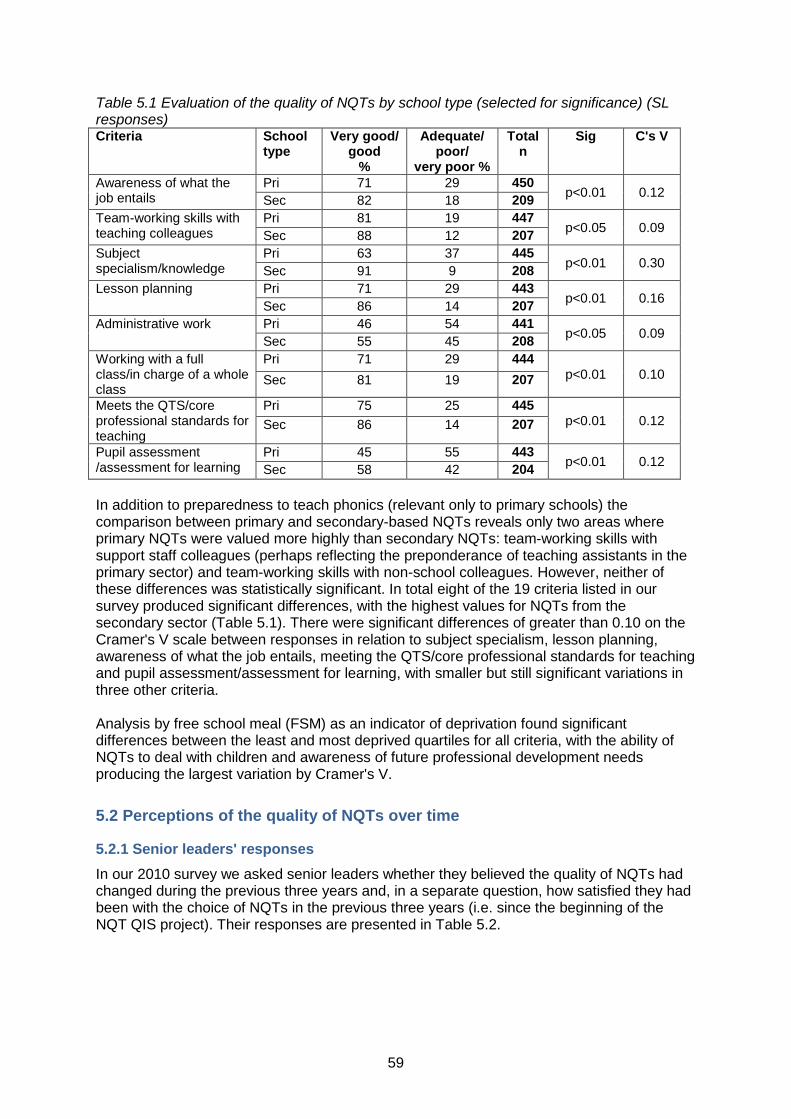
59
Table 5.1 Evaluation of the quality of NQTs by school type (selected for significance) (SL responses) Criteria School
type Very good/
good %
Adequate/ poor/
very poor %
Total n
Sig C's V
Awareness of what the job entails
Pri 71 29 450 p<0.01 0.12 Sec 82 18 209
Team-working skills with teaching colleagues
Pri 81 19 447 p<0.05 0.09 Sec 88 12 207
Subject specialism/knowledge
Pri 63 37 445 p<0.01 0.30 Sec 91 9 208
Lesson planning Pri 71 29 443 p<0.01 0.16 Sec 86 14 207
Administrative work Pri 46 54 441 p<0.05 0.09 Sec 55 45 208
Working with a full class/in charge of a whole class
Pri 71 29 444 p<0.01 0.10 Sec 81 19 207
Meets the QTS/core professional standards for teaching
Pri 75 25 445 p<0.01 0.12 Sec 86 14 207
Pupil assessment /assessment for learning
Pri 45 55 443 p<0.01 0.12 Sec 58 42 204
In addition to preparedness to teach phonics (relevant only to primary schools) the comparison between primary and secondary-based NQTs reveals only two areas where primary NQTs were valued more highly than secondary NQTs: team-working skills with support staff colleagues (perhaps reflecting the preponderance of teaching assistants in the primary sector) and team-working skills with non-school colleagues. However, neither of these differences was statistically significant. In total eight of the 19 criteria listed in our survey produced significant differences, with the highest values for NQTs from the secondary sector (Table 5.1). There were significant differences of greater than 0.10 on the Cramer's V scale between responses in relation to subject specialism, lesson planning, awareness of what the job entails, meeting the QTS/core professional standards for teaching and pupil assessment/assessment for learning, with smaller but still significant variations in three other criteria. Analysis by free school meal (FSM) as an indicator of deprivation found significant differences between the least and most deprived quartiles for all criteria, with the ability of NQTs to deal with children and awareness of future professional development needs producing the largest variation by Cramer's V.
5.2 Perceptions of the quality of NQTs over time
5.2.1 Senior leaders' responses In our 2010 survey we asked senior leaders whether they believed the quality of NQTs had changed during the previous three years and, in a separate question, how satisfied they had been with the choice of NQTs in the previous three years (i.e. since the beginning of the NQT QIS project). Their responses are presented in Table 5.2.

60
Table 5.2 Perceptions of change in the quality of NQTs over the previous three years (SL responses) Scale All % Primary
% Secondary
% Significance Cramer's V
Increased 11 11 12
p<0.05 0.14
Slightly increased 34 31 41
Stayed the same 48 49 43
Slightly decreased 5 6 4
Decreased 2 3 -
Total n 695 436 207
Almost half of respondents believed that the quality had remained unchanged, however 11% believed that the quality had increased and a further 34% that the quality has slightly increased. Seven percent believed that the quality had decreased or slightly decreased. Analysis by school type shows that secondary respondents were more positive about an increase in quality and less likely than primary respondents to report declining quality. Analysis by route revealed no significant differences. We asked how satisfied senior leaders had been over the previous three years (since the beginning of 2008) with the choice of NQTs available to them: Table 5.3 Level of satisfaction with the choice of NQTs over previous three years (SL responses) Scale %
Very satisfied 28
Satisfied 45
Neither satisfied nor dissatisfied 21
Dissatisfied 5
Very dissatisfied 1
Total n 695 Our respondents were overwhelmingly either satisfied (45%) or very satisfied (28%) with the choice of NQTs available to them over the previous three years. A fifth declined to come to a judgement either way and a further 6% were either dissatisfied or very dissatisfied. Analysis by school type and by free school meal quartiles revealed no differences, nor were there significant differences by ITE route.
5.2.2 Senior leader and NQT responses - comparison of 2008 and 2010 surveys In both the original 2008 survey and the 2010 follow-up survey we asked senior leaders about how they would evaluate the quality of NQTs against a list of criteria and how satisfied they had been with the choice of NQT candidates for posts at their school. There were in fact no significant changes in the relative ratings of either the list of criteria offered (as laid out in Figure 5.1 above) or in their satisfaction with the choice of NQT candidates of the preceding three years. We also asked senior leaders in both the 2008 and 2010 surveys if they thought that in general the quality of NQTs over the preceding years had changed. Comparative analysis of this data is laid out in Table 5.4.

61
Table 5.4 Changes to the general quality of NQTs in the preceding years (SL responses) Survey Increased/
Slightly increased
Stayed the
same
Slightly decreased/decreased
Total n 95% lower CI
95% upper CI
2010 45.0 47.9 7.1 695 5.2 9.0 2008 51.4 35.6 13.0 655 10.4 15.6
This analysis shows a slightly more positive picture in 2010, with more respondents reporting that the quality of NQTs has stayed the same and fewer reporting that quality had slightly decreased/decreased. However, it is important to note that the 2010 survey asked about quality improvements since 2008 (over last 3 years) while the 2008 survey asked about improvements over the preceding 5 years (since 2002). We present comparative analysis by school type in Table 5.5. Table 5.5 Views of changes to the general quality of NQTs in the preceding years by school type (SL responses) School type Year Increase
d/ Slightly increase
d
Stayed the same
Slightly decrease
d/ decrease
d
Tota l n
95% lower CI
95% upper CI
Primary 2010 42.2 48.6 9.2 436
Primary 2008 49.0 37.4 13.5 457
Secondary 2010 53.1 42.5 4.3 207 1.5 7.1
Secondary 2008 57.3 30.8 11.9 185 7.2 16.6
This analysis reveals that secondary-based respondents were significantly less likely to report that in the 2010 survey the general quality of NQTs had decreased or slightly decreased than they had in the 2008 survey. There was no such difference in the responses from the primary sector (Table 5.5).
5.3 NQTs' perceptions of the value of their ITE in preparing them for the role
5.3.1 NQTs' responses We asked NQTs how effective their initial teacher education course had been in preparing for various aspects of the role. Their responses and variations by school type are outlined below.

62
Figure 5.2 NQTs rating of aspects of their ITE as preparation for the role
NQTs rated their initial teacher education highly across most of the criteria listed in our survey. Over 40% rated the effectiveness of their preparation for the role as very good in four areas- meeting the QTS/core professional standards, commitment to children, working with/in charge of a full class of children and lesson planning. For each of these criteria - and for awareness of what the job entails - over 80% of respondents rated their preparation as good or very good. The areas identified by NQTs as the weakest in terms of preparation for the role of classroom teacher were administrative work, commitment to parents, team working with non-school colleagues and the ability to deal with parents; in each of these less than 20% felt that their ITE offered very good preparation (Figure 5.2, note that preparedness to teach phonics is only relevant to primary NQTs). Table 5.6 NQTs' rating of aspects of their ITE (selected for significance) Criteria
School type
Very good/ good
Adequate/ very poor
Total n
Significance Cramer's V
Ability to deal with parents
Pri 33 67 191 p<0.05 0.13 Sec 45 55 158
Commitment to parents
Pri 43 57 191 p<0.05 0.12 Sec 55 45 156
Subject/specialism knowledge
Pri 67 33 186 p<0.01 0.25 Sec 88 12 158
Pupil assessment/ assessment for learning
Pri 69 31 191 p<0.01 0.15 Sec 82 18 157
Analysis by school type reveals that for the majority of criteria (12 from 19) secondary respondents scored their ITE more highly than primary respondents; four of these were

63
significant - subject/specialism knowledge, pupil assessment/assessment for learning, ability to deal with parents and commitment to parents (Table 5.6). In three areas - team working skills with support staff, team working skills with non school colleagues and working with/in charge of a full class of children - primary respondents felt themselves more prepared than secondary peers, though not significantly. Table 5.7 NQTs' rating of aspects of their ITE as preparation for the role by route (selected for significance) Aspect of ITE Route Very
good/ good
Adequate Poor/ very poor
Total n
Sig* C's V
Ability to deal with parents
PGCE 35 45 20 231
p<0.01 0.24 UG teaching 32 51 18 85
EBR 71 20 10 41
Commitment to parents
PGCE 46 41 13 229
p<0.01 0.22 UG teaching 40 49 11 85
EBR 76 20 5 41
Team working skills with non school colleagues
PGCE 38 47 15 231
p<0.01 0.19 UG teaching 48 35 17 82
EBR 66 22 12 41
Contribute to the whole school
PGCE 58 37 5 230
p<0.01 0.19 UG teaching 69 28 2 85
EBR 80 15 5 41 Pupil assessment/assessment for learning
PGCE 79 16 4 231
p<0.05 0.15 UG teaching 64 29 7 85
EBR 76 22 2 41
*nb due to small numbers for the poor/very poor ratings significance tests have been carried out by compressing the adequate/poor/very poor ratings Analysis of NQTs' rating of aspects of their ITE by route taken reveals that those from employment based routes were significantly more likely to rate as very good or good those aspects of the training that enhanced their ability to deal with parents, commitment to parents, team working skills with non school colleagues and ability to contribute to the whole school than the other two main routes. There was also a significant difference between ratings for pupil assessment/assessment for learning, with the undergraduate teaching route less favoured than PGCE and employment based routes (Table 5.7).
5.3.2 Senior leader and NQT responses - comparison of 2008 and 2010 surveys Comparative analysis of NQTs' perceptions of the effectiveness of their ITE with senior leaders' evaluations of their quality using the same criteria shows a relatively high degree of congruence. While this comparison offers some insight into different perceptions of how well NQTs are prepared for the role, it should be noted that the two questions from which this table is derived have different premises. Senior leaders' responses refer to their general perception of the NQTs they have worked with, while the NQTs' own responses are specific to their own experience.

64
Table 5.8 Comparing senior leaders' evaluation of the quality of NQTs' with NQTs own evaluation of the effectiveness of their ITE Criteria NQT
ranking position
SL ranking position
Meets the QTS/core professional standards for teaching 1 3 Commitment to children 2 2 Working with a full class/in charge of a whole class 3 10 Lesson planning 4 5 Team-working skills with teaching colleagues 5 4 Subject specialism/knowledge 6 6 Awareness of what the job entails 7 7 Ability to deal with children 8 8 Pupil assessment/assessment for learning 9 16 Stamina/resilience 10 12 Awareness of future professional development needs 11 13 IT skills 12 1 Team-working skills with support staff colleagues 13 17 Contribution to the whole school 14 9 Administrative work 15 18 Commitment to parents 16 14 Team-working skills with non school colleagues 17 11 Ability to deal with parents 18 19 Preparedness to teach phonics (primary only) 19 15
As Table 5.8 shows, there are in fact very few areas of divergence between the SL responses and those of our NQT respondents. Of the top eight highest ranked criteria in the NQT survey, seven appear in the SL survey, with three occupying the same position. However it is the variations that are potentially revealing. Working with a full class/in charge of a whole class had the third highest rating in the NQT survey, but for senior leaders NQTs' skills in this area were rated only tenth. Similarly, while NQTs believed that they were relatively well prepared for pupil assessment/assessment for learning (ninth on the list) senior leaders found this area one of the weaknesses of NQTs (16th out of 19). Conversely, for one of the listed criteria, senior leaders rated NQTs more highly than the NQTs themselves; IT skills was the highest placed criteria in terms of skills that NQTs exhibit according to senior leaders, though this was only placed twelfth in the ranking of criteria that benefited from their ITE experience.

65
6. NQT retention
Chapter Summary
This chapter examines senior leaders' views of retention in their schools, looking at the extent to which they perceived there was a problem with retention, and how long NQTs tended to stay in the school. We then present the reasons given for leaving the school, and senior leaders' views on effective measures to support retention. Finally, we examine NQTs intentions in relation to staying in or leaving the profession, and the reasons given by those intending to leave. Retention overall
• The overall picture in 2010 is of stability – in most cases few NQTs in their first two to three years of teaching had left the schools involved since 2005; and 92% of schools said that retention of NQTs was not a problem.
• Fourteen percent of leaders in more deprived schools stated that retention of NQTs was a problem compared with 5% of leaders in the least deprived schools.
• Primary schools were more likely to report some leaving after one year. After that, though, stability was higher in primary schools than in secondaries. Slightly higher proportions of NQTs were leaving more deprived schools compared with others.
• There were some indications that there was greater stability in 2010 compared with 2008, with significantly higher proportions of senior leaders indicating that none of their NQTs had left after two or more years in 2010. This difference was particularly large in primary schools, where almost half of schools reported no NQTs leaving after two or more years in 2010 compared with less than 29% in 2008.
• Where NQTs did leave, they were overwhelmingly likely to be moving on to other jobs in teaching (although this was slightly less likely in primary schools).
Reasons for leaving the school • The most common reasons given for NQTs leaving were promotion and contracts
ending.
• Among secondary school senior leaders 68% cited promotion as a reason for leaving, compared with 33% of primary school leaders. Senior leaders in more deprived schools were more likely to mention pupil behaviour, types of class taught and mismatch between skills and the demands of the job, although the strength of the link between deprivation and reasons for leaving was quite weak in each case.
• In 2010, senior leaders were less likely to cite promotion as a reason for NQTs leaving (43% of leaders in 2010) compared with 2008 (51%) and also - encouragingly - they were less likely to mention pupil behaviour in 2010 (7% in 2010 compares with 12% in 2008).
• When asked an open question regarding measures that supported retention, most responses cited ensuring staff were supported, via measures including providing a supportive environment, mentoring, induction, professional development, protected time and career opportunities. Other measures mentioned included financial

66
incentives/permanent contracts and classroom issues especially pupil behaviour and teaching a preferred age range/subject/level.
NQT intentions relating to staying in or leaving the profession • Ninety-four percent of the NQTs we spoke with intended to stay in teaching in 2010,
a slight increase from the 91% who intend to stay in teaching in 2008.
• Of the teachers intending to stay, 78% intended to stay in teaching for the rest of their career, 21% for between two and ten years and only one individual intended to leave in the next year.
• Of the 22 teachers that intended to leave, heavy workload was by far the most common reason given, with 68% of the 22 reporting this.
6.1 Retention of NQTs overall
We asked senior leaders to estimate how long NQTs tended to stay after initial appointment. Their responses are given below.
6.1.1 Senior leaders' responses Table 6.1 Destinations of NQTs recruited since September 2005 (SL responses) All
% Most
% Some
% A few
% None
% Total
n Still in post 27 47 15 6 5 685 Left less than one year after appointment 1 1 5 24 69 426
Left one year after appointment 3 0 7 46 44 418 Left two years after appointment 1 1 12 39 47 426 Left more than two years after appointment 2 5 17 39 37 428
As Table 6.1 above indicates, retention of beginning teachers within schools overall is quite high. Very few schools reported most or all NQTs leaving within two to three years of appointment, although there was some churn, with a few leaving from the end of the first year onwards. Table 6.2 Destinations of NQTs recruited since September 2005 by school type (SL responses)
All/most %
Some/A few %
None %
Total n Sig C's V
Still in post Pri 72 21 6 426 p<0.01 0.13 Sec 78 22 0 202
Left less than one year after appointment
Pri 2 28 70 227 NS Sec 3 34 63 164
Left one year after appointment
Pri 4 45 50 224 p<0.01 0.20 Sec 1 63 36 160
Left two years after appointment
Pri 4 37 59 223 p<0.01 0.34 Sec 1 71 28 166
Left more than two years after appointment
Pri 10 40 50 233 p<0.01 0.41 Sec 4 81 15 163

67
Table 6.2 above indicates some differences between primary and secondary schools. Secondary schools were more likely to report that all or most of their NQTs were still with them, and less likely to note that they had left after one or two years (with the relationship strongest regarding leaving after two years). Beyond this initial contract stage, it appears that primary schools NQTs are more likely to stay in the school for two to three years or beyond, and the effect size of the relationship here is fairly high. Table 6.3 Destinations of NQTs recruited since September 2005 by FSM quartile (SL responses)
All/most %
Some/A few %
None %
Total n Sig C's V
Still in post
Least deprived 78 18 4 160
p<0.05 0.1 Lower middle 76 17 6 170 Upper middle 75 21 4 174 Most deprived 67 30 2 163
Table 6.3 indicates that more deprived schools were less likely to find that all of their NQTs were still with them, although the power of the relationship is quite weak.
6.1.2 Senior leader responses - comparison of 2008 and 2010 surveys We were able to make comparisons between SL responses in 2008 and 2010 in relation to NQT destinations over time. Table 6.4 Destinations of NQTs recruited in past 5 years (SL responses) - comparison over time
All %
Most %
Some %
A few %
None %
Total 95% lower CI ('none'
)
95% upper
CI ('none')
Left more than two years after appointment
2008 1.9 5.4 26.0 45.0 21.7 369 17.5 25.9
2010 1.9 5.4 17.3 38.8 36.7 428 32.1 41.3
Table 6.4 indicates that generally there was more stability in 2010 compared with 2008: schools were significantly more likely to indicate that none of their NQTs had left after two years (37% of schools) compared with 2008 (22%). Table 6.5 Destinations of NQTs recruited in past 5 years - primary schools only (SL responses) - comparison over time
All/most %
Some/A few %
None %
Total n
95% lower CI ('none')
95% upper CI ('none')
Left more than two years after appointment
Pri 2008 8.1 63.3 28.5 221 22.5 34.5
Pri 2010 10.3 39.9 49.8 233 43.2 56.4
Table 6.5 indicates that this was particularly true of primary schools. In 2010, nearly 50% of primary schools reported that none of their NQTs had left more than two years after appointment compared with less than 29% in 2008.

68
6.2 Roles taken after leaving and reasons for leaving
6.2.1 Senior leaders' responses We asked senior leaders what roles were taken on by NQTs who had left since 2005. Table 6.6 Destinations of NQTs leaving the school since 2005 (SL responses) All
% Most
% Some
% A few
% None
% Total
n Gone to other teaching jobs 55 25 6 7 7 493 Gone to jobs in education or working with children other than teaching
4 4 3 13 75 268
Gone to a job not working with children
3 0 4 25 68 265
Have left but not gone to another job
2 1 3 20 73 273
Overall, Table 6.6 indicates that the role most commonly taken on after leaving was another teaching job, with small proportions going on to other jobs or other things. Table 6.7 Destinations of NQTs leaving the school since 2005 by school type (SL responses) All
% Most
% Some
% A few
% None
% Total
n Sig C's V
Gone to other teaching jobs
Primary 59 16 6 9 10 271 p<0.01 0.27
Secondary 49 37 7 5 2 182 Table 6.7 shows that there was a difference between primary and secondary schools in one response – staff leaving secondary schools were significantly more likely to have gone on to other jobs in teaching. There were no differences by deprivation using our FSM measure. We then asked what the reasons for leaving were. Table 6.8 Main reasons why NQTs left the school (SL responses) Reasons % For promotion 43 End of contract 32 Mismatch between skills and demands of the job 16 Heavy workload 10 Issues to do with pupil behaviour 7 Change of subject or specialism 4 Type of class taught 4
Overall, Table 6.8 indicates that promotion was the most common factor, followed by contracts ending, the heavy workload and mismatch between skills and requirements. Table 6.9 Main reasons why NQTs left the school by school type (SL responses) - % Pri Sec Significance Cramer's V For promotion 33 68 p<0.01 0.33 End of contract 29 41 p<0.01 0.11 Mismatch between skills and demands of the job 14 18 Heavy workload 11 8 Issues to do with pupil behaviour 5 10 p<0.05 0.09 Change of subject or specialism 4 3 Type of class taught 3 5

69
Table 6.9 presents differences by school type. Secondary school leaders were significantly more likely to cite promotion as a reason (68% of secondaries to 33% of primaries, with a strong association) and pupil behaviour (10% compared with 5% of primaries, a weaker association). Table 6.10 Main reasons why NQTs left the school by FSM quartile (SL responses) - %
Least deprived Lower Upper
Most deprived
Significance Cramer's V
For promotion 41 45 47 38 NS End of contract 25 39 39 26 p<0.01 0.14 Mismatch between skills and demands of the job
15 14 11 22 p<0.05 0.11
Heavy workload 10 13 5 13 Issues to do with pupil behaviour 3 5 5 14 p<0.01 0.17
Change of subject or specialism 4 2 2 6
Type of class taught 2 4 1 8 p<0.01 0.14 Table 6.10 indicates that there were some differences by deprivation. The most and least deprived schools were less likely to cite contract ending as a reason for leaving compared with the middle groups. However, leaders in the most deprived schools were more likely to cite type of class taught, mismatch between skills and demands of the job and pupil behaviour as reasons for leaving. None of the associations were very strong. An open question on retention was asked to senior leaders - 'What do you think encourages the retention of NQTs?'. The most common response to the open question focussed on ensuring staff were supported, and valued. Elements of support included in particular:
• Providing a supportive environment, across the school and within the team, e.g. 'a professional and supportive working environment', 'good appropriate support… motivated staff and a happy environment', 'high quality support from colleagues and whole school systems'.
• Mentoring and ongoing supervision e.g. 'good NQT mentorship', 'a key person to mentor and support them'.
• A well planned and meaningful induction process/programme, e.g. 'a good quality induction programme which continues to support them into their second and third years', 'robust induction procedures- support at local level form departments/year team, professional mentoring'.
• High quality professional development, including access to training, coaching, observation and opportunities to take on extra responsibilities, e.g. 'personal development plans well managed. Effective, positive performance management. Opportunities to grow professionally', 'Training matched to individual needs. Quality in-house training programmes'.
• Protected time. • Clear career progression routes, and opportunities for early promotion.
In addition, a number of leaders mentioned working conditions, financial incentives and permanent contracts as key factors, e.g. 'Security - permanent contracts', 'recruitment and

70
retention allowances', 'our school is in a deprived area of [LA]. We have problems with retention generally. A weighting in salary would go some way to helping the problem'. Finally, others mentioned issues around work in the classroom, especially class size, pupil behaviour and teaching their preferred age group and subject, for example 'small class sizes can be an incentive for NQTs to stay on as they are getting used to the job', 'being able to offer them the subject area/age range they prefer', 'A good school, well managed with a clear policy for management of pupil behaviour'.
6.2.2 Senior leaders' responses - comparison of 2008 and 2010 surveys We were able to compare reasons given for leaving across the two time periods. Table 6.11 Main reasons why NQTs left the school (SL responses) - comparison over time -%
Survey % 95%
Lower CI 95%
Upper CI
For promotion 2008 51 46.9 55.1
2010 42.8 39.2 46.4
End of contract 2008 32
2010 31.7
Mismatch between skills and demands of the job
2008 18.3
2010 15.6
Heavy workload
2008 13.7
2010 10.2
Issues to do with pupil behaviour
2008 12.2 9.5 14.9
2010 6.8 4.9 8.7
Change of subject or specialism
2008 4.5
2010 3.7
Type of class taught
2008 6.6
2010 3.8
Table 6.11 shows that each of the reasons given was cited less often in 2010 than in 2008, although for most of the reasons given these differences were not statistically significant. This lower level of reporting may be related to the finding above that there was less of a problem overall in 2010 with retention. In two cases, the differences were significant. Firstly schools were less likely to cite promotion as a reason for leaving in 2010 (43% in 2010 compared with 51% in 2008). Secondly - and perhaps encouragingly - pupil behaviour was cited by 7% in 2010 compared with 12% in 2008.
6.3 Perceptions of problems
6.3.1 Senior leaders' responses We moved on to ask specifically whether senior leaders thought retention of NQTs was a problem in their school. Of the 708 schools responding 92% said it was not a problem, with 8% saying it was. We should note that this was higher than in 2008 (when 88% said it was not a problem) but this difference is not statistically significant.

71
Table 6.12 Responses to the question 'Is retention of NQTs a problem in your school?' by FSM quartile (SL responses) - % Yes Significance Cramer's V
Least deprived 5 Lower middle 5 p<0.01 0.15 Upper middle 9 Most deprived 14
Whilst there were no significant differences by school type, we did find significant differences by deprivation using FSM as a measure as indicated in Table 6.12. Whilst 5% of the least deprived and lower middle stated retention was a problem, nearly twice as many - 9% - in the upper middle deprivation group stated it was a problem and nearly three times as many - 14% - in the most deprived group stated retention was a problem.
6.4 Intentions to stay in or leave teaching
6.4.1 NQT responses We asked NQTs whether they intended to stay in teaching. Of the 378 who responded, 94% said they did, 5% were unsure and just 22 (1%) intended to leave. This represented a slight increase in the proportion of NQTs intending to stay in teaching compared with 2008 (94% in 2010 compared with 91% in 2008) but this was not statistically significant. There were no significant differences by school type in response to this question. We asked the 22 teachers who were intending to leave the profession the reasons for this. Table 6.13 Reasons given for considering leaving teaching (NQT responses) - percent Reasons for considering leaving teaching %
(n=364) Heavy workload 68 For promotion 18 Change of subject or specialism 9 Type of class taught 9 Issues to do with pupil behaviour 9 End of contract 5 Mismatch between skills and demands of the job 0
As Table 6.13 indicates, heavy workload is by far the most common reason given, and was the most common issue cited in open comments by those intending to leave, for example 'the heavy workload and amount of paper work certainly does make you think about it and sometimes question your career choice!', ' teaching changes so much - I have only been in it a few years and the workload is ridiculous. I am not sure how long I will stick at it before I opt to change career', 'I would like to stay in teaching for the rest of my career but, realistically, I think the workload is not something that I will be able to cope with for the next 40 years'. The second most common reason given - promotion - is difficult to interpret, but open comments from NQTs indicate that a number were considering moving on to other jobs which may be considered promotions, for example 'Would like to move to FE advising on education in the area of DT - still linked to teaching', 'I hope to stay in the profession, however I may move to another area of work in the education sector in future if I ever find that teaching in schools does not totally satisfy me', 'I feel I want to have a go at something where I may be more independent - still working with children, maybe running a nursery'. A number specifically mentioned moving on to become an Educational Psychologist. Other responses were only mentioned by one or two individuals. Given the small numbers involved it is unsurprising that there were no significant differences by school type.

72
We then asked those who intended to stay in teaching how long they intended to stay for. Of the 362 that responded, 78% intended to stay in teaching for the rest of their career, 14% for 6-10 years, 7% for two to five years and just one individual intended to stay for a year.

73
7. Conclusion
7.1 Concluding discussion
In the discussion, we draw out some of the most important findings from the report, and attempt to link these where possible providing an analysis of the reasons behind some of these findings. To begin with, we discuss the generally positive findings regarding recruitment and retention overall. We move on to discuss routes into teaching, and the picture overall in relation to leaders’ and NQTs' views on these. We then turn to induction, considering the findings in relation to standards and support for induction, before looking at the relationship between issues of concern regarding both ITE preparation and induction. There has been a significant change in the recruitment and retention picture between 2008 and 2010. Whilst the overall recruitment and retention picture in 2008 was good, with some pockets of difficulty, the situation in 2010 is appreciably better in all respects. The proportion of senior leaders reporting problems with the recruitment and retention of NQTs has reduced across the board. In relation to recruitment, there were particularly marked improvements in reducing the difficulty in appointing to the key secondary subjects of Physics, Chemistry and General/Combined Science. This is not to say that the picture is uniformly good. Whilst the recruitment picture for Physics has improved, it is still seen to be a problem for nearly half of our secondary school sample, and there are still marked difficulties in recruitment to the sciences – except for Biology – and Mathematics. The very large proportion of schools recruiting to Mathematics and General/Combined Science indicates there is a particular issue here, and supports the current policy focus on increasing the supply of teachers of these subjects. It is also still the case in 2010, as it was in 2008, that both recruitment and retention are significantly more difficult for the schools serving the poorest communities. Given the importance of getting the best teachers into such schools, this is worrying and points to the specific need to support such schools in recruiting and retaining excellent teachers. There were some interesting findings in relation to routes into teaching, in the current context of political debate about this issue. In 2010 the message that the PGCE is the preferred route for almost two-thirds of secondary leaders is particularly strong. This is not to say that employment-based routes are not valued: in fact for secondary schools such routes were associated with significantly higher performance than the other two main routes in a number of areas including NQTs' ability to deal with parents, commitment to parents, team working skills with non school colleagues, and ability to contribute to the whole school. Senior leaders also had different perspectives on the routes they found most effective, reflecting the importance of the school context; among primary leaders the undergraduate route was found most effective and the employment based route least effective; among secondary leaders the PGCE was rated most effective and the undergraduate route the least effective. When it came to the route which offered the most effective level of classroom experience, however, senior leaders from both sectors agreed on employment based routes, though this was more strongly felt among secondary senior leaders. Taken together these findings make it clear – as we found in 2008 – that secondary school leaders prefer both employment-based and PGCE routes to be maintained to provide the best mix of teachers in their schools. As our case study interviews demonstrated, senior leaders rarely endorse one route over another when asked to, rather they discuss the pros and cons of each route in relation to the specific needs of the school and the relative stage of early career teachers' development, and don't expect the influence of ITE route to have

74
any impact beyond the second year. As in 2008, the picture is clearer for primary schools: undergraduate and then PGCE routes are by far the most popular choices for primary senior leaders in relation recruitment, and whilst there are some benefits in some cases to using employment based routes they are not preferred by the vast majority of primaries, and therefore this study gives no support for significantly expanding this route in primary education. Turning now to induction, our research found that there has been a significant increase in the number of secondary schools having a common induction programme in place since 2008, to the point of almost universal coverage in 2010. However, the nature of induction programmes appears to be changing: comparison of senior leader responses in the 2008 and 2010 surveys revealed a statistically significant decline over time in the use of the TDA standards, the career entry development programme (CEDP), written individual programmes and the provision of support from a mentor or coach who was not the NQT's designated induction tutor. The decline in the use of an additional mentor or coach and of individualised written programmes was particularly marked in primary schools. The decline in the use of the standards certainly warrants further investigation, since it may be that the standards are not being seen as fit for purpose. Senior leaders were generally positive about LA-run induction support, particularly primary senior leaders, which indicates policy-makers need to think carefully about supporting primary induction centrally another way if LAs reduce support for induction as more schools become academies. Finally on induction, the open comments in our survey indicated that there were some specific issues highlighted by NQTs in relation to gaps in their support, particularly working with support staff, and behaviour management. These were also picked up as areas of weakness in ITE and in LA induction programmes, indicating that both schools and policy-makers need to consider what action to take to develop NQTs in these regards. Senior leaders were also keen for NQTs to have greater opportunities to network with teachers in other schools, building the base for collaborative learning in subsequent years. This brings us to consider quality and performance, and here - as with recruitment and retention - there is generally a positive picture. One key finding is that around half of senior leaders felt that the quality of NQTs had improved or remained the same over the past three years, i.e. since our last survey. Given that most leaders at that point also indicated they felt that NQT quality had improved over the previous five years, this indicates that current routes into teaching are working effectively to give leaders confidence in the performance of new teachers. In addition almost three-quarters of senior leaders responding to our 2010 survey were satisfied or very satisfied with the choice of NQTs over the last three years, with secondary respondents even more positive about an increase in quality than primary respondents. The positive picture overall in relation to recruitment, retention, choice of teachers and teacher quality are likely to be connected - greater choice indicates that schools can appoint the best candidates. And, of course, this improvement is also highly likely to be related to the current economic climate. There is a danger here, therefore, that once the labour market expands again it may have negative consequences for retention, which could potentially influence teacher quality. However, given that there has been a steadily growing perception throughout this period that quality and performance are improving, as we note above, there is no indication from this study to date that this will have a significant impact on teacher quality overall. It is possible however that there may be problems in relation to particular subjects – Mathematics, Physics, Chemistry – which have seen improvements in recruitment in 2010, if staff in these subjects leave the profession as opportunities outside of teaching arise. Therefore we would suggest that this study supports the view that attention should continue to be paid to recruitment and retention in these subjects. As indicated in the report and executive summary, there are some specific aspects of teacher performance which are

75
seen to be poorer, and these have generally remained the same since 2008. We address these in the next subsection on the implications of the findings of this report for policy makers and schools.
7.2 Recommendations
7.2.1 Recommendations for schools and senior leaders On routes into teaching:
• The implications in this respect are for senior leaders to maintain their approach of shortlisting candidates from a plurality of ITE routes to reflect their diverse needs.
On recruitment and retention:
• Schools should review their advertising strategies to align them with the sources most used by NQTs to search for posts, in particular making greater use of electronic media.
On induction and support:
• Schools should make particular efforts to meet NQT needs in relation to behaviour management and working with support staff, seen as areas of weakness by NQTs in our survey.
• Schools should identify opportunities for NQTs to network with other schools, since this is valued by senior leaders, particularly as a basis for professional development through collaboration in following years.
On performance and teacher quality: • Some senior leaders currently see their role as correcting the weaknesses of
particular ITE routes from which they employ NQTs; we suggest that they deal with this issue by working more closely with ITE providers in programme and course design.
• Primary senior leaders should in particular work with providers to address perceived weaknesses in subject specialism, lesson planning, awareness of what the job entails, meeting the professional standards for teaching and pupil assessment/assessment for learning.
• Senior leaders should continue to increase the emphasis they place on lesson observations as an aspect of performance management as these are found to be valued by NQTs.
7.2.3 Recommendations for policy makers On routes into teaching:
• PGCE and employment-based routes are both highly valued by secondary school leaders. Undergraduate and PGCE routes are the most valued routes into primary education. Therefore the study supports the view that these routes should continue to be used as routes into the profession. Any changes made should ensure that the positive features of these routes are incorporated into future ITE.
• Policy-makers should work with ITE providers to continue to address perceived weakness in ITE preparation for aspects of the teacher's role, in particular working with parents and administrative work which are found to be weakest among NQTs from the shortest routes

76
On recruitment and retention: • There are specific difficulties faced by secondary schools in relation to filling posts in
Physics, Chemistry, Mathematics and General/Combined Science. These last two subjects are also subjects that large numbers of schools recruit to. This means that for all of these subjects - and particularly General/Combined Science and Mathematics - policy-makers should continue to support initiatives to increase the supply of teachers.
• Schools with more deprived student populations have more difficulties recruiting and retaining teachers. For primary schools, this is particularly an issue in the Foundation Stage. Therefore policy-makers should continue to support such schools in recruiting and retaining NQTs.
On induction and support: • Policy-makers should review the standards for induction, in light of our findings that a
number of schools are not using particular aspects of them, and the number using them has declined over time.
• Schools, particularly primary schools, value LA induction support. Policy-makers should consider how to ensure support for induction is provided effectively and efficiently as LA support declines.
7.2.4 Recommendations for ITE providers
• ITE providers should continue to address perceived weaknesses in ITE preparation for aspects of the teachers' role, in particular working with parents and administrative work which are found to be weakest among NQTs from the shortest routes.
7.3 Next steps
Following this final project data report we will produce a summary report for TDA at the end of May 2011. The report will consist of:
• Representation of key findings and summary quantitative data in a longitudinal form gathered across the five phases of the project in relation to the three key elements of the research:
o quality and performance (including performance management) o support and development (including induction) o career (including recruitment, retention, promotion and career development)
• New analysis and presentation of three longitudinal school case studies (one focussed on each of the key elements of the research).
• A summary of the key lessons learned.
7.4 Project Website
The project website (http://extra.shu.ac.uk/nqtstudy/) is continually updated and contains information about the project (including next stages and timelines), findings from the previous reports (including a literature review), and a suite of media items which consist of thematic case studies of schools and NQTs/early career teachers and 'expert' discussions about key issues explored in the research.
77
Appendix 1 Scrutinising the sample representativeness of the senior leader survey
Data from the annual school census (ASC) was used to assess how closely each survey samples reflected the population it aimed to represent (i.e. senior leaders from primary and secondary schools in England at three time points: February 2008; November 2008 and November 2010). Two measures were used for this: government office region (GOR) and the percentage free school meal eligibility (FSM). Summary From the analyses it is apparent that:A clear geographical bias is evident in all senior leader surveys
• Some evidence of a bias around FSM eligibility is also found but this is patchier. • Statistically significant geographical variation in the distribution of the senior leader
variables is evident (but in relation to FSM, no statistical significance) • Weighting has a small impact on altering the shape of the senior leader variable
distributions. Also of note are:
• Issues around different measurements - see 'routes' and 'perception of NQT quality' - this is discussed in the body of the report.
• Due to the nature of the NQT sample, a weighting scheme cannot be constructed here. We therefore felt that using a weighting scheme for senior leaders would be inappropriate in terms of consistency).
• Weighting will change all the statistics (albeit slightly in many cases) - this means that this current senior leader analysis will systematically differ from any previous analyses / reports.
Decision :
• Not to weight the senior leader data file but to note this sample scrutiny. This decision is on the grounds of weighting having a limited impact on the findings and to maintain a consistent approach (between senior leader and NQT analyses and across the reports).
The following pages present the geographical and FSM distributions of the three senior leader surveys alongside the 2010 ASC.

78
Geography: Government Office Region The samples all over-represent schools (and hence SLs) in the Yorkshire and Humber region whilst under-represent other regions (e.g. SE, NE). This pattern is seen across all three surveys. Table 1 below illustrates the imbalance in the samples – and highlights the striking over-representation of Yorks & Humber.
Table 1 – GOR distributions in ASC 2010 & the three SL surveys
ASC SL5 SL2 SL1 2010 Nov 2010 Nov 2008 Feb 2008 Primary % % % % East Midlands 9.7% 9.5% 8.5% 8.5% East of England 11.9% 13.1% 15.8% 11.5% London 10.5% 9.3% 9.8% 13.2% North East 5.2% 2.8% 3.9% 2.4% North West 14.6% 10.3% 11.9% 13.4% South East 15.5% 11.2% 11.9% 10.9% South West 11.1% 11.0% 7.8% 10.5% West Midlands 10.6% 10.1% 8.0% 9.5% Yorks & Humber 10.8% 22.6% 22.4% 20.0% Secondary East Midlands 8.9% 9.2% 10.1% 8.4% East of England 12.9% 12.6% 13.8% 11.5% London 12.0% 6.8% 11.2% 12.6% North East 6.0% 3.4% 3.2% 3.1% North West 13.8% 16.5% 14.9% 16.2% South East 15.0% 6.8% 9.6% 9.4% South West 10.0% 6.8% 9.0% 11.5% West Midlands 12.1% 13.1% 10.6% 9.9% Yorks & Humber 9.4% 24.8% 17.6% 17.3%

79
FSM: Eligibility for Free School Meals Table 2 below presents a summary of this distribution for the 2010 ASC and across the three surveys. It seems that, for primary schools, the samples are slightly skewed towards less deprived schools. However, this skew is less evident (or not present) for secondary schools.
Table 2 – FSM eligibility distributions in ASC 2010 & the three SL surveys
ASC SL5 SL2 SL1 2010 Nov 2010 Nov 2008 Feb 2008 Primary Mean 16.8 15.8 13.6 13.9 s.d. 13.67 12.71 12.05 13.09 Lower Quartile 6.2 5.8 4.5 4.3 Median 12.3 11.5 9.4 8.9 Upper Quartile 24.5 23.1 18.7 21.2 Min 0 0 0 0 Max 77.2 58 67.01 68.3 Secondary Mean 14.3 14.0 13.0 12.8 s.d. 11.7 8.71 10.76 11.32 Lower Quartile 5.9 7.3 5.5 4.2 Median 10.6 11.0 9.4 8.9 Upper Quartile 19.6 18.2 17.4 17.0 Min 0 0 0 0 Max 73.7 50.2 55.1 55.9

80
Appendix 2 Statistical methods detail
Statistical Significance
Statistical significance is a term used to signify when a finding such as an association or difference is unlikely to be created through chance alone. It does NOT indicate whether a finding is important (this is the non-statistical, lay definition of the word 'significant'). Tests of statistical significance are used to assess whether findings within the sample can be reasonably inferred to the population that the sample represents. A key assumption of these tests is that random sampling is used. The test then focuses on whether pure randomness (that is incorporated into the design through this random sampling) is likely to produce the findings seen within a sample. If the probability of chance (pure randomness) creating the findings is 'small' (commonly defined as p<0.05 or <5%) it is concluded that randomness is unlikely to produce the sample findings and a 'statistically significant' finding can be declared. By stating statistical significance, the findings are inferred from the sample to the population - i.e. they will be expected to be found within the population (and are unlikely to be a result of random variation). A non-significant finding can be seen as being as important as a significant one. For example, a significant association between retention and mode of education might provide evidence that retention of NQTs is more of an issue in secondary compared with primary schools. A non-significant association between retention and mode of education would provide evidence to suggest that retention of NQTs is a similar issue for both secondary and primary schools. In either of these situations, the decision on whether the finding is 'important' would draw on wider context and other (essentially qualitative) judgements.
Chi-square test of association
Chi-square tests of association are used to assess whether two variables can be regarded as statistically independent of one another. For example, retention (y/n) and mode of education (primary/secondary school); here the test would be examining whether retention rates could be regarded as consistent/similar for respondents in primary and secondary schools. If this was found to be the case, it would be concluded that retention is independent of mode of education. Alternatively, notably higher retention rates might be seen for one mode compared with another which would lead to the conclusion that retention is not independent of mode of education or that retention rates depend (to some extent) on mode of education or that retention rates and mode of education are statistically associated. The chi-square test of association is a statistical technique that helps to assess this. The test takes account of the (random) sample size and the size of the contingency table whilst comparing the actual (observed) responses across the table with what would be expected if the two variables were completely independent. This process is used to calculate a test statistic that is then compared to the appropriate theoretical chi-square distribution (determined by the table's dimensions; 2 by 3; 3 by 4 etc.). If this test statistic is large enough to conclude that it is unlikely to be created through chance / randomness a ‘statistically significant’ association is concluded. Commonly this is when the probability value (p-value) is less than 5% (or 0.05); i.e. the probability that a test statistic 'this size' being created randomly is found to be 5% or less. The approach adopted is mirrored across many tests of statistical significance; to first assume no association (or difference) and that any differences seen across the contingency table can be accounted for by random variation (the null hypothesis) and then to form an alternative position (statistically significant association) if this initial assumption is found to be unlikely (i.e. having a probability of 0.05 or lower).

81
Cramer's V
Chi-square test statistics depend upon the size of contingency table under scrutiny and because of this they cannot be directly compared. Cramer's V is a statistic that standardises the Chi-square test statistic so that direct comparison is possible (regardless of the size / dimensions of the contingency table under scrutiny). Cramer's V values are used to determine the strength of association or dependency between two categorical variables after significance has been ascertained using chi-square tests. Cramer's V has a value between 0 and 1, values close to 0 show little association, values close to 1 show strong association. It has particular utility for comparing the relative strength of the associations. For example, to assess whether mode of education (primary / secondary) has a stronger association with retention compared with routes into the profession or not.
Confidence Intervals
Statistics calculated from data that is drawn from samples can exactly and precisely measure the variable under scrutiny. However, when these sample statistics are used to estimate the 'true' population value (known as a parameter), the level of precision is less exact. This is due to sampling variation. The amount of sampling variation is dependent on the sample size, sampling method and the nature of the variable under scrutiny and is measured through something known as the 'standard error'. Confidence intervals use the standard error to construct a range of values that are likely to contain the true population value. The most common form of confidence intervals used are 95% confidence intervals. These provide a range of values in which there is a 95% chance that it will contain the 'true' population value. For example, in 2008 28.5% of senior leaders reported that none of their NQTs had left two years after appointment. The confidence intervals are then calculated so that it can be stated with 95% confidence that the proportion of senior leaders reporting no NQTs leaving after two years following appointment was between 22.5% and 34.5%. For 2010, the comparable sample statistic was 49.8% and the interval was between 43.2% and 56.4%. Considering the change between 2008 and 2010 through just the sample statistics (28.5% and 49.8%) suggests that NQT retention problems improved between the two years. The confidence intervals take account of the random variation in each of the surveys and because they do not overlap (2008 maximum = 34.5%; 2010 minimum = 43.2%) we can conclude that the increase in percentage of NQTs that had not left two years following their appointment between 2008 and 2010 is statistically significant.