part 2 report on each sector's measures
TRANSCRIPT

Part 2
157
(1)Overview of the problem
In recent years, as human activities have expanded, a massive amount of anthropogenic greenhouse gas emissions including carbon dioxide (CO2) and methane is being emitted into the atmosphere, causing the danger of excessive global warming. Especially, the excessive quantities of CO2 are emitted in an anthropogenic way from the combustion of fossil fuels. Of all greenhouse gases emitted in Japan, carbon dioxide emissions make up roughly 95% of the total.
(2)Current status and outlook of global warming
According to the Fourth Assessment Report produced by the Intergovernmental Panel on Climate Change (IPCC) in 2007 (Table1-1), the global average surface temperature increased by 0.74 (0.56 to 0.92)℃ from 1906 to 2005, and the global average sea level rose by 17 (12 to 22) cm during the 20th century. The temperature over the last 50 years increased at double the rate of the last 100 years, and the global average sea leverise is also accelerating in recent years. The report states that “Warming of the climate system is unequivocal,” and that “Most of the observed increase in global average temperatures since the mid-20th century is very likely due to the observed increase in anthropogenic GHG concentrations.” Based on multiple emission scenarios, with certain assumptions on worldwide economic growth, population growth, technological innovation, economic/energy structures and some other trends, the report predicts that the global surface temperature change at the end of the 21st century (from 2090 to 2099) relative to 1980 to 1999 is 1.8 (1.1 to 2.9)℃ in a world where the con-servation of the environment and economic development would coexist on a global scale. On the other hand, in a world of fossil fuel-intensive high economic growth, the projected global surface temperature change is 4.0 (from 2.4 to 6.4)℃. In addition, the report explains as a new finding that the climate change may cause the reduction of CO2
absorption by terrestrial and ocean sinks from the atmosphere, further amplifying the climate change (i.e. Climate-Carbon Cycle Feedback). As the atmospheric concentration of CO2 increases, it forecasts, that the average global surface ocean pH will be reduced by 0.14 to 0.35 during the 21st century, in addition to the present decrease of 0.1. According to the Japan Meteorological Agency, the average temperature in Japan has risen by approximately by 1℃ during the 20th century. It is anticipated that climate change will have a significant impact on eco-systems, agriculture and forestry, social infrastructure, and human health in Japan.
(3)Efforts Based on the United Nations Framework Convention on Climate Change
At the COP16 and COP/MOP6 held in Cancun, Mexico from November to December in 2010, Japan aimed at
1. Establishment of a Low Carbon Society
The White Paper on the Environment, the Sound Material-Cycle Society and the Biodiversity report on policy measures of various sectors as follows:Chapter 1 Establishing a Low Carbon SocietyChapter 2 Conservation of the Atmospheric Environment, the Water Environment, and the Soil EnvironmentChapter 3 Building a Sound Material-Cycle SocietyChapter 4 Assessing and Managing the Environmental Risk of Chemical SubstancesChapter 5 Conservation of Biodiversity and Its Sustainable Use Chapter 6 Basics for Various Policies, and Measures Related to the Participation of Various Entities and
International Cooperation
Part 2 Report on Each Sector's Measures
・100-year linear trend (1906-2005) is increasing 0.74 (0.56-0.92) ℃
・The linear warming trend over the last 50 years is nearly twice that for the last 100 years.
・Eleven of the last twelve years (1995-2006) rank among the 12 warmest years in the record of global surface temperature (since 1850).
・Average arctic temperatures increased at almost twice the global average rate in the last 100 years.
・The sea level rise over the 20th-century was 0.17m.・The global average sea level rose at the rate of 3.1mm per year from 1993 to 2003.
More frequent
More frequent
More intense and longer droughts have been observed over wider areas since the 1970s, particularly in the tropics and subtropics.
Mountain glaciers and snow cover have declined on average in both hemispheres.
Less frequent
Indicator Observed changes
Hot days/heat waves
Heavy precipitation events
Drought
Global average surface temperature
Global mean sea level
Glaciers and snow cover
Cold days and nights/ days that frost falls
Source: Compiled by the Ministry of the Environment based on the IPCC Forth Assessment Report
Table 1-1 Impacts of Global Warming Observedin Recent Years

158
FY2010
early adoption of a fair and effective international legal framework with the participation of all major emitters, including the United States and China, based on the Copenhagen Accord. Although developing countries demanded that developed countries set the second commitment period under the Kyoto Protocol, Japan explained persistently that the total CO2 emissions of the Parties under the obligation of the Kyoto Protocol account for only 27% of total global emissions, and that if the second commitment period is accepted without a new framework for which the participation of all major economies is guaranteed, the current framework of the Kyoto Protocol would be fixed and only some countries
would be obliged to reduce emissions after 2013. In the end, the Parties adopted the Cancun Accord, in which the reduction targets by developed countries and mitigation actions by developing countries were placed within the same framework. This will serve as the basis for the next framework that Japan was seeking. The Cancun Accord also stipulated the establishment of the Green Climate Fund and technical mechanisms. It also included important steps forward toward support for developing countries, such as the establishment of adaptation plans for the least developed countries, and reducing emissions from deforestation and forest degradation (REDD+) in developing countries.
Source: Ministry of the Environment
HFCs1.4%
CO2
94.7%CO2
94.7%
CH4
1.7%
N2O1.8%
SF6
0.2%
PFCs0.3%
Total GHG emissions FY 2009:1,209
million tons in CO2 equivalent
Figure 1-1 Breakdown of Greenhouse Gas Emissions in Japan (FY 2009)
Note 1: The inner circle represents the share of direct emissions from each sector (figures in round parentheses on the second row). The outer circle represents the share of each final demand sector (figures on the first row), correcting emissions from power generation by electric utility companies and emissions from heat generation by heat supply operators to final demand sectors based on their electric and heat consumption level.
2: Due to statistical errors and roundedfigures, the sum of percentages of emissions may not correctly add up to 100%.
Source: Ministry of the Environment
Others 0.003% (0.003%)
Waste3%(3%)
Transport sector20% (19%)
Energy Industriessector
7% (33%)
Industriessector34%(28%)
Industrialprocesses4% (4%)
Residentialsector
14% (5%)
Commercialand othersectors
19% (8%)
Total CO2 emissions FY 2009; 1,145 million tons
Figure 1-2 Breakdown of CO2 Emissions by Sector
Source: Japan Meteorological Agency Website1985 19901980 1995 2000 2005 2010 (year)
Area
Comparison w
ith Antarctica
(ten thousand km2)
0
500
1,000
1,500
2,000
2,500
3,000
0.0
0.5
1.5
1.0
2.0
(ratio)
Figure 1-4 Annual Changes in the Maximum Areaof Ozone Hole over Antarctica
0
50
100
150
200
250
300
350
400
450
500(million tons CO2)
Industries Sector
Energy Conversion sector
Energy industries sector
Transport sector
Household sector
Source: Ministry of the Environment
Base yearFY 1990FY 1991FY 1992FY 1993FY 1994FY 1995FY 1996FY 1997FY 1998FY 1999FY 2000FY 2001FY 2002FY 2003FY 2004FY 2005FY 2006FY 2007FY 2008FY 2009
Figure 1-3 Trends in Energy-derived CO2 Emissionsby Sector

Part 2
159
(1)Measures for Conservation of the Atmospheric Environment
A. Provision of Systems for Monitoring and Observing the Atmospheric Environment
In order to ascertain the nationwide state of the atmospheric environment and obtain basic information necessary for promotion of policies for conservation of the atmosphere, Japan has established the National Ambient Air Pollution Monitoring stations (at 9 sites) and National Roadside Air Pollution Monitoring stations (at 10 sites), and has been conducting monitoring. These monitoring stations serve as standard stations for the monitoring stations set by local governments to carry out continual monitoring of the atmospheric environment, as testing stations for continuously monitoring the atmospheric environment as monitoring stations for substances that were designated by the government as hazardous air pollutants, and as background monitoring stations for air pollutants. Japan has also been conducting monitoring based on the “Long-Term Acid Trans-boundary Air Pollution and Deposition Monitoring Program (revised in March 2009)” at 27 sites throughout the country, mainly in remote areas such as isolated islands, in order to ascertain the long-term effects of acid deposition and trans-boundary air pollution in Japan. The government is also conducting monitoring studies on environmental radiation by monitoring atmospheric radiation mainly in remote islands where there is comparatively less influence of human activity (10 sites nationwide) and providing information about the results on the webpage “System for Disclosing Monitoring Data on Environmental Radiation (http://housyasen.taiki.go.jp/).” Local governments are constantly monitoring atmospheric pollution at ambient air pollution monitoring stations and roadside air pollution monitoring stations, based on the Air Pollution Control Law (Law No. 97 of 1968).
The national government collects that data (pre-lim inary figures) in real time using the “Atmospheric Environmental Regional Observation System (AEROS),” nicknamed “Soramame-kun,” and provides information on both their website and mobile website. Also, in accordance with the environmental quality standards for fine particulate matter (PM2.5), the gov-ern ment conducts continuous equivalence monitoring of air pollution status using both the standard measuring method of PM 2.5 and automatic measuring instruments used for continuous monitoring of atmospheric pollution conducted based on the Air Pollution Control Law.
B. Measures Against Photochemical Oxidants (International Eff orts)
As the emissions of substances that cause photo-chemical oxidants have been increasing in the Eastern Asian region due to recent economic growth, there are concerns about the effects on Japan’s atmospheric environment. Therefore, Japan made a proposal for cooperation in scientific research on photochemical oxidants, which was agreed upon at the “9th Tripartite Environment Ministers Meeting among China, Japan, and Korea,” held in December 2007. The “Tripartite Workshop on Scientific Research of Photochemical Oxidants” has been held since 2008 with the participation of researchers and policy-makers in order to share scientific knowledge about photochemical oxidants and consider future cooperation in research activities. Based on a plan for environmental cooperation that was adopted at the “12th Tripartite Environment Ministers Meeting among China, Japan, and Korea” in May 2010, efforts for collaborative research will be further strengthened.
C. Measures Against Acid Deposition and Dust and Sandstorms
Recent economic expansion in the Eastern Asian region led to an increase in emissions of substances that cause acid deposition, and there are concerns that the effects of acid deposition on the ecosystem may become a serious problem in the near future. In order to determine the current state and effects of acid deposition, and to establish regional cooperation systems related to this issue, the Acid Deposition Monitoring Network in East Asia (EANET) has been in full operation since 2001. Under the Japanese gov ern-ment’s initiative, thirteen countries in the Eastern Asian region participate in the EANET which has accumulated reliable data by monitoring acid deposition through a common methodology. The participating countries in the EANET continued discussion on an instrument to provide a solid base for making financial contributions to the EANET, in accordance with the decision made by the seventh session of Intergovernmental Meeting held in 2005. As a result, the “Instrument for Strengthening EANET” was adopted and signed at the 12th session of the Intergovernmental
2. Conservation of the Atmospheric Environment, the Water Environment, and the Soil Environment
FY 2009
0.06 ppm or less (in compliance with EQS)More than 0.06 ppm, but less than 0.12 ppm0.12 ppm or more
FY 2005 FY 2006 FY 2007 FY 2008
Number of m
onitoring stations
EQS achievement rate
0
200
400
600
800
1,000
Largest one-hourvalue in the year
(0.1%) (0.1%)(0.3%) (0.2%) (0.2%)
1
623559
23
693
488
624546
2
619552
1
714
463
Source: Ministry of the Environment, FY 2009 Report on the State of Air Pollution
Figure 2-1 Changes in the Number of Monitoring Stations by Maximum Hourly Concentration Level of Photochemical Oxidants during Daytime (Total of AAPMSs and RAPMSs) (FY 2005-FY 2009)

160
FY2010
Meeting held in November 2010. Domestically, Japan has been conducting the monitoring of wet and dry deposition, inland water including lakes, and soil and vegetation, based on the “long-term trans-boundary air pollution and acid deposition and monitoring program.” This program is used for early detection of adverse effects of trans-boundary air pollution and acid deposition, better understanding of long-range transportation of air pollutant and long-term trends, and prediction of their future effects. Regarding dust and sandstorms (DSS), regional cooperation in measures against DSS in the Northeast Asian region has been discussed at meetings such as the Tripartite Director General Meeting on Dust and Sandstorms among China, Japan and Korea. Collaborative research activities on DSS launched in 2008, based on the agreement reached at the “9th
Tripartite Environmental Ministers Meeting” among China, Japan and Korea) held in December 2007. Efforts will be further strengthened in light of the collaborative plan on environmental cooperation adopted at the “12th Tripartite Environment Ministers Meeting among China, Japan, and Korea” in May 2010. Domestically, Japan has been conducting fact-finding studies since FY 2002 to determine the physical properties (e.g. particle diameter) and chemical properties (e.g. chemical components) of DSS, with studies being conducted at five sites. In addition, a monitoring network with advanced DSS observation equipment (i.e. Light Detection and Ranging, or LIDAR equipment) is being established under cooperation with the National Institute for Environmental Studies in order to ascertain the state of DSS inflows to Japan and to contribute to the creation of an international monitoring network. Furthermore,
No DatapH
<4.5 4.5-4.8 4.8-5.1 5.1-5.4 5.4-5.7 5.7-6.0 6.0<
JakartaSerpongBandung
Maros
BangkokPatumthaniSamutprakarn
Chiang MaiVientiane
Kototabang
XiamenHongwenXiaoping
Primorskaya
ImsilCheju
Kanghwa
TereljUlaanbaatar
MondyIrkutskListvyanka
Xi’an ShizhanWeishuiyuanJiwozi
ChongqingHaifuGuanyinqiaoJinyunshan
ZhuhaiXiang ZhouZhuxiandong
Phnom Penh
Nakhon Ratchasima
Kuching
Mt. Sto. TomasMetro ManilaLos Banos
HanoiHoa Binh
Danum Valley
Ogasawara
Hedo
Yusuhara
IjiraOki
TokyoHappoSado-seki
Banryu
TappiOchiishiRishiri
Note 1: Based on EANET publications.Note 2: Measurement methods were based on the EANET technical manuals, with QA/QC conducted.Note 3: For some sites, the average pH was calculated based on following time period: Guanyinqiao: 2005~2007 Kuching: 2008~2009 Haifu: 2008~2009 Yangon: 2007~2009 Weishuiyuan: 2005~2006 Nakhon Ratchasima: 2006~2009 Maros: 2008~2009 Cuc Phuong: 2009 Tokyo: 2007~2009 Da Nang: 2009Source: EANET The First Assessment Report on the State of Acid Deposition in East Asia, 2007
Yangon
Khanchanaburi
Da Nang
Cuc Phuong
Figure 2-2 pH of rain water in EANET region (Average pH 2005-2009)

Part 2
161
real-time observation data gained at a monitoring network composed of the LIDAR equipment installed in Japan and other countries has been provided on a website of the Ministry of the Environment, since FY 2007.
(2)Measures to Conserve Water Environment
A. Setting Environmental Quality Standards
Currently, the Environmental Quality Standards for water pollution covering substance related to health items, include 27 substances set for public waters and 28 substances set for groundwater, such as cadmium, lead and other heavy metals, trichloroethylene and other organochlorine compounds, and simazine and other agricultural chemicals. In FY 2010, the government made a reassessment of the cadmium standard values. Also, the government conducted the water quality measurements and gathering of knowledge and experiences for items other than those covered by water quality EQSs, such as specified monitoring items (currently 26 substances for public waters and 24 items for groundwater). As for substances related to the conservation of the living environment, various standards have been established for items such as BOD, COD, dissolved oxygen (DO), total nitrogen, total phosphorus, and total zinc. For the purpose of water-utilization, the environmental quality standards are specified for each type of designated water area. Also, the government studied the nation-wide soundness indicators of water environment. “Mizube-no-Sukoyakasa-Shihyou (Mizu-Shirabe),” which had been organized as indicators for realizing good water environment according to regional characteristics, as well as the assessment of water quality. The government also conducted long-term continuous measurements for setting environmental standards such as lower-layer DO in oceans and lakes.
B. Measures for Conserving Water Environments in Public Waters (Lakes and Enclosed Coastal Seas)
As a measure against eutrophication in lakes, the Water Pollution Contorol Law regulates the nitrogen and phosphorus in charged effluent. There are 320 lakes under the nitrogen control, and 1,393 lakes under phosphorus control. The Environmental Quality Standards (EQS) of nitrogen and phosphorus in lakes are specified for each type of designated water area for a total of 115 water regions including Lake Biwa. For the lakes whose water quality could be sufficiently conserved by the regulations of the Water Pollution Control Law alone, the regulation will be applied based on the Law concerning Special Measures for Preservation of Lake Water Quality (Law No. 61 of 1984), and the lake will be designated as a lake that requires the emergency restoration of lake water quality, followed by the development of a plan for the conservation of water quality and measures such as construction of sewage systems, water quality conservation projects such as river purification, and regulations for various sources of pollution. Also, the government conducted studies in order to clarify the pollution structure of lakes including Lake Biwa and to understand the relationship between phytoplankton and changes in ratios of nitrogen and phosphorus. Among area-wide enclosed coastal areas, the Total Pollutant Load Control System (TPLCS), with COD, nitrogen and phosphorus as the target reduction items (designated items), has been implemented in the Tokyo Bay, Ise Bay, and the Seto Inland Sea, where populations and industries are concentrated and it is therefore difficult to achieve and maintain EQSs for water pollution by effluent concentration control alone. Specifically, with respect to the pollution amounts emitted from factories and businesses which are larger than a certain scale in designated areas, the measures for industrial water
Ambient Air Pollution Monitoring Stations (AAPMSs)
0
500
1,000
1,500
2,000
0
100
300
200
400
500
1,424 1,397
100.0%1,397
1,42399.9%
437 441
40090.7%
39991.3%
FY 2008FY 2007FY 2006FY 2005
Num
ber of stations
Num
ber of stations
Number of valid measuring pointsNumber of stations achieving EQS
Roadside Air Pollution Monitoring Stations (RAPMSs)
1,379
100.0%1,379
1,366
100.0%1,366
431
40794.4%
421
40295.5%
Source: Ministry of the Environment, “FY 2009 Monitoring Results of Hazardous Air Pollutants,”
Achievement Ratio
423405
95.7%
FY 2009
1,351
100.0%1,351
FY 2008FY 2007FY 2006FY 2005 FY 2009
Achievement Ratio
Figure 2-3 Changes in Achievement of Nitrogen Dioxide EQS (FY 2005 to FY 2009)

162
FY2010
discharge have been taken under guidance to observe the standards for total pollutant load control established by the governors based on a scope by the Minister of the Environment. In addition, the measures covering daily life water discharge, by maintaining sewage systems, septic tanks, agricultural community effluent treatment facilities and local night soil treatment facilities, have continued to be taken in accordance with the situation of each area, as well as, improvement of combined sewer systems. and other related measures. As a result, the water quality in these enclosed coastal areas is tending to improve, but the achievement rate of EQSs for COD, total nitrogen, and total phosphorous remains incompletely accomplished (however, most of the environmental standards for total nitrogen and total phosphorous have been achieved in the Seto Inland Sea, except for Osaka Bay), and the challenges associated with enriched nutrients have being on going.
(3)Measures for Conserving the Soil Environment
A. Counter measures Soil Contamination in Urban Areas
Based on the Soil Contamination Countermeasures Act, the government is conducting the investigation of lands used as sites for a plant or workplace in order to identify decommissioned specified Facilities Using Hazardous Substances. Up to the end of March 2010, 1,487 studies have been conducted since that law was enacted, and as a result of those studies, 435 sites have been found to exceed designation standards and have been registered as contaminated by designated hazardous substances (of those, 233 lands have already been de-registered after removal of contaminated soil). Based on the Revised SCCA that was enacted in April 2010, a test for engineers to obtain qualifications as a Technical Manager, which is a position required
to be present at designated investigation institutions based on the Revised SCCA was conducted in December 2010. Also, in July 2010. the government provided the Guidelines (an interim version) for businesses conducting investigations and taking measures based on the Revised Soil Contamination Countermeasures Act. Studies were also conducted to promote the prevention technologies and investigations covering low-cost and low environmental impact problems.
B. Measures against Soil Contamination on Agricultural Land
Of the 7,487ha of areas where contaminant amounts in excess of standards were detected, as of the end of March 2010 6,577ha (72 areas) had been designated as areas where measures are to be planned against soil contamination of agricultural land, 6,492ha (72 areas) of that had plans formulated for measures against soil contamination, and countermeasure work has been completed for 6,620ha (a 88.4% ratio of progress). Temporary measures until completion of countermeasure work in areas contaminated with cadmium. The de-velopment, demonstration, and promotion of technologies
Source: Ministry of the Environment, “The Results of the Survey on Enforcement Status of the Soil Contamination Countermeasures Act & Numbers and Trends of Soil Contamination Investigations and Countermeasures in the FY 2009”
13 25 37 50 48130130 151
210274
366456
673 696 728
79 83 5979
82422 26 3211 31 19 10 10 16
382396
421
486
630639
0
200
400
600
800
1,000
1,200
1,400
1,600
FY 2007FY 2006FY 2005FY 2004FY 2003FY 2002FY 2001FY 2000FY 1999FY 1998FY 1997FY 1996FY 1995FY 1994FY 1993FY 1992FY 1991FY 1990FY 1989
Number of cases satisfying the standardNumber of cases exceeding the standard
Enforcement of Quality Standard for soil determinedAugust 23, 1991
Items added to EQSs for soil(February 21, 1994 15 items including VOC)(March 28, 2001Fluorine and boron)
Soil Contamination Countermeasures Act implemented in February 15, 2003
40 444435 60 6447
213209 210289
1,159
877
656762
1,367
700
6661,366
575
6781,253
1,326
Num
ber of cases investigated
FY 2008 FY 2009
Figure 2-5 Number of Soil Contamination Cases Identified by Fiscal Year
Source: Measurement Results of Water Quality in Public Waters (Ministry of the Environment)
1995 1996 1997 1998 1999 2000 2001 2002 2003 2004 2005 2006 2007 2008 2009(year)
0
20
40
60
80
100
Tokyo Bay Ise BayOsaka Bay Seto Island Sea (Except Osaka Bay)
Achievem
ent rate (%)
Figure 2-4 Changes in EQS Achievement Rate in Three Coastal Regions (Total Nitrogen and Total Phosphorus)

Part 2
163
to limit crops that absorbing cadmium from soil are also being conducted. In April 2010, the content standard for cadmium in rice based on the Food Sanitation Act was revised from less than 1.0ppm to below 0.4ppm. As a result, from June onward, designation requirements for areas of soil on
agricultural land requiring countermeasure was changed from “areas with 1mg or more” per 1kg of rice to “areas with more than 0.4mg” per 1kg of rice by promulgating and enacting the government ordinance on the Partial Amendment to the Enforcement Ordinance of the Agricultural Land Soil Pollution Prevention Act.
Ceramics wasteGlass wasteMetal wasteKitchen WasteFiber wastePlastic waste Wood, bamboos, and weedsPaper wastePET bottles
1980
1981
1982
1983
1984
1985
1986
1987
1988
1989
1990
1991
1992
1993
1994
1995
1996
1997
1998
1999
2000
2001
2002
2003
2004
2005
2006
2007
2008
(Year)
100%
80%
60%
40%
20%
0%
(ten thousand tons)
Figure 3-1 Volume of Municipal Solid Waste by Type (Breakdown)
3. Building a Sound Material-Cycle Society
(1)Let’s Start Practicing the 3Rs
A. Introduction
In Part 1, we gave an overview of the waste and recycling situation in Asia and the rest of the world and reviewed the directions of overseas expansion by venous industries, from the perspective of how Japan can contribute to solution of the world’s problems with waste. In this section, we will take a look at the state of Japan’s progress toward building a sound material-cycle society.
B. In Order to reduce Waste Generation. Start from What We Can Do
The Basic Act on Establishing a Sound Material-Cycle Society prioritizes various measures for waste and recycling. That is, the priorities are assign to generation
control, second to reuse, third to recycle, fourth to heat recovery, and then finally to proper treatment. An inspection report for the progress of the FY 2010 Basic Plan for Establishing a Sound Material-Cycle Society pointed out that efforts for the first-priority, generation control are insufficient. Here we will look at generation control. Figure 3-1 shows changes in Japan’s generation of municipal solid waste by type. In recent years, kitchen waste and paper waste made up approximately 70% of the total. For that reason, we will focus particularly on generation control of kitchen and paper waste.
1) Generation control of kitchen waste (particularly untouched food and leftovers) The photograph (from Kyoto City survey results) shows untouched food (food that was disposed of without being eaten at all) that was disposed of as municipal solid

164
FY2010
waste. According to an estimation by the Ministry of the Environment based on data from FY 2007, of all the household kitchen waste for the entire country, this kind of untouched food makes up 1.99 million tons (19% of kitchen waste) and leftovers make up 2.09 million tons (20% of kitchen waste). This is clearly generation of waste that can be reduced, and can be considered as generation of environmental load. In addition, since the factors behind the instability of food supply and demand throughout the world, such as a global population increase and further global warming, are becoming obvious, it is also necessary to work to reduce leftovers in order to secure food stability. Promoting local production for local consumption of food will also lead to creation of a sound material-cycle society. In addition, amid a situation in which more than 900 million people, mainly in developing countries, have nutrition deficiencies, these kinds of large amounts of untouched food and leftovers are against the spirit of “mottainai” of trying not to waste anything, which is a mentality that Japan can boast to the world. According to estimates by the Ministry of the Environment, reducing that untouched food and leftovers by 75% would result in control of generation of approximately 5.93 million tons of waste per year (approximately 1.0% of Japan’s total generation of waste) and a reduction of approximately 4.19 million tons of CO2 per year in terms of greenhouse gases emissions (equivalent to the amount for approximately 830 thousand general households), when the process is considered all the way back to the production stage. Specifically, there are many ways of generation reduction, such as sales methods that account for changes in consumers’ lifestyles (selling by weight, selling per piece, etc.), consumption based on correct understanding of the meaning of expiration date labels, inventory management aimed at avoiding food waste, and cooking methods that avoid food waste. All these are efforts that individual parties can make with a little ingenuity.
2) Generation control of paper waste (in particular, controlling generation of paper used by office equipment) According to Ministry of the Environment estimates based on data from FY 2007, of paper waste disposed as business waste from offices, 1.41 million tons is paper for office equipment. That amount is 26% of all business paper waste. It is estimated that by reducing that office equipment paper waste by 10% we can reduce waste generation by approximately 300 thousand tons of waste per year (approximately 0.05% of Japan’s total waste generation) and a reduction of 176 thousand tons of CO2 emissions of greenhouse gases per year (equivalent to the amount for approximately 35 thousand general households), when the process is considered all the way back to the manufacturing stage.
3) Promoting 3R actions It is important to make efforts for 3R actions such as controlling waste generation through the collaboration and cooperation of individual citizens, NPOs, NGOs, universities, businesses, local governments, and the national government all carrying out their expected roles. For example, some communities are providing opportunities for relevant parties to take 3R actions together and to after economic incentives (benefits) for 3R activities. Some communities are utilizing 3R eco-point systems as mechanisms to enjoy 3R actions. Campaigns are also being conducted to promote the use of drink containers such as reusable water bottles and coffee cups (“My Bottle” and “My Cup”) at offices, schools, and various other places. Above are just a few examples of such efforts. The small daily efforts of each individual, such as trying to minimize waste and making ever action with the mottainai mindset, will have a significant effect on creating a sound material-cycle society. Japan will further promote the creation of opportunities for 3R actions and make efforts to build a sound material-cycle society.
Photo 3-1 Untouched Food Disposed of as Municipal Solid Waste (Based on the Result of the Kyoto City’s Survey)
Untouched food 19%
Leftovers 20%
Food preparation waste 50%
Non organic waste 11%
Amount of Kitchen Waste
(FY 2007 Household) 10.32 million tons
Figure 3-2 Breakdown of Kitchen Waste: Ratio of Untouched food, Leftovers, and Others)

Part 2
165
Household (Untouched Foods)Household (Food Preparation Waste etc)
Household (Leftovers)Business (Municipal solid waste)
Household (Untouched foods)Household (Food preparation waste etc)
Household (Leftovers)Businesses (Municipal solid wastes)
195
0 100 200 300 400Breakdown of GHG Emissions Reduction by waste type (million tons- CO2)
500 600 700 800
205 39 342 781
Landfill Reduction: 160,000 tons(Equivalent to about 2.5% of final disposal volume of municipal solid waste(Note3))
3.53 million tons-CO2
0.63 million tons-CO2
1.41 million tons-CO2
2.01 million tons-CO2
6.01 million tons (Kitchen Waste Only)
2Rs Efforts
Food Production
88.33 million tons
2) 5.45 million tons
Waste reduction: 11.56 million tons-waste (wet weight)(Equivalent to about 2.0% of the volume of entire waste in Japan - Note2)
GHG Emissions Reduction: 7.81 million tons-CO2
(Equivalent to the GHG emissions of 1.55 million households - Note 1)Breakdown
High-Level
289
0 200 1,2001,000800600400Breakdown of Waste Reduction by waste type (ten thousand tons)
304 58 505 1,156High-Level
GHG Emissions: 144.08 million tons-CO2
Volume of Waste generated 100.58 million tons-waste (wet weight)Breakdown
3) GHG Reduction
Scope of Evaluation
A Scenario of 75% Reduction of Untouched Food and Leftovers and its Effect on Environmental Burden Reduction
Note 1: Estimated based on FY 2008 CO₂ Emissions per household (including use of automobile etc) of 5,040 kg CO2 per householdNote 2: Estimated based on FY 2007 Total Volume of Waste (generation only within Japan): 590.90 million tonsNote 3: Estimated based on FY 2007 Final Disposal Volume: 6.35 million tonsNote 4: Reduction of production and reduction of resource use due to the waste reduction (Reduction in each phase)
2) Resource Reduction in Flow of Resource and Production (Note 4)
Reduction in Waste, etc. Generation
Meals
307
157 149
0000
50505050
100100100100
150150150150
200200200200
250250250250
300300300300
350350350350
Untouched Food & Leftovers
Leftovers Untouched Food
Kitchen waste reduction
Kitchen waste reduction
Kitchen waste reduction
Kitchen waste reduction
(ten thousand tons)(ten thousand tons)(ten thousand tons)(ten thousand tons)
419
209 210
0000
50505050
100100100100
150150150150
200200200200
250250250250
300300300300
350350350350
400400400400
450450450450
Untouched Food & Leftovers
Leftovers Untouched Food
GHG
emissions reduction
GHG
emissions reduction
GHG
emissions reduction
GHG
emissions reduction
(ten thousand tons -CO
(ten thousand tons -CO
(ten thousand tons -CO
(ten thousand tons -CO
2222))))
593
282311
0000
100100100100
200200200200
300300300300
400400400400
500500500500
600600600600
700700700700
Untouched Food & Leftovers
Leftovers Untouched Food
Reduction of waste generation
Reduction of waste generation
Reduction of waste generation
Reduction of waste generation
(in million tons)
(in million tons)
(in million tons)
(in million tons)
9
5 4
0000
1111
2222
3333
4444
5555
6666
7777
8888
9999
10101010
Untouched Food & Leftovers
Leftovers Untouched Food
Volum
e of Municipal W
aste Landfill Volum
e of Municipal W
aste Landfill Volum
e of Municipal W
aste Landfill Volum
e of Municipal W
aste Landfill (ten thousand tons)(ten thousand tons)(ten thousand tons)(ten thousand tons)
0.23 million tons-CO2
Food Production
17.32 million tons
2) 1.07 million tons
Food Purchase 84.75
million tons
2) 4.1 million tons
Cooking & Preservation
84.75 million tons
2) 4.1 million tons
1) 6.01 million tons
2) 6.01 million tons
3) 0.16 million tons
Kitchen waste 8.68
million tons
Waste Treatment
8.68 million tons
Volume of Landfill 0.33
million tons
5.11 million tons 0.29 million tons 0.15 million tons
Figure 3-3 Analysis of the Kitchen Waste Reduction and its Effect on Environmental Burden Reduction (Whole Life Cycle Analysis of a High Level Case)

166
FY2010
The Effects of Efforts to reduce Generation of Paper for Office Equipment
Column
In offices, a lot of paper is consumed for a wide variety of purposes, such as documents sent exter-nally, documents used for internal meetings, and documents printed by employees for proofreading. A variety of efforts are possible for controlling the generation of paper waste. The Ministry of the Environment conducted a two-week verification campaign with the cooperation of a business in the Tokyo metropolitan area, to see the effect of the efforts to control generation of paper waste. Specifically, the company made a decision at a management meeting, and their approximately 260
employees made efforts in the office accordingly, such as double-sided and n-up printing and paperless meetings, and determined the amount of reduction accomplished by such efforts. During the first week the employees made thorough efforts to control waste generation. During the second week, the management made a graphical presentation of the change in the number of pages printed (the number on the printer/copy machine counter) in order to visualize the changes for their employees, and the employees continued their efforts to control waste generation. As a result, they achieved a 7% reduction according to conversion by the printer/copy machine counter. In addition, compared to before the campaign, all
2Rs Efforts実施場所
Within Offices
○Paperless/Computerization・Computerize office documents (e.g.. detailed statements)・Automate intra-office documents (Use bulletin board systems and electronic payment systems)
・Hold Paperless Meetings (e.g. Use a projector)・Apply printing restrictions to electronic files (e.g.. disable printing)
○Reduce paper consumption・Use double-sided and n-up printing・Reduce bookcases and implement free-seating scheme○Avoid excess printing・Ensure the number of printed documents required (e.g. determine the number of meeting attendees)
○Eliminate printing mistakes・Preview documents before printing
Outside Offices
○Paperless/Computerization・Use email (including file attachment)・Use electronic commerce systems (e.g. EDI and CALS) ・Provide information on website○Avoid excess printing・Ensure the number of printed documents required (e.g.. determine the number of meeting attendees)
・Reduce wasteful document printing for customers (e.g.. improve inventory management of catalogues)
Table 1 An Example of Office Paper Reduction Efforts
29
28
27
(Counter
)
26
25
28.3 28.2
26.5
Before the campaign (5th day)
1st Week of the campaign (5th day)
2nd week of the campaign (4th day)
Figure 1 Office Paper Reduction (Changes in the Number of Pages Printed from a Multifunctional Printer per Day per Active User)
Before the campaign1st week of the campaign2nd week of the campaign
50% 60% 70% 80% 90% 100%
Before the campaign1st week of the campaign
2nd week of the campaignAllow access to internal memos and business documents electronically
Hold paperless meetings
Use double-sided printing for meeting handouts
Use n-up printing for meeting handouts
Reuse paper used on one side whenprinting in-progress documents
Proofread documents on screen before printing
Check the number of printouts required
Preview documents before printing
Utilize recycle boxes
Use shredders for confidential documents only
Use our own cups or reusable cups at meetings
Use our own cups during working hours and at break
Figure 2 Paper Waste Reduction Efforts and Changes in Implementation Rate (Changes in Ease of Practice)

Part 2
167
of the actions to control waste generation were conducted at a higher ratio at the end of the campaign. Actions that particularly increased were holding paperless meetings (14.0%), n-up printing (10.5%), and double-sided printing (7.1%). After the campaign, a questionnaire was also distributed concerning effective methods for motivating people to make efforts to control waste generation in that office. The answer the most people gave was to make such actions the company regulations, followed by their colleagues actions. It is believed that factors such as making office rules and creating a positive atmosphere at the office are effective for encouraging actions to control waste generation.
Company regulations
50.6%
Others12.7%
Observing colleague's
actions16.3%
Boss’s order3.6%
Performance appraisal rating
6.6%
Opportunities for studying environmental issues
10.2%
Figure 3 Determinants for Environmental Behaviors
(2)The Material Flow of our Country
The first step to establishing a Sound Material-Cycle Society is to know the amount of resources we are collecting, consuming and dumping. In the material flow overview for Japan (in FY 2008) (Figure 3-5), the total material input was 1.74 billion tons. 660 million tons were accumulated as buildings and society’s infrastructure. 180 million tons were exported as products, 490 million tons were used in the energy consumption, and 580 million tons of wastes were generated. Out of these items, the amount cyclical recycled was 250 million tons, equivalent to 14.1 % of the total material input. In the Second Fundamental Plan for Establishing a Sound Material-Cycle Society (cabinet decision in March 2008, hereafter called the “Fundamental Plan for a Sound Material-Cycle Society”, specific goals have been set for indexes concerning “entrance,” “exit” and “circulation” of the material flow, that is, three different aspects of the material flow (or substance flow), in order to facilitate the well-balanced development of measures such as reduction, reuse, recycling and disposal, and to promote the formation of a well-balanced and advanced sound material-cycle society.
The target year of each index is FY 2015.
Recent achievements of each index are as below:1) Resource productivity (= GDP / Input of natural resources etc) (Figure 3-6) FY 2008: About 361,000 yen per ton (about 38% increase from FY 2000 of 260,000 yen per ton).
2) Cyclical use rate (= amount of recycling utilization / (amount of circulative utilization + Input of natural resources etc)) (Figure 3-7) FY 2008: About 14.1% (about 4.1 point increase from FY 2000 of about 10 %).
3) Final disposal volume of waste (= Volume of waste landfill) (Figure 3-8). FY 2008: About 22 million tons (about 60% decrease from FY 2000 of about 56 million tons).
(3)Amount of waste generated
A. Status of municipal solid wastes (garbage)
The total volume of waste *1 in FY 2009 was 46.25 million tons (3.9% decrease from the previous year), or 994 grams daily per person (3.8% decrease from the previous year) (Figure 3-9). *1: “Total volume of waste” = “designed collection volume + volume of waste directly brought in + group-based recyclable resource collection”.
Looking at the shifts of human waste treatment populations, it can be seen that the number of combined household wastewater treatment facilities is increasing, conversion of household wastewater treatment facilities leads to removal and connection to public sewage systems, and the overall population for water-purifier tanks remains at an almost steady level. In contrast, due to an increase in the population for public sewage systems (87.82 million people as of FY 2009), the population comboned for flush toilet users (116.62 million people as of FY 2009) is increasing each year.
B. Status of industrial waste treatment
The total volume of industrial wastes generated across the country in FY 2008 was 403.66 million tons. About 216.51 million tons (54% of the total volume) were reclaimed, about 170.45 million tons (42% of the total volume) were reduced by intermediate processing, and 16.70 million tons (4% of the total volume) were subject to final disposal. The volume of reclamation refers to the total volume of the directly reclaimed volume plus the volume reclaimed from the treatment residue produced by intermediate treatment. The volume of final disposal
Indexes Resource productivity Cyclical use rate The amount of final disposalGoals about 420 thousand yen per ton about 14-15% about 23 million tons

168
FY2010
Note: Wet waste, etc means water content included in waste (e.g. sludge, animal waste, human waste, waste acid and waste alkali) and input of earth and sand as a result of economic activities (e.g. sludge generated by mining, construction and waterworks and slag from mining).
Source: Sound Material-Cycle Society Planning Committee, Ministry of the Environment
Export(181)
Final disposal(22)
Imported products(57)
Net increase to stock(660)
Domestic resources(683)
Import(809)
Imported resources(752)
Input of Natural resources, etc.
(1,492)
Total material input(1,737)
Wet waste, etc (Note)(277)
Generation of waste, etc.(578)
Volume of cyclical use(245)
Fertilizing(18)
Export(120)
Final disposal(56)
Imported products(48)
Net increase to stock(1,110)
Energy consumption and waste generated during industrial
processes(500)
Energy consumption and waste generated during industrial
processes(487)
Domestic resources(1,125)
Import(800)
Imported resources(752)
Input of Natural resources, etc.
(1,925)
Total material input(2,138)
Wet waste, etc (Note)(299)
Generation of waste, etc.(595)
Volume of cyclical use(213)
Fertilizing(16)
(Unit: million tons)
FY 2000 (For Reference) FY 2008
(Unit: million tons)
Food consumption(97)
Reduction(241)
Returned to environment(85) Returned to environment(82)Food consumption(91)
Reduction(225)
Figure 3-5 Material Flow in Japan (FY 2008)
My Bottle, My Cup Campaign logo mark
What is “My Bottle, My Cup Campaign”?
The efforts to encourage people to use their own bottles, tumblers, jugs and tea cups (e.g. “My Bottle” and“My Cup” ) in workplaces, universities, schools and away from home, and to promote the reduction of environmental load.
To provide infrastructure, distribute bottles, and conduct monitoring and study to verify the progress of the effort and its effect on the reduction of environmental loadAttended by 1) Ferris University,
2) Yokohama City University 3) Osaka University
Coffee shops that serve in your own cups and bottles
Installation of water colers that refill your bottles.
Specific examples of the campaign
Demonstration experiments at universities
○Opened an exhibition booth at Eco Life Fair provided by the Ministry of the Environment on 5-6 Jun. Provided tea service and promotion display.
○Declared October as a special month to promote 3Rs activities. Requested local government and communities for cooperation. Provided support.
Awareness campaign at events (2010)
○Provided the information telling which shops serve in your own bottles.
○Introduced examples of the companies making advanced efforts in their workplaces.
○Introduced examples of the awareness promotion activities of local governments.
Provided information on Websitehttp://www.re-style.jp/bknbr/mybottle
Figure 3-4 My Bottle, My Cup Campaign

Part 2
169
refers to the total volume of the wastes directly sent for final disposal and the volume of treatment residue sent for final disposal after intermediate treatment (Figure3-11).
C. Measures for Reducing Greenhouse Gases in the Field of Waste
The emission of greenhouse gases derived from waste was approximately 34.31 tons (carbon dioxide equivalent) in FY 2008, and has been steadily declining in recent years, due to efforts based on the “Kyoto Protocol Target Achievement Plan.”
(4)Number of Incidents and Amount of Illegal Dumping
In FY 2009, there were 279 new cases of illegal dumping (57 thousand tons), and 187 cases of inappropriate treatment of industrial waste (379 thousand tons).
(5)Japan’s approach to a sound material-cycle society
In order to ensure the steady implementation of the Sound Material-Cycle Society Fundamental Plan, the Central Environmental Council is required to review the progress of measures based on the Fundamental Plan for a Sound Material-Cycle Society every year and report on the direction of future policies to the government as necessary. In FY 2010 the Council conducted the third evaluation of the progresses of the measures based on the Fundamental Plan for a Sound Material-Cycle Society. As for the state of enforcement of the Waste Man age-
ment and Public Cleansing Law, the Central Environ-ment Council gave its opinion on the “direction for reconsideration of the waste treatment system” in January 2010. Reviews were conducted based on that opinion, and the “Bill for Making Partial Amendment to the Waste Management and Public Cleansing Law” was decided upon by the Cabinet on March 5, 2010, and submitted to the Diet on the same day. The bill was unanimously approved and enacted by both the Lower House and the Upper House, and promulgated on May 19, 2010. Also, the “cabinet ordinance partially amending the Enforcement Ordinance of the Waste Management and Public Cleansing Law” was decided upon by the Cabinet on December 17, 2010, and promulgated on December 22, 2010. These amendments excluding some of the parts were enacted on April 1, 2011. As for container and package recycling, a joint meeting of the Central Environment Council and the Industrial Structure Council was held and the councils summarized the guidelines of plastic container recycling methods. The summary stated that the prioritization of material recycling methods would be continued for the moment, and identified measures for improving the quality of material recycling methods, such as improving the bid system. In addition, in order to promote the 3Rs for container and packaging waste, the Ministry of the Environment is conducting dissemination and awareness raising activities for consumers through the waste containers and packaging reduction promoters (nicknamed “the 3R Promotion Meister”) commissioned based on the Containers and Packaging Recycling Law. The Ministry of the Environment has also been conducting the “My Bottle, My Cup Campaign” since June 2010 for reducing the amount of disposable drink containers, conducting awareness raising activities at events with the cooperation of local governments, groups and corporations, and conducting demonstration experiments at universities. As for automobile recycling, the Ministry of the Environment released the “Report on the Progress of the Automobile Recycling System” in January 2010, and proposed that they should clarify the handling procedure of used vehicles and end-of-life vehicles. Based on the Report, the joint council working groups of the Central Environment Council and the Industrial Structure Council started discussions in July 2010 to develop guidelines to serve as criteria for determining end-of-life vehicles and used vehicles, and released a “Report on Source: Ministry of the Environment
05
1015202530354045
FY 1985 FY 1990 FY 1995 FY 2000 FY2005 FY2010 FY2015
Resource productivity (ten thousand yen/ton)
Target: 420,000 yen/ton
Figure 3-6 Changes in Resource Productivity
0
2
4
6
8
10
12
14
16
Target: 14-15%
Cyclical U
se Rate (%)
FY 1985 FY 1990 FY 1995 FY 2000 FY2005 FY2010 FY2015
Source: Ministry of the Environment
Figure 3-7 Changes in the Cyclical Use Rate
0
20
40
60
80
100
120
Final disposal volume
(million tons)
Target: 23 million tons
FY 1985 FY 1990 FY 1995 FY 2000 FY2005 FY2010 FY2015
Source: Ministry of the Environment
Figure 3-8 Changes in the Final Disposal Volume of Waste

170
FY2010
Determining End-of-Life Vehicles” in February 2011. With the aim of building an appropriate and effective system for recycling rare metals, in 2009 the government held the “Study Group for Collecting Rare Metals from Used Small Household Appliances while also reviewing Proper Treatment” again, and conducted model projects in seven areas throughout Japan, and reviewed the efficient and effective collection methods. The government also studied the rare metals contained in the collected end-of-life small household appliances, conducted assessment of the hazards and appropriate treatment of recycling such appliances, and reviewed assessment of the options of the recycling system. In order to review recycling systems of small electric and electronic devices and the recycling of useful metals from end-of-life products, the Waste and Recycling
Sub-committee of the Central Environment Council’s Committee started discussions in March 2011.
(6)International efforts
In May 2008, the G8 Environment Ministers Meeting was held in Kobe, featuring the 3Rs as one of the main themes. The ministers confirmed that the actions for 3Rs have spread among G8 states and other countries since the “3Rs Initiative” was proposed at the G8 Summit in 2004, and agreed upon the “Kobe 3R Action Plan”, that included actions and objectives to encourage further 3R development among G8 states. The Action Plan also received support from G8 Summit leaders at the G8 Hokkaido Toyako Summit in July 2008, held in the Lake Toya area in Hokkaido. As for the efforts in Asia, Japan is working in co-op eration with the United Nations Centre for Regional Development (UNCRD), the United Nations Environment Program (UNEP), and the Institute for Global Environmental Strategies (IGES) and supporting countries such as Vietnam and Indonesia for their formulation of plans and strategies for to promote the 3Rs in accordance with the situation of each country. In FY 2009, Japan assisted Vietnam to formulate their national strategies, and in FY 2010, Bangladesh. In November 2009 a “Meeting of the Regional 3R Forum in Asia” was help with the joint sponsorship of the Ministry of the Environment and the United Nations Centre for Regional Development (UNCRD). The meeting had the participation of government representatives, international organizations, and experts on the 3Rs from fifteen countries in Asia. At the meeting, the participants agreed on a “TOKYO 3R STATEMENT: Towards the
Total volume of municipal solid waste Waste volume generated per person per day
Note: “Total volume of municipal solid waste” = “designed collection volume + volume of waste directly brought in + group-based recyclable resource collection”Source: Ministry of the Environment
2,500
3,000
3,500
4,000
4,500
5,000
5,500
6,000(ten thousand tons/year) (gram/man-day)
900
1,000
1,100
1,200
1,300
1,400
1,500
Total volume of m
unicipal solid waste
Waste volum
e generated per person per day
FY 1985
FY 1986
FY 1987
FY 1988
FY 1989
FY 1990
FY 1991
FY 1992
FY 1993
FY 1994
FY 1995
FY 1996
FY 1997
FY 1998
FY 1999
FY 2000
FY 2001
FY 2002
FY 2003
FY 2004
FY 2005
FY 2006
FY 2007
FY 2008
FY 2009
4,209
4,340
4,550
4,750
,4,9355,026
5,1135,090
5,1275,180 5,222
5,291 5,310 5,361 ,,5,3705,483 5,468 5,420 ,,5,427
5,338 5,2725,202
5,082
4,811
1,033
4,625
994
951975
1,017
1,061
1,0981,115
1,125 1,119 1,124,,1,138
1,152 1,1531,1621,159
1,185 1,1801,166 1,163 ,1,146
1,1311,115
1,089
,1,134
Figure 3-9 Changes in the Total Volume of Municipal Solid Waste and Waste Volume generated per Person and per Day
Public sewage system Gappei-shori JohkasoTandoku-shori Johkaso Not connected to sewage system
86.471.2 73.6 76.0 78.2 80.1 81.9 83.7 85.0
14.3
11.2 11.8 12.3 12.9 13.2 13.3 13.6 14.3
15.4
23.3 22.2 21.2 20.0 19.2 18.3 17.2 15.9
11.521.0 19.4 17.8 16.5 15.2 14.2 13.2 12.3
0.0
20.0
40.0
60.0
80.0
100.0
120.0
140.0
FY 2007 FY 2008
126.7 127.3 127.5 127.6 127.7 127.8127.0 127.5 127.5
87.8
14.1
14.710.8127.4
Population
FY 2009FY 2000 FY 2001 FY 2002 FY 2003 FY 2004 FY 2005 FY 2006
Note: All figures in the graph are populations (in millions).Source: Ministry of the Environment
Figure 3-10 Changes in the Population by Night Soil Treatment Facilities

Part 2
171
Establishment of the Regional 3R (Reduce, Reuse and Recycle) Forum in Asia,” and established the “Regional 3R Forum in Asia”. The participants decided to facilitate high-level policy dialogues on the 3R issues, facilitate improved dialogue and cooperation with countries for implementing 3R projects, provide a strategic and knowledge platform for sharing information, and provide a platform to develop networks of stakeholders under the Regional 3R Forum in Asia. The second meeting was held in October 2010 in Kuala Lumpur, Malaysia. It was co- hosted by the Ministry of the Environment, the Ministry of Housing and Local Government, Malaysia, and the United Nations Centre for Regional Development (UNCRD) and its theme was “3Rs for Green Economy and Sound Material-Cycle Society.” At the meeting. a Chair’s Summary was compiled, and Singapore expressed their decision to host the third Forum in Singapore in 2011, which the participants welcomed. In June 2009, the Minister of the Environment and the Minister of Environmental Protection of the People’s Republic of China concluded a memorandum to support cooperatire for creating environmentally-friendly cities by developing cyclical economic industries in Kawasaki City and Shenyang City, China. As part of the cooperation projects, the Ministry of the Environment and the Ministry of Environmental Protection of the People’s Republic of China held workshops in March 2010 in China’s Beijing and Shenyang cities, with the objective of sharing information on policies and technologies for creating a sound material-cycle society.
In addition, in order to appropriately conduct the export and import of the hazardous waste based on the Basel Convention, the Ministry of the Environment has been conducting activities for the “Asian Network for Prevention of Illegal Trans-boundary Movement of Hazardous Wastes” each fiscal year since 2004, and holding workshops and making various efforts have to promote dialogues with the people in charge of the Basel Convention in each of the countries in Asia and relevant international organizations inder to strengthen collaboration among them all. Also, in order to manage e-waste and computer waste in an environmentally appropriatemanner in the Asian-Pacific region, Japan is also providing financial and technological support for the projects implemented by countries under the Basel Convention. The United Nations Commission on Sustainable Development (CSD), which evaluates the state of implementation of “Agenda 21,” adopted at the 1992 Earth Summit. based on their annual plans, is taking up “waste management” as their theme for the two-year period from 2010 through 2011. In order to actively contribute to CSD discussions, the Ministry of the Environment organized a “CSD-19 Intersessional Conference on Building Partnerships for Moving towards Zero Waste” in Tokyo in February 2011, attended by experts on waste management and the 3Rs from around the world. The results of that conference were contributed to the 19th session of the CSD meeting held in May 2011.
Volume of waste generated
403,661,000 tons(100%)
419,425,000 tons(100%)
Reclamation216,507,000 tons
(54%)
218,811,000 tons(52%)
Final disposal16,701,000 tons
(4%)
20,143,000 tons(5%)
Reduction170,453,000 tons
(42%)
180,471,000 tons(43%)
Direct reclamation
90,694,000 tons(22%)
Intermediate treatment
305,783,000 tons(76%)
Direct final disposal
7,184,000 tons(2%)
Treatment residue
135,330,000 tons(34%)
Reclamation after treatment
125,813,000 tons(31%)
Final disposal after treatment
9,516,000 tons(2%)
Figures in square brackets are figures from FY 2007.
* Figures in each item are rounded off; therefore the total may not equal the breakdowns.
Figure 3-11 Industrial Waste Treatment Flow (FY 2008)

172
FY2010
(1)Current State of Chemical Substances Remaining in the Environment
In today’s society, a wide variety of chemical substances are used in various industrial activities and daily living, providing convenience to our lives. In addition, there are some chemical substances generated unintentionally as a result of incineration and other activities. There are some chemical substances that would pollute the environment, causing harmful effects to the human health and ecosystems, if they are not properly managed in the various stages of manufacturing, distribution, use, or disposal. The Ministry of the Environment has been conducting eenvironmental survey and monitoring of the state of chemical substances remaining in the general environment and releasing the findings in “Chemicals in the Environment” (http://www.env.go.jp/chemi/kurohon/). The government has been examining the selection of target chemical substances and improving the survey methods in accordance with the environmental measures so that the results of the survey would be utilized effectively in measures to tackle chemicals in the environment since FY 2002. The government conducted the surveys with a new adopted framework that consisted of several surveys with
different purposes: the Initial Environmental Survey, the Detailed Environmental Survey for Exposure Study, and Environmental Monitoring from FY 2010. These survey results have been utilized in various substances-related policy measures, including the addition of substances for regulation to the Act on the Evaluation of Chemical Substances and Regulation of Their Manufacture, etc. (Act No. 117 of October 16, 1973, hereinafter referred to as “the Chemical Substances Control Law”), review of the designation of certain chemical substances, under the Law Concerning Reporting, etc. of Releases to the Environment of Specific Chemical Substances and Promoting Improvements in Their Management (Law No. 86 of 1999, hereinafter referred to as “PRTR Law”), and the basic data for the implementation of environmental risk assessment.
(2)Promoting the Environmental Risk Assessment of Chemical Substances
In response to the need in regard to environmental policies and based on the results of the above-mentioned environmental survey and monitoring of chemicals, the government is assessing the harmful effects on human
4. Assessing and Managing the Environmental Risk of Chemical Substances
Volume of illegal dumping (ten thousand tons) Number of illegal dumping cases (cases)
44.4 43.3
679719
855
1,197
1,049
1,027
1,150
934894
673
558 554
74.5
Gifu City volume56.7
21.9
40.8 42.4 40.3
24.231.8
17.820.7
17.2
12.0 14.4 5.710.2
20.3
382308
279
FY 1995 FY 2006
41.1
Numazu City volume20.4 Chiba City volume
1.1
13.1
FY 2008 FY 2009FY 2005FY 2004FY 2003FY 2002FY 2001FY 2000FY 1999FY 1998FY 1997FY 1996
Kuwana City Tado Town volume
5.8
FY 2010
(cases)
60.0
80.0
100.0
140.0
120.0
(ten thousand tons)
0.0
20.0
40.0
600
800
1,000
1,200
1,400
0
200
400
Note 1: Regarding the number of cases and volume of illegal dumping shown above, from among illegal dumping of industrial waste identified by prefectures and ordinance-designated cities, cases where the volume of dumping per case was 10 tons or more were totalized (however, cases including specially controlled industrial waste were all counted individually).
2: The cases of Gifu City and Numazu City were revealed in 2003 and 2004 respectively and it was found that the illegal dumping had already been carried out for several years by then. As a result, these cases were reported as a large-scale case in the above fiscal years. The case of Chiba City case (colored white) was revealed in FY 1998 but reported to the Ministry of the Environment in FY 2006.The case of Kuwana City Tado Town (colored white) was revealed in FY 2006 but reported to the Ministry of the Environment in FY 2008.
3: Sulfate pitch cases and ferrosilt cases were excluded from this survey and would be arranged for separate survey reporting.Ferrosilt was used as refill materials, and its sales and use started in August 2001. Approx. 720,000 tons were sold and used, but later this was identified as illegal dumping cases. The illegal dumping was confirmed at 45 sites in four prefectures, and removal of ferrosilt has been completed at 42 sites (as of February 15, 2010).
* Figures were rounded off; therefore the total may not equal to the breakdowns.Source: Ministry of the Environment
Volum
e of illegal dumping
Num
ber of illegal dumping cases
Figure 3-12 Changes in the Number of Illegal Dumping Cases of Industrial Waste and Volume Dumped

Part 2
173
health and ecosystems from exposure to chemical substances in the environment (environmental risk). One of those efforts is the ninth report of the Preliminary Assessment of the Environmental Risk compiled in FY 2010. In the report, a preliminary initial assessment was conducted for 14 substances for their health risks and ecological risks. Furthermore, a preliminary assessment was conducted for an additional seven substances regarding their ecological risks. Based on the results, one substance was determined as the “candidates for detailed assessment” from its preliminary assessment for environmental risks, and two substances was determined to have possibility to have relatively high risk to from their preliminary
assessment of ecological risks. To further enhance knowledge regarding effects on the ecosystems, the government has tested 18 substances in FY 2010 for their ecological effects on algae, daphnids and fish in accordance with the OECD testing guidelines. Following the amendment of the Chemical Substances Control Law in May 2009, the government reviewed the methods and other issues pertaining to environmental risk assessment based on the Chemical Substances Control Law. Furthermore, since it is urgent need to acquire knowledge on the dynamics, toxicity, and environmental risk of the nanomaterials, the government collected information on experiences with nanomaterial and the technologies for the environmentally appropriate management of the nanomaterials both from Japan and overseas.
(3)Management of the Environmental Risk of Chemical Substances
(a)Eff orts based on the Act on the Evaluation of Chemical Substances and Regulation of Their Manufacture, etc.
Based on the Chemical Substances Control Law, in FY 2010, the government received 660 applications for the manufacture/import of new chemical substances (339 of which were for low quantities) and conducted preliminary
□Objective of Environmental pollution prevention concerning chemical substances with high risk□Risk assessment and risk management with chemical substances
Category Regulatory measures
Annotation: The class of each material is that applied as of the end of March in 2011.
Source: Ministry of Health, Labour and Welfare, Ministry of Economy, Trade and Industry, Ministry of the Environment.
・Prohibition in principle of manufacturing, import, and use・The handling technical guideline provideing details in which use is allowed limitedly is observed.
The class - I Specified Chemical Substances. (28 substancesincluding PCB)
The class - II Specified Chemical Substances(23 substancesincluding trichloroethylene)
Priority Assessment Chemical Substances (88 substances)
Monitoring Chemical Substances(37 substances)
・Mandatory reporting of planned and actual manufactured or imported amounts ・(If necessary.) Limitation of manufacturing or import amounts・Compliance with technical guidelines of handling
Category Measures・Mandatory reporting on actual manufactured or imported amounts・When an investigation concerning harmfulness is directed, and long-term toxicity is admitted, it specifies the substance as a Class-I Specified Chemical Substance.
・Mandatory reporting on actual manufactured or imported amounts・When the risk assessment is done and the risk is acknowledged, it specifies the substance as a class-II Specified Chemical Substance.
1. Risk assessment・A person who intends to manufacture or import new chemical substances shall notify the government about their hazardous data points as listed below, and the government shall inspect them.(1) biodegradation(2) biomagnification(3) toxicity for human health and living organisms
The manufacturers and importers are obliged to submit reports to the government for review.・The chemical substances that are persistent, biomagnificative, and have long-term toxicity are specified as Class-I Specified Chemical Substances.・The chemical substances that are persistent and biomagnificative, but whose toxicity properties are unknown are specified as Monitoring Chemical Substances.・The screening assessment is done with General Chemical Substances, etc (existing chemical substances and examined new chemical substances that don’t correspond to the above-mentioned categories) based on manufactured or imported amount, and toxicity information. The chemical substances for which risk is assumed to exist are specified for Priority Assessment of Chemical Substances.
2. Risk management・As a result of risk assessment, the specified Chemical Substances are managed by the regulation of manufacturing, import, and use according to properties of the material.
Figure 4-1 Outline of Act on the Evaluation of Chemical Substances and Regulation of Their Manufacture, etc.
(4) From Autonomoustype vehicle (19%)
Release insideNotification40%
(1) From thebusinesses subjectto Reporting (9.2%)
(2) From the businessesnot subject toreporting (20%)
2. Releaseoutside
Notification(60%)
1. Releaseinside
Notification(40%)
届出排出量・届出外排出量の合計
441千トン/年
(3) From Home(12%)
Figure 4-2 Ratio of Release inside and outside Notification in FY 2009
Source: Ministry of Economy, Trade and Industry, Ministry of Environment.
Reported releases and transfersEstimated releases outside notification
71
33
1214
50
47
0.11
0.018
0.30
0.031
0.81
0.0058
29
16
13 1.3
13
12
10
9.6
Toluene
Xylene
Ethylbenzene
n-alkylbenzenesulfonic acid and its salts
Polyoxyethylene alkyl ether
p-dichlorobenzene
chloromethylene
Benzene
HCFC―22
D―D
(121)
(80)
(29)
(9.6)
(26)
(16)
(15)
(13)
(12)
(11)
The figure in brackets is the total of reported releases and transfers and releases outside notification.
(Unit: thousand tons/year)
0 50 100 150
Source: Ministry of Economy, Trade and Industry, Ministry of Environment
Figure 4-3 Top 10 Chemicals of those Reported Released and Transfers and Estimated Releases Outside Notification (FY 2009)
174
FY2010
reviews accordingly.
(b)Law Concerning Reporting of Releases to the Environment of Specifi c Chemical Substances and Promoting Improvements in Their Management
As for the Pollutant Release and Transfer Registers (PRTR) system based on the Law Concerning Reporting of Releases to the Environment of Specific Chemical Substances and Promoting Improvements in Their Management, the ninth report since the enactment of the Law, regarding the volumes of pollutant released to the environment by businesses in FY 2009, was submitted to the national government via the local government prefectures. The Ministry of the Environment released estimated release volumes in February 2011 based on the reported data of individual businesses, their aggregate
result, and the government’s estimation of the quantities of chemical substances of parties who are not designated as being subject to PRTR reporting (businesses exempt from reporting, domestic sector, automobile, etc.)
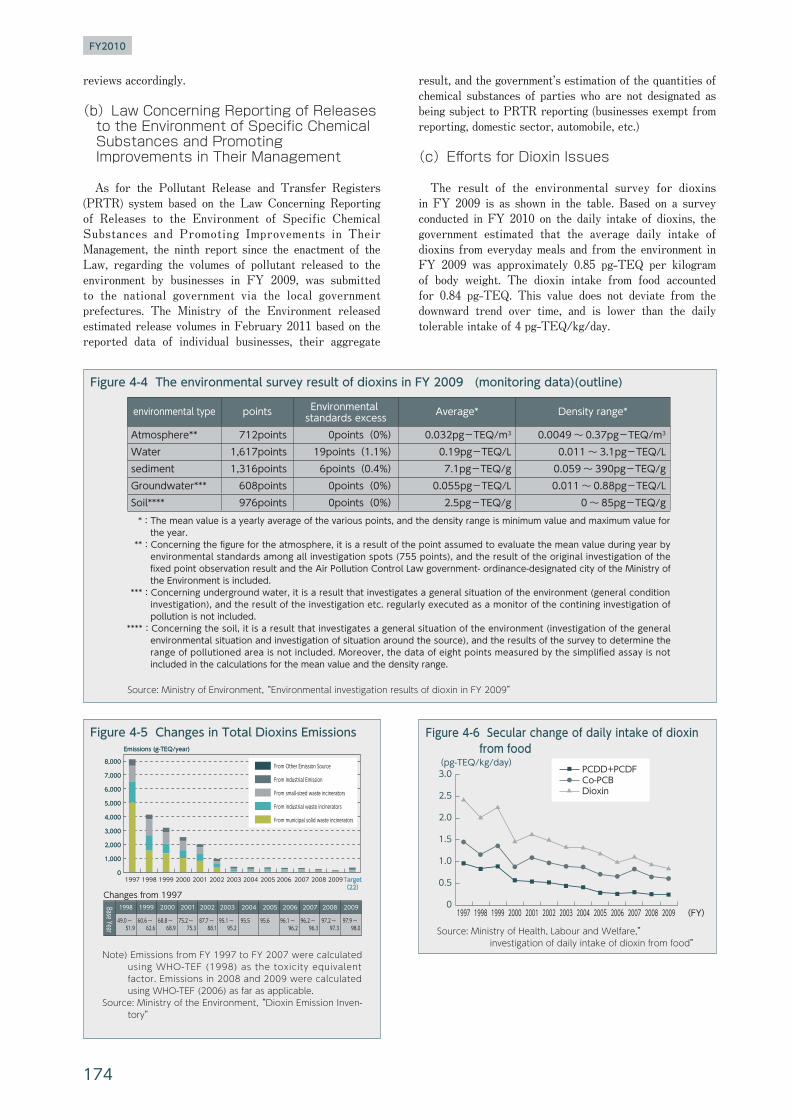
(c)Eff orts for Dioxin Issues
The result of the environmental survey for dioxins in FY 2009 is as shown in the table. Based on a survey conducted in FY 2010 on the daily intake of dioxins, the government estimated that the average daily intake of dioxins from everyday meals and from the environment in FY 2009 was approximately 0.85 pg-TEQ per kilogram of body weight. The dioxin intake from food accounted for 0.84 pg-TEQ. This value does not deviate from the downward trend over time, and is lower than the daily tolerable intake of 4 pg-TEQ/kg/day.
Figure 4-5 Changes in Total Dioxins Emissions
00
1,0001,000
2,0002,000
3,0003,000
4,0004,000
5,0005,000
6,0006,000
7,0007,000
8,0008,000
1997 1998 1999 2000 2001 2002 2003 2004 2005 2006 2007 2008 2009
Emissions (g-TEQ/year)Emissions (g-TEQ/year)
From Other Emission Source
From Industrial Emission
From small-sized waste incinerators
From industrial waste incinerators
From municipal solid waste incinerators
Changes from 19972007
49.0 ~ 51.9
60.6 ~ 62.6
68.8 ~ 68.9
75.2 ~ 75.3
87.7 ~ 88.1
95.1 ~ 95.2
95.6 96.1 ~ 96.2
96.2 ~ 96.3
2008 2009
97.2 ~ 97.3
97.9 ~ 98.0
Base Year
1998 1999 2000 2001 2002 2003 2004 2005 2006
95.5
Target(22)TargetTargetTargetTarget(22)(22)(22)(22)
Note) Emissions from FY 1997 to FY 2007 were calculated using WHO-TEF (1998) as the toxicity equivalent factor. Emissions in 2008 and 2009 were calculated using WHO-TEF (2006) as far as applicable.
Source: Ministry of the Environment, “Dioxin Emission Inven-tory”
PCDD+PCDFCo-PCBDioxin
019981997 1999 2000 2001 2002 2003 2004 2005 2006 2007 2008 2009 (FY)
0.5
1.0
1.5
2.0
2.5
3.0(pg-TEQ/kg/day)
Source: Ministry of Health, Labour and Welfare,” investigation of daily intake of dioxin from food”
Figure 4-6 Secular change of daily intake of dioxin from food
*:The mean value is a yearly average of the various points, and the density range is minimum value and maximum value for the year.
**:Concerning the figure for the atmosphere, it is a result of the point assumed to evaluate the mean value during year by environmental standards among all investigation spots (755 points), and the result of the original investigation of the fixed point observation result and the Air Pollution Control Law government- ordinance-designated city of the Ministry of the Environment is included.
***:Concerning underground water, it is a result that investigates a general situation of the environment (general condition investigation), and the result of the investigation etc. regularly executed as a monitor of the contining investigation of pollution is not included.
****:Concerning the soil, it is a result that investigates a general situation of the environment (investigation of the general environmental situation and investigation of situation around the source), and the results of the survey to determine the range of pollutioned area is not included. Moreover, the data of eight points measured by the simplified assay is not included in the calculations for the mean value and the density range.
Source: Ministry of Environment, “Environmental investigation results of dioxin in FY 2009”
environmental type points Environmental standards excess Average* Density range*
Atmosphere**WatersedimentGroundwater***Soil****
712points1,617points1,316points608points976points
0points(0%)19points(1.1%)6points(0.4%)0points(0%)0points(0%)
0.032pg-TEQ/m3
0.19pg-TEQ/L7.1pg-TEQ/g
0.055pg-TEQ/L2.5pg-TEQ/g
0.0049 ~ 0.37pg-TEQ/m3
0.011 ~ 3.1pg-TEQ/L0.059 ~ 390pg-TEQ/g0.011 ~ 0.88pg-TEQ/L
0 ~ 85pg-TEQ/g
Figure 4-4 The environmental survey result of dioxins in FY 2009 (monitoring data)(outline)

Part 2
175
(1)The Current State of Biodiversity
The “Global Biodiversity Outlook 3 (GBO3),” published by the Secretariat of the Convention on Biological Diversity, concluded that the 2010 Biodiversity Target has not been met at the global level. None of the twenty-one subsidiary-targets accompanying the overall target for significantly reducing the rate of biodiversity loss by 2010 can be said to have been definitively achieved globally, although some have been partially or locally achieved. The “Japan Biodiversity Outlook,” published by Ministry of the Environment in May 2010, assessed Japan’s state of achievement of 15 of the 21 sub-targets set in order to achieve the 2010 Target. The assessment found that only 2 of those sub-targets had been achieved, while 10 sub-targets were not sufficiently achieved, and the remaining 3 were not achieved in any way. Based on this, it concluded that Japan’s state of biodiversity is improving in some areas, but its overall trend of loss of biodiversity has not stopped.
(2)Efforts to Make Biodiversity Permeate Society (Making Biodiversity Mainstream)
The government has released the “List of Actions by Citizens for Biodiversity,” which would give citizens ideas for individual biodiversity actions, through a wide variety of opportunities. The“Life on Earth Supporters’ Club,” which is a public relations organization started by celebrities, carried the message of the importance of biodiversity. In March 2010, the Japanese female singer MISIA was appointed “Honorary Ambassador for the Tenth Meeting of the Conference of the Parties (COP10) to the United Nations Convention on Biodiversity,” and the government provided support for her activities. The United Nations declared May 22 every year to be the “International Day for Biological Diversity,” and the Secretariat of the Convention on Biological Diversity is calling for a “Green Wave” that will connect a wave of trees planted from Earth’s East to West. The Ministry of the Environment, the Ministry of Agriculture, Forestry and Fisheries, and the Ministry of Land, Infrastructure, Transport and Tourism encouraged extensive participation in activities for the “Green Wave 2010,” and approximately 1,600 groups and 111,000 people participated throughout Japan. 2010 was the year that the United Nations designated the “International Year of Biodiversity,” and the United Nations encouraged the establishment of national organizations consisting of a variety of parties and the holding of commemorative events. For that reason, in January 2010 the government established the “Japanese Committee for the International Year of Biodiversity” and held commemorative events such as the kick-off event. In order to assist local governments in Japan and other countries to exchange information about biodiversity efforts and facilitate the promotion of their future activities, Aichi Prefecture and the City of Nagoya co-
hosted the “Nagoya Biodiversity City Summit” during the period of COP10, and the summit’s results were reported to the ministerial-level meeting at COP10. The government provided assistance for the “Private Sector Engagement Initiative on Biodiversity,” which was established as a voluntary program mainly in the economic sector to promote private-sector participation in the implementation of the Convention on Biological Diversity, particularly in such areas as conservation of biodiversity and its sustainable use. As a COP10-related conference, the government held the “International Youth Conference on Biodiversity in Aichi 2010” with the aim of providing opportunities for the world’s young people to meet each other and increase their awareness of biodiversity. 100 young people from 66 countries around the world participated in the Conference, and its results were announced at COP10. In December 2010, the “Act on the Promotion of Conservation for Biodiversity Activities through the Cooperation among Regional Diversified Actors (Biodiversity Conservation Activity Promotion Law)” was enacted. This law is under joint jurisdiction of the Ministry of the Environment, the Ministry of Agriculture, Forestry and Fisheries, and the Ministry of Land, Infrastructure, Transport and Tourism. The purpose of the law is to promote activities for biodiversity through collaboration by a variety of parties such as municipalities, NPOs, local residents, and corporations. In January 2011, the government started the examination for fundamental policies based on the Law, and a review session was held to examine promotion activities for biodiversity conservation and opinion exchanges at nine sites across Japan (Sapporo, Sendai, Tokyo, Nagoya, Osaka, Okayama, Takamatsu, Kumamoto, and Naha).
(3)Efforts for Rebuilding Relationships between People and Nature on the Earth
Five species of insects (Cybister lewisianus, Cybister rugosus, Dytiscus sharpi, Neolucanus saundersii donan Mizunuma, and Melitaea scotosia) were added to the list of national endangered species of wild fauna and flora prescribed in the Act on Conservation of Endangered Species of Wild Fauna and Flora (Law No. 75 of 1992; hereinafter referred to as the “Species Conservation Law”), and there are now 87 species of national endangered wild fauna and flora, consisting of 5 species of mammals, 38 species of birds, 1 species of reptiles, 1 species of amphibians, 4 species of brackish and freshwater fish, 15 species of insects, and 23 species of plants. In November 2010, the Program for the Rehabilitation of Natural Habitats and Maintenance of Viable Population of Pteropus pselaphon was newly formulated, and the program is now being carried out for a total of 48 species. As for the case of the Japanese crested ibis, in March 2010, a number of Japanese crested ibis were attacked by a marten and killed at an acclimation training facility at the Sado Japanese Crested Ibis Conservation Center.
5. Conservation of Biodiversity and Its Sustainable Use

176
FY2010
Table 5-1 Status of 2010 Biodiversity Target
1.1:At least 10% of each of the world ’ s ecological regions effectively conserved.
More than half of terrestrial eco-regions meet the 10% target. However, management effectiveness is low for some protected areas. Marine and inland water systems lack protection, though this is increasing.
1 .2:Areas o f pa r t i cu la r impor tance to biodiversity protected.
An increasing proportion of the sites of importance for conserving birds, and those holding the last remaining populations of endangered species, are being protected.
2.1:Restore, maintain, or reduce the decline of popu la t ions o f spec ies o f se lec ted taxonomic groups.
Many species continue to decline in abundance and distribution. However, some efforts have resulted in the recovery of targeted species.
2.2:Status of endangered species improved. Species are on average at increasing risk of extinction. However some species have moved to lower risk categories.
3.1:Genetic diversity of crops, livestock, and other valuable species conserved, and associated indigenous and local knowledge maintained.
Progress has been made towards conserving genetic diversity of crops through ex situ actions; however agricultural systems continue to be simplified. Genetic resources in situ and traditional knowledge are protected through some projects, but continue to decline overall.
4.1:Products derived from sources that are sustainably managed, and production areas managed consistent with the conservation of biodiversity.
Progress for some components of biodiversity such as forests and some fisheries. Globally, sustainable use does not account for a large share.
4.2:Unsustainable consumption, of biological resources or the impacts upon biodiversity, reduced.
Unsustainable consumption has increased and continues to be a major cause of biodiversity loss.
4 .3:No spec ies o f w i ld f auna o r f l o ra endangered by international trade.
Wild fauna and flora continue to decline as a result of international trade, but successes achieved particularly through implementation of the Convention on International Trade in Endangered Species of Wild Fauna and Flora (CITES).
5.1:Rate of loss and degradation of natural habitats decreased.
Some progress in reducing the rate of loss in areas, but many biodiversity sensitive regions continue to decline.
6.1:Pathways for major potential alien invasive species controlled.
Not achieved globally as the introduction of invasive alien species continues to increase as a result of greater transport, trade, and tourism. However, action related to plant protection and ballast water promises to reduce the risk of new invasions.
6.2:Management plans in place for major alien species that threaten ecosystems, habitats or species.
Not achieved globally, though some management plans are in place. Most countries lack effective management programs.
8.1:Capacity of ecosystems to deliver goods and services maintained.
There have been continuing and in some cases escalating pressures on ecosystems. However, there have been some actions taken, to ensure the continued provision of ecosystem services.
8 .2:B io log i ca l resources tha t suppor t sustainable livelihoods, local food security and others, especially of poor people.
Many of the biological resources, such as fish, mammals, birds, amphibians and medicinal plants, are in decline, with the world’s poor being particularly affected.
9.1:Protect traditional knowledge, innovations and practices.
Long-term declines in traditional knowledge and rights continue, despite the actions taken to protect them in some areas.
9.2:9.2: Protect the rights of indigenous and local communities over their traditional knowledge, innovations and practices, including their rights to benefit sharing.
An increasing number of co-management systems and community-based protected areas have been established.
10.1:All transfers of genetic resources are in line with the Convention on Biological Diversity, the International Treaty on Plant Genetic Resources for Food and Agriculture and other applicable agreements.
An increasing number of material transfer agreements have been developed under the Treaty.
7.1:Maintain and enhance resilience of the components of biodiversity to adapt to climate change.
Limited action has been taken to enhance the resilience of biodiversity. However, the establishment of biodiversity corridors may help species to migrate and adapt to new climatic conditions.
7.2:Reduce pollution and its impacts on biodiversity.
Measures to reduce the impacts of pollution on biodiversity have been taken, resulting in the recovery of some previously heavily degraded ecosystems. However, many previously pristine areas are being degraded. Nitrogen deposition continues to be major threat to biodiversity in many regions.
Goal1Subsidiary targets Status Details
Goal2
Goal3
Goal4
Goal5
Goal6
Goal8
Goal9
Goal10
Goal7
Promote the conservation of the biological diversity of ecosystems, habitats and biomes
Promote the conservation of species diversity
Promote the conservation of genetic diversity
Promote sustainable use and consumption
Pressures from habitat loss, land use change and degradation, and unsustainable water use, reduced
Control threats from invasive alien species
Maintain capacity of ecosystems to deliver goods and services and support livelihoods
Maintain socio-cultural diversity of indigenous and local communities
Ensure the fair and equitable sharing of benefits arising out of the use of genetic resources
Address challenges to biodiversity from climate change, and pollution
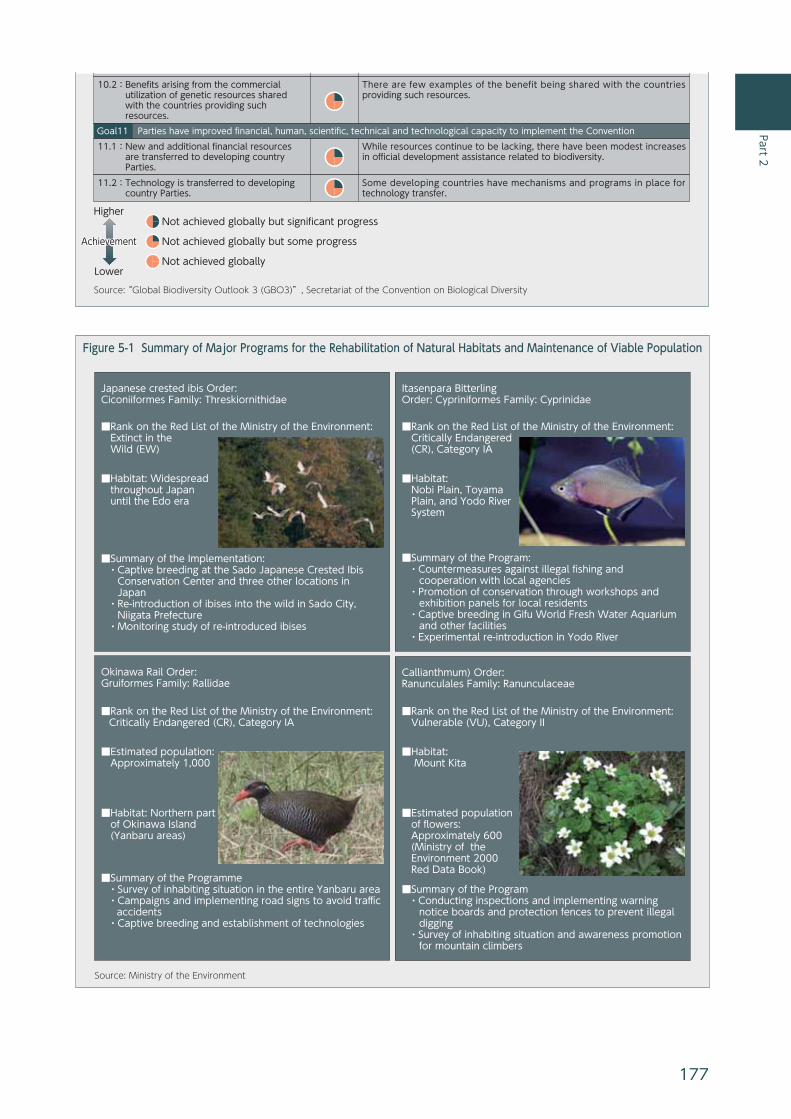
Part 2
177
Japanese crested ibis Order: Ciconiiformes Family: Threskiornithidae
Itasenpara Bitterling Order: Cypriniformes Family: Cyprinidae
■Rank on the Red List of the Ministry of the Environment: Extinct in the Wild (EW)
■Habitat: Widespread throughout Japan until the Edo era
■Rank on the Red List of the Ministry of the Environment: Critically Endangered (CR), Category IA
■Habitat: Nobi Plain, Toyama Plain, and Yodo River System
■Summary of the Program: ・Countermeasures against illegal fishing and cooperation with local agencies
・Promotion of conservation through workshops and exhibition panels for local residents
・Captive breeding in Gifu World Fresh Water Aquarium and other facilities
・Experimental re-introduction in Yodo River
■Rank on the Red List of the Ministry of the Environment: Vulnerable (VU), Category II
■Estimated population of flowers: Approximately 600 (Ministry of the Environment 2000 Red Data Book)
■Habitat: Mount Kita
■Summary of the Program ・Conducting inspections and implementing warning notice boards and protection fences to prevent illegal digging
・Survey of inhabiting situation and awareness promotion for mountain climbers
■Rank on the Red List of the Ministry of the Environment: Critically Endangered (CR), Category IA
Okinawa Rail Order: Gruiformes Family: Rallidae
■Habitat: Northern part of Okinawa Island (Yanbaru areas)
■Estimated population: Approximately 1,000
■Summary of the Programme ・Survey of inhabiting situation in the entire Yanbaru area ・Campaigns and implementing road signs to avoid traffic accidents ・Captive breeding and establishment of technologies
Callianthmum) Order: Ranunculales Family: Ranunculaceae
■Summary of the Implementation: ・Captive breeding at the Sado Japanese Crested Ibis Conservation Center and three other locations in Japan
・Re-introduction of ibises into the wild in Sado City, Niigata Prefecture
・Monitoring study of re-introduced ibises
Source: Ministry of the Environment
Figure 5-1 Summary of Major Programs for the Rehabilitation of Natural Habitats and Maintenance of Viable Population
Source: “Global Biodiversity Outlook 3 (GBO3)”, Secretariat of the Convention on Biological Diversity
10.2:Benefits arising from the commercial utilization of genetic resources shared with the countries providing such resources.
There are few examples of the benefit being shared with the countries providing such resources.
Not achieved globally but significant progress
Achievement
Higher
Lower
Not achieved globally but some progress
Not achieved globally
11.1:New and additional financial resources are transferred to developing country Parties.
While resources continue to be lacking, there have been modest increases in official development assistance related to biodiversity.
11.2:Technology is transferred to developing country Parties.
Some developing countries have mechanisms and programs in place for technology transfer.
Goal11 Parties have improved financial, human, scientific, technical and technological capacity to implement the Convention

178
FY2010
As a result, a committee looking into that fatal accident made proposals, and the facility was improved, and workers were stationed on-site to oversee Program for the Rehabilitation of Natural Habitats and Maintenance of Viable Population of the Japanese Crested Ibis. Following releases in 2008 and 2009, Japanese crested ibis were released into the wild for the third time in November 2010 and for the fourth time in March 2011. In January 2011, to address bird strikes, including those involving endangered species, at wind power generation facilities, the government compiled various knowledge, information, and preventive measures that should be considered to reduce effects on bird species, into a “Guidebook for Appropriate Location of Wind Power Generation Facilities to Avoid Bird Strike.” For species such as Japanese crested ibis, Prionailurus bengalensis euptilurus, and Gallirallus okinawae that have an extremely high risk of extinction and that are hard to maintain using only conservation policies in their original habitats, conservation measures are being taken outside their habitats, such as breeding them in captivity. The government developed the “Basic Policy for Ex-situ Conservation of Endangered Species of Wild Fauna and Flora in Japan” in FY 2008, and the “Basic Concept on Returning Endangered Species of Wild Fauna and Flora to the Wild” in FY 2010. The government also conducted model projects (three projects for animals and two projects for plants) with the objective of establishing techniques for conservation of wild fauna and flora outside their habitats and returning plants and animals from ex-situ conservation facilities to the wild. Since October 2010, highlypathogenic Avian Influenza has been detected in fecal samples of waterfowl and swab samples of dead wild birds and poultry across Japan in places such as Hokkaido, Tottori Prefecture, and Kagoshima Prefecture. In addition to performing a regular survey of viruses and elucidating the status of the birds’ migration, the government has strengthened the surveillance of wild birds throughout Japan with the cooperation of local governments. The government also continued to conduct appropriate protection, and management of birds and animals also continues to be conducted. The Law for Ensuring the Safety of Pet Food (Law No. 83 of 2008) was enacted in June 2009. Based on this law, the pet food manufactured after December 2010 must be labeled with information regarding five categories including raw materials, the country of the production, and the date of expiration.
(4)Efforts to Ensure Connections among Forests, Villages, Rivers, and the Ocean
The government made a general evaluation of the nature of the national and quasi-national parks in accordance with changes in the natural environment and in social circumstances and diversification of landscape scenery, and released the compiled findings in October 2010. As a result, 18 areas, including the Amami Islands in Kagoshima Prefecture and the Yanbaru area of Okinawa Prefecture, were selected as candidates for newly designated national or quasi-national parks or
for a large-scale expansion. During the next decade, the government will conduct field research, initiate coordination for those candidate areas, and consider the designation of specific areas. In Japan, this is the first review and announcement of candidates for national or quasi-national parks in the last 39 years (first time since 1971), and this is the very first analysis based on scientific data. In FY 2010, the government reconsidered park zones and park plans for Shiretoko National Park, Bandai-Asahi National Park, Oze National Park, Joshin’etsuk-Kogen National Park, Hakusan National Park, Zao Quasi-National Park, Yatsugatake-Chushink-Kogen Quasi-National Park, and Aichik-Kogen Quasi-National Park. In particular, the Suzaka-Takayama area of Joshinetsu Kogen National Park was entirely reconsidered for the first time since its designation in 1949. Specifically, 1,765ha of its land, including wind-swept sites and subalpine coniferous forests, was changed from ordinary zones to special zones to further protect the area. In addition, the ecosystem management work, which started with the revision of the Natural Parks Law in 2009, was additionally applied to Shiretoko, Oze, and Hakusan National Parks, enabling comprehensive and adaptive measures against ecosystem damage caused by deer and alien plants. Based on the Wildlife Protection and Hunting Law (Law No. 88 of 2002), the zones that require particular protection of wildlife are designated as national wildlife protection areas. In FY 2010, Tadanaejima, Onoharajima, Kanmurijima-Kutsujima, Birojima, and Yonaguni were newly designated, and as of the end of March 2011 throughout Japan there were 77 national wildlife protection areas (569,245ha), 67 national wildlife special protection areas (146,552ha), and 2 national wildlife protection designated areas (1,159ha). In September 2010 the Ministry of the Environment developed the “Action Plan for Conservation and Sustainable Use of Satochi-satoyama” with the objective of expanding efforts by various entities to form a national movement. In addition, the Ministry of the Environment will introduce activity sites and experts on its webpages in order to promote volunteer activity participation by urban residents, as well as carry out training sessions, to provide advice and other assistance for continuation and promotion of activities aimed at the conservation and sustainable use of satochi-satoyama. Following the development of the Basic Plan on Ocean Policy based on the Basic Act on Ocean Policy (Law No. 33 of 2007), the Ministry of the Environment formulated the Strategy for Conservation of Marine Biodiversity, indicating Japan’s points of view on marine protection areas, among others. The Ministry of the Environment also formulated the Action Plan to Conserve Coral Reef Ecosystems to promote comprehensive efforts to conserve coral reefs.
(5)Efforts to Take Actions from a Global Point of View
In order to facilitate information-sharing, opinion exchanges, and collaboration among a variety of sectors for COP10, which took place in the City of Nagoya,

Part 2
179
Aichi Prefecture in October 2010, the government held two round-table meetings in FY 2010 for the “10th Meeting of the Conference of the Parties to the Convention on Biological Diversity and the 5th Meeting of the Conference of the Parties serving as the Meeting of the Parties to the Cartagena Protocol on Biosafety,” which was established in February 2009. In addition, in order to promote concerted government efforts for the preparation of COP10, the Ministry of the Environment held the “Meeting of Vice-Ministers of Relevant Ministries and Agencies for the 10th Meeting of the Conference of the Parties to the Convention on Biological Diversity (COP10),” attended by the vice ministers and Parliamentary Secretaries of relevant ministries and agencies, and carried out site management and operations at the “Secretariat of the Government of Japan for CBD-COP10” jointly established by the relevant ministries and agencies. Internationally, Japan participated in the preparatory negotiations and made contributions to holding meetings of the convention’s subsidiary bodies and working groups. Japan attended the high-level meeting of the United Nations General Assembly contributing to the International Year of Biodiversity held in New York in September 2010, called for cooperation in making COP10 a success, and held consultations with individual countries. As for the protocol on access and benefit sharing (ABS) of genetic resources, because a conclusion could not be reached on an ABS draft protocol at the 9th meeting of ABS working group held in Cali (Colombia) in March 2010, the resumed 9th meeting of ABS working group and the meeting of inter-regional negotiating group of the ABS working group were held in Montreal (Canada) in July and September, respectively. As the COP10 Presidency, Japan provided financial contributions required for holding the above two meetings, so that the Parties could consult fully on ABS. During COP10, Japan as the COP10 Presidency cooperated with the secretariat of the Convention and put its fullest efforts into the operation of the meetings and leading discussions. As a result, a total of 47 decisions were adopted, including the strategic plan for Biodiversity 2010-2011 (the Aichi Biodiversity Targets), and the Nagoya Protocol, on Access and Benefit Sharing (ABS) of genetic resources. It was strongly pointed out that in order to implement the decisions of COP10 and other aspects of the Convention it is necessary to provide developing countries with financing, technology transfers, and capacity building. As the COP10 Presidency, in FY 2010 Japan contributed JPY 1 billion to the Convention Secretariat from the Japan Biodiversity Fund, in order to support capacity building activities by developing countries aiming to achieve the Aichi Targets. With the adaptation of the Nagoya Protocol on ABS, to support the early entry in to force of the protocol, the government established a new fund in the World Bank, intended for conservation of natural habitats for genetic resources and the transfer of technology to developing countries. Japan has contributed 1 billion yen to this fund. In order to slow the accelerating loss of biodiversity
worldwide, it is not sufficient to merely conserve pristine environment. It is also important to make the development of human activities in harmony with the conservation of biodiversity in human-influenced natural environments, which have been impacted by human activities such as agriculture, forestry and fisheries, all over the world. To tackle this issue, the efforts to promote sustainable use and management of natural resources in human-influenced natural environments were proposed and announced at COP10 as the “Satoyama Initiative,” The “International Partnership for the Satoyama Initiative (IPSI)” was also launched to promote information sharing and research. At COP10, it was recognized by the conference of the parties that the Satoyama Initiative could be a useful tool to better understand and support human-influenced natural environments, for the benefit of biodiversity and human well-being. A decision was made to invite the parties to the convention, other governments and relevant organizations to participate in the IPSI to further advance the Satoyama Initiative. In March 2011, the first IPSI regular meeting was held in the City of Nagoya, Aichi Prefecture. At that meeting, members of its steering committee were elected and collaborative activities under the IPSI were endorsed.
Just prior to COP10, Japan served as host of the fifth meeting of the Conference of the Parties serving as the Meeting of the Parties to the Cartagena Protocol on Biosafety (COP/MOP 5), which was held in October 2010. At that meeting the “Nagoya-Kuala Lumpur Supplementary Protocol on Liability and Redress to the Cartagena Protocol on Biosafety” was adopted.
Based on the Ramsar Convention, as of the end of March 2011, Japan has 37 Ramsar sites registered as internationally important wetlands. In addition to promoting efforts for conservation and wise use of those Ramsar sites, consideration is being given to adding candidate sites for Ramsar sites, and in September 2010 the government released a list of 172 potential candidate sites that would meet international standards for Ramsar sites. Japan has also cooperated with countries in Southeast Asia in order to designate, conserve, and wisely use internationally important wetlands in the area. In addition to regulations on imports and exports of endangered threatened wild fauna and flora based on CITES (the Convention on International Trade in Endangered Species of Wild Fauna and Flora), Japan also regulates domestic transfers of species listed in Appendix I of the Convention. Relevant ministries, agencies, and organizations have also been cooperating to reduce illegal trading of species subject to the convention’s regulations, including trade through the Internet. Yakushima, Shirakami-Sanchi, and Shiretoko are inscribed on the World Heritage List, based on the Convention for the Protection of the World Cultural and Natural Heritage (World Heritage Convention). Conservation and management measures for these sites have been implemented a collaborative manner within relevant ministries and agencies, local governments, local relevant parties, and experts. In June 2010, the government launched a scientific committee comprised

180
FY2010
of experts for Shirakami-Sanchi, following the similar efforts for Shiretoko and Yakushima, Consequently, all the Japanese sites come to have the same system of knowledge-based conservation and management. As for the Ogasawara Islands, for which the government submitted a nomination dossier to the World Heritage Center in January 2010, the government collaborated with relevant organizations to accept an on-site investigation by experts from the International Union for Conservation of Nature and Natural Resources, an organization that assesses nominations, and to appropriately respond to requests for additional information. Measures were also considered for conserving the globally important natural value of the domestic candidate Ryukyu Islands (the islands southwest of Tokara Island are subject to review), while obtaining the cooperation of relevant people in the area. Based on bilateral migratory bird conventions and other frameworks with the United States, Australia, China, Russia, and South Korea, joint research efforts were continued for Short-tailed Albatross, Steller’s sea eagle, and the Larus saundersi Gull in order to conserve birds that migrate between the countries. In November 2010 in Niigata Prefecture, meetings of bilateral conventions and agreements and other frameworks for the conservation of migratory birds and their habitats were held with Australia, China, and South Korea. Their information and opinions were exchanged concerning protective policies, studies, and research concerning migratory birds. In June 2010, the 6th International Coral Reef Initiative (ICRI) East Asia Regional Workshop was held in Phuket (Thailand), and the ICRI East Asia Regional Strategy on MPA Networks 2010 was formulated. The map of coral reef habitat in the Asian/Oceanic region that was created was made public on the related webpage. The 9th session of the United Nations Forum on Forests was held from January through February 2011 in New York. Under the theme of “Forests for People,
Livelihoods and Poverty Eradication,” consideration was g iven to assessment of the progress made on implementation of Non-Legally-Binding Instruments on all types of forests, and methods of implementing sustainable forest operations (provision of financing, technology transfers, etc.) At the High-Level Segment held during the forum, an official opening ceremony was held for the International Year of Forests, 2011, and a Ministerial Declaration was adopted clarifying the importance of sustainable forest management and implementation, as well as future efforts for international cooperation. At the 46th Session of the International Tropical Timber Council (ITTC) that was held in Yokohama in December 2010, projects and activities for promoting development of tropical timber trade and sustainable tropical forest operations were approved. Decisions were also adopted concerning the ITTO’s activity report on the 2010 International Year of Biodiversity 2010 and action plans for the International Year of Forests, 2011. In order to comprehensively assess and analyze the country’s state and trends of biodiversity, including social aspects, Japan established the Committee on Comprehensive Assessment of Biodiversity in Japan in FY 2008, and the Committee released a report in May 2010. Further, with the aim of establishing indicators that will be important for assessing the state of achievement of targets in order to prevent loss of biodiversity on national land, the government conducted a review concerning special analysis and assessment methods for the state of and changes in the biodiversity of national land. As for “The Economics of Ecosystems and Biodiversity (TEEB),” which are international efforts that conduct economic analysis on loss of biodiversity and ecosystem services, the government provided assistance for the compilation of the Final Report for COP10, and conducted the research on policies related to economic assessment of biodiversity with TEEB.
6. Basics for Various Policies, and Measures Related to the Participation of Various Entities and International Cooperation
(1) Government’s Overall Efforts
(a) The environmental conservation expenditures
Regarding the governmental budget relating to environmental conservation, the Ministry of the Environment liaises with each government office and ministry and makes adjustments to their budgets relating to environmental protection, and presents and compiles those budgets into the environmental conservation expenditures to ensure that the government as a whole deploys the environmental protection measures effectively and efficiently. The total amount of expenditures in FY 2011 was JPY 1,209.1 billion.
(b) Check of the subsequent progress of the Basic Environmental Plan
The Central Environment Council reviewed the progress of the implementation of policies based on the Basic Environmental Plan and submitted a report to the government. In the 4th review of the Third Basic Environmental Plan conducted in 2010, the Council focused on the following five priority fields: 1) efforts for global warming, 2) efforts to ensure material recycling and to establish a sound material cycle society, 3) efforts to reduce environmental risks from chemical substances, 4) efforts for the conservation of biodiversity, and 5) promotion of developing human resources and communities for environmental conservation among the ten priority fields of the Plan, The result was reported by the Central Environment Council Chairman to the Minister of the Environment in October 2010, and the

Part 2
181
(As of March 31, 2011)
Procedure
Procedure active
Procedure completed
Procedure discontinued
Minister of the Environment’s opinion**
Road
77(22)
14(0)
54(21)
9(1)
55(21)
River
7(0)
1(0)
5(0)
1(0)
5(0)
Railway
15(4)
3(1)
10(3)
2(0)
10(3)
Airport
9(0)
1(0)
7(0)
1(0)
7(0)
Power plant
56(12)
12(0)
39(12)
5(0)
38(12)
Waste disposal site
5(1)
1(0)
4(1)
-
-
Landfill and reclamation
13(3)
3(1)
9(2)
1(0)
1(0)
Area development
20(9)
2(0)
14(7)
4(2)
14(8)
Total
196(50)
36(2)
138(45)
22(3)
129(44)
* Figures in ( ) show the number of cases conducted under the Law in the way of procedure. Figures outside ( ) include these numbers. When two projects are implemented together, it is counted as one.
** Those opinions include the opinion of “no opinion”. The Minister of the Environment presents opinions only when the authorizing agency is a national organization.
*** The Misumi~Masuda 9th national highway, the Kajima joint power plant No5 machine installation plan, and the Yuasa~Gobou 42nd national highway widening completed the notification and the general inspection requirements in FY 2010 based on Article 27 of Environmental Impact Assessment Law.
**** The Japan Steel Works, Ltd. Muroran Plant Central power plant replacement plan, the Wakayama point power plant No1 machine replacement plan and Hachinohe Port Navigation anchor ground completed the notification in FY2010 based on Article 4-3-2 of Environmental Impact Assessment Law.
Figure 6-1 Status of Environmental Impact Assessment Procedures in Accordance with the Environmental Impact Assessment Law.
Minister of the Environment later reported the result to the Cabinet.
(2) Environmental Impact Assessment
Among development projects such as constructing roads, dams, railways, airports, landfills/land reclamation and land readjustment, large-scale projects that could have a serious impact on the environment are required to follow the EIA procedure by the Environmental Impact Assessment Law (Act No.81 of 1997). By FY 2011, 196 projects were concluded with the procedure based on EIA Law. Eight of these projects started to carry out the EIA procedure and six of them were concluded with the procedure based on the EIA Law in FY 2010 (all included the screening process). These contributed to evaluating environmental protection properly for large-scale projects.
(3) Current State of Measures against Minamata Disease
Since the Supreme Court ruling on the Kansai lawsuit in 2004, 8,282 people have applied for certification under the Act Concerning Compensation and Prevention of Pollution-Related Health Damage (excluding those who withdrew their applications after issuance of the health care passbook). Also, 28,346 people have been newly issued a health care passbook (applications closed in July 2010), and six new lawsuits have been filed against the government for compensation. The increasing number of people asking for relief pushed forward a review to crystallize the new remedial relief measures for Minamata Disease victims. This led to the promulgation and enforcement of the Act on Special Measures Concerning Relief for Victims of Minamata Disease and Solution to the Problem of Minamata Disease (Act No. 81 of 2009; hereinafter referred to as “Special Relief Act”) in July 2009 based on an agreement
reached by the Democratic Party, Liberal Democratic Party, and Komeito. In April 2010, the Cabinet decided on the implementation policy for relief measures stipulated by the Special Relief Act (hereinafter referred to as “policy for relief measures”). Based on this “policy for relief measures,” the people recognized to be suffering from paresthesia of distal extremities or systemic sensory disturbance are eligible for a lump sum payment from the enterprises concerned, a medical care passbook and a subsidy for the self-pay portion of the medical treatment cost and medical care allowance by Comprehensive Measures of Minamata Disease. As for the people whose sensory disturbance is not as bad as the level eligible for the lump sum payment and who are suffering from symptoms shared by Minamata Disease, they are also eligible for health care passbooks and the subsidy for the self-pay portion of the medical treatment cost. On May 1, 2010, then Prime Minister Hatoyama attended and gave prayers at the Memorial Service for Victims of Minamata Disease as the first prime minister to do so. Applications for benefits opened on the same day. As of the end of March 2011, the number of applications has come up to 26,419 people in total (14,824 people for Kumamoto Prefecture, 10,576 people for Kagoshima Prefecture, and 749 people for Niigata Prefecture). Also, the eligible people began to receive a lump sum payment under the Special Relief Act in October 2010. In July 2010, the government appointed Chisso Corporation as a specified corporation and approved its restructuring plan in December 2010, so as to ensure that the company fulfills its compensation responsibility to the certified victims and continues to make lump sum payments under the Special Relief Act and settlement.
Also, settlement talks were held with some groups that had filed a lawsuit earlier. Both the plaintiffs and defendants accepted the opinion presented by the
182
FY2010
Kumamoto District Court in March 2010, establishing the basic agreement for an amicable settlement. A similar basic settlement was reached at the Niigata District Courts in Niigata, Osaka, and Tokyo, and the procedures for settlement had begun. In March 2011, settlements were reached at each District Court. Finally, the government is strongly facilitating the enhancement of the health care and welfare provision in communities with Minamata disease incidents, and is promoting the revitalization and development of those communities, such as by attending and supporting the “Minamata Environmental Community Development Study
Group” sponsored by the City of Minamata.
(4) Policy related to International Initiatives
To counter with global environmental problems, the government 1) supports the activities of international organizations, 2) actively participates in the international negotiations of treaties and protocols, 3) cooperates with various foreign countries, and 4) actively provide assistance to the developing regions.

Part 2
183
○Measures on Environmental Conservation to be Implemented in FY 2011 Measures on Formation of a Sound Material-Cycle Society to be Implemented in FY 2011 Measures on Conservation of Biodiversity and its Sustainable use to be Implemented in FY 2011
The Quality of the Environment in Japan 2011 (White Paper) reports measures on environmental conservation, fromation of a Sound Material-Cycle Society and conservation and sustainable use of biodiversity to be implemented in FY 2011.Chapter 1 Establishing a Low Carbon SocietyChapter 2 Conservation of the Atmospheric Environment, the Water Environment, and the Soil EnvironmentChapter 3 Establishing a Sound Material-Cycle SocietyChapter 4 Assessment and Control of Risks from Chemical Substances in the EnvironmentChapter 5 Conservation of Biodiversity and Its Sustainable Use Chapter 6 Basis of Various Measures, and Measures Facilitating the Participation of Various Entities and International Cooperation