part 2 - cornell universitypeople.psych.cornell.edu/~blf2/pdfs/blf-dt-rbdap05 .pdf · ‘symmetry...
TRANSCRIPT

Part 2
Constraints on learning
Munakata / Processes of change in brain and cognitive development 06-munakata-chap06 Page Proof page 129 8.7.2005 6:44am

Munakata / Processes of change in brain and cognitive development 06-munakata-chap06 Page Proof page 130 8.7.2005 6:44am

Chapter 6
Developmental constraints on ordevelopmental structure in brainevolution?
Barbara L. Finlay, Desmond Cheung, and Richard B.
Darlington
AbstractThe more we discover about the basic structure of vertebrate and
invertebrate evolution, the more impressive the evidence of its conservative
nature becomes. Evidence for commonalities versus special adaptations in
brain evolution, with particular attention to rules for the proliferation of the
cortex will be discussed. Conserved developmental rules that produce
highly predictable brain organization seem best described as rules that
produce generic, optimal organization rather than limiting constraints.
6.1 Introduction
How do we understand the structure of organisms, from body plan to brain to
behavior? Ever since Darwin, the answer from evolutionary biology is simple: the
characteristics of organisms are adaptations that have allowed their survival and
reproductive success. We understand the nature of evolution to be competition
between organisms on the basis of inheritable variation in those adaptations that
improve their reproductive success. This view, centered on the premise that adapta-
tions are produced by accretion of small, adaptive changes, is best laid out in the
various works of Richard Dawkins (Dawkins 1976, 1986). Excluding absurd ‘just-so’
stories, this view suggests that every feature of an organism should be subject to an
adaptive account, usually in terms of the special niche of the organism. Remarkable
cases of convergent evolution tend to reinforce the view that virtually every feature of
an organism can be the target of special selection. For example the Tasmanian wolf
(Fig. 6.1A), a marsupial, occupies the same niche as the North American timber wolf
(Fig. 6.1B), and the similarity of the two, coming from such different stem species, is
Munakata / Processes of change in brain and cognitive development 06-munakata-chap06 Page Proof page 131 8.7.2005 6:44am

quite remarkable – the type of pelt (dark above, white below); the approximate size;
the frontally placed eyes; the sharp canines; the behavioral adaptations for hunting.
We can go further still in phylogenetic distance: consider the hawk moth, an inverte-
brate, compared to the hummingbird, both of which feed on trumpet-shaped blos-
soms, and both of which have made the elaborate adaptation of hovering flight and a
long proboscis or beak, so much that they can be confused for each other where their
habitats overlap. So, one aspect of understanding the structure of organisms is to take
each feature as an adaptation to a functional role in a specific environment, from
inference from species that have arisen from different origins but have converged on
similar forms.
Another type of structure is common to all four of the organisms, the two mam-
mals, the bird and the insect (and in fact is common to every complex invertebrate
and vertebrate on earth), however, which defies this kind of account. This is the
pattern of early regulatory gene expression, ‘Hox genes’, that controls the initial
polarization, bilateral symmetry, and segmentation of both vertebrates and inverte-
brates. The pattern is complex, a series of nested and overlapping gradients of gene
expression, and most important, very highly conserved across all of these creatures
(Duboule and Dolle 1989; Graham et al. 1989; reviewed in Wilkins 2001). Further, this
is only one of a number of highly conserved gene functions that control particular
kinds of operations, or regulate the production of certain pieces of morphology. For
example there is the Notch/Delta signaling complex, often employed as a generic
‘symmetry breaker’ which takes an initially uniform set of cells and sends them out on
two separate developmental paths (Gerhart and Kirschner 1997). Or the famous Pax6,
Fig. 6.1 (A) The thylacine (Thylacinus cynocephalus), also known as the Tasmanian wolf, was a
large marsupial carnivore that lived in Australia and New Guinea. The last known captive animal
died in 1936. (Image: http://collections.ucl.ac.uk/ zoology/highlights.asp). (B)Wolf (Canis lupus).
(Image : www.nature.ca/notebooks/ english/wolf/htm).
Munakata / Processes of change in brain and cognitive development 06-munakata-chap06 Page Proof page 132 8.7.2005 6:44am
132 j PROCESSES OF CHANGE IN BRAIN AND COGNITIVE DEVELOPMENT

which controls the positioning of the eye, and is so conserved that if this gene is taken
from the genome of the mouse and inserted into an atypical position and species, like
the leg in a developing fruit fly, it will induce a fruit fly-appropriate compound eye
in that location (Callaerts et al. 1997). Or, the Robo/Slit signaling complex, which
directs the formation of axonal pathways that approach and then cross the body
midline (Stein and Tessier-Lavigne 2001). Since it is highly unlikely that these rather
complex, yet basic, organizational features represent convergent evolution, it is
assumed they are conserved features, present in our ancestors and present in us. Are
these universal developmental features ‘developmental constraints’?
Stephen Jay Gould argued forcefully for understanding the role of history in the
constraint of present form, and his arguments centered on how evolution, as a
historical phenomenon, limits the possibilities of present form (Gould 1977, 2002).
When selecting for better adaptations to particular niches, not all logical possibilities
are presented for selection. In ‘The Panda’s Thumb’ he argued that the strongest
evidence for developmental constraint are those cases when evolution produces out
of a problematic substrate (the wrist bones of the proto-panda) an inefficient con-
trivance (the rather clumsy panda ‘thumb’), an unhandy solution quite different from
what engineers would choose to solve a problem were they given carte blanche on
materials and manufacturing techniques (Gould 1980). The thumb itself is not the
constraint, but rather the range of substrates and mechanisms evolution can use to
address an adaptive problem. In developmental and cognitive psychology, constraint
tends to be used in the same restrictive way, though prior form and history are not
necessary parts of this kind of constraint argument. Out of the universe of multiple
solutions to learning about or acting on real-world problems, the search space is
constrained to particular facets of the information available, or particular tactics or
heuristics used to take action on the information presented.
In this view, the instructions for the general invertebrate/ invertebrate body and
brain plan would appear be the most whopping ‘constraint’ possible on the paths of
evolution, unchanged for some 600 million years. While the resultant types of species
employing this plan on one hand seem almost unimaginably diverse, from lobsters to
worms to elephants, there are significant aspects of conserved structure, including
bilateral symmetry, retained topological relations of major organ systems, and most
important, segmental organization.
Are we served by calling this kind of conservation ‘constraint’? We will argue, along
with various developmental biologists from whom the fundamental structure of these
arguments are drawn (Gerhart and Kirschner 1997; Wilkins 2001; Ryan 2004), that
these conserved pathways are not the crystallizations of an idiosyncratic, one-time
choice of a single evolutionary path out of a universe of many possible paths, or even
the best heuristic of many. Rather, they show us the nature of optimal, robust, and
stable solutions to the survival problems of organisms operating in this world, as
filtered by recurring catastrophe. We will go on to look at another highly conserved
Munakata / Processes of change in brain and cognitive development 06-munakata-chap06 Page Proof page 133 8.7.2005 6:44am
DEVELOPMENTAL CONSTRAINTS ON OR DEVELOPMENTAL STRUCTURE j 133

developmental pathway in mammalian evolution, this time the order of generation of
neurons in the brain that produces the very reliable scaling of brain parts across
animals as the brain enlarges, (Finlay and Darlington 1995; Finlay et al. 2001) and,
finally, present new work on the conserved structure of the scaling of cortical areas and
connectivity with brain size. In these last cases, we will attempt to evaluate whether
robust developmental structure, developmental constraint, or specific adaptation is
the best conceptual domain to capture the empirical results.
6.2 Adaptation, catastrophe, and evolvability
The scenario for evolution with which we started this chapter, of individuals strug-
gling against members of their own species for reproductive success on the basis of
their special adaptations in a stable world of available niches, only captures one aspect
of the kind of challenges species face in evolutionary time, and only part of the nature
of genetic change. The most salient single example for contrast is the meteor that hit
the earth at the time of the Jurassic, suddenly and massively changing the environ-
ment – the light, the air quality, nutrients, every important feature of niche, costing
the world the dinosaurs (Alvarez et al. 1980; Albritton 1989). The locus of the most
massive source of variability in the Earth’s collective genome in this kind of event is at
the level of species or whole radiations of species, favoring those groups most able to
survive and reproduce in the face of wholesale change. The range from global
catastrophe, causing variation at the species level and higher, to the ‘adaptive walk’
where individuals compete and specialize in relatively stable settings, is a continuous
range, not requiring wholesale catastrophe and extinction – there can be local
catastrophes as well. The central issue is that a major source of genome variation
across times of catastrophe, local or global, will reflect strategic variations that vary at
the level of orders or classes, such as rapid development, homeothermy, circadian
rhythmicity, behavioral plasticity, and that are executed by developmental and meta-
bolic mechanisms that are stable and robust. Our genome contains the influence of
both the recurring, general filter of great stress, and ongoing competition on the basis
of subtly improved adaptations for reproductive success in stable environments.
‘Evolvability’ is a related idea that also carries import for how a genome will
respond to challenge of any kind, and which genes will persist in a population. This
idea has been used in two distinct ways in the allied fields of evolutionary biology, and
in those areas of artificial intelligence and robotics that employ genetic algorithms.
The first, and somewhat stricter, sense of this concept arose from the hypothesis and
later the demonstration (in bacteria) that in times of extreme stress and crisis,
‘deliberate’ additional variation and mutation would arise as an adaptive mechanism,
suppressed in favored environments (Radman et al. 1999). The second, more general,
sense is the observation that some types of genomic or informational structures more
readily produce usable adaptive changes and potential for evolution than others. This
Munakata / Processes of change in brain and cognitive development 06-munakata-chap06 Page Proof page 134 8.7.2005 6:44am
134 j PROCESSES OF CHANGE IN BRAIN AND COGNITIVE DEVELOPMENT
concept is now under intensive investigation in the growing field of evolutionary
robotics and computation, thus coming around to integrate evolution with cognition
from an unanticipated direction (Lipson and Pollack 2000; Nolfi and Floreano 2002;
Baum 2004). Everything else equal, the ‘evolvable’ organism is more likely to be with
us today. Central themes that have emerged, both in evolutionary biology and in
evolutionary computation, are the importance of modules as high-level building
blocks, standardized processes of linkage or integration between modules, and the
ability to recursively construct higher-order modules that can be addressed evolu-
tionarily (Baum 2004). In biological evolution, the concept of meaningful variation of
a module springs directly from the segmented embryo that enjoyed such extreme
evolutionary success. Even the derivation of the name ‘Hox genes’ comes from the
observation of ‘homeotic mutants’, mutants which erroneously repeat a higher-order
piece of structure in their body plans, like two adjacent regions both giving rise to
wings, or to mouth parts (Gerhart and Kirschner 1997). Regulatory mutations are not
the only mutations, of course – single amino acid to single protein mutations (such as
might appear in species differences in photoreceptor or hemoglobin molecules) exist
as well as this modular, Hox-level of alteration. We will give an example of the
interaction of these two kinds of genetic change in the evolution of primate vision
at the very end of this chapter.
In the next section, we will describe an initially surprising, conserved structure in
the pattern of generation of the brain in mammals (and to a lesser degree, in
vertebrates generally) that has direct consequences for the allometry of brain change
in all mammalian radiations, and our own primate radiation. How can we discrim-
inate whether we are looking at developmental constraint, a crystallized feature that
limits the paths of brain change, or a developmental structure that gives some insight
into the general nature of robust and adaptive solutions for making brains? Last we
will turn this same approach to the particular case of the evolution of the cortex, and
how the properties of the cortex reveal themselves in the various cases of imposed
environmental, developmental, or genetic variability.
6.3 Scaling the whole brain
The Finlay laboratory has investigated, for some time, how spatially distributed
systems in the brain and body evolve (Finlay et al. 1987, 1991, 1998, 2001; Finlay
and Darlington 1995). The distributed systems we refer to are those with morpho-
logical specializations of the body and a number of associated brain parts coming
from embryologically separate regions, such as the visual system which includes eyes,
eye muscles, visual midbrain, visual cortex, and so forth, or sexual differentiation,
which includes genitals, stereotypic motor pathways in the spinal cord, the cortical
representation of social customs, and so on. We have approached this question in two
complementary ways, introducing deviations into early development to look for
Munakata / Processes of change in brain and cognitive development 06-munakata-chap06 Page Proof page 135 8.7.2005 6:44am
DEVELOPMENTAL CONSTRAINTS ON OR DEVELOPMENTAL STRUCTURE j 135

system-wide reconfigurations, which is an aspect of ‘evolvability’, and also examining
the patterns of observed evolutionary changes across species for the structure of the
developmental mechanisms that underlie them. In the search for levels of ‘grammar’
in the variation in neuron number in the brains of different species, empirical work
using the first strategy showed potential co-ordinating regressive processes, such as
developmental neuron death and axon retraction, did not appear to have enough
power to propagate changes in number and connectivity much past a connection or
two in the brain (Finlay et al. 1987; Finlay and Pallas 1989). Therefore, wholesale
changes in the size of a spatially distributed system could not be accounted for by
developmental events occurring after cells were generated and differentiated.
The remaining logical possibility was neurogenesis, which we examined using the
second strategy of looking for changes across species in development that could be
plausibly related to adult differences. The structure of variation, both in the order and
duration of neurogenesis and the structure of variation in the size of brain parts across
species, could be directly compared. The intent was to quantify and understand the
structure of variability in these directly related features (neurogenesis and the number
of neurons in brain parts) at the level of individual structures; functional systems (like
‘visual system’, ‘motor system’); brain geography (‘midbrain’, ‘hindbrain’); and the
whole brain. To our great surprise, both analyses of adult differences in brain volumes
and neuron numbers, and early schedules of neurogenesis, returned an answer that
the level of the variation of the whole brain, or the whole developmental schedule,
grossly dominated the variation, the two sources of data congruent in detail. Not only
that, brain parts varied both predictably and disproportionately as brains enlarged,
and the disproportion was predicted by the conserved order in which structures were
generated across species (Finlay and Darlington 1995).
6.4 The basic finding of conservation of the developmentaltimetable
Since the initial publication of our investigation into the linkage of neurogenesis and
brain allometry linkage (Finlay and Darlington 1995), we have published a number of
further analyses and reviews to which we refer the reader for detail (Finlay et al.1998,
2001; Clancy et al. 1999, 2001; Kaskan and Finlay 2001; Kaskan et al. 2004). Here we
will explore the specific issue of conservation of general brain scaling as a constraint.
Briefly, using the data collected for primates, insectivores, and bats by Stephan and
collaborators (Stephan et al. 1981, 1988), a dataset that has been the subject of
numerous analyses, we emphasized a finding that had been known before: that
about 97 per cent of the variance in the sizes of brain parts was predicted by the
size of the whole brain, and 99 per cent if a second ‘limbic’ or ‘olfactory’ factor was
added. The human cortex (and all the large divisions as well) is just the size it should
be for a primate brain our size (Hofman 1989) (Fig. 6.2). This was an unusual
Munakata / Processes of change in brain and cognitive development 06-munakata-chap06 Page Proof page 136 8.7.2005 6:44am
136 j PROCESSES OF CHANGE IN BRAIN AND COGNITIVE DEVELOPMENT

emphasis, because most investigators interested in mapping the differences in size of
brain parts to differences in animal’s behavior and niche disposed of the 99 per cent of
shared variance, and examined the residual variance, using various statistical ap-
proaches, even though the residual variance was so small. It is important to under-
stand the actual physical characteristics of brain evolution to understand the nature of
the shared and residual variance. In this dataset, brain weights vary from a fraction of
a gram to over a kilogram, a factor of about 20 000. At any particular brain weight, the
residual variance of individual structures is about 2.5 – that is, two species similar on
the two factors (whole brain and limbic) might commonly have individual structures
varying by over a factor of two, occasional pairs considerably larger, which would be
Fig. 6.2 (A) A combined log (y axis) and non-log (z axis) plot of brain structure volumes versus
log brain volume (x azis) for the 131 primates, bats, and insectivores of the Stephan data set,
redrawn from Finlay and Darlington (1995). This style of graphing is chosen to highlight both
the predictable but disproportionate of those structures scaling at the steepest slopes with
respect to brain size, particularly the neocortex. (B) Model of the predictability of the birth date
of a structure in a species given the ordinal position of each structure’s birth date across animals
(Structure Scale, ST) and the relative duration of neurogenesis in a species compared to others
(Species Scale, SP). The seven species modeled in this analysis are hamsters, mouse, rat, spiny
mouse, possum, cat, and monkey; 51 neural structures are modeled, from motor nuclei of the
medulla to cortical layers. Those structures with high ST values are the latest generated ones, and
are the same that become disproportionately large as brain volume enlarges.
Munakata / Processes of change in brain and cognitive development 06-munakata-chap06 Page Proof page 137 8.7.2005 6:44am
DEVELOPMENTAL CONSTRAINTS ON OR DEVELOPMENTAL STRUCTURE j 137

very conspicuous to an investigator looking for individual or species differences in the
sizes of brain components. It proves that the distribution of variance in volume across
structures is quite uneven (Glendenning and Masterton 1998). This is an interesting
aspect of species variation, and we do not discount it, but we have set our job to
understand the significance of the factor of two in the context of the factor of 20 000,
not the factor of two alone.
One potential answer to the question of the significance of brain size is that perhaps
only ratios are important, and Harry Jerison, founder of much of the work in brain
evolution and allometry, has shown that ‘encephalization’, essentially the ratio of brain
size to body size, correlates much better with both our intuitions about and measures
of behavioral complexity than does absolute brain size (Jerison 1973). Others have
gone on to argue that there may be two different aspects of size, a scaling aspect and a
species-difference aspect (Aboitiz 1996). This second argument, however, is perplex-
ing when a second aspect of the regular structure of brain allometry is considered:
disproportionality (Fig. 6.2). While the sizes of brain parts are predictable over brain
scaling, a human brain does not look like a mouse brain enlarged a thousand times or
so – each structure enlarges with brain size at its own characteristic rate, in particular,
the cortex and cerebellum growing such as to completely dominate the volume of the
brain in large-brained animals. If brain structures do not enlarge with increasing brain
size at constant ratios, it is unclear how to understand what ‘residual mass’ is.
The proximate cause of the disproportionality in the enlargement of brain parts can
be understood by looking at neurogenesis, how neurons are generated in early
development across mammalian species (Fig. 6.2 B). The ordinal position of the
peak day that neurogenesis ceases for each cell group and structure in the brain is
very highly conserved (this end of neurogenesis is called the cell group or structure’s
‘birthday’) although the total duration of neurogenesis varies from about 10 days in
the mouse to over a hundred in monkeys. A two-factor equation can be written that
captures 99 per cent of the variance in this species/structure matrix (Clancy et al. 1999,
2001). Curves of cell production in embryogenesis do not increase linearly, but
exponentially, reflecting the doubling and redoubling nature of the ‘symmetric’
phase of cell division as the organism is first generated. The consequences of expo-
nential growth for lengthening the period of neurogenesis by about a factor of 10, the
ratio difference from mouse to monkey, are quite different for the end neuron number
in structures with early birthdates (such as the medulla), middle birthdates (such as
the midbrain), and late ones (such as the cortex). Our shorthand term for this
relationship is ‘late equals large’ (Fig. 6.3). Thus, particular parts of the brain increase
disproportionately by a developmental rule. This was quite a disturbing finding, in that
most previous accounts of relative brain enlargement were cast as special adaptations
due to the virtues of particular brain parts. Particularly, some special organization or
advantage was often ascribed to the cortex – its efficient layering, the columnar
structure. However, the developmental rule that will produce a large cortex is already
Munakata / Processes of change in brain and cognitive development 06-munakata-chap06 Page Proof page 138 8.7.2005 6:44am
138 j PROCESSES OF CHANGE IN BRAIN AND COGNITIVE DEVELOPMENT

resident in those small stem mammals with their small cortices, who presumably had
no particular plans of their own for generating a useful structure to house a ‘language
cortex’ someday. Before we go on to discuss this perplexing observation as structure,
constraint, or adaptation, we will go into a little more detail about just what the
developmental rule is.
6.5 Forebrain segmental structure
Mammals are different from most other vertebrates by confining most of their
neurogenesis to early development, rather than generating brain throughout life
(there are exceptions to this generalization, of much current interest (Scharff
2000) ). The conserved pattern of early neurogenesis we see, as well as where ongoing
neurogenesis is found, can be explained by reference to a relatively new organizational
scheme that finds a type of segmental structure in the forebrain. The patterns of
expression of regulatory genes and transcription factors in early neurogenesis were
used to establish this prosomere model (Rubenstein et al. 1994). The basic axes that
define this structure are common to the entire brain, which begins as an extended
plate, the ‘neural plate’, which subsequently rounds up and connects its lateral-most
edges to become the ‘neural tube’. The neural tube, whose original form is most
obviously retained in the spinal cord, consists of repeating segments of similar
fundamental structure with local variations. The part of the plate (and later tube)
near the midline is called ‘basal’ for its position, and in the spinal cord this part gives
Fig. 6.3 ‘Late equals large.’ A schematic of the consequences for eventual size of a structure
generated early (A), intermediate (B), or late (C) in the order of neurogenesis for a species with a
short period of neurogenesis and a small brain, like a mouse, versus one with a long period of
neurogenesis and a large brain. In the long-development species, the precursor pool for late-
generated structures has a longer time to multiply and becomes disproportionately large.
Munakata / Processes of change in brain and cognitive development 06-munakata-chap06 Page Proof page 139 8.7.2005 6:44am
DEVELOPMENTAL CONSTRAINTS ON OR DEVELOPMENTAL STRUCTURE j 139

rise to motor neurons. The lateral part is called ‘alar’, Latin for ‘wing’, and in the spinal
cord contains sensory neurons. This embryonic basal–medial, alar–lateral plate-
reconformed-into-a-tube structure can be tracked down in the adult with classical
neuroanatomical methods up to about the level of the midbrain. The extended and
eventually convoluted pattern of neurogenesis in the forebrain, however, makes it
impossible to track cell groups from their origin. Examination of gene expression
gradients was required in order to trace each cell group back to its position of origin
on the two axes of the embryonic brain, anterior–posterior and basal–alar.
An assignment of the traditionally named brain parts to this axial system is given in
Fig. 6.4 – for the most part (with some exceptions), as adult brain divisions reflect
embryonic neural tube positions, these assignments can be made unambiguously.
Hypothalamic and some basal forebrain structures are in the basal prosomeres, the
large cellular masses of the forebrain, for example, the basal ganglia, are intermediate,
and the cortical structures – olfactory bulb, hippocampus – most lateral or alar. If
embryonic axial position is correlated with birth date (Finlay et al. 1998), both axes
contribute to the solution, but the alar–basal axis predominates, with late birthdays
for cell groups associated with alar positions, early birthdates with basal. Our short-
hand for the relationship of timing of neurogenesis to brain part size ‘late equals large’
can now be extended to a spatial axis of gene expression ‘lateral equals late equals
large’. Note that for two of the most anterior structures in the most lateral-alar
position, the olfactory bulb and hippocampus, there is in fact no terminal ‘birthday’
and neurogenesis continues throughout life, even in mammals (Bayer 1980, 1983).
Fig. 6.4 Components of prosomeres, the embryonic segments of the telencephalon, described
by Rubenstein et al. (1994). The lateral-most part of the early neural plate is the part that
undergoes the most extended cell division and becomes disproportionately large in large brains.
Munakata / Processes of change in brain and cognitive development 06-munakata-chap06 Page Proof page 140 8.7.2005 6:44am
140 j PROCESSES OF CHANGE IN BRAIN AND COGNITIVE DEVELOPMENT

Therefore, the conserved pattern of neurogenesis is not the crystallization of an
arbitrary order that happened at some point in mammalian evolution, but is an
expression of an axial pattern that, at least in part, is common to all vertebrates.
6.6 The nature of constraints
When this conserved pattern of neurogenesis producing disproportionate allometry is
viewed in the language of special adaptation and constraint, the constraint is heavy. If it
might be advantageous to select on the size of a brain part outside of the allowable
factor of two, it appears that the only option to select on anything is to select on
everything. For a hypothetical example, if a mouse could gather more food by increas-
ing its auditory spatial resolution by increasing the size of the inferior colliculus more
than a factor of two, all brain parts would have to be enlarged, with exceptional leverage
on the size of the cortex and cerebellum, which would increase at a greater rate in size
that the colliculus. This cost seems quite implausible, because brain tissue is metabol-
ically expensive (with the possible exception of the largest cetaceans, where the fraction
of metabolic energy allotted to the brain with respect to the body becomes negligible).
An interesting example of the way minimal caloric requirements are defended can be
found in the precise inverse relationship of brain size and intestine length (another
expensive tissue) in primates – the more brain, the shorter the gut and the more limited
the range of edible food becomes (Aiello and Wheeler 1995). So, if selection on the
mouse increased auditory capacity happened in the way outlined, conserved neuro-
genesis would indeed be a constraint and the mouse would have to pay for its extra
auditory capacity with the metabolic load incurred for useless neural tissue elsewhere.
If the premises of the hypothetical scenario for the improved mouse are taken apart,
however, it has at least three interesting components for our argument:
1. Capacities like ‘auditory acuity in foraging’ can be appropriately localized to a
brain part.
2. Increase in size of structures improves functionality.
3. Structure–function mappings in the brain are fixed.
We will discuss the first two concepts only briefly. For the first, it is interesting to
note how rarely behaviors on which selection might act could be plausibly controlled
by a single brain part, with the possible exception of features of sensory acuity. The co-
ordination of increase in brain size over all brain parts should alert us to the fact that
almost all functions are necessarily distributed, over sensory and motor neurons and
almost everything in between. Recall, the problem of how to select for spatially
distributed systems was the question that began this whole enterprise, and it may be
that selecting on the whole brain is in fact the most economical way, the only way of
increasing a distributed system. Interestingly, with the exception of the olfactory/
limbic system, no other distributed functional system in the brain appears to show
Munakata / Processes of change in brain and cognitive development 06-munakata-chap06 Page Proof page 141 8.7.2005 6:44am
DEVELOPMENTAL CONSTRAINTS ON OR DEVELOPMENTAL STRUCTURE j 141

detectable covariation past directly connected structures (Barton and Harvey 2000;
Finlay et al. 2001) or exhibits a genetic marker that identifies it in early development.
The second concept of the relationship of brain size to improved function is a major
conundrum in brain evolution, and we cannot answer it here. Relative brain size is
certainly linked to behavioral complexity, and has been directly linked to memory
capacity in some cases (Nottebohm and Pandazis 1981; DeVoogd et al. 1993; Jacobs
and Spencer 1994). Why absolute brain size does not necessarily have the same result
is unclear.
The final statement ‘structure–function mappings in the brain are fixed’ deserves
the closest attention, and we need to consider both the phylogenetic and epigenetic
aspects of the question. There is no doubt that some functions are really fixed – the
eyes just don’t do well in somesthesis, and probably never will. The immediate
connections of primary sensory and motor neurons are probably also somewhat
limited in their potential functions. The multimodal, converging nature of the rest
of the brain makes reassignment of functions to new structures, however, both
plausible and likely, and can deliver us from the grip of a constraint that might appear
crippling. Phylogenetically, it seems quite likely that new or modified functions might
find their place in structures that become large easily by virtue of their embryonic
position, rather than by modifying embryologically-disadvantaged locations. So, new
functions find a place in the cortex because it becomes large, not the cortex becomes
large because there are new functions in it. Many new observations in brain plasticity
tell us that epigenetically, it is possible to map functions into structures where space is
made available (one very interesting example and several reviews: Burton et al. 2002;
Pallas 2001; Kingsbury and Finlay 2001; Finlay 2004). Especially, considering the
requirement for robust, adaptive solutions in development, a general ability to map
new functions into areas, as either new functions are required or new areas are
available, seems a capacity to which we should now pay particular attention.
We will now go on to present some new data about the proliferation of areas in the
cortex, as a particular example of the general argument we are making: does the
proliferation of cortical areas represent special adaptation, as embodied in the special
function of each cortical area, or the expression of developmental rules?
6.7 Proliferation of cortical areas
Since Brodmann (1909) first divided the isocortex into discrete areas on the basis of
their cellular architecture, tremendous interest has been generated in mapping
sensory, cognitive, and motor processes onto localized regions of cortex. A common
core of areas responsible for the processing of visual, somatomotor, and auditory
information have since been identified in the cortices of a variety of mammalian
species (Krubitzer 1995). Claims for more specialized areas, from echolocation in bats
(Schuller et al. 1991) to moral judgment in humans (Moll et al. 2002), have been made
with increasingly refined electrophysiological and imaging techniques. The apparent
Munakata / Processes of change in brain and cognitive development 06-munakata-chap06 Page Proof page 142 8.7.2005 6:44am
142 j PROCESSES OF CHANGE IN BRAIN AND COGNITIVE DEVELOPMENT
modular organization of the cortex, that is the physical separation of modalities
and modes of computation from initial analysis to upper-level functions, has
been important in accounts of cortical evolution. For example the cortical area,
as an anatomical and functional module, has been hypothesized to be a unit
of selection in cortical evolution, with specialized cortical areas duplicating in
response to selection pressure for particular sensory and cognitive abilities (Kaas
2000a).
Other functional and mechanistic accounts of cortical area proliferation exist,
however, and many of these need not be mutually exclusive. At the functional level,
the parcellation of cortex into areas might emerge from the computational require-
ment to keep interactions local to maintain processing speed, or to ‘save wire’ in
expanding, richly interconnected cortices (Ringo 1991; Cherniak 1992; Murre and
Sturdy 1995). An experimentally produced alteration of early patterning molecules
produces a kind of cortical proliferation: for example adding additional polarizing
zones that control transcription factors that determine cortex polarity in an embryo
can result in the duplication of cortical areas (Grove and Fukuchi-Shimogori 2003).
The parcellation of the cortex into areas might emerge as an epiphenomenon of local
organizational processes, such as activity-dependent stabilization of synapses, as
the hexagonal structure of the honeybee comb arises from the construction of
individual cells (Elman et al. 1996). A number of developmental models for the
specification of cortical areas have been proposed (Rakic 1988, 1991, 1995; Kingsbury
and Finlay 2001), but none have been linked explicitly with the pattern of areal
proliferation in cortical evolution. In general, the number of cortical areas increases
as overall brain size increases, but we do not know how predictable this increase is, nor
what aspect of brain size best predicts it. Understanding scaling of cortical area
proliferation is critical to understanding the developmental mechanisms that might
produce an area.
We therefore examined the proliferation of the number of cortical areas with respect
to brain size, in 24 mammals representing six orders, comparing visual, somatosen-
sory, and total areal proliferation. Included in the dataset were eight insectivores, six
marsupials, five primates, three rodents, one bat, and one carnivore (Table 6.1). For
each species, we ascertained or measured overall brain weight and overall cortical
surface area. These measurements were drawn primarily, but not exclusively, from the
published mapping studies of Kaas, Krubitzer, and their colleagues (Kaas 1982, 1987,
2000a, b; Krubitzer 1995; Krubitzer et al. 1986, 1993, 1995, 1997; Kaas et al. 1989;
Krubitzer and Kaas 1990a, b, 1993; Felleman and Van Essen 1991; Northcutt and
Kaas 1995; Beck et al. 1996; Gosh 1997; Beck and Kaas 1998, 1999; Lyon et al. 1998;
Catania et al. 1999; Huffman et al. 1999; Rosa 1999; Kahn et al. 2000; Krubitzer and
Huffman 2000; Lewis and Van Essen 2000a, b; Slutsky et al. 2000; Weller et al. 2000;
Wu et al. 2000; Collins et al. 2001; Hui-Xin et al. 2002).
Munakata / Processes of change in brain and cognitive development 06-munakata-chap06 Page Proof page 143 8.7.2005 6:44am
DEVELOPMENTAL CONSTRAINTS ON OR DEVELOPMENTAL STRUCTURE j 143

Tab
le6.
1C
ort
ical
area
sfo
r2
4m
amm
alia
nsp
ecie
s.
Co
mm
on
Nam
eSp
ecie
sN
ame
Bo
dyw
eig
ht(
g)
Bra
inw
eig
ht(
g)
Vis
ual
Are
asSo
mat
om
oto
rA
reas
Tota
lA
reas
Co
rtic
alA
rea
(mm
2)
Ow
lM
on
key
Aotu
str
ivirgat
us
93
5.0
01
8.2
02
3.0
01
3.0
03
6.0
05
,48
5.8
5
Short
-tai
led
Shre
wBla
rina
bre
vica
uda
19
.70
0.3
91
.00
3.0
04.0
028
.13
Mar
mo
set
Cal
lithrix
jacc
hus
24
6.0
07.9
01
9.0
01
1.0
03
0.0
09
10
.26
Leas
tSh
rew
Cry
pto
tis
par
va9
.90
0.2
51
.00
3.0
04.0
021
.80
Stri
ped
Poss
um
Dac
tylo
psi
latr
ivirgat
a43
5.0
02
.00
6.0
08.0
02
48
.65
Norh
tern
Quo
llD
asyu
rus
hal
luca
tus
75
0.0
02
.00
5.0
07.0
01
33
.17
Nort
hA
mer
ican
Oposs
um
Did
elp
his
mar
sup
ialis
1,7
00
.00
6.3
04
.00
5.0
09.0
02
69
.60
Ten
rec
Echin
op
ste
lfai
ri8
7.5
50.6
22
.00
3.0
05.0
024
.24
Hed
geh
og
Erin
aceu
seu
rop
aeus
87
4.1
63.2
92
.00
6.0
08.0
01
06
.69
Cat
Felis
catt
us
3,3
00
.00
30.0
01
5.0
01
5.0
03
0.0
03
,01
4.8
0
Gal
ago
Gal
ago
sp.
20
1.0
04.8
01
3.0
01
1.0
02
4.0
03
82
.83
Rhes
us
Mac
aqu
eM
acac
asp
.7
,95
0.0
09
5.0
03
2.0
02
2.0
05
4.0
010
,59
8.2
0
Short
-tai
led
Poss
um
Monodel
phis
dom
estica
15
0.0
03
.50
3.0
06.5
044
.94
Mo
use
Mouse
sp.
24
.00
0.5
03
.00
6.0
09.0
051
.24
Flyi
ng
Fox
Pter
op
us
polio
cep
hal
us
69
5.0
07.2
36
.50
8.0
01
4.5
02
19
.63
Rat
Rat
tus
sp.
21
7.0
01.7
94
.00
7.0
01
1.0
090
.69
Squir
relm
on
key
Saim
iris
ciure
us
90
1.2
52
4.0
02
0.0
01
0.0
03
0.0
04
,37
3.5
2
Fat-
taile
dD
un
nar
tSm
inth
op
sis
cras
sica
udat
a2
0.0
02
.00
3.0
05.0
011
.37
Mas
ked
Shre
wSo
rex
ciner
eus
5.9
00.1
71
.00
3.0
04.0
014
.93
South
east
ern
Shre
wSo
rex
longirost
ris
1.0
03
.00
4.0
09
.48
Nort
her
nW
ater
Shre
wSo
rex
pal
ust
ris
14
.60
0.2
81
.00
3.0
04.0
025
.55
Squir
rel
Squirre
lsp
.65
0.0
06.0
07
.00
7.0
01
4.0
02
13
.85
Bru
sh-t
aile
dPo
ssu
mTr
ichosu
rus
vulp
ecula
2.0
05
.00
7.0
02
08
.35
Tree
Shre
wTu
pia
bel
anger
i10
4.0
02.5
08
.00
385
.25
Munakata / Processes of change in brain and cognitive development 06-munakata-chap06 Page Proof page 144 8.7.2005 6:44am

6.7.1 Cortical area enumeration and measurement
Topographic maps of cortical areas were gathered from the above-cited literature,
choosing only those where an exhaustive map of the cortical representation of a
designated modality had been attempted. Each unimodal area was counted as one
area, and bimodal areas, such as the audiovisual area in Monodelphis domestica, were
allotted half to each sensory division. The identified subdivisions of major areas, such
as the division of M1 into rostral and caudal subdivisions, were each counted as a
single area. In cases where the cortex of a single animal has been extensively mapped
by a single laboratory, we deferred to their counting scheme. For instance, the
macaque visual cortex has been most extensively mapped in Van Essen’s laboratory,
which counted 32 visual areas, a figure that is generally accepted by most researchers
(Kaas 2000a). Finally, for the mouse and rat, we included in our count areas that have
been mapped but not yet published (or named) in the literature (J. Kaas, personal
communication). Most of the measurements of the area of the cortical surface,
particularly for brains without extensive gyrification, come from flat-mounts of
cortex (see Kaas (2001) for details). For published maps of this type, we traced the
perimeters of flattened cortices into NIMH Image v.4 using a WACOM data tablet and
used their accompanying scale bars to obtain surface area estimates for each animal
(Table 6.1).
Not all researchers agree on the definition or the number of cortical areas. Some
make significantly fewer subdivisions (for example Zilles 1985) while others argue for
the existence of a larger number of smaller areas even in small brains (for example
Olavarria and Montero 1990). We chose to remain agnostic on the ‘true’ definition of
a cortical area, and to rely instead on the pragmatic consideration of which explicit
criteria allow us to examine the most species. The arguments of Kaas and Krubitzer on
what constitutes an area are, however, compelling. Their criteria for identification of
an area are multidimensional, and include the presence of a fully mapped visuotopic,
somatotopic, or other computed dimension, internally consistent patterns of thal-
amic, intracortical, and callosal input and output, and in some cases identification of
the features of cortical cytoarchitecture or neurotransmitter or modulator expression.
The pragmatic concern that their work so dominates this data led us to preferentially
employ their work and those who used similar criteria, in the interest of consistency
and comparability. In cases of disagreement between investigators, such as the num-
ber of visual areas of the mouse and the rat, we deferred to the counting scheme of
Kaas and Krubitzer.
6.7.2 Issues in analysis of phylogenetic data
Because species may share traits through common descent rather than through
independent adaptation, we employed the method of the Comparison of Independent
Contrasts (CAIC, Purvis and Rambaut, (1995)), in order to correct for the effects of
Munakata / Processes of change in brain and cognitive development 06-munakata-chap06 Page Proof page 145 8.7.2005 6:44am
DEVELOPMENTAL CONSTRAINTS ON OR DEVELOPMENTAL STRUCTURE j 145

phylogenetic relatedness. The resolved phylogenetic tree required for CAIC analysis
was compiled from recent work by Murphy et al. (2001) and Kaskan (2000). Branch
lengths used for the computation of contrasts were set equivalent, assuming a
punctuational model of change. This procedure yields contrasts upon which standard
regression analyses can then be applied.
The number of cortical areas might be best predicted by one of several independent
variables, including cortical surface area, or the weight of the whole brain, or ‘ence-
phalization’, the ratio of brain to body weight. There was reason to suspect that in the
case of two animals with equal brain sizes, the more encephalized one might have a
greater number of cortical areas. Looking at the sole example in this dataset of three
approximately similar brain weights where body weight varies substantially, between
the Northern American opossum (brain weight 6.3 g, body weight 1700 g); the
squirrel (brain weight 6 g, body weight 650 g); and the marmoset, (brain weight
7.3 g, body weight 248 g), the number of cortical areas was 9, 14, and 30, respectively.
Unfortunately in this dataset overall, the biggest-bodied animals and most encepha-
lized are all primates, and the smallest, and least encephalized are all insectivores. The
two measures of cortical area and encephalization are highly correlated (r ¼ 0.98.
R2 ¼ 0:96, n ¼ 19). In addition, brain weight also correlates highly with cortical
surface area (r ¼ 0.95, R2 ¼ 0:91, n ¼ 19), rendering all three measures of brain
size statistically indistinguishable for the set of animals we were able to examine. Since
cortical area is the most proximate variable to the dependent variables we measured
(number of cortical areas, ocular dominance column width, and axonal spread in the
cortex) we have done our statistical analyses with respect to cortical area, but, in
explanation of these data, the covariation of cortical area with other brain measures
should not be forgotten.
6.7.3 Scaling of cortical area number
The number of cortical areas overall was well predicted by cortex surface area (log cortical
areas ¼ 0:000þ 0:250 log area, R2 ¼ 0:78 or 78 per cent of the variance captured,
n ¼ 22, p < 0:001) as were the number of somatomotor areas (log somatomotor
areas ¼ 0:000þ 0:240 log area, R2 ¼ 0:79, n ¼ 22, p < 0:001). Though highly statistic-
ally significant, surface area captured less of the variance when predicting the number of
visual areas (log visual areas = 0.000 + 0.250 log area, R2 ¼ 0:48, n ¼ 23, p < 0:001).
Figure 6.5A–C shows the simple regression of cortical area proliferation as predicted by
cortical surface area for visual, somatomotor, and the total number of cortical areas.
The observation that the log of cortical area strongly predicts the log of the number
of cortical areas suggests that the relationship is predictable, but this function is not
directly instructive about the kind or number of developmental mechanisms under-
lying this pattern of proliferation. As most biological developmental mechanisms bear
some relationship to cell size, they operate over finite physical distances and not their
ratios. To better visualize the change in cortex size for comparison to developmental
Munakata / Processes of change in brain and cognitive development 06-munakata-chap06 Page Proof page 146 8.7.2005 6:44am
146 j PROCESSES OF CHANGE IN BRAIN AND COGNITIVE DEVELOPMENT
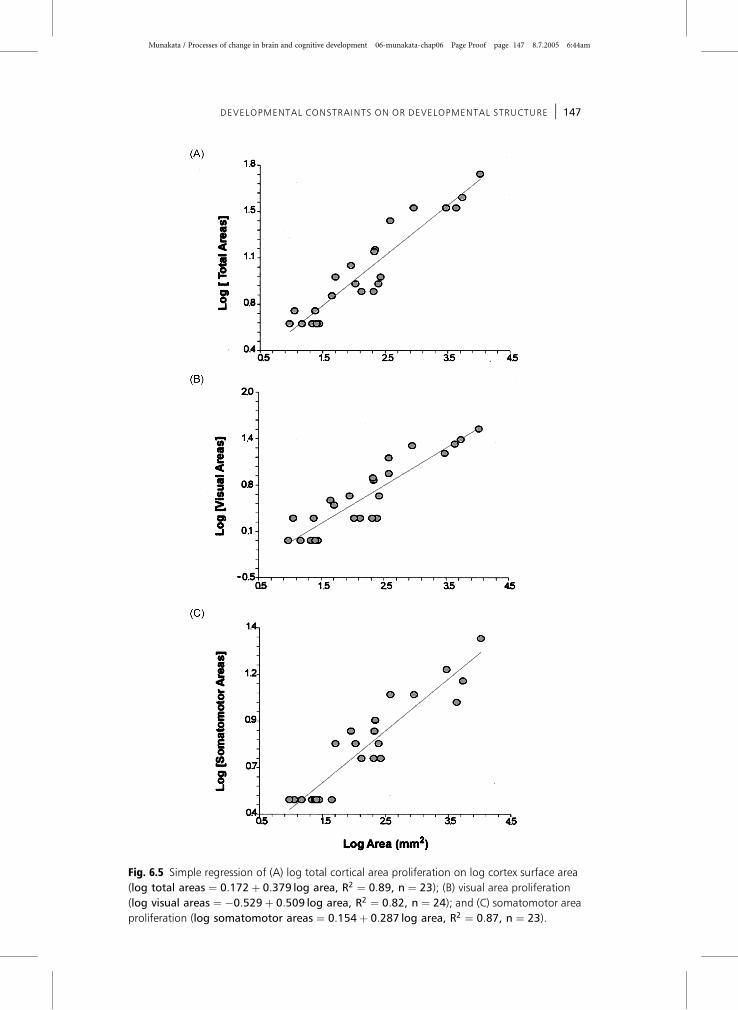
Fig. 6.5 Simple regression of (A) log total cortical area proliferation on log cortex surface area
(log total areas ¼ 0:172þ 0:379 log area, R2 ¼ 0:89, n ¼ 23); (B) visual area proliferation
(log visual areas ¼ �0:529þ 0:509 log area, R2 ¼ 0:82, n ¼ 24); and (C) somatomotor area
proliferation (log somatomotor areas ¼ 0:154þ 0:287 log area, R2 ¼ 0:87, n ¼ 23).
Munakata / Processes of change in brain and cognitive development 06-munakata-chap06 Page Proof page 147 8.7.2005 6:44am
DEVELOPMENTAL CONSTRAINTS ON OR DEVELOPMENTAL STRUCTURE j 147

mechanisms, the number of cortical areas was plotted against cortical surface area
without logarithmic transformation in Fig. 6.6. The brains and grids adjoining the
graph show the approximate number and surface area of visual and somatomotor
areas for the smallest, medium-sized, and largest brains in comparable scales. For
increases from the smallest cortices (from 10 to 400 mm2), cortical area proliferation
is rapid. Thereafter, however, only massive increases in cortical area produce new
cortical areas.
6.8 Known developmental mechanisms which produceprimary sensory areas
6.8.1 Setting initial positional information
Following Gould, the way cortical areas proliferate will depend not only on adaptation
– selection on the basis of function – but also on what developmental mechanisms are
available to modify cortical layout. At least two general classes of mechanism work in
parallel to pattern the developing cortex, one through direct genetic specification of
Fig. 6.6 The number of cortical areas plotted as a function of cortex surface area, without
logarithmic transformation. To permit direct visual comparison, the approximate total cortical
surface area of mapped visual and somatomotor areas (CSA) and number of cortical areas (CA)
for the shrew, galago, and macaque are inset, as an example of small, medium, and large cortex
area. Note that the entire cortex of the smaller brains would fit conveniently within any single
cortical area of the rhesus monkey.
Munakata / Processes of change in brain and cognitive development 06-munakata-chap06 Page Proof page 148 8.7.2005 6:44am
148 j PROCESSES OF CHANGE IN BRAIN AND COGNITIVE DEVELOPMENT

the cells of the cortex, and the second through instruction of the cortex by its major
input, the thalamus. For the first class of mechanism, regions of the cortex are made
distinct by the graded and overlapping expression of molecular markers, ranging from
transcription factors such as Emx-2 and Pax 6 (Bishop et al. 2000; Grove and Fukuchi-
Shimogori 2003) to the ephrin family of receptors and their ligands (Gao et al. 1996;
Donoghue and Rakic 1999), to cell-adhesive molecules such as the cadherins (Redies
and Takeichi 1996). While no single molecular gradient serves to define a particular
cortical area per se, some cortical areas may be delineated by the combined or nested
expression of multiple transcription factors. For instance, in the rat, the combined
gradients of transcription factors Lhx-2, Emx-1, and SCIP appear to distinguish early
auditory cortex from early visual cortex (Nakagawa et al. 1999). Experimental
manipulation of the relative concentration of other molecules can shift cortical area
boundaries rostrally or caudally, such as the transcription factors Pax6 and Emx2
appear to do (Bishop et al. 2000). Molecular gradients thus serve to set the basic
polarity, position, and size of the primary areas (Grove and Fukuchi-Shimogori 2003).
Some of the first-expressed molecules in these cortical areas designated by the
transcription factors described above are axon-guidance molecules, such as the
ephrins and their receptors, and contribute to the establishment of specific projections
from the thalamus to the cortex, the next major developmental event.
6.8.2 Secondary thalamic instruction of the cortex
Once in place, thalamic projections represent the second major source of cortical
patterning, driving multiple features of cortical organization. Thalamic projections
can induce the expression of particular neurotransmitters, control cell number, and,
in concert with molecular mechanisms, can induce topographic and organizational
features such as barrel fields for whiskers or ocular dominance columns (Crowley and
Katz 2002; review in Kingsbury and Finlay 2001).
6.8.3 Different control of primary and secondary regions?
However, as we now understand them, initial transcriptional control of cortical
polarity and number account for the production of primary sensory and motor
areas only. On the basis of similarities in cytoarchitecture, connectivity and response
properties, Kaas, Krubitzer and their colleagues find evidence for three primary
sensory areas, A1, V1, and S1 in a characteristic topographic relationship to each
other in even the smallest brains, with secondary and tertiary representations elabor-
ated in the zones between these areas as brains enlarge (Kingsbury and Finlay 2001).
In addition, most, if not all, mammalian brains have at least one motor field, M1,
which often overlaps with areas of the primary sensory cortex, S1, producing an M1/
S1 area (Krubitzer 1998).
Munakata / Processes of change in brain and cognitive development 06-munakata-chap06 Page Proof page 149 8.7.2005 6:44am
DEVELOPMENTAL CONSTRAINTS ON OR DEVELOPMENTAL STRUCTURE j 149

Many features distinguish primary somatomotor and visual areas from secondary
and tertiary areas. The constant presence and topographic arrangement of the pri-
mary somatomotor, auditory and visual areas in all mammals but monotremes, and
the conservation of their direct input from primary sensory thalamic nuclei has led to
the hypothesis that these areas are a conserved, organizing ‘core’ of the cortex, as
described above (Krubitzer 1998). Molecular gradients in early cortical development
primarily demarcate primary somatomotor and visual areas (Ragsdale and Grove
2001). Relative to primary areas, secondary and tertiary sensory/motor areas are
cytoarchitectonically indistinct with borders between areas lacking sharp transitions,
and also, relative to V1, extrastriate areas tend to have more complex visuotopic
maps with less defined visual topographies (with the notable exception of area MT
(Rosa 2002)).
6.9 Axonal sorting as a candidate for segregation of secondaryareas
The relationship of cortical surface area to cortical area number (Fig. 6.6) – rapid
increase followed by slow change – could be consistent with a two-factor model of
proliferation in which the effects of one factor become negligible at some size.
Activity-dependent axonal sorting is a potential candidate for the first factor. What
is the cortical area over which activity-dependent axonal sorting might operate? One
rough quantitative assessment of this is the size of ocular dominance columns, which
have been demonstrated by numerous manipulations in various species to depend
on local activity and competition in the axonal populations (Tigges and Tigges
1979; Florence et al. 1986; Hess and Edwards 1987; Anderson et al. 1988; Law et al.
1988; Florence and Kaas 1992; Horton and Hocking 1996; Chappert-Piquemal et al.
2001; Cheng et al. 2001), though activity-independent factors also play a role in
setting the size of these columns (Crowley and Katz 2002).
We thus obtained estimates of the spatial ranges over which various developmental
processes are known to act, particularly activity-dependent sorting, in order to
determine its plausibility as a developmental mechanism underlying areal prolifer-
ation. The absolute and relative dimensions of ocular dominance columns and axon
arbor extents with respect to brain size were used to estimate the ranges over which
axonal interactions might occur.
6.9.1 Ocular dominance columns
Ocular dominance columns have been described and their widths measured in a
variety of species including galagos, macaques (Florence and Kaas 1992), spider
monkeys (Florence et al. 1986), talapoin monkeys (Florence and Kaas 1992), capuchin
monkeys (Hess and Edwards 1987), marmoset monkeys (Chappert-Piquemal et al.
2001), squirrel monkeys (Horton and Hocking 1996), ferrets (Law et al. 1988), cats
Munakata / Processes of change in brain and cognitive development 06-munakata-chap06 Page Proof page 150 8.7.2005 6:44am
150 j PROCESSES OF CHANGE IN BRAIN AND COGNITIVE DEVELOPMENT

(Anderson et al. 1988), humans (Cheng et al. 2001; Goodyear 2001), and chimps
(Tigges and Tigges 1979). To examine to what extent ocular dominance columns scale
with brain size, we plotted the average periodicity (average width of one light and one
dark stripe) of ocular dominance columns against brain weight (Fig. 6.7A). Brain
weights were obtained from various sources (Stephan 1981; Huffman et al. 1999;
Website 2001, 2003).
In Fig. 6.7A, average ocular dominance column width (width of one contralateral
and ipsilateral stripe) was plotted against brain size in 10 mammalian species whose
brain sizes range from 7 g to 1400 g: the average width of ocular dominance columns
remains in the range of 0.45 to 2 mm, varying very little, in species whose
primary visual cortex area varies by a factor of approximately 38. Using the most
permissive statistical technique, simple regression, this regression just reaches
statistical significance, with a large component of this relationship clearly due to the
human outlier data point (log ODC width ¼ �0:3097þ 0:1260 log brain weight,
p ¼ 0:0313, n ¼ 11).
6.9.2 Axon arbor extents in S1
For another estimation of the extent to which axon arbors vary in size in a comparable
cortical context, we gathered measurements of the mediolateral extents of arbors in
the primary somatosensory (S1) cortex of rats (Jensen 1987), cats (Landry and
Deschenes 1981), and macaque monkeys (Garraghty and Sur 1990). Axons may
have multiple arbors, widely spaced, but our intent in choosing this particular data
source was to describe a single, spatially continuous arborization in a location
Fig. 6.7 (A) Mean ocular dominance column periodicity plotted against brain size, including
humans, chimpanzees, six species of monkey the prosimian galago, the ferret, and domestic cat.
Note that column periodicity varies only 4.5 times among brains that vary in size by a factor of
200. (B) Mean mediolateral extents of intracellularly-labeled thalamocortical axons terminating
in primary somatosensory cortex for the rat, cat, and macaque monkey plotted against brain
size. Note that axon extents vary only two times among brains that vary in size by a factor of 50.
Munakata / Processes of change in brain and cognitive development 06-munakata-chap06 Page Proof page 151 8.7.2005 6:44am
DEVELOPMENTAL CONSTRAINTS ON OR DEVELOPMENTAL STRUCTURE j 151

specifiable across species. As Fig. 6.7B illustrates, the average mediolateral extents of
arbors in the primary somatosensory cortices of rats, cats, and macaque monkeys vary
only slightly (384–600 mm) among species whose brains vary in size by a factor of
approximately 50.
Taking both examples together, both the widths of ocular dominance columns and
the extents of thalamocortical axons in S1 vary very little over a wide range of brain
sizes, both about two to five-fold, and both are the appropriate size to account for the
fractionation of the cortex into areas at small-to-medium brain sizes. In addition,
dendritic arbor size, which can also be affected by activity-dependent sorting mech-
anisms (Quartz and Sejnowski 1997), also does not vary appreciably with either brain
size of cortical area size (Kaas 2000b). It is thus possible that co-ordinated size
constraints apply to both localized axonal and dendritic arbors, and our explanation
should include both factors.
The Southeastern shrew (Sorex longirostris) is has the smallest cortex in this set. The
total surface area of somatomotor and visual cortex in this animal measures only
3:8 mm2, and the approximate dimensions of its average cortical area is 1.0� 1.0 mm,
a reasonable correspondence to the size range over which activity-dependent sorting
has been shown to occur in the ocular dominance columns and somatosensory axon
arbors of species with larger cortices (0.3–0.6 mm). Indeed V1 occupies only 0:5 mm2
in Sorex longirostris and typically occupies less than 1 mm2 in larger species of shrew
(Catania et al. 1999). We hypothesize, as brains get bigger, more specific aspects of
sensory stimuli may provide the correlational structure necessary to allow the segre-
gation of new, functionally specific cortical areas once a minimum volume of tissue is
made available. In fact the primary somatosensory areas, as they proliferate, segregate
submodalities of sensory processing (Kaas 1997), and could be viewed as direct
analogies to ocular dominance columns.
Axon-interaction forces may cease to be adequate to drive cortical area proliferation
after topographically-mapped dimensions exceed 2–3 mm, and instead provide only
substructure within cortical areas, the stripes, puffs, and blobs described in carnivore
and primate cortex. At large brain sizes, other factors governing proliferation, such as
molecular gradients released by patterning centers, may dominate, or the input to the
cortex might reorganize. For example the targeted redirection of cell proliferation into
the thalamus in great apes or humans may be a further evolutionary and develop-
mental mechanism of further specification of the cortex through its thalamic input
(Letinic and Rakic 2001).
6.10 A ‘developmental constraint’ account of cortical areaproliferation
The degree to which the proliferation of cortical areas past the primary sensory areas
is a straightforward function of cortex area suggests that either general functional
Munakata / Processes of change in brain and cognitive development 06-munakata-chap06 Page Proof page 152 8.7.2005 6:44am
152 j PROCESSES OF CHANGE IN BRAIN AND COGNITIVE DEVELOPMENT

constraints, or developmental mechanisms present in all brains, could account for
their regular patterns of proliferation, as opposed to special selection on cortical areas
specified for particular functions. The specializations and the relative size of the
sensory and motor periphery may be the means of the functional differentiation of
cortical areas in specialized species, transmitted to the cortex through ‘generic’
developmental mechanisms. Thus, new cortical areas may not necessarily emerge in
response to selective pressure for novel or enhanced computational abilities, but may
instead be inevitable consequences of size-constrained developmental processes scal-
ing over a wide range of brain sizes. The fact that they emerge, however, does tell us
something significant about the nature of cortical processing. Cortical areas are
primarily defined as topographic maps, either of sensory surfaces or of a wide variety
of computed dimensions, a representation that preserves local interactions in sensory
and motor sheets. The principal role we hypothesize for Hebbian mechanisms in
proliferation of new regions also emphasizes the importance of local interactions in
the cortex. When this mechanism is placed in the context of intracortical feedforward
and feedback, a potential for continual recombination and contextualization of new
maps is created. Further discussion of how intracortical and thalamic connectivity
have an interesting ‘scalability’ can be found in recent reviews by Finlay (2003) and
Merker (2004).
6.11 Is predictable brain and cortex scaling a ‘constraint’or a demonstration of robust structure comparable to thevertebrate body plan?
The observation that so much brain organization appeared to be the result of
developmental rules first expressed in small brains and then extended with apparent
grace into much larger ones was at first dismaying. Given that the usual account of
brain structure was in terms of direct selection on brain parts, far too much precog-
nition of future cortical needs was required of the first stem mammals for comfort.
The growing realization of the conservation of fundamental developmental programs,
and essential metabolic pathways, however, led to an analysis of their design features
that permits both stability and adaptability. The conservation of brain development
suggests we should extend the same sort of analysis to the brain.
Our claim is not that all brains are the same, possessing no particular adaptations,
but rather that our job is to understand just how the conserved structure we observe
makes the brain permissive of adaptations. A premature mapping of species-specific
adaptations onto brain parts, a sort of cross-species phrenology, is what we should
avoid. The conservation of the Hox gene-generated body plan does not conserve
antennae and exoskeletons, but rather, an ‘evolvable’ system of segmentation where
different segments can diverge from a common organizational theme. The idea of
‘computational tradeoffs’ – that ‘different brain areas are specialized to satisfy
Munakata / Processes of change in brain and cognitive development 06-munakata-chap06 Page Proof page 153 8.7.2005 6:44am
DEVELOPMENTAL CONSTRAINTS ON OR DEVELOPMENTAL STRUCTURE j 153

fundamental tradeoffs in the way that neural systems perform different kinds of
learning and memory tasks’ (O’Reilly, Chapter 16 this volume; Atallah et al. 2004)
could be the key to understanding evolvable brain organization within conserved
developmental structure. The cortex, particularly posterior cortex, appears specialized
to acquire generalized statistical information about the environment, preserved over
extended periods of time. Perhaps only those mammals which produced the necessary
structure for this kind of computation in the alar prosomeres were able to make
efficient use of the fact that neural structures generated in alar regions tended to
increase disproportionately in size when body and brain size increased. Only those
mammals were ‘evolvable’ and only those mammals are still here.
In the case of the cortex, we have an interesting window into evolution by looking at
normal variations in development, and at pathology, because we can view many kinds
of mutations or genetic change as a similar class of accidental event to which the
cortex must equilibrate. We will consider one example each of normal variability,
pathology, and genetic change to illustrate the properties of the cortex when encoun-
tering variation of different kinds.
The report of remarkable individual variability in the size of cortical areas, which
would seem to be in direct contradiction with the very regular scaling across species
described in all allometric studies and in this paper, is a perplexing observation. We
will assume that published allometric studies have managed to determine represen-
tative mean structure sizes and address the more theoretical question of how we are to
understand the importance of structure sizes if individual members may occasionally
differ very substantially from one another in the relative sizes of brain parts (Adams
et al. 2003; Purves and LaMantia 1993; Van Essen et al. 1984). What kinds of variations
are reported at the individual level, within species? The best information comes from a
number of studies of the primate visual system, particularly the rhesus macaque. Van
Essen and colleagues (1984) have found individual animals whose primary visual
cortex differed by a factor of two or more. Similarly, the variability of the human
visual cortex exceeds substantially the variability of the entire cortex (Gilissen and
Zilles 1995). There are no studies, to our knowledge, of the variability at the individual
level of the number and arrangement of cortical areas. Few of these observations have
as yet been tracked onto individual variation in visual capacity, and it would be
interesting to do so, though at minimum a condition called ‘reduced visual cortex
syndrome’ has not emerged! There is empirical reason to believe, however, that the
basic processing of the visual system will be robust to wide variations in number of
neurons in interconnecting populations, due to the equalizing effect of processes such
as activity-dependent stabilization in early development (Finlay and Pallas 1989;
Pallas and Finlay 1991; Rezak et al. 2003) or compensatory perceptual processes in
adulthood (for example Neitz et al. 2002).
Considering pathology, a variety of fascinating studies have now demonstrated that
in both the early and late blind, the primary visual cortex may be redirected to
Munakata / Processes of change in brain and cognitive development 06-munakata-chap06 Page Proof page 154 8.7.2005 6:44am
154 j PROCESSES OF CHANGE IN BRAIN AND COGNITIVE DEVELOPMENT

participate in the process of Braille reading (Burton et al. 2002; Merabet et al. 2003).
Thus, in both early development and adulthood, the occasion of underutilization of
a cortical area for its typical function, even a primary sensory cortex, is either
announced or can be detected, and it can subserve new functions.
Finally, an example in primate evolution illustrates a dramatic, species-specific
niche adaptation arising apparently without genetic change in the cortex, though
employing the new capacity requires the cortex. Several different radiations of pri-
mates have a mutation in one of their genes (just the difference of a DNA base pair or
two) that make a photoreceptor protein (an opsin) change the frequency of light that
best excites it, by substituting one or two amino acids that make up the opsin protein.
Some of those primates couple the amino acid change with gene duplication, also a
very common event in evolution (Jacobs 1998). Either of those changes is all that is
required to produce primate trichromacy, three-receptor color vision, from the
mammalian baseline dichromatic state. No other organizational changes of a genetic
nature have been described in our visual systems – from the remaining retina to
cortex, existing mechanisms for information extraction can take this small difference
signal and produce a new perceptual world. The cortex is not disabled by the
structural change in the photoreceptors that inform it but rather exploits the subtle
new information offered.
We take these three examples as evidence that variability in cortical size can be
assimilated gracefully into normal function both at the individual and the phylogen-
etic level; that the same piece of cortical tissue, in this case primary visual cortex, can
subserve widely different functions; and that new, species-specific perceptual capaci-
ties need not require new cortical ‘hardware’ for their efficient use. In this functional
context, it now seems likely that the predictability of disproportionate proliferation of
the cortex with increasing brain size is not an unfortunate developmental constraint
resulting in metabolic overload, but the precise placement of a tissue best serving
adaptability across species.
Acknowledgements
We thank Jeremy Yost, Rick Dale and especially Jon H. Kaas for their invaluable
comments in the preparation of this manuscript. This work was supported by NSF
grant IBN 0138113 and NIH RO1 19245 grants to BLF.
References
Aboitiz F (1996). Does bigger mean better? Evolutionary determinants of brain size and structure.
Brain, Behavior and Evolution, 47, 225–245.
Adams DL, Sincich LC and Horton JC (2003). Proportionate scaling of visual cortical areas revealed
in complete flatmounts of macaque cerebral cortex. Society for Neuroscience Abstracts, 11, 818.
Aiello LC and Wheeler P (1995). The expensive-tissue hypothesis: the brain and digestive system in
human and primate evolution. Current Anthropology, 36, 199–221
Munakata / Processes of change in brain and cognitive development 06-munakata-chap06 Page Proof page 155 8.7.2005 6:44am
DEVELOPMENTAL CONSTRAINTS ON OR DEVELOPMENTAL STRUCTURE j 155

Albritton CC (1989). Catastrophic episodes in earth history. London and New York: Chapman and
Hall.
Alvarez LW, Alvarez W, Asaro J and Michel HV (1980). Extraterrestrial cause for the Cretaceous-
Tertiary extinction. Science, 208, 1095–1108.
Anderson PA , Olavarria J and Van Sluyters RC (1988). The overall pattern of ocular dominance
bands in cat visual cortex. Journal of Neuroscience, 6, 2183–2200.
Atallah HE, Frank MJ and O’Reilly RC (2004). Hippocampus, cortex and basal ganglia: Insights from
computational models of complementary learning systems. Neurobiology of Learning and Mem-
ory, in press.
Barton RA and Harvey PH (2000). Mosaic evolution of brain structure in mammals. Nature, 405,
1055–1058.
Baum EB (2004). What is thought? Boston: MIT Press.
Bayer SA (1980). Development of the hippocampal region in the rat. I. Neurogenesis examined with
3H-thymidine autoradiography. Journal of Comparative Neurology, 190, 87–114.
Bayer SA (1983). (3H) Thymidine-radiographic studies of neurogenesis in the rat olfactory bulb.
Experimental Brain Research, 50, 329–340.
Beck P and Kaas JH (1999). Cortical connections of the dorsomedial visual area in Old World
macaque monkeys. Journal of Comparative Neurology, 406, 487–502.
Beck PD and Kaas JH (1998). Cortical connections of the dorsomedial visual area in the new world
owl monkeys (Aotus trivirgatus) and squirrel monkeys (Saimiri scireus.) Journal of Comparative
Neurology, 400, 18–34.
Beck PD, Pospichal MW and Kaas JH (1996). Topography architecture and connections of somato-
sensory cortex in opossums, evidence for five somatosensory areas. Journal of Comparative
Neurology, 366, 109–133.
Bishop KM, Gourdeau G and O’Leary DDM (2000). Regulation of area identity in the mammalian
neocortex by Emx2 and Pax6. Science, 288, 344–349.
Brodmann K (1909). Vergliechende Lokalisationslehre der Grosshirnrinde in ihren Prinzipien dargestellt
auf Grund der Zellenbaues. Leipzig: Barth.
Burton H, Snyder AZ, Conturo TE , Akbudak E, Ollinger JM and Raichle ME (2002). Adaptive
changes in early and late blind, An fMRI study of Braille reading. Journal of Neurophysiology, 87,
589–607.
Callaerts P, Halder G and Gehring WJ (1997). Pax-6 in development and evolution. Annual Review of
Neuroscience, 20, 483–532.
Carlson M (1991). Ontogenetic and phylogenetic perspectives on somatic sensory cortex and tactile
function . In: O Franzen and J Westman, eds. Information processing in the somatosensory system.
Hampshire, UK: Macmillan Press.
Catania KC and Kaas JH (1995). Organization of the somatosensory cortex of the star-nosed mole.
Journal of Comparative Neurology, 351, 549–567.
Catania KC, Lyon DC, Mock OB and Kaas JH (1999). Cortical organization in shrews, evidence from
five species. Journal of Comparative Neurology, 410, 55–72.
Chappert-Piquemal C, Fonta C, Malecaze F and Imbert M (2001). Ocular dominance columns in the
adult New World Monkey Callithrix jacchus. Visual Neuroscience, 18, 407–412.
Cheng K and Waggoner RKT (2001). Human ocular dominance columns as revealed by high-field
magnetic resonance imaging. Neuron, 32, 359–374.
Cherniak C (1992). Local optimization of neuron arbors Biological Cybernetics, 66, 503–510.
Munakata / Processes of change in brain and cognitive development 06-munakata-chap06 Page Proof page 156 8.7.2005 6:44am
156 j PROCESSES OF CHANGE IN BRAIN AND COGNITIVE DEVELOPMENT

Cheung DT, Darlington RB and Finlay BL (2002). Scalable structure in cortical cartography: Rules
for the proliferation of cortical areas. Society for Neuroscience Abstracts, 27, 877.
Clancy B, Darlington RB and Finlay BL (1999). The course of human events, predicting the timing of
primate neural development. Developmental Science, 3, 57–66.
Clancy B, Darlington RB and Finlay BL (2001). Translating developmental time across mammalian
species. Neuroscience, 105, 7–17.
Collins CE, Stepniewska I and Kaas JH (2001). Topographic patterns of V2 cortical connections in a
prosimian primate Galago garnetti. Journal of Comparative Neurology, 431, 155–167.
Crowley JC and Katz LC (2002). Ocular dominance development revisited. Current Opinion in
Neurobiology, 12, 104–109.
Dawkins R (1976). The selfish gene. Oxford: Oxford University Press.
Dawkins R (1986). The blind watchmaker. New York: W W Norton.
DeVoogd TJ, Krebs JR, Healy SD and Purvis A (1993). Relations between song repertoire size and the
volume of brain nuclei related to song, comparative evolutionary analyses among oscine birds.
Proceedings of the Royal Society of London: B, 254, 75–78.
Donoghue MJ and Rakic P (1999). Molecular gradients and compartments in the embryonic primate
cerebral cortex. Cerebral Cortex, 9, 586–600.
Duboule D and Dolle P (1989). The structural and functional organisation of the mouse Hox gene
family resembles that of Drosophila homeotic genes. EMBO, 8, 1497–1505.
Elman J, Bates E, Johnson M, Karmiloff-Smith A, Parisi D and Plunkett K (1996). Rethinking
Innateness: A connectionist perspective on development. Massachusetts: MIT Press.
Felleman DJ and Van Essen DC (1991). Distributed hierarchical processing in the primate cerebral
cortex. Cerebral Cortex, 1, 1–47.
Finlay BL (2004). Rethinking developmental neurobiology. In: M Tomasello and D Slobin, eds.
Beyond nature-nurture, essays in honor of Elizabeth Bates, pp. 195–219. New York: Lawrence
Earlbaum.
Finlay BL and Darlington RB (1995). Linked regularities in the development and evolution of
mammalian brains. Science, 268, 1578–1584.
Finlay BL and Pallas SL (1989). Control of cell number in the developing visual system. Progress in
Neurobiology, 32, 207–234.
Finlay BL, Darlington RB and Nicastro N (2001). Developmental structure in brain evolution.
Behavioral and Brain Sciences, 24, 263–307.
Finlay BL, Hersman MN and Darlington RB (1998). Patterns of vertebrate neurogenesis and the
paths of vertebrate evolution. Brain, Behavior and Evolution, 52, 232–242.
Finlay BL, Innocenti G and Scheich H (1991). The neocortex, ontogeny and phylogeny. New York:
Plenum Press.
Finlay BL, Wikler KC and Sengelaub DR (1987). Regressive events in neurogenesis and scenarios for
vertebrate brain evolution. Brain, Behavior and Evolution, 30, 102–117.
Florence SL and Kaas JH (1992). Ocular dominance columns in area 17 of Old World macaque and
talapoin monkeys. Complete reconstructions and quantitative analysis. Visual Neuroscience, 8,
449–462.
Florence SL, Conley M and Casagrande VA (1986). Ocular dominance columns and retinal projec-
tions in New World spider monkeys (Ateles ater). Journal of Comparative Neurology, 234, 234–248.
Munakata / Processes of change in brain and cognitive development 06-munakata-chap06 Page Proof page 157 8.7.2005 6:44am
DEVELOPMENTAL CONSTRAINTS ON OR DEVELOPMENTAL STRUCTURE j 157
Gao PP, Zhang JH, Ceretti DP, Levitt P and Zhou R P (1996). Regulation of thalamic neurite
outgrowth by the ephrin ligand ephrin A-5: implications for the development of thalamocortical
projections. Proceedings of the National Academy of Sciences, USA, 95, 5329–5334.
Garraghty PE and Sur M (1990). Morphology of single intracellularly stained axons terminating in
area 3b of macaque monkeys. Journal of Comparative Neurology, 294, 583–593.
Gerhart J and Kirschner M (1997). Cell, Embryos and Evolution. Malden, MA: Blackwell Science.
Gilissen E and Zilles K (1995). The relative volume of the primary visual cortex and its intersubject
variability among humans, a new morphometric study. Comptes Rendus Academie Sciences Paris,
320, 897–902.
Glendenning KK and Masterton RB (1998). Comparative morphometry of mammalian central
auditory systems: Variation in nuclei and form of the ascending system. Brain, Behavior and
Evolution, 51, 59–89.
Goodyear BG (2001). Brief visual stimulation allows mapping of ocular dominance in visual cortex
using fMRI. Human Brain Mapping, 14, 210–217.
Gosh S (1997). Comparison of the cortical connections of areas 4g and 4d in the cat cerebral cortex.
Journal of Comparative Neurology, 388, 371–396.
Gould SJ (1977). Ontogeny and phylogeny Cambridge, MA: Harvard University Press.
Gould SJ (1980). The panda’s thumb. New York: W W Norton.
Gould SJ (2002). The structure of evolutionary theory. Cambridge, MA: Belknap Press.
Graham A, Papalopulu N and Krumlauf R (1989). The murine and drosophil homeobox gene
complex have common features of organisation and expression. Cell, 57, 367–378.
Grove EA and Fukuchi-Shimogori T (2003). Generating the cerebral cortical area map. Annual
Review of Neuroscience, 26, 355–380.
Hess D and Edwards M (1987). Anatomical demonstration of ocular segregation in the retinogen-
iculate pathway of the New World capuchin monkey (Cebus apella). Journal of Comparative
Neurology, 264, 409–420.
Hofman MA (1989). On the evolution and geometry of the brain in mammals. Progress in Neuro-
biology, 32, 137–158.
Horton JC and Hocking DR (1996). Anatomical demonstration of ocular dominance columns in
striate cortex of the squirrel monkey. Journal of Comparative Neurology, 16, 5510–5522.
Huffman KJ, Nelson J, Clarey J and Krubitzer L (1999). Organization of somatosensory cortex in
three species of marsupials Dasyurus hallucatus Dactylopsila trivirgata and Monodelphis domestica:
Neural correlates or morphological specifications? Journal of Comparative Neurology, 403, 5–32.
Hui-Xin Q, Lyon DC and Kaas JH (2002). Cortical and thalamic connections of the parietal and
ventral somatosensory area in marmoset monkeys. (Callithrix jacchus). Journal of Comparative
Neurology, 443, 168–182.
Jacobs GH (1998). Photopigments and seeing – lessons from natural experiments – the Proctor
Lecture. Investigative Ophthalmology and Visual Science, 39, 2205–2216.
Jacobs LF and Spencer WD (1994). Natural space-use patterns and hippocampal size in kangaroo
rats. Brain, Behavior and Evolution, 44, 125–132.
Jensen K (1987). Terminal arbors of axons projecting to the somatosensory cortex of the adult rat:
I The normal morphology of specific thalamocortical afferents. Journal of Neuroscience, 7,
3529–3543.
Jerison HJ (1973). Evolution of the brain and intelligence. New York: Academic Press.
Munakata / Processes of change in brain and cognitive development 06-munakata-chap06 Page Proof page 158 8.7.2005 6:44am
158 j PROCESSES OF CHANGE IN BRAIN AND COGNITIVE DEVELOPMENT

Kaas JH (1982). Segregation of function in the nervous system: Why do sensory systems have so many
subdivisions? In: W Neff, ed. Contributions to sensory physiology, pp. 201–240. New York:
Academic Press.
Kaas JH (1987). The organization of the neocortex in mammals. Annual Review of Psychology, 38,
129–151.
Kaas JH (1997). Topographic maps are fundamental to sensory processing. Brain Research Bulletin,
44, 107–112.
Kaas JH (2000a). Why does the brain have so many visual areas? In: MS Gazzaniga, ed. Cognitive
neuroscience: a reader, pp. 449–472. Malden, MA: Blackwell.
Kaas JH (2000b). Why is brain size so important: Design problems and solutions as neocortex get
bigger or smaller. Brain and Mind, 1, 1–25.
Kaas JH (2002a). Proposed cortical areas of the New World monkey Callithrix jacchus. In: JF Baer, RE
Weller and I Kakoma, eds. Aotus: the owl monkey, pp. 331–351. Orlando, Fl: Academic Press.
Kaas JH (2002b). Proposed cortical areas of the owl monkey Aotus trivirgatus. In: JF Baer, RE Weller
and I Kakoma, eds. Aotus: the owl monkey, pp. 331–351. Orlando, Fl: Academic Press.
Kaas JH, Krubitzer L and Johanson KL (1989). Cortical connections of areas 17 (V-I) and 18 (V-2) of
squirrels. Journal of Comparative Neurology, 281, 426–446.
Kahn DM, Huffman KJ and Krubitzer L (2000). Organization and connections of V1 in Monodelphis
domestica. Journal of Comparative Neurology, 428, 337–354.
Kaskan P, Franco C , Yamada E, Silveira LCL, Darlington RB and Finlay BL (2004). Peripheral
variability and central constancy in mammalian visual system evolution. Proceedings of the Royal
Society: Biological Sciences, In press.
Kaskan PM and Finlay BL (2001). Encephalization and its developmental structure, how many ways
can a brain get big? In: T Sanderson, ed. Evolutionary anatomy of the primate cerebral cortex,
pp. 14–29. Cambridge: Cambridge University Press.
Kingsbury MA and Finlay BL (2001). The cortex in multidimensional space: Where do cortical areas
come from? Developmental Science, 4, 125–157.
Krubitzer L, Manger P, Pettigrew J and Calford M (1995). Organization of somatosensory cortex in
monotremes: In search of the prototypical plan. Journal of Comparative Neurology, 351, 261–306.
Krubitzer LA (1995). The organization of neocortex in mammals: Are species differences really so
different? Trends in Neurosciences, 18, 408–417.
Krubitzer LA (1998). What can monotremes tell us about brain evolution? Philosopical Transactions
of the Royal Society of London B, 353, 1127–1146.
Krubitzer LA and Huffman K J (2000). Arealization of the neocortex in mammals: genetic and
epigenetic contributions to the phenotype. Brain, Behavior and Evolution, 55, 323–333.
Krubitzer LA and Kaas JH (1990a). Cortical connections of MT in four species of primate, areal
modular and retinotopic patterns. Visual Neuroscience, 5, 165–204.
Krubitzer LA and Kaas JH (1990b). Organization and connections of somatosensory cortex in
marmosets. Journal of Neuroscience, 10, 952–974.
Krubitzer LA and Kaas JH (1993). The dorsalmedial visual area of owl monkeys, connections
myleoarchitecture and homologies in other primates. Journal of Comparative Neurology, 334,
497–527.
Krubitzer LA, Calford MB and Schmid LM (1993). Connections of somatosensory cortex in
megachiropteran bats: The evolution of cortical fields in mammals. Journal of Comparative
Neurology, 327, 473–506.
Munakata / Processes of change in brain and cognitive development 06-munakata-chap06 Page Proof page 159 8.7.2005 6:44am
DEVELOPMENTAL CONSTRAINTS ON OR DEVELOPMENTAL STRUCTURE j 159

Krubitzer LA , Kunzle H and Kaas JH (1997). Organization of somatosensory cortex in a Madagas-
can insectivore. Journal of Comparative Neurology, 379, 399–414.
Krubitzer LA, Sesma MA and Kaas JH (1986). Microelectrode maps myeloarchitecture and cortical
connections of three somatotopically organized representations of the body surface in parietal
cortex of squirrels. Journal of Comparative Neurology, 253, 415–434.
Landry P and Deschenes M (1981). Intracortical arborizations and receptive fields of identified
ventrobasal thalamocortical afferents to the primary somatosensory cortex in the cat. Journal of
Comparative Neurology, 199, 345–371.
Law M, Zahs K and Stryker M (1988). Organization of primary visual cortex (area 17) in the ferret.
Journal of Comparative Neurology, 178, 157–180.
Letinic K and Rakic P (2001). Telencephalic origin of human thalamic GABAergic neurons. Nature
Neuroscience, 4, 931–936.
Lewis JW and Van Essen DC (2000a). Mapping of architectonic subdivisions in the macaque monkey
with emphasis on parieto-occipital cortex. Journal of Comparative Neurology, 428, 79–111.
Lewis J W and Van Essen DC (2000b). Corticocortical connections of visual sensorimotor and
multimodal processing areas in the parietal lobe of the macaque monkey. Journal of Comparative
Neurology, 428, 112–137.
Lipson H and Pollack JB (2000). Automatic design and manufacture of artificial lifeforms. Nature,
406, 974–978.
Lyon D, Jain N and Kaas JH (1998). Cortical connections of striate and extrastriate visual areas in tree
shrews. Journal of Comparative Neurology, 401, 109–128.
Merker B (2004). Cortex, countercurrent context and the logistics of personal history. Cortex, 40,
550–583.
Moll J, De Oliveira-Souza R, Bramati I and Grafman J (2002). Functional networks in emotional
moral and nonmoral social judgments. Neuroimage, 16, 696–703.
Murphy WJ, Eizirik E, O’Brien S J, Madsen O, Scally M, Douady CJ, Teeling E, Ryder OA, Stanhope
MJ, De Jong WW and Springer MS (2001). Resolution of the early placental mammal radiation
using Bayseian phylogenetics. Science, 294, 2348–2351.
Murre J and Sturdy D (1995). The connectivity of the brain, multi-level quantitative analysis.
Biological Cybernetics, 73, 529–545.
Nakagawa Y, Johnson JE and O’Leary DDM (1999). Graded and areal expression patterns of
regulatory genes and cadherins in embryonic neocortex independent of thalamocortical input.
Journal of Neuroscience, 19, 10877–10885.
Neitz J, Carroll J, Yamauchi Y, Neitz M and Williams DR (2002). Color perception is mediated by a
plastic neural mechanism that is adjustable in adults. Neuron, 35, 783–792.
Nolfi S and Floreano D (2002). Synthesis of autonomous robots through evolution. Trends in
Cognitive Science, 6, 31–37.
Northcutt R and Kaas JH (1995). The emergence and evolution of the mammalian cortex. Trends in
Neuroscience, 18, 373–378.
Nottebohm F and Pandazis CKS (1981). Brain space for a learned task. Brain Research, 213, 99–109.
Olavarria J and Montero V (1990). Elaborate organization of visual cortex in hamster. Neuroscience
Research, 8, 40–47.
Pallas SL (2001). Intrinsic and extrinsic factors that shape neocortical specification. Trends in
Neuroscience, 24, 417–423.
Munakata / Processes of change in brain and cognitive development 06-munakata-chap06 Page Proof page 160 8.7.2005 6:44am
160 j PROCESSES OF CHANGE IN BRAIN AND COGNITIVE DEVELOPMENT

Pallas SL and Finlay BL (1989). Conservation of receptive-field properties of superiorcolliculus cells
after developmental rearrangements of retinal input. Visual Neuroscience, 2, 121–135.
Purves D and LaMantia A (1993). Development of blobs in the visual cortex of macaques. Journal of
Comparative Neurology, 334, 169–175.
Purvis A and Rambaut A (1995). Comparative analysis by independent contrasts (CAIC), an Apple
Macintosh application for analysing comparative data. Computer Applications in Biosciences, 11,
247–251.
Quartz SR and Sejnowski TJ (1997). The neural basis of cognitive development, a constructivist
manifesto. Behavioral and Brain Sciences, 20, 537–556.
Radman M, Matic I and Taddei F (1999). Evolution of evolvability. Annals of the New York Academy of
Sciences, 870, 146–155.
Ragsdale CW and Grove EA (2001). Patterning the mammalian cerebral cortex. Current Opinion in
Neurobiology, 11, 50–58.
Rakic P (1988). Specification of cerebral cortical areas. Science, 241, 170–176.
Rakic P (1991). Experimental manipulation of cerebral cortical areas in primates. Philosophical
Transactions of the Royal Society of London B, 331, 291–294.
Rakic P (1995). A small step for the cell; a giant leap for mankind: a hypothesis of neocortical
expansion during evolution. Trends in Neurosciences, 18, 383–388.
Redies C and Takeichi M (1996). Cadherins in the developing nervous system, an adhesive code for
segmental and functional subdivisions. Developmental Biology, 180, 413–423.
Rezak KA, Huang L and Pallas SL (2003). NMDA receptor blockade in the superior colliculus
increases receptive field size without altering velocity and size tuning. Journal of Neurophysiology,
90, 110–119.
Ringo J (1991). Neural interconnection as a function of brain size. Brain, Behavior and Evolution, 38,
1–6.
Rosa MG (2002). Visual maps in the adult primate cerebral cortex, some implications for brain
development and evolution. Brazilian Journal of Medical and Biological Research, 35, 1485–1498.
Rosa MGP (1999). Topographic organization of extrastriate cortex in the flying fox: implications for
the evolution of mammalian visual cortex. Journal of Comparative Neurology, 411, 503–523.
Rubenstein JLR, Martinez S, Shimamura K and Puelles L (1994). The embryonic vertebrate
forebrain, the prosomeric model. Science, 266, 578–579.
Ryan M (2004). Ode to the code. American Scientist, 92, 494–498.
Scharff C (2000). Chasing fate and function of new neurons in adult brains. Current Opinion in
Neurobiology, 10, 774–783.
Schuller G, Oapos;Neill W and Radtke-Schuller S (1991). Facilitation and delay sensitivity of
auditory cortex neurons in CF – FM bats Rhinolophus rouxi and Pteronotus p parnellii. European
Journal of Neuroscience, 3, 1165–1181.
Slutsky DA, Manger PR and Krubitzer LA (2000). Multiple somatosensory areas in the anterior
parietal cortex of the California ground squirrel (Spermophilus beechyi). Journal of Comparative
Neurology, 416, 521–539.
Stein E and Tessier-Lavigne M (2001). Hierarchical organization of guidance receptors, silencing of
netrin attraction by slit through a Robo/DCC receptor complex. Science, 291,1928–1938.
Stephan H (1981). New and revised volumes of brain structures in insectivores and primates. Folia
Primatologica (Basel), 35, 1–29.
Munakata / Processes of change in brain and cognitive development 06-munakata-chap06 Page Proof page 161 8.7.2005 6:44am
DEVELOPMENTAL CONSTRAINTS ON OR DEVELOPMENTAL STRUCTURE j 161

Stephan HGB and Frahm H D (1988). Comparative size of brain and brain components In:
Comparative primate biology. Alan R Liss.
Tigges J and Tigges M (1979). Ocular dominance columns in the striate cortex of chimpanzee (Pan
troglodytes). Brain Research, 166, 387–391.
Valverde F (1991). The organization of striate cortex. In: B Dreher and SR Robinson, eds. Neuro-
anatomy of the visual pathways and their development, pp. 235–276. Boca Raton: Macmillan Press.
Van Essen DC, Newsome WT and Maunsell JH (1984). The visual field representation in striate
cortex of the macaque monkey, asymmetries anisotropies and individual variability. Vision
Research, 24, 429–448.
Website (2001). Brain and bodyweights of mammals. University of New Mexico Department of
Mathematics Website.
Website (2003). What is the relationship between brain and body size? Serendipity Website.
Weller RE , White DM and Walton MMG (2000). Intrinsic connections in the caudal subdivision
of the dorsolateral visual area (DLc) in squirrel monkeys. Journal of Comparative Neurology, 420,
52–69.
Wilkins A S (2001). The evolution of developmental pathways. Sunderland, MA: Sinauer Associates.
Wu C, Bichot N and Kaas JH (2000). Converging evidence from microstimulation architecture and
connections for multiple motor areas in the frontal and cingulate cortex of prosimian primates.
Journal of Comparative Neurology, 423, 140–177.
Zilles K (1985). The cortex of the rat: A stereotaxic atlas. Berlin: Springer-Verlag.
Munakata / Processes of change in brain and cognitive development 06-munakata-chap06 Page Proof page 162 8.7.2005 6:44am
162 j PROCESSES OF CHANGE IN BRAIN AND COGNITIVE DEVELOPMENT