parliament, the council, the economic and social …
TRANSCRIPT
EN EN
EUROPEAN COMMISSION
Brussels, 24.2.2021
SWD(2021) 25 final
COMMISSION STAFF WORKING DOCUMENT
IMPACT ASSESSMENT REPORT
Accompanying the document
COMMUNICATION FROM THE COMMISSION TO THE EUROPEAN
PARLIAMENT, THE COUNCIL, THE ECONOMIC AND SOCIAL COMMITTEE
AND THE COMMITTEE OF THE REGIONS
Forging a climate-resilient Europe - The new EU Strategy on Adaptation to Climate
Change
{COM(2021) 82 final} - {SEC(2021) 89 final} - {SWD(2021) 26 final}
TABLE OF CONTENTS
TABLE OF CONTENTS ................................................................................................................................................... 0 INDEX OF TABLES AND BOXES ............................................................................................................................. 251 INDEX OF FIGURES ................................................................................................................................................... 252 ABBREVIATIONS ....................................................................................................................................................... 252 1. INTRODUCTION................................................................................................................................................... 3
European Union political and legal context ............................................................................................................ 4 International political and legal context .................................................................................................................. 7 Impacts of COVID-19 on EU adaptation policies: resilient recovery ..................................................................... 8
2. PROBLEM DEFINITION ..................................................................................................................................... 9 Problems for the new EU Adaptation Strategy and their evolution ......................................................................... 9 What are the problem drivers? .............................................................................................................................. 15
3. WHY SHOULD THE EU ACT? ......................................................................................................................... 24 Legal basis ............................................................................................................................................................ 24 Subsidiarity: Necessity and Added Value of EU action ........................................................................................ 24
4. OBJECTIVES: WHAT IS TO BE ACHIEVED?.................................................................................................. 25 General objective .................................................................................................................................................. 25 Specific objectives ................................................................................................................................................ 26
5. WHAT ARE THE AVAILABLE POLICY OPTIONS? ....................................................................................... 30 What is the baseline against which the options are assessed? ............................................................................... 31 Option 1: Deepening of existing actions of the 2013 Strategy .............................................................................. 32 Option 2: Deepening of existing actions and addition of novel actions to Strategy .............................................. 33 Options discarded at an early stage ....................................................................................................................... 35
6. WHAT ARE THE IMPACTS OF THE POLICY OPTIONS?.............................................................................. 36 Summary of impacts ............................................................................................................................................. 37 Economic impacts ................................................................................................................................................. 39 Social impacts ....................................................................................................................................................... 47 Environmental impacts .......................................................................................................................................... 51 Cross-cutting impacts ............................................................................................................................................ 54
7. HOW DO THE OPTIONS COMPARE ................................................................................................................ 55 Effectiveness ......................................................................................................................................................... 56 Efficiency .............................................................................................................................................................. 56 Coherence ............................................................................................................................................................. 57 Added Value ......................................................................................................................................................... 57 Proportionality ...................................................................................................................................................... 58
8. PREFERRED OPTION......................................................................................................................................... 58 9. HOW WILL ACTUAL IMPACTS BE MONITORED AND EVALUATED? .................................................... 61 ANNEX 1: PROCEDURAL INFORMATION ............................................................................................................... 63
Lead DG, Decide Planning/CWP references ......................................................................................................... 63 Organisation and timing ........................................................................................................................................ 63 Consultation of the RSB ........................................................................................................................................ 63
ANNEX 2: STAKEHOLDER CONSULTATION – CONSULTATION SYNOPSIS .................................................... 65 ANNEX 3: WHO IS AFFECTED AND HOW?.............................................................................................................. 91 ANNEX 4: ANALYTICAL METHODS ......................................................................................................................... 97
Economic modelling ............................................................................................................................................. 97 GINFORS-E: Short model description .................................................................................................................. 99 Uncertainty and sensitivity analysis .................................................................................................................... 102 Detailed modelling results ................................................................................................................................... 103 References ........................................................................................................................................................... 109
ANNEX 5: IMPACT SCREENING .............................................................................................................................. 111 ANNEX 6: NON-EXHAUSTIVE LIST OF MEASURES TO BE DEVELOPED UNDER THE NEW EU
ADAPTATION STRATEGY ............................................................................................................................. 116 ANNEX 7: MINI–ASSESSMENTS .............................................................................................................................. 129
ACTION 1: Closing further gaps in adaptation-relevant knowledge, through systematic data collection and
sharing, and working with key public and private partners. ................................................................... 129 ACTION 2: Further developing Climate-ADAPT as the ‘first-stop shop’ for adaptation information in
Europe. ................................................................................................................................................... 136 ACTION 3: Strengthening the evaluation, monitoring, reporting and implementation of adaptation strategies
at national and subnational levels, including in cities, cross-border, and in the Outermost Regions.
(including through the Climate Law via Climate-ADAPT). .................................................................. 143 ACTION 4: Prioritising nature-based adaptation, including coastal protection and green and blue
infrastructure. ......................................................................................................................................... 143 ACTION 5: Stepping-up efforts to build resilience in cities and empower local action...................................... 161 ACTION 6: Further mainstreaming and integrating adaptation in EU legislation and instruments .................... 171 ACTION 7: Climate Proofing of Infrastructure and beyond. .............................................................................. 171

2
ACTION 8: Narrowing the Climate Protection Gap—Micro-economic policy .................................................. 178 ACTION 9: Supporting partner countries in their efforts on climate change, disaster preparedness, and
comprehensive risk management approaches ......................................................................................... 187 ACTION 10: Scaling up international adaptation finance and disaster risk financing, including by unlocking
innovative finance and mobilising the private sector. ............................................................................ 192 ACTION 11: Strengthening EU engagement globally and learning from adaptation frontrunners. .................... 198 ACTION 12: Adaptation Solutions / Horizon Europe Mission on adaptation to Climate Change, including
Societal Transformation ......................................................................................................................... 205 Action 13: Closing the Climate Protection Gap - Macroeconomic aspects of adaptation to climate change. ..... 218 ACTION 14: Ensuring the availability of fresh water. ........................................................................................ 222
ANNEX 8: LEGAL BASIS FOR EU ACTION IN CLIMATE CHANGE ADAPTATION ......................................... 232 ANNEX 9: CLIMATE CHANGE AND ITS IMPACTS ............................................................................................... 233 ANNEX 10: GLOSSARY ............................................................................................................................................. 247
3
1. INTRODUCTION
Global warming is happening and is already affecting Europeans – its impacts are here
and now and they are a daily confirmation of the case for urgent action that science has
provided for some time. Temperatures continue to break records and climate-related extreme
events are more frequent and more intense. Europeans continue to call for stronger climate
action even in the current health and economic crisis resulting from the Covid-19 pandemic.
This means higher ambition on both mitigation and on adaptation to climate change1.
The impacts on people, planet and prosperity are already pervasive but unevenly
distributed across the globe. In 2018, most of the natural hazards affecting nearly 62 million
people globally were associated with extreme weather and climate events2. Out of 17.2
million new displacements associated with disasters in 2018, 16.1 million were weather
related3.
Between 2000 and 2016, the number of people exposed to heatwaves globally
increased by around 125 million4. Climate-related disasters doubled compared to the previous
20 years5. At the global level, least developed countries and small island states are
particularly vulnerable to the impacts of climate change and have the lowest adaptive
capacity, while at the same time contributing the least to greenhouse gas emissions. Climate
change also impacts disproportionately the most vulnerable parts of our society, thus
exacerbating inequalities further. The changing climate has reduced oxygen levels in the
ocean by ~1-2 % since the middle of the last century6, while increasing ocean temperatures
have resulted in habitat shifts for species and coral bleaching (causing worldwide reef
degradation).
Moreover, even stopping all greenhouse gas emissions would not stop the climate
impacts that are already occurring, and which, due to the concentration of these gases in
the atmosphere, are likely to continue for decades. Temporary decreases of greenhouse gas
emissions, like those caused by the 2008 financial crisis or the current economic disruption
from the Covid-19 pandemic, have little effect on the evolution of the planetary climate (and
emissions can bounce back quickly).
The global temperature averages (already 1.2°C above pre-industrial levels) hide even
more extreme regional impacts. An average of 3°C or 4°C global rise in temperature means
temperature increases above 5°C or 6°C for some regions (and Europe warms faster than the
average). This ranges from unprecedented forest fires and heatwaves above the Arctic Circle
to increasingly devastating droughts in Western Europe and the Mediterranean region; and
from accelerating coastal erosion on the Atlantic coast to more severe flooding and decimated
forests in Central and Eastern Europe7.
1 In this impact assessment, Adaptation refers to policies, practices and projects which can moderate damage, improve resilience and/or realise opportunities associated with the impacts of climate change at all levels of society. 2 https://library.wmo.int/index.php?lvl=notice_display&id=20799#.XmIqSKhKjb0 3 https://www.internal-displacement.org/sites/default/files/publications/documents/2019-IDMC- GRID.pdf 4 https://www.who.int/health-topics/heatwaves#tab=tab_1 5 https://www.undrr.org/news/drrday-report-dramatic-rise-climate-disasters-over-last-20-years 6 https://portals.iucn.org/library/node/48892 7 The 2020 State of the European environment report concludes that climate change has substantially increased the occurrence of climate
and weather extremes.

4
Without drastic emission abatement measures (at a global scale, matching the EU goal
on climate neutrality by 2050 and increased ambition by 2030), continued climate
change will increase the likelihood of severe, pervasive and irreversible consequences
such as the decline or collapse of natural ecosystems (e.g. Arctic or Alpine ecosystems), the
erosion of global food security, or displacement of people8. Extreme sea level events and
floods will occur more frequently, with severe damages to Europe’s coastal communities.
Climate change and its impact is interrelated with other environmental crisis (biodiversity
loss, natural resources depletion, pollution); their effects are cumulative – but solutions are
also common.
European Union political and legal context
The 2013 EU Adaptation Strategy9 was evaluated in November 2018
10. The Evaluation
found that the strategy had delivered on its objectives, with progress recorded against each of
its eight individual actions. Nevertheless, several areas of societal vulnerability were
identified for improvement, drawing on lessons learnt from implementation, and in the light
of international developments since its adoption (such as the Paris Agreement11
and the
Sendai Framework for Disaster Risk Reduction12
).
The European Green Deal13
sets out the Commission’s commitment to tackling climate
and environmental-related challenges and introduces the green oath to “do no harm”. It is
essential as a roadmap and a growth strategy towards a prosperous, resilient and healthy
future, made more necessary in light of the very severe effects of the COVID-19 pandemic on
our health and economic well-being. Unprecedented near term investments will be needed to
overcome the negative impact of the COVID-19 crisis on jobs, incomes and businesses. The
political choices we make today will define the future for the next generations. A new, more
ambitious Adaptation Strategy was announced in the European Green Deal Communication,
and subsequently as part of the Commission Work Programme 202114
. An extensive
Blueprint15
informed the public debate with citizens and stakeholders on the new Strategy.
Recent calls to raise the ambition of the EU strategic approach to climate change
adaptation build on earlier progress16
. These take place against a background of increasing
public visibility of climate change impacts (both current and projected – see section 2) and
other environmental problems that has also led to direct calls for action from citizens and
civil society. There has been a corresponding increase in attention from EU Institutions:
8 https://www.eea.europa.eu/highlights/soer2020-europes-environment-state-and-outlook-report 9 European Commission (2013) An EU Strategy on adaptation to climate change, Communication from the Commission to the European
Parliament, the Council, the European Economic and Social Committee and the Committee of the Regions COM/2013/0216 final 10 European Commission (2018) Evaluation of the EU Strategy on adaptation to climate change, Report from the Commission to the European Parliament and the Council SWD/2018/461 final 11 Council Decision (2016) On the conclusion, on behalf of the European Union, of the Paris Agreement adopted under the United Nations
Framework Convention on Climate Change, (EU) 2016/1841 (OJ L 282, 19.10.2016, p. 1) 12 European Commission (2014) The post 2015 Hyogo Framework for Action: Managing risks to achieve resilience, Communication from
the Commission to the European Parliament, the European Council, the Council, the European Economic and Social Committee and the
Committee of the Regions COM/2014/0216 final 13 European Commission (2019) The European Green Deal, Communication from the Commission to the European Parliament, the
European Council, the Council, the European Economic and Social Committee and the Committee of the Regions COM/2019/640 final 14 European Commission (2020) Commission Work Programme 2020 A Union that strives for more, Communication from the Commission to the European Parliament, the Council, the European Economic and Social Committee and the Committee of the Regions COM/2020/37
final 15 European Commission (2020) Adaptation to Climate Change Blueprint for a new, more ambitious EU strategy 16 For a more detailed account of the historical background, the interested reader is directed to the 2018 Evaluation of the Adaptation
Strategy, which provides a comprehensive review up to 2018.
5
European Council conclusions repeatedly stress the need for further action on adaptation17
,
the European Parliament Resolution on the new EU Strategy18
considers it as an opportunity
to show the EU global leadership on adaptation.
Over the next decade, the implementation of the European Green Deal would further
deliver on European climate change adaptation ambitions, with adaptation to address
climate change impacts as a key priority, as impacts will continue to create significant stress
despite mitigation efforts. The Commission proposal for a European Climate Law
Regulation19
, establishing the framework for achieving climate neutrality in the EU and at the
heart of the Green Deal, recognises adaptation as a key component of the long-term global
response to climate change. It requires Member States and the Union to enhance their
adaptive capacity, strengthen resilience and reduce vulnerability to climate change. It also
introduces a requirement for the implementation of national strategies and regular progress
assessments as part of the overall EU governance on climate action.
The new Strategy will step-up the ongoing drive to mainstream adaptation considerations in EU legislation and instruments, as adaptation affects almost the entire
spectrum of EU policy. Climate change adaptation is being mainstreamed in new initiatives
under the European Green Deal, including the EU Biodiversity Strategy20
, the Farm to Fork
Strategy21
, the Circular Economy Action Plan22
, the Renovation Wave23
, the Forest Strategy24
the Urban Agenda for the EU25
and the Habitat III new Urban Agenda26
,the Sustainable
Development 2030 Agenda27
, and the Zero Pollution ambition. Other channels for
mainstreaming of adaptation in EU policy include the implementation of the EU’s Strategic
partnership with the EU's outermost regions28
and cooperation with the European
Standardisation Organisations29
. Most recently, the implementing regulation on the
Governance of the Energy Union and Climate Action 30
31
stipulates the structure, format,
submission processes and review of adaptation information reported by Member States32
.
17 Council conclusions on Climate Diplomacy, ST-5033-2020 of 20 January 2020, https://data.consilium.europa.eu/doc/document/ST-5033-
2020-INIT/en/pdf 18 European Parliament resolution of 17 December 2020 on the EU strategy on adaptation to climate change (2020/2532(RSP)) https://www.europarl.europa.eu/doceo/document/TA-9-2020-0382_EN.pdf 19 European Commission (2020) Proposal for a Regulation of the European Parliament and of the Council establishing the framework for
achieving climate neutrality and amending Regulation (EU) 2018/1999 (European Climate Law), COM/2020/80 final 20 European Commission (2020) EU Biodiversity Strategy for 2030, from the Commission to the European Parliament, the Council, the
European Economic and Social Committee and the Committee of the Regions, COM/2020/380 final 21 European Commission (2020) Farm to Fork Strategy, from the Commission to the European Parliament, the Council, the European Economic and Social Committee and the Committee of the Regions, COM/2020/381 final 22 European Commission (2020) A new Circular Economy Action Plan For a cleaner and more competitive Europe, from the Commission to
the European Parliament, the Council, the European Economic and Social Committee and the Committee of the Regions, COM/2017/0623
final 23 European Commission (2020) A Renovation Wave for Europe - greening our buildings, creating jobs, improving lives COM(2020) 662
final 24 https://ec.europa.eu/info/law/better-regulation/have-your-say/initiatives/12674-Forests-new-EU-strategy 25 https://ec.europa.eu/futurium/en/urban-agenda 26 https://www.habitat3.org/the-new-urban-agenda 27 https://www.international.gc.ca/world-monde/issues_development-enjeux_developpement/priorities-priorites/agenda-
programme.aspx?lang=eng 28 European Commission (2017) A stronger and renewed strategic partnership with the EU's outermost regions, from the Commission to the European Parliament, the Council, the European Economic and Social Committee and the Committee of the Regions, COM/2020/98 final 29 Mandated in 2014 by the Commission, CEN-CENELEC‘s Coordination Group ‘Adaptation to Climate Change’ (ACC-CG) supports the
implementation of the new EU Adaptation Strategy by coordinating activities relating to standardisation. Currently, the ACC-CG coordinates the process of revising 12 existing standards in the buildings, energy, transport and ICT sectors, and is exploring other sectors
where adaptation to climate change is identified as necessary. 30 European Parliament (2018) Governance of the Energy Union and Climate Action, of the European Parliament and of the Council, Regulation (EU) 2018/1999,
31 European Commission (2020), on structure, format, submission processes and review of information reported by Member States pursuant
to Regulation (EU) 2018/1999, of the European Parliament and of the Council, Regulation (EU) No 2020/1208 32 An updated list of Developing Countries and Least Developed Countries can be found, respectively, at the Word Bank's and IMF's official
websites

6
This reporting also supports national energy and climate plans (NECPs), e.g. by protecting
the security of the Union's energy supply against climate impacts33
.
The European Commission has been instrumental in taking forward the 2015 Sendai
Framework for Disaster Risk Reduction (DRR) through its Communication setting out
initial views on shaping the post-2015 Hyogo Framework for Action34
. In November 2017, a
communication from the Commission highlighted the need for Strengthening EU Disaster
Management through “rescEU - Solidarity with Responsibility”35
and in 2019 the revised
Union Civil Protection Mechanism was published36
. The mechanism promotes more robust
and comprehensive EU disaster management through the contribution of all the Union’s
policies and instruments to reinforce the capacity to prevent, prepare for, respond to, and
recover from disasters, including climate-driven natural disasters. 37
Local engagement was identified as an area for improvement in the evaluation of the
2013 Strategy38
, which called for more ambition in the adoption, implementation and
monitoring of national, regional and local adaptation strategies. As part of the European
Green Deal, the Commission [will] launch a European Climate Pact to give actors at all levels
a voice and space to design new climate actions, share information, launch grassroots
activities, and highlight solutions that others can follow, including on adaptation. At the local
level, the Covenant of Mayors is one of the EU’s key initiatives for responding to the climate
emergency and for steering local and regional authorities (LRAs) in the transition towards
climate neutrality and climate change adaptation. Today bringing together more than 10,400
signatories in Europe, the Covenant, alongside other regional and local institutions and
institutions, represents a key complement to the involvement of local and regional authorities
in drawing up NECPs.
The new Adaptation strategy anticipates the demands created by other initiatives in
supplying a larger array of solutions and information on adaptation. The European
Green Deal Investment Plan39
is the investment pillar of the European Green Deal and is
intended to mobilise at least EUR 1 trillion of private and public sustainable investments over
the upcoming decade, including climate action, and climate resilience will be an important
beneficiary of the delivery of this ambition. To further help direct and mobilise sustainable
investments, the Commission committed to review Directive 2014/95/EU on Non-Financial
Reporting Directive (NFRD)40
. The NFRD requires companies to report on non-financial
issues annually, including the environment, social and employee issues and human rights. In
particular, the Taxonomy Regulation (2019/2088)41
requires companies under the scope of
the NFRD to disclose certain indicators of the proportion of their activities that are classified
as sustainable. Moreover, the Delegated Act on the Sustainable Finance Taxonomy42
further
33 https://www.eea.europa.eu/publications/adaptation-in-energy-system 34 European Commission (2014) The post 2015 Hyogo Framework for Action: Managing risks to achieve resilience COM/2014/0216 final 35 European Commission (2017) Strengthening EU Disaster Management: rescEU Solidarity with Responsibility Solidarity with
Responsibility, from the Commission to the European Parliament, the Council, the European Economic and Social Committee and the
Committee of the Regions, Communication COM/2017/0773, final 36 Decision (EU) 2019/420 of the European Parliament and of the Council of 13 March 2019 amending Decision No 1313/2013/EU on a
Union Civil Protection Mechanism (OJL77 I, 20.3.2019, p.1.) 37 In June 2020 a further review of the UCPM was proposed (COM(2020)220 final of 2.6.2020. 38 European Commission (2018) Evaluation of the EU Strategy on adaptation to climate change SWD/2018/461 final 39 European Commission (2020) Sustainable Europe Investment Plan European Green Deal Investment Plan, from the Commission to the
European Parliament, the Council, the European Economic and Social Committee and the Committee of the Regions, COM/2020/21 40 European Parliament (2014) amending Directive 2013/34/EU as regards disclosure of non-financial and diversity information by certain
large undertakings and groups, of the European Parliament and of the Council Regulation (EU) No 2014/95/EU 41 European Parliament (2020) on the establishment of a framework to facilitate sustainable investment, and amending Regulation, of the European Parliament and of the Council Regulation (EU) No 2019/2088 42 https://ec.europa.eu/info/business-economy-euro/banking-and-finance/sustainable-finance/eu-taxonomy-sustainable-activities_en
7
specifies technical screening criteria for making a significant contribution to adaptation.
Together, these developments are expected to encourage reporting firms to invest in
sustainable activities, including activities that build climate resilience. Overall, this will also
create a wider pool of sustainable investment projects available for adaptation action, as well
as increase demand for the adaptation solutions, tools and knowledge to be developed by the
Strategy.
International political and legal context
There is increasing prominence of adaptation needs in the international public agenda. The World Economic Forum listed extreme weather and climate-change policy failures as the
gravest threats43
for several years in a row. Moreover, international actors like the World
Bank44
and the International Monetary Fund45
are responding to the growing attention to
climate risks and the need for adaptation.
In 2010, the UNFCCC Conference of the Parties established the Cancun Adaptation
Framework46
to strengthen adaptation action in developing countries through international
cooperation. The Conference also established an Adaptation Committee to promote the
implementation of stronger adaptation action, provide technical support and guidance to
countries, strengthen knowledge sharing and promote synergy between stakeholders.
These decisions paved the way for the adoption in 2015 of the Paris Agreement, the new
global framework for renewed ambition in reducing greenhouse gas emissions and in
implementing adaptation measures47
. Among its milestone objectives, the Paris Agreement
enshrines the global goal on adaptation of enhancing adaptive capacity, strengthening
resilience and reducing vulnerability to climate change. The Paris Agreement set up a Global
Stocktake to review the overall progress made in achieving the global goal on adaptation, and
the Paris Decision provides the Adaptation Committee with a comprehensive mandate to
support the work and substantiate the consideration of progress towards the global goal of
adaptation.
At EU level, the implementing regulation for the Governance of the Energy Union and
Climate Action also asks Member States to share information on the provision of financial,
technological and capacity-building support to developing countries. It thus facilitates the
implementation of the Union's commitments under the UN Framework Convention on
Climate Change (UNFCCC) and the Paris Agreement.
The European Union launched the “Global Climate Change Alliance” (GCCA) flagship
initiative in 200748
. Its second iteration (GCCA+) had amongst its priority areas to support
the formulation and implementation of concrete and integrated sector-based climate change
adaptation and mitigation strategies in Small Island Developing States and Least Developed
Countries. The new EU Development Cooperation programme for 2021-2027 (under
preparation) brings opportunities for enhanced support and partnerships - the new Strategy
will help by giving a greater focus to adaptation.
43 https://www.weforum.org/reports/the-global-risks-report-2020 44 https://www.worldbank.org/en/news/press-release/2019/01/15/world-bank-group-announces-50-billion-over-five-years-for-climate-adaptation-and-resilience 45 https://blogs.imf.org/2019/12/02/straight-talk-the-adaptive-age/ 46 UNFCCC (2010) The Cancun Adaptation Framework, https://www.unsystem.org/content/unfccc-cancun-adaptation-framework 47 https://www4.unfccc.int/sites/ndcstaging/Pages/LatestSubmissions.aspx 48 https://ec.europa.eu/clima/sites/clima/files/docs/gcca_brochure_en.pdf
8
The 2030 Sustainable Development Goals49
(SDGs) lay down the specific objective to “take
urgent action to combat climate change and its impacts” (Goal 13). Progress towards the
SDGs is likely to increase resilience to climate change (e.g. SDGs on hunger, water, health,
and ecosystems) or address some of the fundamental causes of climate change (e.g. by SDGs
on energy, infrastructure, cities, and consumption and production)50
. Additionally, the Union
supports cities to exchange solutions and jointly tackle adaptation challenges, thereby making
a direct contribution to the UN-Habitat New Urban Agenda and SDGs.
Impacts of COVID-19 on EU adaptation policies: resilient recovery
Climate change hazards are compounding the COVID-19 outbreak and its economic effects,
e.g. cardiovascular and chronic pulmonary disease — recognized risk factors for severe
Covid-19 — are closely linked to climate change, through effects including extreme heat,
ground-level ozone, wildfire smoke, and increased pollen counts over longer seasons (i.e.
‘compound risk’)51
. Although the final impacts of COVID-19 cannot yet be determined, there
is recognition of a lack of preparation for potentially compounding crises, such as the
incidence of extreme wildfires and heatwaves, together with the current health crisis.52
Examples of the added complexity of such compound problems include the difficulty of
respecting social distancing during a crisis like wildfires or flooding, or enforcing
confinement policies during heatwaves.
The European Union has argued that fighting climate change should be central to Europe’s
economic recovery from the coronavirus pandemic53
, including in its Recovery and
Resilience Facility, the Renovation Wave and other initiatives. Similar calls for adaptation
measures and investments to play a key role in the recovery are echoed by the IMF54
.
Similarities exist between the problem drivers of the COVID-19 pandemic and climate
change adaptation: in both cases, decision-makers and societies are subjected to a ‘normality
bias’, which leads people to underestimate the likelihood of a disaster.55
The onset of the
pandemic also led to triggering the Union Civil Protection Mechanism and extending its
scope on stockpiling of medical equipment for instance. The inclusion of pandemics as risks
that the EU may face emphasises the links with other forms of disasters56
.
While climate change is relatively slow-onset compared to the pandemic’s spread, for both
the lag between measures and effects, and the trade-offs between immediate economic costs
and long-term health benefits make it difficult for political leaders to take immediate bold
action. Lastly, the link between climate change and health impacts in Europe was further
reinforced by a recent European Environment Agency (EEA) analysis57
, e.g. with the latest
evidence that climate change, together with air pollution, noise, chemicals, contributes to the
49 United Nations (2015) Transforming our world: the 2030 Agenda for Sustainable Development, by the General Assembly, Resolution A/RES/70/1 50 An overview at the level of the sub-goals is made by several, including the ETC/CCA in this report https://www.eionet.europa.eu/etcs/etc-
cca/products/etc-cca-reports/tp_3-2018 51 Salas, R. N., Shultz, J. M., & Solomon, C. G. (2020). The Climate Crisis and Covid-19—A Major Threat to the Pandemic Response. New
England Journal of Medicine. 52 OECD (2020), Report of Special meeting of the Task Force on Climate Change Adaptation (30/06/2020). 53General Secretariat of the Council (2020). Conclusions adopted in Special meeting of the European Council (17,18, 19, 20 and 21 July). 54 https://www.imf.org/en/Publications/FM/Issues/2020/09/30/october-2020-fiscal-monitor 55 OECD (n.d.). Recovery for Resilience (R4R). Policy brief. Not published, available upon request. 56 2020 edition of the SWD ‘Overview of natural and man-made disaster risks the EU may face 57 EEA Report No 21/2019 https://www.eea.europa.eu/publications/healthy-environment-healthy-lives

9
burden of cardiovascular disease, while noise, chemicals and climate change all drive
neuropsychiatric disorders58
.
58 Further evidence on these links is available from the scientific opinion on ‘Adaptation to climate change-related health effects’ published
in June 2020 by the European Commission’s independent Group of Chief Scientific Advisors (SAM). Source: https://ec.europa.eu/info/news/new-scientific-opinion-adaptation-climate-change-related-health-effects-recommends-more-support-
resilience-health-sector-2020-jun-29_en

10
2. PROBLEM DEFINITION
This chapter discusses the problem tree that must be addressed by the new Strategy,
stemming from the fact that the EU is still underprepared for current and projected
climate change impacts. This problem tree builds on the problem analysis of the 2013
Strategy and its Evaluation, extensive foresight into projected climate impacts carried out by
the Joint Research Centre (hereafter referred to as PESETA)59
, assessments by the EEA (both
at national60
and local/regional level61
) and contributions from stakeholders. Figure 1
provides an overview of the problem definition; drivers and problems are described in detail
in following sections.
Figure 1: Problem definition for the new EU Adaptation Strategy
Drivers are numbered (D1-D9), as are the Problems (P1-P4) and (in chapter 4) Objectives (O1-O4). These numbers are
used later in this report as a guide to the development of policy options. The figure can be read as a flow in columns, whilst
noting that the problems and drivers are mutually reinforcing and/or overlapping.
Problems for the new EU Adaptation Strategy and their evolution
P1: Insufficient knowledge to support decision making
There is a lack of relevant indicators and meaningful data for informing, and assessing
national and local adaptation action. Data and knowledge gaps cut across all drivers and
problems in various ways: from knowledge or data that is not available to knowledge that is
not reaching the necessary audiences and decision makers; and from data that is not available
at the level, or in a form to be useful to the lack of skills/knowledge to understand the data
and make adequate decisions. Data is needed to enable stakeholders to validate their progress
in implementing adaptation actions; to enable policy makers to maintain, simplify, and
strengthen climate policies, and to enable researchers and innovators to explore novel
adaptation solutions.
When available, climate data and projections to anticipate impacts are frequently not
available at the local level, where many critical decisions need to be taken. Similarly,
adaptation solutions are often either not customised for the local specificities or not yet
tested on a large enough scale to facilitate replication elsewhere. Integrating climate
change adaptation in local governance frameworks has been raised in prior studies as a
59 Feyen L., Ciscar J.C., Gosling S., Ibarreta D., Soria A. (editors) (2020). Climate change impacts and adaptation in Europe. JRC PESETA
IV final report. EUR 30180EN, Publications Office of the European Union, Luxembourg, ISBN 978-92-76-18123-1, doi:10.2760/171121,
JRC119178. 60 EEA Report No 6/2020 Monitoring and evaluation of national adaptation policies throughout the policy cycle. 61 EEA Report No 12/2020 Urban adaptation in Europe: how cities and towns respond to climate change
11
limiting factor for effective adaptation action62
. An analysis of 885 European cities sought to
investigate the extent to which a mainstreaming approach was used in local climate planning
as compared with a dedicated approach, i.e. dedicated stand-alone climate policy
documents.63
The results highlighted the importance of choosing either a "dual-track
approach" in which municipalities develop and adopt the dedicated and mainstreaming plan
simultaneously, or first focus on a dedicated approach and later mainstream local climate
issues. This would encourage effective implementation of tangible climate actions as well as
subsequent diffusion of climate issues into other local sector policies.
There is a lack of appropriate methodologies and indicators to integrate climate change
adaptation with disaster risk reduction strategies. Climate-related disaster loss and risk
data are important not only for crafting and implementing National Adaptation Plans (NAP)
and Strategies (NAS), but also for disaster risk assessment and management, risk monitoring,
risk modelling, loss accounting, economic and social policy, accessing the EU Solidarity
Fund, local authority planning, and the provision of green investments. Despite the usefulness
of these types of data, they are currently not widely available to public authorities, research
institutions, and other stakeholders. The available data is often incongruous, inconsistent over
time, lacking the granularity and standardisation required to draw comparisons across regions
and Member States. The data is also often incomplete: for certain perils there is only
information on the number of people affected (insured and uninsured), the economic losses
(indirect and direct), and the affected area. Moreover, non-economic losses (e.g.
environmental degradation of ecosystems, reduction in biodiversity, destruction of items of
cultural significance, emotional and psychological damages) are entirely absent from existing
datasets.
P2: Weaknesses in implementing, monitoring and reporting of adaptation action
There is currently only limited agreement on principles, requirements and guidelines
for adaptation. This results in the lack of a common method for systematic monitoring and
evaluating the implementation of adaptation policies. For public investment, The Monitoring
Mechanism Regulation (to be replaced by the provisions of the Energy Union Governance
Regulation from 2021 onwards) requires Member States to report to the Commission on their
adaptation activities. 64
The regulation does not prescribe a definition for adaptation activities
nor a methodology to track adaptation activities, so it continues to be a challenge to compare
progress between Member States or to track horizontal progress on the Strategy’s
objectives65
.
For private investment, a problem identified in the Strategy's Evaluation is the tracking of
private finance flows for adaptation action in Europe, which would allow for a clear
understanding of how investments needs are being met by the private sector. Indicators that
are more relevant are needed to accurately monitor private sector commitments to adaptation.
62 Idem 63 Reckien, D., et al. (2019) Dedicated versus mainstreaming approaches in local climate plans in Europe. Renewable and Sustainable
Energy Reviews 112: 948-959. 64 COM(2016) 759: Proposal for a Regulation of the European Parliament and of the Council on the Governance of the Energy Union,
amending Directive 94/22/EC, Directive 98/70/EC, Directive 2009/31/EC, Regulation (EC) No 663/2009, Regulation (EC) No 715/2009,
Directive 2009/73/EC, Council Directive 2009/119/EC, Directive 2010/31/EU, Directive 2012/27/EU, Directive 2013/30/EU and Council Directive (EU) 2015/652 and repealing Regulation (EU) No 525/2013 65 EEA Report No 6/2020 Monitoring and evaluation of national adaptation policies throughout the policy cycle.
12
In this regard, the EU Taxonomy on Sustainable Finance provides a possible common metric
for the EU for the development of associated incentives and verification measures.66
The lack of effective mechanisms to monitor and report on the implementation of
national and local strategies hinders progress. The recent policy developments and
increased public awareness highlight the need for a comprehensive monitoring and evaluation
system to effectively measure progress. New tools that allow assessment not only of
preparedness (as in the 2013 Strategy), but also of resilience, and which monitor it over time,
would need to be complemented by relevant and comparable indicators among EU countries.
The 2018 Evaluation concluded that more should be done in this area, particularly for the
transport, construction, and energy sectors67
. Other work has pointed to deficiencies in EU
level monitoring and reporting of adaptation spending.68,69
The 2018 Evaluation also
concluded that Member States’ monitoring and reporting on their NAS and/or NAP is not yet
robust and there is a need to develop stakeholder involvement (including at subnational
levels) in their assessment, evaluation and review. The evolution from the EU Greenhouse
Gas Monitoring Mechanism Regulation (MMR)70
to the Energy Union Governance
Regulation from 2021 onwards for Member State reporting on adaptation activities is an
opportunity to redefine the role for adaptation preparedness scoreboards.71
Similarly, at city
level, although the pledges by cities are increasing, it is unclear to what extent these are
turned to action, indicating more should be done to track progress at the local level72
.
The unevenness of progress in the development of climate change adaptation agendas across
Europe is reflected in the adoption of the NAS and NAP, which are published on the Climate-
ADAPT platform.73
By April 2020, all 27 EU Member States had adopted a NAP and/or
NAS. Nonetheless, many are not yet in the implementation stage. For example, Italy, Ireland,
Slovakia, Slovenia, Greece, Hungary, and Poland have not yet adopted NAPs, while many
more have yet to establish monitoring indicators and methodologies74
.
Cross-boundary effects of climate impacts within the EU are also not sufficiently
considered. The 2018 Evaluation of the Adaptation Strategy indicated that transboundary
cooperation within the EU remains relatively weak.75
The strong cross-border dimension of
many climate change impacts stresses the need for enhanced cooperation to advance towards
effective cross border climate change adaptation strategies as well76
. Nonetheless, the
unevenness of climate change adaptation agendas is also seen in the approaches implemented
by countries across Europe to comprehensively reduce and adapt to climate-related risks.
Opportunities for transboundary cooperation should be more systematically considered, e.g.
in the fields of freshwater, wildfires, transport infrastructure, telecommunication, energy
66 European Technical Expert Group on Sustainable Finance (2020). Financing a sustainable European Economy. Taxonomy Report:
Technical Annex. 67 https://www.eea.europa.eu/publications/adaptation-in-energy-system 68 Grzebieluch, B., Dembek, A., Meier, N., & European Parliament. (2018). The EU spending on fight against climate change. April.
https://www.europarl.europa.eu/RegData/etudes/IDAN/2018/603830/IPOL_IDA(2018)603830_EN.pdf 69 https://www.oecd.org/dac/environment-development/Revised%20climate%20marker%20handbook_FINAL.pdf 70 Regulation (EU) No 525/2013 on a mechanism for monitoring and reporting greenhouse gas emissions and for reporting other information
at national and Union level relevant to climate change and repealing Decision No 280/2004/Ec. 71 The adaptation preparedness scoreboard aims to create an overview of Member States’ adaptation policies. See for more information:
EEA (n.d.). Working Document on the Adaptation Preparedness Scoreboard. 72 The recently published EEA report provides evidence for this point: https://www.eea.europa.eu/publications/urban-adaptation-in-europe 73 Climate Adapt- Country profiles. https://climate-adapt.eea.europa.eu/ 74 EEA Report No 6/2020 Monitoring and evaluation of national adaptation policies throughout the policy cycle. 75 European Commission (2018) Study to support the evaluation of the EU Adaptation Strategy, Final Report – available at https://ec.europa.eu/clima/sites/clima/files/adaptation/what/docs/adapt_strat_eval_report_en.pdf 76 https://www.eea.europa.eu/themes/climate-change-adaptation/adaptation-policies/adaptation-policies-in-transnational-regions.

13
infrastructure77
and other types of 'critical infrastructure'.78
Climate hazard impacts to critical
infrastructures and EU regional investments may rise strongly in Europe: modelling predicted
that damages could already triple by the 2020s, could increase six-fold by mid-century, and
could increase by more than ten-fold by the end of the century compared to a 1981-2010
baseline.79
The EU Sendai Action Plan promotes resilient investments in critical
infrastructure across EU countries, although the transboundary aspect could be
strengthened.80
P3: Adaptation action is not taken quickly enough
Mainstreaming of adaptation in relevant policies is progressing, but at a suboptimal
pace in light of the increasing frequency and intensity of the impacts. Although the
increase in ambition for climate mainstreaming of 30% in the new Multiannual Financial
Framework (2021-2027)81
is likely to benefit adaptation action, the EU's tracking system for
climate action does not differentiate between how much is spent on climate change mitigation
and on adaptation.82
Another issue is that economic models and financial decision-making
tools used to underpin investments still do not include the damage costs and benefits of
investments in resilience (climate risk assessments).83
Guidance for mainstreaming has been provided in some policy areas, but its effectiveness is
unclear. The 2018 Evaluation noted that there is still a need to better understand how the
guidance documents are being used by Member States. In its remarks on the new MFF 2021-
2027, the European Court of Auditors (ECA) repeated its concerns regarding the Common
Agricultural Policy (CAP) link to climate and environmental objectives84
, including
adaptation, as this is not tracked in expenditure.85
The Commission replied to ECA that a
clear-cut separation between adaptation and mitigation, as well as for other environmental
objective, is often not possible in agriculture and forestry. Given the importance of the CAP
and Cohesion Policy in the total EU budget, these will remain crucial areas to address.
(Un-)insured losses and risks are inadequately reported and acted upon. The 2018
Evaluation identified the role of insurance and financial products in involving the private
sector in adaptation and in mitigation of disaster risks as a key priority. A related issue is that
the approach to insurance of climate risks varies widely across Member States. In a first step,
it would be helpful to gather information on the approach adopted in each Member State in
relation to public versus private insurance mechanisms, to assess where private insurance can
make a significant contribution. A prerequisite for private insurance for climate risks is the
sufficiency and robustness of data to put insurers in a position to build projections on the
climate and to allow accurate assessment and pricing of those risks. However, even where
77 https://www.eea.europa.eu/publications/adaptation-in-energy-system 78 European Environment Agency (2017). Climate changes, impacts and vulnerabilities in Europe 2016. An indicator-based report.
Retrieved from: https://www.eea.europa.eu/publications/climate-change-impacts-and-vulnerability-2016 79 Forzieri, G., Bianchi, A., Marin Herrera, M.A., Batista e Silva, F., Feyen, L. and Lavalle, C., 2015. Resilience of large investments and
critical infrastructures in Europe to climate change. EUR 27598 EN. Luxembourg (Luxembourg): Publications Office of the European
Union. 80: Action Plan on the Sendai Framework for Disaster Risk Reduction 2015-2030, SWD(2016) 205 final/2. 81 European Commission (October 2019). Time to decide on the Union’s financial framework for 2021-2027 (COM). Retrieved from:
https://ec.europa.eu/commission/publications/communication-time-decide-unions-financial-framework-2021-2027_en 82 European Court of Auditors (2016). Spending at least one euro in every five from the EU budget on climate action: ambitious work
underway, but at serious risk of falling short'. 83 E3G (2017). Climate Risk and the EU Budget investing in resilience. Retrieved from: 7 European Court of Auditors (2017), Landscape review: EU action on energy and climate change 84 European Court of Auditors (ECA) (2019): ECA remarks in brief on the Commission's legislative proposals for the next multiannual
financial framework (MFF). 85 European Commission – DG AGRI (2019). Evaluation study on the impact of the CAP on climate change and Greenhouse Gas emissions.
Retrieved from: https://op.europa.eu/en/publication-detail/-/publication/29eee93e-9ed0-11e9-9d01-01aa75ed71a1/language-en/format-PDF
14
insurers have sufficient data, the insurance industry may not be willing or able to provide
insurance against these risks at an affordable price where risk become too high.86
The may
lead to mismatches between insurers’ premium and clients’ ability to pay.
Moreover, not acting upon risks urgently will lead to distributional consequences, because
regions will be affected differently based on their location, climate, population, legal system
and geography. There is a clear north-south divide in the regional distribution of welfare
losses, southern regions having aggregated welfare losses several times larger compared to
those in the north of Europe,87
and thus climate change may increase future intra-regional
disparities.88
Key economic sectors in regions will also be affected, such as tourism89
,
agriculture and low-carbon energy90
, which could further exacerbate existing inequalities.
Climate change can also heavily affect communities dependent on natural resources for
traditional practices. Assessments of the role of socio-economic status and age also show
higher exposures and vulnerabilities to climate health hazards, with concentrations in
Southern Europe, due to higher proportions of elderly, rural and low-income people, who are
particularly vulnerable.91
The varying effects of climate change on women and men and how climate impacts
internationally may amplify gender inequalities (e.g. social responsibilities, practices) have
also shown to be essential to any adaptation effort.92,93
P4: Climate impacts from outside the EU are not addressed
The EU strategic approach to adaptation and international developments need to be
better aligned. The European Green Deal reaffirms that the global challenges of climate
change and environmental degradation require a global response.94
While the EU has pursued
adaptation priorities internationally, particularly through its development cooperation
activities, the Evaluation identified only limited integration of international activities into the
broader climate change adaptation strategy. The current Strategy, nevertheless, does refer to
transboundary issues in its guidance on the development of NASs, as well as in the priorities
of the LIFE programme for adaptation flagship projects that address trans-regional issues.
At the same time, international policy developments such as the adoption of the Paris
Agreement, the adoption of the UN Sustainable Development Goals and many others
demonstrate that international climate change adaptation issues require further consideration
by the EU in the new Strategy. The international angle is not only relevant from a climate and
environmental policy perspective, but also to address foreign and security policy, e.g. effects
in Europe from global climate change impacts on international stability and security, or on
population displacement 95
. Moreover, the spillover effects matter from an economic
86 Surminski & Eldridge (2015). Flood insurance in England: an assessment of the current and newly proposed insurance scheme in the
context of rising flood risk. Journal of Flood Risk Management. 87 Feyen L.et al (2020). Climate change impacts and adaptation in Europe. JRC PESETA IV final report. 88 Kovats, R.S. et al (2014) Europe. In: Climate Change 2014: Impacts, Adaptation, and Vulnerability. Part B: Regional Aspects.
Contribution of Working Group II to the Fifth Assessment Report of the Intergovernmental Panel on Climate Change. Cambridge University
Press, Cambridge, United Kingdom and New York, NY, USA, pp. 1267-1326. 89 COACCH (2019). The Economic Cost of Climate Change in Europe: Synthesis Report on Interim Results. 90 IPCC (2018) Global Warming of 1.5°C. Special Report on the impacts of global warming of 1.5°C above pre-industrial levels and related
global greenhouse gas emission pathways. 91 Marí-Dell’Olmo, M., et al (2019) Social inequalities in the association between temperature and mortality in a South European context.
Int. Journal of Public Health. 92 Resurrección, B., et al. (2019) Gender-Transformative Climate Change Adaptation: Advancing Social Equity. Paper commissioned by the Global Commission on Adaptation (GCA) 93 European Insitute for Gender Equality (2020) Women and the environment: climate change is gendered. Available at:
https://eige.europa.eu/publications/beijing-25-policy-brief-area-k-women-and-environment 94 European Commission (2019) The European Green Deal, section 3 ‘The EU as a Global Leader’. 95 Council of the European Union (20 January 2020). Council Conclusions on Climate Diplomacy. Retrieved from:
15
perspective: global and EU supply chains (e.g. for EU agriculture and manufacturing) are
already being disrupted, and increasingly so96
.
The implications of such transboundary effects of climate impacts in 3rd
countries are
not yet integrated in the EU adaptation policy, even if climate impacts in developing
countries are already given considerable attention in the EU development policy. There is an
increasing need for the EU to conduct further research and review existing evidence to inform
guidance to Member States on how to tackle likely impacts from international spillover
effects97
. The EU, due to its geo-political, security, and trade ties with other countries, as well
as its proximity to countries that are likely to be less able to adapt to climate change, is highly
vulnerable to international spillover effects98
. Thus, thorough assessments of the EU's
exposure to international spillover effects, including of the EU's key global interdependencies
and their related climate risks, are necessary.
Furthermore, EU support to developing countries’ own adaptation efforts is in line with the
EU’s vision of global solidarity in facing climate change. In 2019, the EIB provided €3.2
billion in lending to support climate action. The European Commission provided €2.5 billion
in finance to developing countries in 2019. While the global public finance flows in
adaptation, with significant contribution from the EU and its Member States, is consistent and
substantial, it urgently needs to be scaled up. Examples include pledges to multilateral
climate funds (the Green Climate Fund and the Adaptation Fund); support channelled through
the GCCA+ targeted at Least Developed Countries and Small Island Developing States; and
the mobilisation of innovative financial instruments through the support to the preparation
and financing of bankable climate-relevant development projects. EU Member States
provided €4.8 billion in climate adaptation financing in 2019 and €6.7bn to cross cutting
projects addressing both mitigation and adaptation, totalling over half of total Member States’
Climate Finance.
Box 1: Stakeholder views on the main problems for the EU Adaptation strategy
Stakeholder views99
:
In all consultation work streams, stakeholders expressed an interest in the EU providing
consistent guidelines and indicators for monitoring and reporting on adaptation. For
interviewees and workshop participants representing national and local authorities, civil
society businesses and international organisations, the EU should play a key role in
facilitating knowledge sharing at all levels of governance, between countries and within
them. The lack of effective mechanisms to support mainstreaming of ecosystem-based
approaches was also mentioned multiple times by civil society representatives as well as
some national authorities, international organisations, EU institutions and businesses. These
stakeholders agreed that the EU should promote the development of standard
methodologies to quantify the costs and benefits of ecosystem-based approaches, in order
to help with the implementation of solutions. Other needs for guidance mentioned by
businesses, international organisations and other stakeholders include guidance on
adaptation planning, financing (investments), and monitoring. Overall, the role of the EU in
https://data.consilium.europa.eu/doc/document/ST-5033-2020-INIT/en/pdf 96 Ibid 97 COACCH (2018). The Economic Cost of Climate Change in Europe: Synthesis Report on State of Knowledge and Key Research Gaps.
Policy brief by the COACCH project. Editors: Paul Watkiss, Jenny Troeltzsch, Katriona McGlade. Published May , 2018. (pg. 56). 98 Benzie, M., T. Carter, F. Groundstroem H. Carlsen, G. Savvidou, N. Pirttioja, R. Taylor & A. Dzebo (2017). Implications for the EU of cross-border climate change impacts, EU FP7 IMPRESSIONS Project Deliverable D3A.2. 99 See Annex 2 for more details on the stakeholder consultation.
16
providing consistent guidance was reported by all stakeholder groups.
In the stakeholder workshops and targeted interviews, Member State “inertia” towards
adaptation was identified as a general barrier, particularly among international
organisations and civil society representatives, though it was also reported by some national
authorities, EU institutions and businesses representatives. As one representative of a
European Business Association mentioned: “the Member States tend to be barriers to
making progress on the issue themselves.” More specifically, workshop participants and
interviewees explained this inertia with the lack of formal (legal) commitments for
adaptation and clear political targets (especially in comparison to mitigation), the lack of
mechanisms and indicators to monitor and report implementation, and the lack of
alignment of standard practices. The lack of funding was also identified by several
stakeholders (representing business organisations, civil society, EU institutions, local
authorities, national authorities and international organisations) as a barrier to adaptation
in the EU, though it was highlighted that this is most likely not caused by a lack of
availability, but rather differing priorities and commitments.
What are the problem drivers?
The adaptation gap is already large, as identified in global and European assessment reports,
and getting larger. This is due to impacts being increasingly prevalent and because science is
pushing our understanding of impacts (e.g. on cascading impacts).
Multiple reports highlight the global state of unpreparedness (IPCC more broadly, but more
specifically the United Nations Environment Programme report series of Adaptation Gap
reports). Most worrying is the lack of preparation for possible tipping points in the climate
dynamics. At EU level, the European Environment Agency has continually highlighted this
issue in its adaptation reporting, most recently on urban adaptation. Continued construction
on floodplains, the increased covering of soil surfaces by concrete or asphalt, the small
amount of green spaces, and urban sprawl encroaching on wildfire and landslide prone areas
are making European cities much more vulnerable to climate change. The EEA’s latest report
(October 2020, quoted in the Impact Assessment) gives the latest state of play on European
climate change adaptation planning and action efforts at local level. While many local
authorities have realised the importance of becoming resilient to climate change, progress in
adaptation planning remains slow. Implementation of adaptation measures and the
monitoring of the success of these actions are even slower. Measures currently put in place
mostly focus on developing knowledge, awareness raising or policy developments.
Implementation of actual physical or transformative adaptation solutions is far behind —
such as developing more green spaces to reduce the impacts of heatwaves or adjusting
sewerage systems to cope with flash flooding.
D1: Accelerating pace of climate change impacts
With record high temperatures in 2020 globally and across much of Europe, and with a clear
message from climate models that temperatures will continue to increase, the urgency to
adapt seems undeniable.100,101
Although climate change mitigation may reduce, or even avoid,
100 Copernicus Climate Change Service (2020) 2019 was the second warmest year and the last five years were the warmest on record.
Retrieved from https://climate.copernicus.eu/copernicus-2019-was-second-warmest-year-and-last-five-years-were-warmest-record

17
some impacts of climate change in the EU102
, stopping all greenhouse gas emissions in the
EU would not stop the climate impacts that are already occurring, and which are projected to
continue to increase for decades (see Annex 9).
This reflects the message of the IPCC Special report that even in a best-case scenario of
sustained emission limitations, and global warming limited to 1.5°C, there will be severe (and
unequally distributed) stress on agri-food systems, infrastructure, ecosystems, natural capital
and human health.103,104
There are heavy economic, social, and environmental costs
associated with inaction. The PESETA IV study found that “exposing the present economy to
global warming of 3°C would result in an annual welfare loss of at least €175 billion” in
Europe105
. A recent Horizon 2020 COACCH project study estimated costs of inaction in
Europe in 2050 to be close to €200 billion per year in a 4°C pathway, and more than €100
billion per year in a 2°C pathway, and the COACCH study generally estimate higher costs
than PESETA as they also include socio-economic changes106
. Moreover, conditions for vital
ecosystems, which provide critical services for mitigation (e.g. carbon sinks) and adaptation
(e.g. protection against floods, desertification, water and air purification) are worsening. Box
2 summarises the climate impacts for the EU in a scenario without additional climate change
mitigation (warming of 3°C or more above pre-industrial temperature) and without additional
adaptation measures:
Box 2: Foresight to 2100 on projected climate impacts – cost of non-action in Europe
People:
An additional 15 million Europeans living in the proximity of woodland would be exposed to high-to
extreme fire danger for at least 10 days/year.
Each year nearly 300 million people would be exposed to deadly heatwaves, resulting in a 30-fold rise
in deaths from extreme heat (90,000 annual deaths compared to around 3,000 each year today).
Water resources availability would drop by up to 40% in southern regions of Europe and droughts
would happen more frequently in most of southern and western Europe.
Water scarcity and drought would increasingly affect agriculture, energy production and water supply
in regions that already suffer from water stress.
Planet:
The alpine tundra domain would contract by 84% and practically disappear in the Pyrenees. The
natural climatic tree line would shift vertically up by up to 8 m/year.
101 WMO (2020) WMO confirms 2019 as second hottest year on record. Retrieved from https://public.wmo.int/en/media/press-release/wmo-
confirms-2019-second-hottest-year-record 102 Feyen L., Ciscar J.C., Gosling S., Ibarreta D., Soria A. (editors) (2020). Climate change impacts and adaptation in Europe. JRC PESETA IV final report. EUR 30180EN, Publications Office of the European Union, Luxembourg, ISBN 97 103 IPCC, 2018: Global Warming of 1.5°C. Special Report on the impacts of global warming of 1.5°C above pre-industrial levels and related
global greenhouse gas emission pathways. Retrieved from: https://www.ipcc.ch/sr15/ 104 IPBES (2019): Summary for policymakers of the global assessment report on biodiversity and ecosystem services of the
Intergovernmental Science-Policy Platform on Biodiversity and Ecosystem Services. S. Díaz, J. Settele, E. S. Brondízio E.S., H. T. Ngo, M.
Guèze, J. Agard, A. Arneth, P. Balvanera, K. A. Brauman, S. H. M. Butchart, K. M. A. Chan, L. A. Garibaldi, K. Ichii, J. Liu, S. M. Subramanian, G. F. Midgley, P. Miloslavich, Z. Molnár, D. Obura, A. Pfaff, S. Polasky, A. Purvis, J. Razzaque, B. Reyers, R. Roy
Chowdhury, Y. J. Shin, I. J. Visseren-Hamakers, K. J. Willis, and C. N. Zayas (eds.). IPBES secretariat, Bonn, Germany. 105 Feyen L., Ciscar J.C., Gosling S., Ibarreta D., Soria A. (editors) (2020). Climate change impacts and adaptation in Europe. JRC PESETA IV final report. EUR 30180EN, Publications Office of the European Union, Luxembourg, ISBN 978-92-76-18123-1, doi:10.2760/171121,
JRC119178. 106 Horizon 2020 project COACCH (2018). The Economic Cost of Climate Change in Europe: Synthesis Report on State of Knowledge and Key Research Gaps. Policy brief by the COACCH project. Editors: Paul Watkiss, Jenny Troeltzsch, Katriona McGlade. Published May ,
2018. (pg. 56).

18
Ecological domains would shift northwards, resulting in severe changes of the current ecosystems in
Europe (e.g. Alpine, Boreal), and the development of Tropical ones.
Wildfire and pest outbreaks in forests would become more frequent and severe, increasing biomass
loss and carbon release.
Prosperity:
In the absence of international market adjustments, with current crops and practices, yields would
decline by more than 10% in southern Europe.
Total drought losses would increase to nearly 45 €billion/year with 3°C warming in 2100 compared to
9 €billion/year at present.
Almost half a million people would be exposed to river flooding each year, or nearly three times the
number at present, and river flood losses would rise 6-fold in magnitude, reaching nearly 50
€billion/year with 3°C in 2100.
Coastal flood losses would grow by two orders of magnitude and climb to 250 €billion/year in 2100,
while 2.2 million people would be exposed per year to coastal inundation compared to 100,000 at
present
If 3°C global warming occurred in today’s economy, annual welfare loss could represent
approximately 0.5% of EU GDP, when considering only a limited set of climate impacts (river and
coastal flooding, agriculture, droughts, energy supply, and windstorms). Furthermore, mortality from
temperature extremes would also cause significant additional economic losses in the range of EUR 122
billion.
Source: JRC PESETA IV final report (2020)
D2: Knowledge gaps on climate change adaptation
Uncertainty about climate change pathways is itself a barrier to adaptation action.107
If
we can better understand climate change impacts, and make that information widely
available, people will take wise decisions and adapt. would need to mobilise additional
support for e.g. the development of better economic models for the impacts of climate
change, sectoral interlinkages, and their (economic and non-economic) cost, a deeper
understanding of health and environmental impacts, including on ecosystem services, and
foster innovative uses of climate data. There remain large knowledge gaps that would still
need to be bridged, such as on economic losses from climate change, cascading effects from
simultaneous or sequential climate impacts, spill-over effects from outside Europe on the EU,
or tipping points beyond which the human and natural ecosystems would not recover.
Moreover, the diverse information sources on climate impacts in Europe (e.g. European
Forest Fires Information System, European Drought Observatory) and internationally need to
be better federated to increase visibility and coverage, and to ensure compatibility of
information.
There is increasing demand for translating the existing wealth of climate data and information
into customised tools and products i.e. solutions. These tools are part of the backbone of the
transition to a climate-resilient and low-carbon society, as they are needed to help decision-
makers take informed decisions to boost resilience and adaptation capacity of their
communities. More actions are needed to scale up local adaptation solutions through national
and EU funding for regional development and innovation.
107 Aguiar, F. C., et al. (2018) Adaptation to climate change at local level in Europe: an overview. Environmental Science & Policy 86: 38-
63.
19
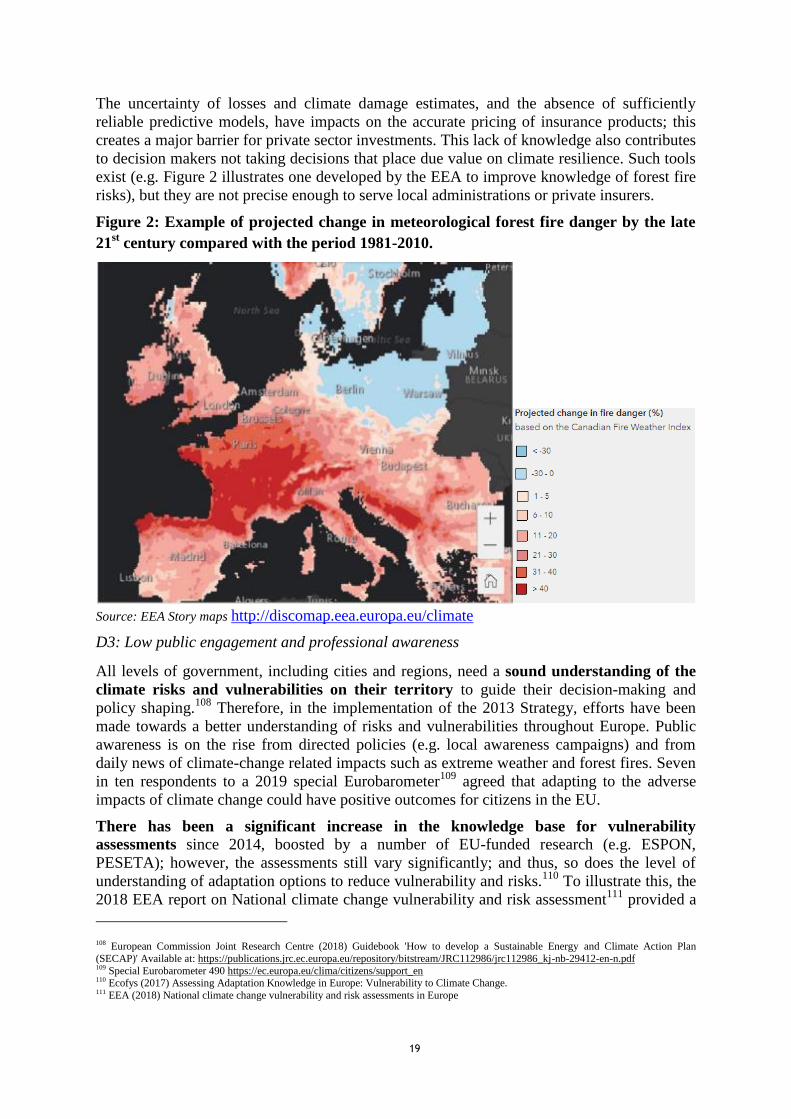
The uncertainty of losses and climate damage estimates, and the absence of sufficiently
reliable predictive models, have impacts on the accurate pricing of insurance products; this
creates a major barrier for private sector investments. This lack of knowledge also contributes
to decision makers not taking decisions that place due value on climate resilience. Such tools
exist (e.g. Figure 2 illustrates one developed by the EEA to improve knowledge of forest fire
risks), but they are not precise enough to serve local administrations or private insurers.
Figure 2: Example of projected change in meteorological forest fire danger by the late
21st century compared with the period 1981-2010.
Source: EEA Story maps http://discomap.eea.europa.eu/climate
D3: Low public engagement and professional awareness
All levels of government, including cities and regions, need a sound understanding of the
climate risks and vulnerabilities on their territory to guide their decision-making and
policy shaping.108
Therefore, in the implementation of the 2013 Strategy, efforts have been
made towards a better understanding of risks and vulnerabilities throughout Europe. Public
awareness is on the rise from directed policies (e.g. local awareness campaigns) and from
daily news of climate-change related impacts such as extreme weather and forest fires. Seven
in ten respondents to a 2019 special Eurobarometer109
agreed that adapting to the adverse
impacts of climate change could have positive outcomes for citizens in the EU.
There has been a significant increase in the knowledge base for vulnerability
assessments since 2014, boosted by a number of EU-funded research (e.g. ESPON,
PESETA); however, the assessments still vary significantly; and thus, so does the level of
understanding of adaptation options to reduce vulnerability and risks.110
To illustrate this, the
2018 EEA report on National climate change vulnerability and risk assessment111
provided a
108 European Commission Joint Research Centre (2018) Guidebook 'How to develop a Sustainable Energy and Climate Action Plan
(SECAP)' Available at: https://publications.jrc.ec.europa.eu/repository/bitstream/JRC112986/jrc112986_kj-nb-29412-en-n.pdf 109 Special Eurobarometer 490 https://ec.europa.eu/clima/citizens/support_en 110 Ecofys (2017) Assessing Adaptation Knowledge in Europe: Vulnerability to Climate Change. 111 EEA (2018) National climate change vulnerability and risk assessments in Europe
20
review of national climate change impact, vulnerability, and risk assessments (CCIV) across
Europe. The evaluation showed that almost all EEA member countries have conducted at
least one national CCIV, which was then used as a key information source for the
development of national adaptation policies. The analysis, however, also noted challenges
related to gaps in data, integration of quantitative and qualitative information, and cross-
sector comparisons.
The European Green Deal mentions that involvement and commitment of the public and
of all stakeholders is crucial to its success. For adaptation in particular, the distribution of
roles and responsibilities between the European institutions, the Member States’
governments, regional and local authorities, citizens and the private sector remains unclear.
This is partly due to the cross-sectoral nature of adaptation.
Moreover, there are different approaches to stakeholder engagement in EU countries
and different approaches to stakeholder engagement throughout the policy cycle: in the
process of setting climate change adaptation goals, some countries engage stakeholders via
consultation processes, whereas others provide on the ground technical adaptation support.112
To differing extents in different countries, involving stakeholders in the process of
developing adaptation strategies has increased awareness and acceptance, which ultimately
helps successful implementation of a strategy. This is also closely related to the need for a
multi-disciplinary understanding of climate change adaptation, which is recognised by local
authorities and stakeholders as a way to avoid maladaptation. This often means fixing one
single problem that creates bigger ones elsewhere e.g. the over-reliance on irrigation to
continue growing crops no longer suited for the new local climate thereby exacerbating water
shortages for other users. Likewise, some economic practices are no longer suitable under
changing climate change conditions, like the exploitation of monoculture plantations of trees
prone to fire (e.g. eucalyptus in Portugal or Spain). Despite these examples, the use of cross-
sectoral approaches remains limited113
.
D4: Insufficient priority given to adaptation in some Member States and regions
Adapting to climate change is first about building resilience and anticipating the
impacts, and ultimately reacting and managing impacts if/once they arrive. The Paris
Agreement calls for a balance between adaptation and mitigation114
; however, in the EU
adaptation investment tends to have a lower priority than mitigation.115
At the local level,
cities have mostly dealt with mitigation and adaptation as two separate strategies. Local
authorities that participate in networks are more likely to have started the adaptation process;
being a member of multiple networks is associated with higher levels of adaptation planning,
sharing of best practices, and receiving support in developing their Strategy.116
Policy tends to give greater priority to climate change mitigation117
, but this behaviour is
also more widespread for the private and public sector, and citizens, constituting a significant
obstacle to adaptation.118
On the side of the private sector, we see that financial markets for
adaptation are less developed than for mitigation. This preference might be motivated by
112 Committee of the Regions (2016) Regional and Local Adaptation in the EU since the Adoption of the EU Adaptation Strategy in 2013 113 https://www.eea.europa.eu/publications/national-adaptation-policy-processes 114 UNFCCC (2015). Paris Agreement. Article 9, paragraph 4. 115 FEPS and IEEP (Forthcoming). A Green Deal for All. Achieving sustainable equity between the people, regions, countries and generations of Europe, Foundation for European Progressive Studies and Institute for European Environmental Policy, Brussels, Belgium 116 Heidrich, Oliver, et al (2016) National climate policies across Europe and their impacts on cities strategies. Journal of environmental
management 168 (2016): 36-45. 117 Ibid 118 Adger, W. Neil, et al. (2013) Cultural dimensions of climate change impacts and adaptation. Nature climate change 3.2 : 112-117.

21
other perceived benefits of climate change mitigation measures. These include economic
savings and improved energy security119
; or by a belief that mitigation action is a common
good better suited to public policy, while the benefits of climate change adaptation are largely
related to private goods (e.g. climate proofing supply chains, flood protection for private
residences), or that in some sectors a clear-cut separation between adaptation and mitigation
is not evident.120
In addition, the actual impact of adaptation measures is more difficult to
measure than the effect of mitigation (i.e. GHG emissions reduction). Adaptation actions are
most successful when there are no damages, and therefore less visible and attributable.
Choosing between adaptation and mitigation is, however, a false choice—we must do
both.121
Sustained emission limitations will decrease the medium-to-long term severity of
climate impacts. An integrated approach of both mitigation and adaptation action, is therefore
warranted. Moreover, adaptation requires as much attention as mitigation because even the
most successful mitigation action (i.e. achieving globally a limited temperature increase of
just 1.5°C) still comes with severe impacts to which we must adapt. One example of
synergies between adaptation and mitigation is the implementation of Nature-based Solutions
(NbS) – these can contribute to climate change mitigation through both storing and
sequestering carbon and reducing energy demand (e.g. by improving thermal comfort in
cities) and increasing water retention thus reducing the risk of flooding and recharging
groundwater(see Annex 9), amongst other adaptation benefits.122
In addition, prevention of
climate related disasters, and reduction of their impacts as far as possible is more cost
effective than dealing with the unmitigated consequence, for instance in terms of emergency
response.
D5: Slow adoption and implementation of local adaptation strategies
The Evaluation found that progress on local adaptation strategies has been slower than
envisaged in 2013.123
This is evident in the relatively low number of cities working on
adaptation compared to those committed to mitigation, for example based on the actions
submitted to the Covenant of Mayors as of 2020, only 2% (almost 4,000 out of 175,120) are
adaptation focused, the remaining being related to climate change mitigation.124
Reasons for
this slow up take include, among others, the lack of human and financial resources, especially
in Southern Europe, whereas, in Northern Europe, uncertainty on climate change scenarios is
seen as an important barrier. 125
For Eastern Europe, both the limited capacity in policy,
practitioners and research communities and lack of political commitment were noteworthy.
Research has shown that how societies respond and adapt to climate change is influenced by
culture, historical memory and identity126
, each of which can either improve awareness and
sense of urgency for specific climate-related risks, or shift attention away from others.127
119 Reckien, D. et al. (2018). How are cities planning to respond to climate change? Assessment of local climate plans from 885 cities in the EU-28. Journal of Cleaner Production. 191. 207-219. 10.1016/j.jclepro.2018.03.220. 120 Schneider, T. 2014. Responsibility for private sector adaptation to climate change. Ecology and Society 19(2): 8. http://dx.doi.
org/10.5751/ES-06282-190208 121 Global Commission on Adaptation (2019). Adapt now: A Global Call for Leadership on Climate Resilience. Retrieved from:
https://reliefweb.int/sites/reliefweb.int/files/resources/GlobalCommission_Report_FINAL.pdf 122 European Commission (forthcoming) Nature-based solutions- State of the art in the EU-Funded projects. 123 European Commission (2018) Evaluation of the EU Strategy on adaptation to climate change, Report from the Commission to the
European Parliament and the Council. 124Covenant of Mayors for Climate & Energy. Covenant in Figures. Retrieved 17.06.2020. https://www.covenantofmayors.eu/about/covenant-initiative/covenant-in-figures.html 125 Aguiar, F. C., et al. (2018) Adaptation to climate change at local level in Europe: an overview. Environmental Science & Policy 86: 38-
63. 126 Marschütz, B. et al. (2020). Local narratives of change as an entry point for building urban climate resilience. Climate Risk Management,
100223.
22
D6: Insufficient public and private sector adaptation investment
Financial support for adaptation is not sufficient for the challenges we are facing. Based
on estimates of the investment needed to meet adaptation needs, it can be assumed that there
is a sizeable unmet finance need for climate resilient investments in Europe128,129
. Competing
policy and spending priorities, such as currently the COVID-19 response, and the unevenly
distributed impacts of climate change and means to adjust across Member States, place a
burden on the role of policy interventions and public finance to bridge the adaptation-finance
gap.130131
Investments being mobilised for the COVID-19 recovery through the Next
Generation EU Fund and a reinforced long-term budget for the European Union provide an
opportunity for investments in adaptation and resilience to be upgraded.132
Moreover, the
further strengthening in the next MFF of the EU's social dimension and European Social
Fund (ESF+)133
may give more support to the protection of the most vulnerable. Within the
EU, the aim from the 2014-2020 MFF that at least 20% of European budget expenditure is
climate-related, has been increased to 30% in the 2021-2027 MFF adopted in December
2020134
.
The European Green Deal emphasises the role of private investment alongside public
investment, and reaffirms the importance of access to data and the development of
instruments for investors, insurers and business to integrate climate change into their risk
analyses.135
Moreover, the Paris Agreement (Article 2.1(c)) establishes the core objective of
"making finance flows consistent with a pathway towards low GHG emissions and climate-
resilient development". In order to meet international climate goals, there is a collective
challenge to "shift the trillions" in capital to help drive the transition to a zero carbon,
climate-resilient economy. Public sources of finance will not be able to meet this demand on
their own.136
More and more Europeans are finding that solidarity is needed in the face of
unpredictable disasters (both distinct and slow-onset), and governments are more suited for
this than markets. Public funds continue to play the major role in prevention and resilience;
however, private capital is required to mainstream resilience in private investment, including
through climate proofing, and through risk pooling via private insurance.
Several general barriers exist for private sector financing of adaptation projects. 137
Firstly, adaptation does not typically generate a revenue stream and is therefore less attractive
for private finance. Secondly, adaptation includes a range of wider benefits to society (in
127 Ibid 128 Bottom-up Climate Adaptation Strategies Towards a Sustainable Europe (BASE) (2016) EU-wide economic evaluation of adaptation to
climate change. Retrieved from: https://base-adaptation.eu/sites/default/files/D.6.3_1.pdf 129 De Bruin, K. C., Dellink, R. B., & Agrawala, S. (2009). Economic aspects of adaptation to climate change: integrated assessment
modelling of adaptation costs and benefits. (OECD environment working papers; No. no. 6). Paris:
OECD. https://doi.org/10.1787/225282538105 130 No estimations of the investment needs for adaptation exist that reflect the total, comprehensive (across all adaptation-relevant action
areas and sectors) investment needs for Europe. A large range exists between the two main studies that are believed to best capture the
adaptation investment needs in the EU , varying from €35 billion up to more than €500 billion 131 De Bruin, K. C., Dellink, R. B., & Agrawala, S. (2009). Economic aspects of adaptation to climate change: integrated assessment
modelling of adaptation costs and benefits. (OECD environment working papers; No. no. 6). Paris:
OECD. https://doi.org/10.1787/225282538105 132 European Commission (2020). Financing the Recovery Plan for Europe. Retrieved
from:https://ec.europa.eu/info/sites/info/files/factsheet_3_04.06.pdf 133 European Commission (2020). A new, stronger European Social Fund Plus. Retrieved from: https://ec.europa.eu/esf/main.jsp?catId=62&langId=en 134 European Council press release, ‘’Long-term EU budget 2021-2027 and recovery package’’, 17 December 2020 -
https://www.consilium.europa.eu/en/press/press-releases/2020/12/17/multiannual-financial-framework-for-2021-2027-adopted/. 135 Commission Work Programme 2020 (COM (2020)37 final). 136 Climate Policy Initiative (2019). Measuring the Private Capital Response to Climate Change: a proposed dashboard. Retrieved from:
https://climatepolicyinitiative.org/publication/measuring-the-private-capital-response-to-climate-change-a-proposed-dashboard/ 137 United Nations Environment Programme (UNEP) Finance Initiative (2016). Demystifying adaptation finance for the private sector.
Nairobi: UNEP.
23
addition to the direct, private benefits of avoided damages, such as the recreational values for
restored floodplains meant to protect private farms, biodiversity gains from green roofs meant
to cool individual buildings etc.) that are not necessarily captured by the private financial
return on investments (public good problem). Thirdly, many financial markets are
characterised by a shortage of the longer-term credit that is necessary for long-term
adaptation investments. Finally, reliable information on climate impacts on the economy is
often unavailable or unequally distributed among different actors, who are often unaware.
This disempowers actors from making informed decisions and investing accordingly.
D7: Lack of customised and cost-effective adaptation solutions
The 2018 evaluation concluded that there is a need to climate-proof investments supported by
research and innovation. This need is reaffirmed by the Mission on “Adaptation to Climate
Change, including Societal Transformation”; this is proposed under Horizon Europe, and
employs innovation as a way to catalyse systemic change.138
The proposed Mission would
test integrated solutions to address the complex, multi-faceted nature of the transformation
needed.
Moreover, recent research139
shows the importance of a focus on innovation. The share of
climate change adaptation inventions in 2015 was roughly the same as in 1995, and this
stagnation stands in sharp contrast to the trend for climate change mitigation technologies,
whose share in total innovation (including non-climate-related) nearly doubled during the
same period. Moreover, few adaptation inventions are transferred across borders, and there is
virtually no transfer of patented knowledge to low-income countries.
In particular, effective mechanisms to support mainstreaming of NbS are missing. Despite the
fact that NbS have proved to be cost-efficient policy approaches to address climate change
adaptation, they are yet not used on a large enough scale.140
Reasons for this relatively low
uptake are multiple (e.g. cultural perceptions, knowledge and awareness gaps, lack of
guidance), and have driven to, among others, unevenness of climate change adaptation action
across Member States. In addition to this, even though interest in the NbS concept is
increasing in different areas, it has mainly been applied in the agriculture and forestry sectors,
for which NbS are at the same time also contributing to mitigation. Experts continue to
advocate for supporting legislation that enables its systematic mainstreaming into urban
planning, i.e., incorporating its principles (e.g. multi-benefit, sustainability) into relevant
policies and planning tools across sectors.141
Finally, the lack of accurate models, data and knowledge on damages and losses means that
climate impacts are not being priced in private decision making, particularly by SMEs as they
often lack the capacity to do so. Currently, climate-related events such as drought, hail, and
extreme heat are often not insurable. The insurance policies that are available cannot
adequately cover the increasing risks SMEs face. This affects the availability of cost-effective
solutions and skills.
138 DG Research and Innovation (September 2020). Proposed Mission: A Climate Resilient Europe. Retrieved from:
https://ec.europa.eu/info/publications/climate-resilient-europe_en 139 Dechezlepretre,Antoine; Fankhauser,Sam; Glachant,Matthieu Michel Marcel; Stoever,Jana; Touboul,Simon.2020. Invention and Global
Diffusion of Technologies for Climate Change Adaptation: A Patent Analysis (English). Washington, D.C.: World Bank
Group.https://documents.worldbank.org/en/publication/documents-reports/documentdetail/648341591630145546/invention-and-global-diffusion-of-technologies-for-climate-change-adaptation-a-patent-analysis 140 European Commission (2019). Review of Progress on the Implementation of the EU Green Infrastructure Strategy. SWD (2019) 184
final. Retrieved from: https://eur-lex.europa.eu/legal-content/EN/TXT/PDF/?uri=CELEX:52019DC0236&qid=1562053537296 141 Pauleit, S. et. al (2017). Nature-based solutions and climate change–four shades of green. In Nature-Based Solutions to Climate Change
Adaptation in Urban Areas (pp. 29-49). Springer, Cham.

24
D8: International policy developments
Several important international agreements were adopted after the 2013 Strategy, including
the Paris Agreement, the UN Sustainable Development Goals (in particular SDG 13 on
climate action, SDG 11 on sustainable and resilient cities, but also others)142
, the Sendai
Framework for Disaster Risk Reduction 2015-2030 and the EU Sendai Action plan143
. These
developments in international policy increased the need to harmonise and closely integrate
the EU strategy with international climate change adaptation issues.
D9: Climate impacts increasingly generate spillover effects across the globe
The 2013 Strategy does not sufficiently recognise and address the EU's vulnerabilities to
international spillover effects from climate change impacts outside Europe144
. Globally,
climate change has the potential to affect trade, food security, stability and security, and
biodiversity. In terms of trade, risks extend along supply chains. What occurs outside Europe
due to a changing climate will affect the production and transport of raw materials and
intermediate goods145
. In fact, indirect impact of effects of climate change internationally
could be as large as the direct impacts within Europe. Imports from non-EU regions could
decline by 2% by 2050, while exports to non-EU regions could also decline by up to 0.3%146
.
An EEA 2016 report147
details Europe's vulnerabilities from international spillover effects
related to food production and supply, including economic effects through climate-induced
price volatilities, and disruptions to transport networks and changes to shipping routes. The
COACCH project found that the EU - due to the single market and stronger export
orientation – receives more supply chains shocks from abroad than the USA. The effects are
largest for manufacturing and agriculture148
.
Box 3: Stakeholder views on problems drivers hindering the new EU Adaptation
Strategy
Stakeholder views149
:
Impacts: Most of the respondents to the open public consultation (OPC) considered that the
growing speed of climate impacts is a “very important” driver for the new EU Adaptation
Strategy (75.5%).150
An important difference between OPC respondents’ reports of most-
experienced events and those of contributors to other consultation activities was their
appreciation of water-related events. While OPC respondents seem to have experienced
these climate-related events less than other events, the majority of workshop participants and
interviewees from all stakeholder groups (including civil society, national authorities, EU
institutions and international organisations) referred to coastal erosion, flooding, saltwater
142 https://sustainabledevelopment.un.org/ 143 Commission Staff Working Document: Action Plan on the Sendai Framework for Disaster Risk Reduction 2015-2030, SWD (2016) 205 final/2. 144 Commission Staff Working Document (2018) Evaluation of the EU Strategy on adaptation to climate change Accompanying the
document Report From The Commission To The European Parliament And The Council on the implementation of the EU Strategy on adaptation to climate change SWD/2018/461 final 145 Lühr, Oliver, Dr Jan-Philipp Kramer, Jannis Lambert, Christian Kind, and Jonas Savelsberg. 2014. ‘Analyse spezifischer Risiken des
Klimawandels und Erarbeitung von Handlungsempfehlungen für exponierte industrielle Produktion in Deutschland (KLIMACHECK)’. Studie im Auftrag des Bundesministeriums für Wirtschaft und Energie Bearbeitungsnr.: I C 4 –02 08 15 – 30/12. Berlin: Prognos / adelphi. 146 COACCH (2018). The Economic Cost of Climate Change in Europe: Synthesis Report on State of Knowledge and Key Research Gaps.
Policy brief by the COACCH project. Editors: Paul Watkiss, Jenny Troeltzsch, Katriona McGlade. Published May , 2018. 147 'Climate change, impacts and vulnerability in Europe 2016, Report No 1/2017', European Environment Agency, 2017: Chapter 6.4 148 COACCH (2019). The Economic Cost of Climate Change in Europe: Synthesis Report on Interim Results. I_O Analysis by Stefan
Borsky, Martin Jury. Policy brief by the COACCH project. Editors: Paul Watkiss, Jenny Troeltzsch, Katriona McGlade, Michelle Watkiss. 149 See Annex 2 for more details on the stakeholder consultation. 150 See Figure 3-11 in Appendix 1.A accompanying the consultation synopsis presenting the analysis of the OPC.
25
intrusion and lack of water availability as some of the most important slow-onset changes
caused by climate change in Europe. This was due to the substantial proportion of the EU
population which is coastal (including in the outermost regions), and the importance of
water availability for agriculture. River flooding was mentioned by workshop participants
representing national authorities and interviewees representing civil society organisations as
another important security concern for the large share of the population living close to
rivers. They also highlighted strong differences in vulnerabilities across Europe. Southern
Europe and Mediterranean regions were reported as the most vulnerable regions by the
majority of respondents across all stakeholder groups, though Central and Eastern Europe
were considered increasingly vulnerable.
Problem drivers: OPC respondents identified the following factors as important for the
design of the new Strategy: a lack of interest in climate impacts in some Member States or
regions (57.7%); insufficient public finance for adaptation to climate change (55.2%);
insufficient public awareness of the need to adapt to climate change (51.4%); and low
private sector investment and action on adaptation (44.4%). In both the OPC, stakeholder
workshops and interviews, the lack of knowledge and awareness was reported as key
problem driver by all stakeholder groups. According to them, at the policy-making level, the
lack of knowledge and awareness on climate change adaptation most likely stems from a
lack of access to available and usable knowledge and data. Stakeholders from EU
institutions, government authorities and international organisations have highlighted the
difference between access and usability of data as a problem driver as opposed to lack of
data, pointing that sufficient data currently exists. In the stakeholder workshops, several
participants across various stakeholder groups agreed on the lack of awareness at the
citizens’ level, which manifests itself as a lack of information on the cost of inaction and
unpreparedness and prevents a necessary behavioural change.
3. WHY SHOULD THE EU ACT?
Legal basis
The various legal bases for the Adaptation Strategy are addressed in the 2013 EU Adaptation
Strategy and include at the highest level the Treaty on the Functioning of the European Union
(TFEU Articles 191 and 192(1)). The Commission proposal for a European Climate Law
Regulation also contains provisions on adaptation to climate change. Furthermore, the Paris
Agreement constitutes an additional international legal basis on which the Union can anchor
its efforts in climate change adaptation. A full overview of the legal base is in Annex 8.
Subsidiarity: Necessity and Added Value of EU action
According to the principle of subsidiarity, the new EU Adaptation Strategy must be
necessary, and bring added value in comparison to individual actions from the Member States
alone. The EU was an early actor on adaptation, and the European Commission was
recognised by the Global Commission on Adaptation151
, as a pioneer in integrating
considerations of climate risk into decision-making. An ambitious and more proactive EU-
level intervention is warranted.
The consultation undertaken as part of the 2018 Evaluation indicated that, although
governments at different levels would have independently worked on adaptation, progress
151 https://gca.org/global-commission-on-adaptation/report
26
would have been much less significant in the absence of the EU Strategy. Moreover, the
current Strategy brings EU added value by, e.g. encouraging the identification and bridging
of knowledge gaps in research, supporting regional cooperation, and by integrating
adaptation in its own policies. The EEA has demonstrated the added value of adaptation
action at EU level with the example of Climate-ADAPT152
.
As much as individual cities and regions must take action to become more resilient to global
warming, the Union as a whole must take steps to prepare itself better. For optimal adaptation
in the Union, all levels of government have to contribute, including EU, national, regional
and local. Moreover, there is increasing clarity that civil society and individuals have an
important role to play, and EU level action can help empower them in their actions (e.g.
through the Climate Pact). EU action also can significantly enhance local and regional
adaptation action, for instance through geospatial information and modelling (e.g. the EU
Copernicus programme) or EU and international exchanges of best practices, e.g. via the
European and Global Covenants of Mayors.
Even if adaptation challenges are often local and specific (a strong argument for local-level
adaptation policy), solutions are just as often widely applicable on a regional, national or
transnational scale. Moreover, there are also EU-specific impacts (e.g. threats to the Single
Market, effects on EU budget, on trade deals, additional pressure on migratory flows, the
spread of infectious diseases and plant pests) or regions with specific vulnerabilities (e.g.
EU’s nine outermost regions in the Atlantic and Indian Oceans as well as Mediterranean
countries).
The compatibility and added value of the EU Adaptation strategy with the principle of
subsidiarity are underpinned by:
Shared vulnerable assets: The Strategy addresses areas of shared competence,
including challenges that pertain to transnational governance such as the management
of water catchments, civil protection, biodiversity, and marine and terrestrial
ecosystems-based services (COM (2020)/2509310).
Transboundary impacts: Climate change impacts occur irrespective of administrative
boundaries. There is a strong cross-border dimension of many climate change impacts
(EU macro-regions sharing common climate risks, e.g. seas and river basins and
Alpine mountainous areas). Lack of preparedness in one Member States may have
negative consequences for the other Member States. The Covid-19 outbreak, which
started in a region to later escalate into a global crisis, illustrates the economic and
social interconnectedness between countries, demonstrating the benefits of
coordinated action at EU level.
Shared solutions: The EU can identify and promote transboundary solutions through
its existing instruments, actions and policies in transnational sectors and regions153
at
risk, such as the CAP, the Biodiversity Strategy etc. It can also identify regional
knowledge gaps, harmonise tools and facilitate science-policy interactions to foster
mutual learning across the Member States and systematise information for decision-
makers.
Finally, solidarity and convergence across and within the Member States and ensuring a just
transition (as well as a just resilience to climate change), have a key role to play for
152 https://www.eea.europa.eu/publications/sharing-adaptation-information-across-europe 153 https://www.eea.europa.eu/themes/climate-change-adaptation/adaptation-policies/adaptation-policies-in-transnational-regions
27
adaptation as highlighted in the European Green Deal and the Commission proposal for a
European Climate Law.154
4. OBJECTIVES: WHAT IS TO BE ACHIEVED?
General objective
Adaptation is about understanding, planning and acting to prevent the impacts in the
first place, minimise their effects, and address their consequences. Against all the gloom
of climate impacts and the inevitability of certain shocks, the benefits of adaptation actions
extend beyond the avoided human, natural and material losses. They have many positive and
significant socio-economic effects, with high cost-benefit ratios:
environmental and social benefits accompany many adaptation actions (e.g. nature-
based solutions for flooding that also clean the air and waters and restore habitats to
support biodiversity);
reducing climate impacts on vulnerable groups and countries enhances social
cohesion;
adaptation actions targeting better management of natural resources can reduce
tensions between communities and support conflict prevention efforts;
effective adaptation helps secure EU strategic autonomy (as it provides the stability
required to progress on emission reductions, security, migration, sustainability);
enhanced financial and budgetary stability, and economic growth (as it reduces
vulnerability to climate-related macroeconomic shocks and pay-outs after disasters);
avert, minimise and address population displacement associated with the adverse
effects of climate change;
competitiveness in the growing global adaptation industry (a market worth ~EUR 280
billion in 2016, growing at ~6% per year);
increased resilience and sustainability in EU firms’ operations and supply chains;
a sense of empowerment to citizens, by demonstrating that preventing and managing
climate impacts can be achieved, and that they can be engaged in it.
In order to tackle the problems identified in Section 2, it is important to clarify the objectives
of EU action in the field of climate change adaptation. Therefore, this section presents the
overarching objective of the new EU Adaptation Strategy: “By 2050, the Union will be a
climate-resilient society, fully adapted to the unavoidable impacts of climate change, with
reinforced adaptive capacity and minimal vulnerability, and that contributes to achieving the
Paris Agreement global goal on adaptation.”
This objective builds on the 2013 Strategy’s objective, which is “to contribute to a more
climate-resilient Europe” by enhancing the preparedness and capacity to respond to the
impacts of climate change at the local, regional, national and EU levels, developing a
coherent approach and improving coordination. 155
It is fully aligned with the Commission
154 Proposal for a REGULATION OF THE EUROPEAN PARLIAMENT AND OF THE COUNCIL establishing the framework for
achieving climate neutrality and amending Regulation (EU) 2018/1999 (European Climate Law) COM/2020/80 final 155 European Commission (2013) An EU Strategy on adaptation to climate change, Communication from the Commission to the European Parliament, the Council, the European Economic and Social Committee and the Committee of the Regions COM/2013/0216 final, available
at - https://eur-lex.europa.eu/legal-content/EN/TXT/?uri=CELEX:52013DC0216

28
proposal for a Climate Law, which sets Europe on a path towards the global adaptation goal
(Article 7 of the Paris Agreement) 156
. The current objective is more ambitious than the 2013
objective, as it sets out a vision for Europe towards 2050 to become a climate-resilient society
and goes beyond a contribution to resilience. Moreover, it includes a strengthened
international dimension, as per the problem definition. The specific objectives also
incorporate a novel, mainstreamed citizen-dimension, similarly identified in, and supported
by, the stakeholder consultation.
Specific objectives
In order to achieve this general objective, four specific objectives are identified which
correspond to each of the problems discussed in section 2.1. The relationship between the
objectives and problems is presented in Figure 3. Objectives 1 to 3 aim to help actors at all
levels to improve their knowledge of climate impacts, reinforce planning and climate risk
management and to accelerate adaptation action. Objective 4 targets an increase in the
EU’s contribution to global climate resilience.
Figure 3: Objective tree for EU Adaptation Strategy
Objective 1 (O1) - Improve knowledge of climate impacts and development of solutions:
The new Strategy will aim to increase awareness, education and access to knowledge and fit-
for purpose data on individual and collective climate risks, it will seek to develop innovative
solutions, and the dissemination of good practice to improve decision making.
O1 addresses the need for investment in frameworks, models and tools to support
decision making within uncertainty. Efforts to do so are reflected in the ongoing study of
the European Commission (DG CLIMA) on adaptation modelling. 157
Adaptation modelling
aims ultimately to act as a tool to guide innovation of adaptation solutions within the new
Strategy.
The objective aims to step up ambition on improving knowledge and to invest in an (updated)
EU risk and vulnerability assessment, including in the outermost regions. This action is
in line with the 2018 Evaluation, which concludes that the knowledge gaps remain. The
objective also increases ambition through the establishment of valuation methodologies for
climate change adaptation benefits and effectiveness of measures, with a focus on NbS.
156 Proposal for a European Climate Law COM/2020/80 final Explanatory Memorandum: “The proposal aims to complement the existing policy framework by setting the long-term direction of travel and enshrining the 2050 climate-neutrality objective in EU law, enhancing
adaptation efforts, establishing a process to set out and review a trajectory until 2050, regular assessment and a process in case of
insufficient progress or inconsistencies.” 157European Commission DG Climate Action A.3. (2020). Study on Climate Modelling. Task 2 Comprehensive Desk Review: Climate
Adaptation Models and Tools. Final draft report.
29
The objective increases the focus on newly identified knowledge gaps related to
interdependencies, synergies with other relevant goals (e.g. biodiversity, mitigation). It will
also focus on research and innovation-inspired activities to help deliver large-scale
solutions for climate change adaptation as foreseen under the Mission on “Adaptation to
Climate Change, including Societal Transformation” (and similarly in the Soil, Starfish
2030, and Climate-Neutral and Smart Cities missions), which is part of the upcoming EU
Research and Innovation Framework Programme, Horizon Europe (2021-2027).158
The
Strategy will guide research under Horizon Europe (including in relevant Partnerships) with
the aim to encourage greater uptake of innovation, and achieve positive economic impact and
job creation for the pandemic recovery. Copernicus Climate Change Services will also
continue to play a key role.
Objective 2 (O2) – Reinforce planning, implementation, and climate risk management: through risk assessments and management, and through helping to close the climate
protection159
gap via risk-transfer mechanisms.
There is a continued need to strengthen mainstreaming of climate change adaptation
across all sectors at EU level. The Strategy will therefore focus on increased mainstreaming
within EU funds, research and innovation, and key vulnerable sectors, such as coastal
protection, energy infrastructure, agriculture, forestry, biodiversity, spatial planning, transport
and communication, urban development, public health, and water. Moreover, it will focus on
strengthening synergies and coherence with policies that share similar or interrelated
objectives, like disaster risk reduction and civil protection.
The Strategy will also include a reinforced focus on resilience of insurance and financial
markets. Even though the 2013 Strategy aimed to improve the market penetration of natural
disaster insurance and to unleash insurance pricing for risk awareness prevention, measures
need to be scaled up. Another important aspect of risk management includes closing the
climate protection gap, which has been defined as the difference between the insured losses
and the total economic losses caused by an extreme weather or climate-related event.160
Regarding financial markets in a broader sense, the new Strategy will increase efforts to
‘build the business case for adaptation’. This includes EU project finance and support to
the development of methodologies to quantify the costs and benefits of resilient investments,
and to facilitate integrating climate risk management in the full policy cycle.
Objective 3 (O3) – Accelerate adaptation action: with a focus on solutions (in addition to
understanding), by deploying innovation (in addition to research), implementation (in
addition to planning) and prevention (in addition to ex-post solutions).
The new Strategy needs to focus particularly on accelerating action at the local level. The
continuing need for this remains clear in light of recent evidence that the impacts of climate
change are already being felt across cities and rural areas in Europe.161
The European Green
Deal emphasises that, under the new EU Adaptation Strategy, cities and regions should be
able to access data and to develop instruments to integrate climate change into their risk
management practices. There is a need for strengthened support of knowledge sharing and
158 DG Research and Innovation (September 2020). Proposed Mission: A Climate Resilient Europe. Retrieved from:
https://ec.europa.eu/info/publications/climate-resilient-europe_en 159 https://www.epc.eu/en/publications/Adapting-to-change~2fce48 160 EIOPA (2019). Protection gap for natural catastrophes. Staff discussion paper. Retrieved from:
https://register.eiopa.europa.eu/Publications/EIOPA-19-485_EIOPA%20Staff_Discussion_Paper_Protection_Gap.pdf 161 EEA (2020). Urban Adaptation in Europe: how cities and towns respond to climate change.
https://www.eea.europa.eu/publications/urban-adaptation-in-europe

30
capacity building as well as (access to) financial support, tailored to the local level. The role
of peer-to-peer learning and the access to usable data for local governments are important
elements of strengthening local action under the Strategy. The local capacity building
anchored in latest science and innovation, and based on user-friendly, fit for purpose tools,
services and solutions will also be a the centre of the Horizon Europe Mission on Adaptation
to Climate Change, including Societal Transformation.
The need to adapt (critical) infrastructure to the impacts of climate change will have
increased attention in the new Strategy, e.g. through Nature-based Solutions and digital
technology.
Objective 4 (O4) – Strengthen global action for climate change adaptation and
resilience: strengthening cooperation on enhancing action on climate change adaptation is
necessary in order to make progress towards the global goal on adaptation enshrined in the
Paris Agreement, and in line with other international commitments including the SDGs.
This will be achieved by assisting partner countries in adaptation planning processes and the
implementation of actions, promoting comprehensive risk management approaches, scaling
up and enhancing the effectiveness of support, and sharing information, good practices,
experiences and lessons learnt (e.g. through Climate-ADAPT).
The new Strategy will provide a framework to support the EU’s partner countries in
stepping up climate change adaptation and resilience. Developing countries are
particularly vulnerable to the impacts of climate change and have the least capacity to
adapt.162
Additional and better-targeted financial resources for climate change adaptation
are thus urgently needed, both from domestic and international public sources, as well as
from the private sector and innovative sources of finance.
The new Strategy will also address shared challenges of interconnected economies (e.g.
supply chains, or risk assessing cascading climate impacts). At the same time, the EU can
learn from others: many of the EU’s international partners have long been on the frontlines
of climate change and have valuable experiences that could help European communities
become more resilient, for example on the topic of early warning systems and preparedness.
In addition, the objective contributes to:
Improved governance: alignment and integration of regional, national and sub-
national policy frameworks, with a specific focus on local authorities.
Gender-responsive planning, implementation, and leveraging on local and
indigenous knowledge and expertise.
Box 4: Stakeholder views on objective setting for the new EU Adaptation Strategy
Stakeholders views on specific objectives163
:
According to expert interviewees and the majority of workshop participants from all
stakeholder groups (including international organisation, civil society, businesses and one EU
institution), the better use of data was considered an important objective of the new Strategy.
Stakeholders explained that, even though a lot of data is available, this could be perceived as
an overload by Member States and local governments. This echoes respondents’ identification
of problems and drivers in the OPC, according to which knowledge and solutions are already
162 United Nations Environment Programme (UNEP) (2016). The Adaptation Finance Gap Report 2016. Nairobi: UNEP 163 See Annex 2 for more details on the stakeholder consultation.

31
available to adapt to climate change, and that the focus should move from planning to action
and addressing issues such as the need for financing.
Stakeholders also agreed that, in addition to funding support, the EU should promote the
development of standard methodologies to quantify the costs and benefits of ecosystem-
based approaches, in order to help with the implementation of solutions. This was
particularly mentioned across Member States and business representatives, but also reported
by a few experts from civil society. Stakeholders from most stakeholder groups (EU
institutions, national authorities, local authorities, international organisations and civil
society) also suggested the Strategy could support a dedicated mechanism to provide tailored
adaptation guidance and peer-to-peer knowledge sharing for local public authorities and non-
state actors. Moreover, they mentioned a need for the Strategy to encourage cross-sector
cooperation for the best solutions.
Although planning needs to be reinforced, most participants of the OPC strongly agreed that
an increased focus on implementation (in addition to planning) is needed (74.9%).164
Respondents of the OPC strongly agreed that the EU should support Member State level
action on adaptation (59.3%).165
EU support at the local level also received strong support
from all stakeholders. In the stakeholder consultations, there was an endorsement of continued
support for action at Member State level, with a focus on supporting and ensuring proper
implementation of national strategies. This was endorsed by national authorities, EU
institutions representatives, international organisations and civil society organisations alike.
In addition, in the stakeholder workshops and interviews, the majority of participants
highlighted the importance of supporting adaptation at the local level, including by local
authorities. This was emphasised by all stakeholder groups but particularly among civil
society organisations and several Member States’ representatives. As one stakeholder from a
national government institution explained, support at the national and local level should go
beyond EU leaflets. The majority of stakeholders also agreed in the workshops on faster
deployment of solutions. One Member State representative suggested that this needs to come
not only via Horizon Europe, but action should be scaled up at all levels.
Overall, the lack of an international dimension of the 2013 Strategy was identified as a
deficiency in all stakeholder consultations. According to OPC respondents, it is most
important for the new Strategy to be aligned with the global goal on adaptation as expressed
in the Paris Agreement (71.8%166
). This was most highlighted by international organisations,
Member States’ representatives, academic and research institutions, non-governmental
organisations and EU institutions, and less so by citizens and business representatives. The
importance of Paris Agreement alignment has also been mentioned throughout the stakeholder
workshops and interviews.
5. WHAT ARE THE AVAILABLE POLICY OPTIONS?
This section describes policy options, and the corresponding actions and measures,
considered for inclusion in the new Strategy. The two policy options under consideration
represent an umbrella for various actions and measures and form the main level at which the
Impact Assessment will take place. The actions represent the main activities that would
potentially take place under each option and are based on the structure of the 2013 Strategy
164 See Figure 3-13 in Appendix 1.A accompanying the consultation synopsis presenting the analysis of the OPC. 165 See Figure 3-14 in Appendix 1.A accompanying the consultation synopsis presenting the analysis of the OPC. 166 See Figure 3-10 in Appendix 1.A accompanying the consultation synopsis presenting the analysis of the OPC.

32
and its eight actions (see Table 5 below). While Option 1 expands on the actions of the 2013
Strategy, new ones are proposed under Option 2. The measures are the specific, tangible
steps that will be put in place to implement the actions. They are the measure of the choices
for this Impact assessment in terms of ambition.
While many of the measures are not of a legislative nature, several notable examples will be
pursued with separate legislative action. Climate proofing should be integrated in the
Strategic Environmental Assessment. The collection of climate-related loss data from
(re)insurers would be explored also in a legislative context (through the possible revision of
the legal base of the European Insurance and Occupational Pensions Authority Regulation
and/or the Solvency 2 directive). In order to be able to count on a truly EU climate insurance
pool, the integration of a “build back better” requirement in the Solidarity Fund would
require a revision of its legal base. In addition, several upcoming reviews (e.g. Urban Waste
Water Treatment Directive) could see adaptation mainstreaming reinforced. For other
processes, legislative follow up was not deemed necessary at this stage (e.g. there will be no
revision of the Water Framework Directive following its fitness check, so climate change
adaptation will be reinforced via guidance for the Common Implementation Strategy).
Further work will require a pre-legislative follow up, such as white papers or blueprints, but
also pilots of initiative (e.g. trying out with the Digital Europe Programme a pilot on loss data
collection before rolling it out in legislation).
Ultimate success of the Strategy would mean a succession of positive assessments of progress
towards increased climate resilience at Union level. The Paris Agreement global goal on
adaptation is similarly a dynamic one (i.e. enhancing adaptive capacity, strengthening
resilience and reducing vulnerability to climate change). Dealing with climate impacts means
dealing with complexity, uncertainty, tipping points, cascading risk – adaptation to these
impacts therefore requires a dynamic implementation (i.e. not just one script to follow but
multiple). As for any policy of disaster risk management (e.g. pandemics, earthquakes),
success of adaptation action is often invisible because it constitutes averted damage (a
counterfactual is difficult to construct).
Actions and measures were identified from a variety of sources; the 2018 Evaluation of the
Strategy was nevertheless a key source, as it provided a detailed set of recommendations for
measures in a revised Strategy. In addition, desk review, feedback from stakeholders through
the Open Public Consultation, expert interviews and stakeholder workshops were all
considered and contributed to the list of actions and measures proposed. The new strategy
will indicate a vision for EU climate resilience and pursue it both directly, through the
identified measures, and indirectly, through the principles it puts forward. This increased
attention and strategic guidance will help bring existing instruments in line with the new
reality of climate impacts (and add further justification for some instruments). It will also
guide EU funding instruments (e.g. in the context of the 37% target for Recovery and
Resilience Facility, or in programming for NDICI, CAP, Horizon Europe etc.) in terms of
highlighting adaptation vs other policy priorities. In this regard, the strategy comes at an
opportune moment because of priority setting and programming for the next MFF. Moreover,
adaptation is most effective when it builds on the multiple benefits it can deliver (e.g. flood
plain restoration as an opportunity to decrease flood impacts but also add recreation value,
help biodiversity, reduce pollution etc.).
In this section we present, for each policy option, a selection of measures for which more
detailed mini-assessments are carried out. Detailed descriptions of the measures can also be
found in the annexes: Annex 7 for the measures selected for the mini-assessments
contributing to the Impact Assessment in chapter 6, and Annex 6 for the other measures.
33
The selection of measures for mini-assessment was made in order to concentrate on the
measures with the highest estimated direct impact relevant for Better Regulation (i.e.
economic, social and environmental). The selection was based on a screening which
considered the types of impacts each measure could have, the measurability of those impacts
and the availability of evidence on them, whether the measures would impose significant
costs on stakeholders, and the balance of measures across the actions. In this way a broad
range of measures that are likely to provide the most relevant and assessable economic, social
and environmental impacts were selected, with particular attention to those which may
impose costs on stakeholders, raise political problems or encounter resistance in
implementation.
What is the baseline against which the options are assessed?
Consistent with the Better Regulation Toolbox (#12, #17), the baseline option represents a
‘no policy change’ scenario (i.e. a policy baseline). This is taken as a continuation of the
2013 Adaptation Strategy in its current form, the 8 actions of which are presented in Table 5
below – a full assessment of this baseline option is available in the Evaluation of the 2013
Strategy.
The Union could continue with the current strategy, as its evaluation was positive, including
on continue relevance, but would operate in an increasingly changing context (see Section 1)
to which it is not equipped to respond. Changes in the international and EU context would
continue to erode the relevance of the few actions not yet concluded in their original
ambition.
Climate change impacts, and our understanding of them, have themselves evolved since the
2013 Strategy; the updated starting point and understanding of the impacts is an important
part of the baseline, which draws on various IPCC reports and other authoritative source as
well as recent research, including PESETA IV, Horizon 2020 COACCH project and the
Study on Adaptation Modelling167
.
Furthermore, the COVID-19 crisis is having very significant impacts across the EU, and
therefore both the crisis, and the policy response to it, will have impacts on the baseline
scenario. There are two main ways in which this occurs: (1) the Recovery Fund will bring a
large new source of EU investment, with a number of priorities announced that can influence
adaptation, including through Horizon Europe and actions on climate change mitigation,
which should reduce future climate impacts; and, (2) it increases attention on resilience,
particularly in the area of health, but also more broadly, which should give the actions of the
2013 Strategy more traction. These changes will also be considered in the baseline to the
extent possible, but it should be noted that, as many details remain to be finalised through the
legislative process, and the proposals are quite recent, there is limited information,
particularly quantitative information, on which to base an assessment.
Table 5: Baseline option – Actions
ACTION
1. Encourage all Member States to adopt comprehensive adaptation strategies
2. Provide LIFE funding to support capacity building and step up adaptation action in Europe (2014-2020)
3. Introduce adaptation in the Covenant of Mayors framework (2013/2014)
167 Forthcoming 2021
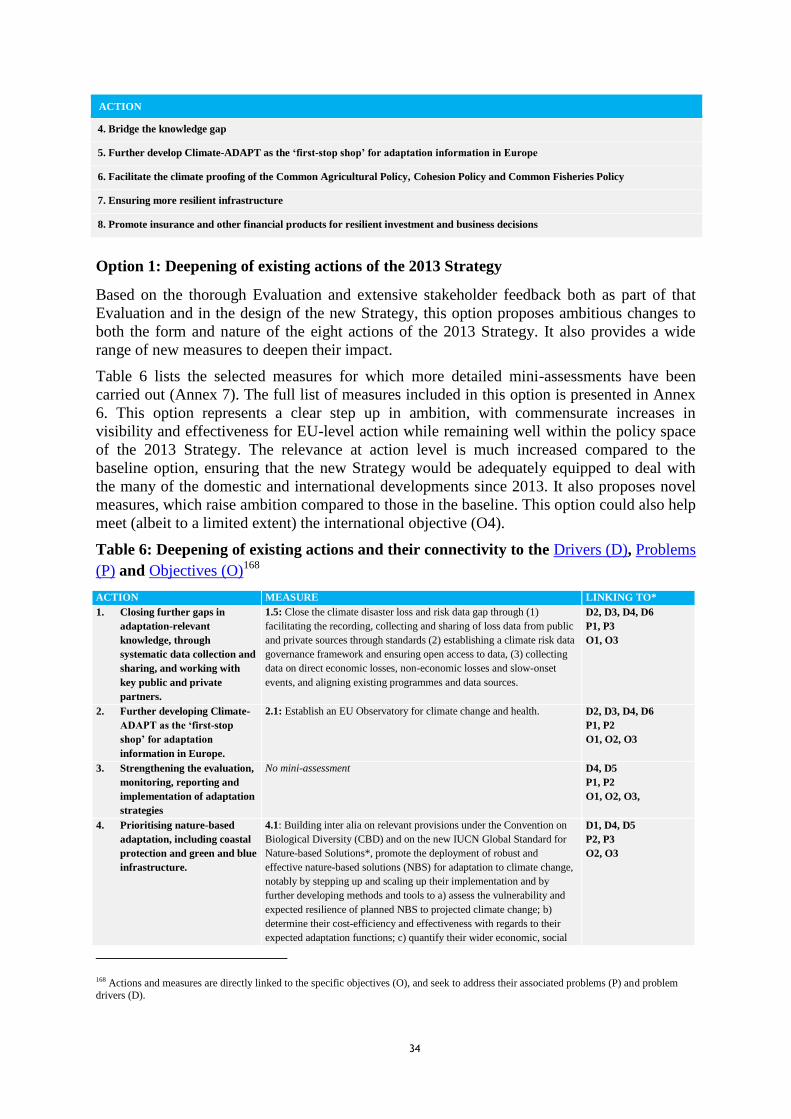
34
ACTION
4. Bridge the knowledge gap
5. Further develop Climate-ADAPT as the ‘first-stop shop’ for adaptation information in Europe
6. Facilitate the climate proofing of the Common Agricultural Policy, Cohesion Policy and Common Fisheries Policy
7. Ensuring more resilient infrastructure
8. Promote insurance and other financial products for resilient investment and business decisions
Option 1: Deepening of existing actions of the 2013 Strategy
Based on the thorough Evaluation and extensive stakeholder feedback both as part of that
Evaluation and in the design of the new Strategy, this option proposes ambitious changes to
both the form and nature of the eight actions of the 2013 Strategy. It also provides a wide
range of new measures to deepen their impact.
Table 6 lists the selected measures for which more detailed mini-assessments have been
carried out (Annex 7). The full list of measures included in this option is presented in Annex
6. This option represents a clear step up in ambition, with commensurate increases in
visibility and effectiveness for EU-level action while remaining well within the policy space
of the 2013 Strategy. The relevance at action level is much increased compared to the
baseline option, ensuring that the new Strategy would be adequately equipped to deal with
the many of the domestic and international developments since 2013. It also proposes novel
measures, which raise ambition compared to those in the baseline. This option could also help
meet (albeit to a limited extent) the international objective (O4).
Table 6: Deepening of existing actions and their connectivity to the Drivers (D), Problems
(P) and Objectives (O)168
ACTION MEASURE LINKING TO*
1. Closing further gaps in
adaptation-relevant
knowledge, through
systematic data collection and
sharing, and working with
key public and private
partners.
1.5: Close the climate disaster loss and risk data gap through (1)
facilitating the recording, collecting and sharing of loss data from public
and private sources through standards (2) establishing a climate risk data
governance framework and ensuring open access to data, (3) collecting
data on direct economic losses, non-economic losses and slow-onset
events, and aligning existing programmes and data sources.
D2, D3, D4, D6
P1, P3
O1, O3
2. Further developing Climate-
ADAPT as the ‘first-stop
shop’ for adaptation
information in Europe.
2.1: Establish an EU Observatory for climate change and health. D2, D3, D4, D6
P1, P2
O1, O2, O3
3. Strengthening the evaluation,
monitoring, reporting and
implementation of adaptation
strategies
No mini-assessment D4, D5
P1, P2
O1, O2, O3,
4. Prioritising nature-based
adaptation, including coastal
protection and green and blue
infrastructure.
4.1: Building inter alia on relevant provisions under the Convention on
Biological Diversity (CBD) and on the new IUCN Global Standard for
Nature-based Solutions*, promote the deployment of robust and
effective nature-based solutions (NBS) for adaptation to climate change,
notably by stepping up and scaling up their implementation and by
further developing methods and tools to a) assess the vulnerability and
expected resilience of planned NBS to projected climate change; b)
determine their cost-efficiency and effectiveness with regards to their
expected adaptation functions; c) quantify their wider economic, social
D1, D4, D5
P2, P3
O2, O3
168 Actions and measures are directly linked to the specific objectives (O), and seek to address their associated problems (P) and problem
drivers (D).
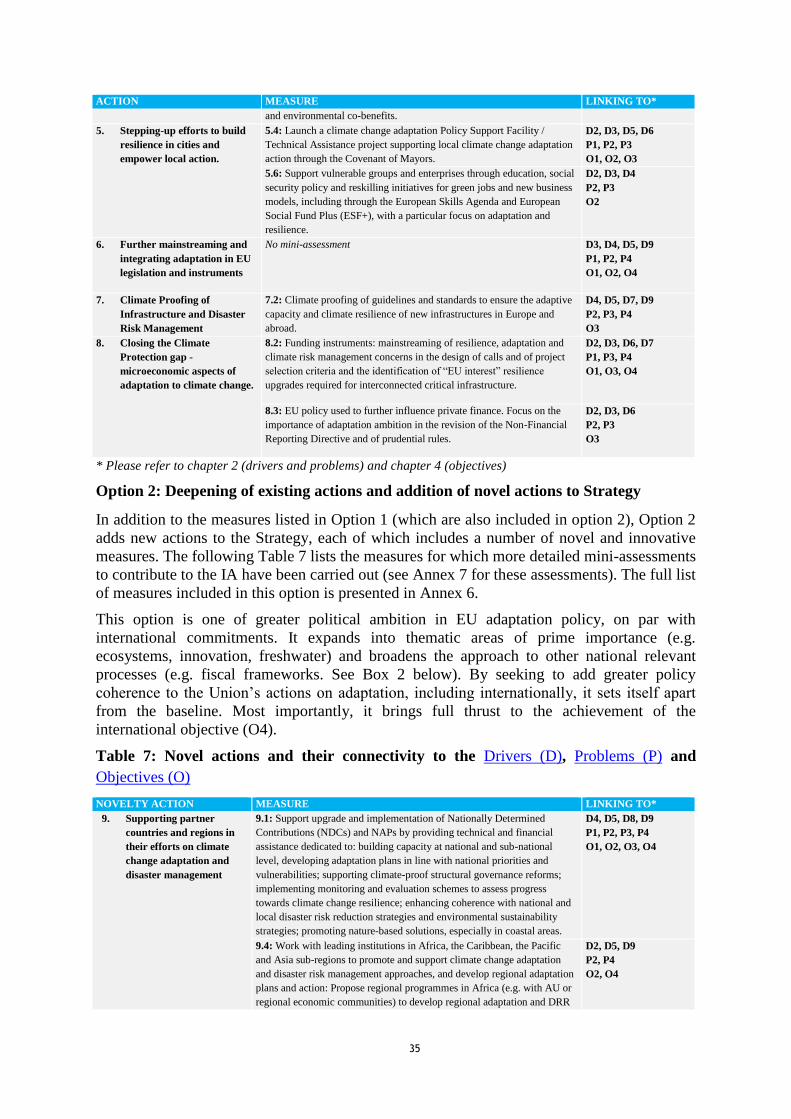
35
ACTION MEASURE LINKING TO*
and environmental co-benefits.
5. Stepping-up efforts to build
resilience in cities and
empower local action.
5.4: Launch a climate change adaptation Policy Support Facility /
Technical Assistance project supporting local climate change adaptation
action through the Covenant of Mayors.
D2, D3, D5, D6
P1, P2, P3
O1, O2, O3
5.6: Support vulnerable groups and enterprises through education, social
security policy and reskilling initiatives for green jobs and new business
models, including through the European Skills Agenda and European
Social Fund Plus (ESF+), with a particular focus on adaptation and
resilience.
D2, D3, D4
P2, P3
O2
6. Further mainstreaming and
integrating adaptation in EU
legislation and instruments
No mini-assessment D3, D4, D5, D9
P1, P2, P4
O1, O2, O4
7. Climate Proofing of
Infrastructure and Disaster
Risk Management
7.2: Climate proofing of guidelines and standards to ensure the adaptive
capacity and climate resilience of new infrastructures in Europe and
abroad.
D4, D5, D7, D9
P2, P3, P4
O3
8. Closing the Climate
Protection gap -
microeconomic aspects of
adaptation to climate change.
8.2: Funding instruments: mainstreaming of resilience, adaptation and
climate risk management concerns in the design of calls and of project
selection criteria and the identification of “EU interest” resilience
upgrades required for interconnected critical infrastructure.
D2, D3, D6, D7
P1, P3, P4
O1, O3, O4
8.3: EU policy used to further influence private finance. Focus on the
importance of adaptation ambition in the revision of the Non-Financial
Reporting Directive and of prudential rules.
D2, D3, D6
P2, P3
O3
* Please refer to chapter 2 (drivers and problems) and chapter 4 (objectives)
Option 2: Deepening of existing actions and addition of novel actions to Strategy
In addition to the measures listed in Option 1 (which are also included in option 2), Option 2
adds new actions to the Strategy, each of which includes a number of novel and innovative
measures. The following Table 7 lists the measures for which more detailed mini-assessments
to contribute to the IA have been carried out (see Annex 7 for these assessments). The full list
of measures included in this option is presented in Annex 6.
This option is one of greater political ambition in EU adaptation policy, on par with
international commitments. It expands into thematic areas of prime importance (e.g.
ecosystems, innovation, freshwater) and broadens the approach to other national relevant
processes (e.g. fiscal frameworks. See Box 2 below). By seeking to add greater policy
coherence to the Union’s actions on adaptation, including internationally, it sets itself apart
from the baseline. Most importantly, it brings full thrust to the achievement of the
international objective (O4).
Table 7: Novel actions and their connectivity to the Drivers (D), Problems (P) and
Objectives (O)
NOVELTY ACTION MEASURE LINKING TO*
9. Supporting partner
countries and regions in
their efforts on climate
change adaptation and
disaster management
9.1: Support upgrade and implementation of Nationally Determined
Contributions (NDCs) and NAPs by providing technical and financial
assistance dedicated to: building capacity at national and sub-national
level, developing adaptation plans in line with national priorities and
vulnerabilities; supporting climate-proof structural governance reforms;
implementing monitoring and evaluation schemes to assess progress
towards climate change resilience; enhancing coherence with national and
local disaster risk reduction strategies and environmental sustainability
strategies; promoting nature-based solutions, especially in coastal areas.
D4, D5, D8, D9
P1, P2, P3, P4
O1, O2, O3, O4
9.4: Work with leading institutions in Africa, the Caribbean, the Pacific
and Asia sub-regions to promote and support climate change adaptation
and disaster risk management approaches, and develop regional adaptation
plans and action: Propose regional programmes in Africa (e.g. with AU or
regional economic communities) to develop regional adaptation and DRR
D2, D5, D9
P2, P4
O2, O4

36
NOVELTY ACTION MEASURE LINKING TO*
strategies.
10. Scaling up international
adaptation finance and
disaster risk financing,
unlocking innovative
sources of finance, and
mobilising private finance
10.3: Use the External Investment Plan and the European Fund for
Sustainable Development to leverage private sector finance for climate
change adaptation, in line with the EU Sustainable Finance Taxonomy, and
promote the engagement of partner countries in the International Platform
for Sustainable Finance.
D4, D6, D7, D9
P3, P4
O3, O4
10.5: Enhance climate and sustainability proofing of all EU external
investments, including grants, guarantees and blending instruments, by
enhancing Environmental and Social Safeguards due diligence, monitoring
and follow-up processes
D6, D8, D9
P2, P3, P4
O2, O3
11. Strengthening EU
engagement globally and
learning from adaptation
frontrunners.
11.4: Strengthen the production and delivery of user-friendly and timely
climate data and services), in particular through the promotion of space-
based application, the use of Copernicus Climate Change Services and
Emergency Management Services in partner countries.
D2, D3, D8
P3, P4
O2, O4
12. Adaptation Solutions /
Horizon Europe Mission
on adaptation to Climate
Change, including Societal
Transformation
12.1: Implement the Horizon Europe Mission on Adaptation to Climate
Change, including Societal Transformation with the objectives of preparing
Europe, Accelerating the transition, and building deep resilience.
D2, D3, D5, D6
P1, P2, P3
O2, O3
12.2: Develop forestry agriculture and ecosystems decision support tools,
including trees and crop suitability, weather and climate forecasts and
disturbance risks
D2, D3, D4
P1, P2, P3
O2, O3
13. Closing the Climate
Protection Gap -
macroeconomic aspects of
adaptation to climate
change.
13.1: For public finance/macro financial stability risk: Introduce a stepwise
approach whereby the Commission engages a discussion on national
disaster risk management frameworks with finance ministers’ fora,
underpinned by best practices and evidence from EU Member States and
EU level scenario analysis and stress testing. This would lay the ground for
mainstreaming climate change in the national fiscal processes.
D4, D6, D8
P2, P3
O2, O3
14. Ensuring the availability
of fresh water.
14.1: Use the Common Implementation Strategy of the Water Framework
Directive to improve policy implementation for securing sustainable water
use across sectors, through improvements to and intensification of among
others: water resource allocation and management plans, water-permitting
systems, cost recovery through water pricing incorporating externalities, or
cost recovery rate calculations.
D3, D4, D6, D7
P1, P2, P3
O2, O3
14.3: Promote Water Safety Plans under the Common Implementation
Strategy to reduce exposure to contaminated or acutely polluted water due
to climate impacts such as low flows, higher water temperature or flooding,
and also to ensure availability of adequate quantities of tap water.
D2, D3, D4
P1, P3
O3
* Please refer to chapter 2 (drivers and problems) and chapter 4 (objectives)
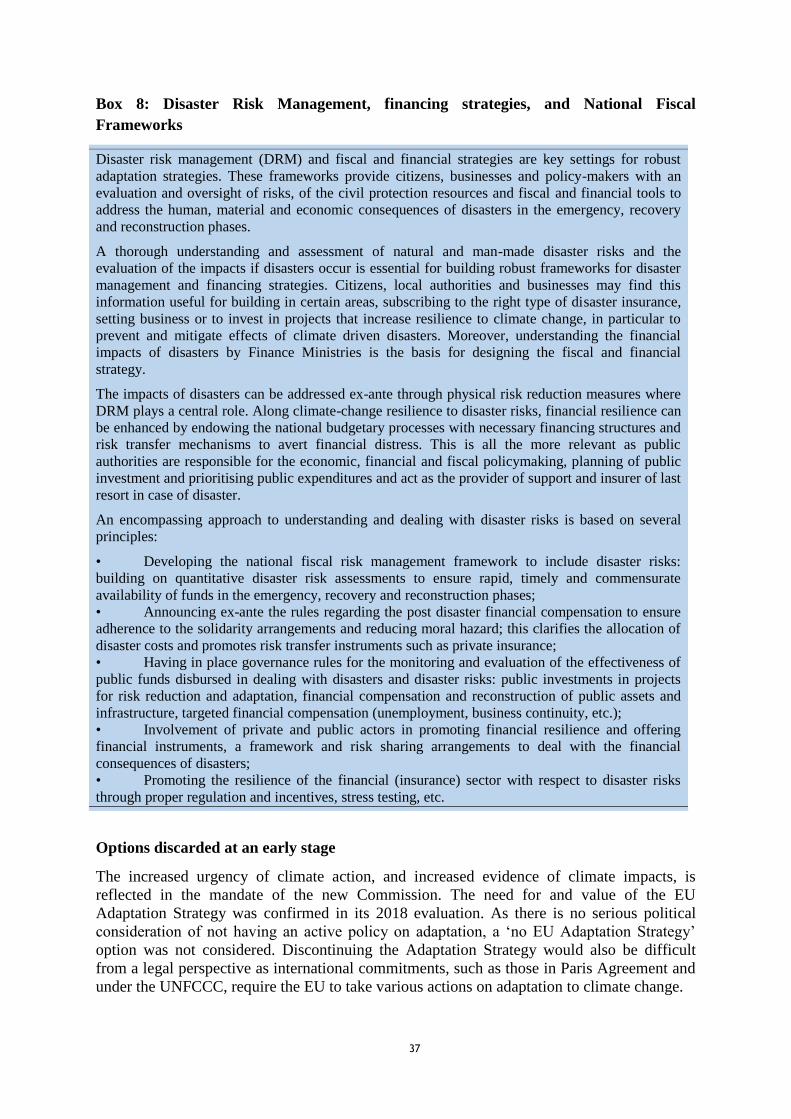
37
Box 8: Disaster Risk Management, financing strategies, and National Fiscal
Frameworks
Disaster risk management (DRM) and fiscal and financial strategies are key settings for robust
adaptation strategies. These frameworks provide citizens, businesses and policy-makers with an
evaluation and oversight of risks, of the civil protection resources and fiscal and financial tools to
address the human, material and economic consequences of disasters in the emergency, recovery
and reconstruction phases.
A thorough understanding and assessment of natural and man-made disaster risks and the
evaluation of the impacts if disasters occur is essential for building robust frameworks for disaster
management and financing strategies. Citizens, local authorities and businesses may find this
information useful for building in certain areas, subscribing to the right type of disaster insurance,
setting business or to invest in projects that increase resilience to climate change, in particular to
prevent and mitigate effects of climate driven disasters. Moreover, understanding the financial
impacts of disasters by Finance Ministries is the basis for designing the fiscal and financial
strategy.
The impacts of disasters can be addressed ex-ante through physical risk reduction measures where
DRM plays a central role. Along climate-change resilience to disaster risks, financial resilience can
be enhanced by endowing the national budgetary processes with necessary financing structures and
risk transfer mechanisms to avert financial distress. This is all the more relevant as public
authorities are responsible for the economic, financial and fiscal policymaking, planning of public
investment and prioritising public expenditures and act as the provider of support and insurer of last
resort in case of disaster.
An encompassing approach to understanding and dealing with disaster risks is based on several
principles:
• Developing the national fiscal risk management framework to include disaster risks:
building on quantitative disaster risk assessments to ensure rapid, timely and commensurate
availability of funds in the emergency, recovery and reconstruction phases;
• Announcing ex-ante the rules regarding the post disaster financial compensation to ensure
adherence to the solidarity arrangements and reducing moral hazard; this clarifies the allocation of
disaster costs and promotes risk transfer instruments such as private insurance;
• Having in place governance rules for the monitoring and evaluation of the effectiveness of
public funds disbursed in dealing with disasters and disaster risks: public investments in projects
for risk reduction and adaptation, financial compensation and reconstruction of public assets and
infrastructure, targeted financial compensation (unemployment, business continuity, etc.);
• Involvement of private and public actors in promoting financial resilience and offering
financial instruments, a framework and risk sharing arrangements to deal with the financial
consequences of disasters;
• Promoting the resilience of the financial (insurance) sector with respect to disaster risks
through proper regulation and incentives, stress testing, etc.
Options discarded at an early stage
The increased urgency of climate action, and increased evidence of climate impacts, is
reflected in the mandate of the new Commission. The need for and value of the EU
Adaptation Strategy was confirmed in its 2018 evaluation. As there is no serious political
consideration of not having an active policy on adaptation, a ‘no EU Adaptation Strategy’
option was not considered. Discontinuing the Adaptation Strategy would also be difficult
from a legal perspective as international commitments, such as those in Paris Agreement and
under the UNFCCC, require the EU to take various actions on adaptation to climate change.
38
Similarly, a standardised ‘one-size-fits-all’ type regulation, mandating Member States and
other stakeholders to take specific actions (like strategic retreat from areas that are sure to be
affected by sea-level rise, or stopping support for non-climate adapted crops, making climate
insurance mandatory at EU-level etc.) was also not considered suitable for further
assessment. As adaptation is an issue which is very specific to circumstances, spatial and
temporal variables, it would be ill suited for top-down regulation to set more than a few
overarching requirements. Trying to take a comprehensive top-down approach would likely
be inefficient, costly and potentially lead to maladaptation. It would also raise questions
relating to the subsidiarity and proportionality of EU action.
6. WHAT ARE THE IMPACTS OF THE POLICY OPTIONS?
This chapter presents the main impact assessment of the policy options. The impact indicators
that are assessed were selected based on the impact screening presented in Annex 5. An
aggregated impact assessment at the policy option level is carried out, based on the mini-
assessments of the selection of measures presented in chapter 5. These mini-assessments are
detailed in Annex 7 to this report. Key points from the assessments of these individual
measures are highlighted in the text, but the options are evaluated as an aggregate of all of the
mini-assessments and also relevant reflections on the potential impact of the full list of
measures presented in Annex 6. The Options are all assessed for their impact compared to the
Baseline option (see below), not their absolute impact. Option 2 also includes impacts
assessed for Option 1, as it subsumes all Option 1 actions and measures.
Assessment is necessarily qualitative in many aspects
The intended impact pathways of the actions and measures in the Adaptation Strategy are
typically quite long-term, indirect and acting in concert with other instruments, or in
anticipation of action by others. This makes it difficult to attribute impacts to the policy
Options. The distinction between direct and indirect impacts is made across the assessments
and is important. Direct effects are expected to be applicable in the short term. Indirect
impacts are typically relevant to measures that promote, support or enable action, and which
therefore generally induce impacts on a slower timescale, and where the attribution of
impacts to the Strategy is more difficult.
Furthermore, analytical tools and instruments in the context of climate change adaptation are
not yet developed enough to provide good resources or methodologies for the assessment of
the impact of adaptation measures169
. There are particular deficiencies in the assessment of
costs and effectiveness of measures, which make quantitative assessment very difficult.
Further research is necessary to develop tools and approaches to improve the possibilities for
modelling such impacts170
. Therefore, out of necessity the approach and the consequent
comparison in chapter 7, is qualitative and cannot offer a traditional cost-benefit perspective
to the same depth possible for other programmes or policies.
The adoption or take-up of measures proposed under the different options of the Strategy is
important to the assessment of impact. The Options include very few measures that are
mandatory for the targeted groups. Therefore, assumptions of the voluntary take-up of the
measures are important. In the mini-assessments in Annex 7 the assumptions of take-up used
for the quantitative and qualitative assessments are detailed, these are based primarily on desk
review, which used data on predecessor measures, or similar measures in other areas, to
169 See Study on Adaptation Modelling, Forthcoming 2021 170 Ibid
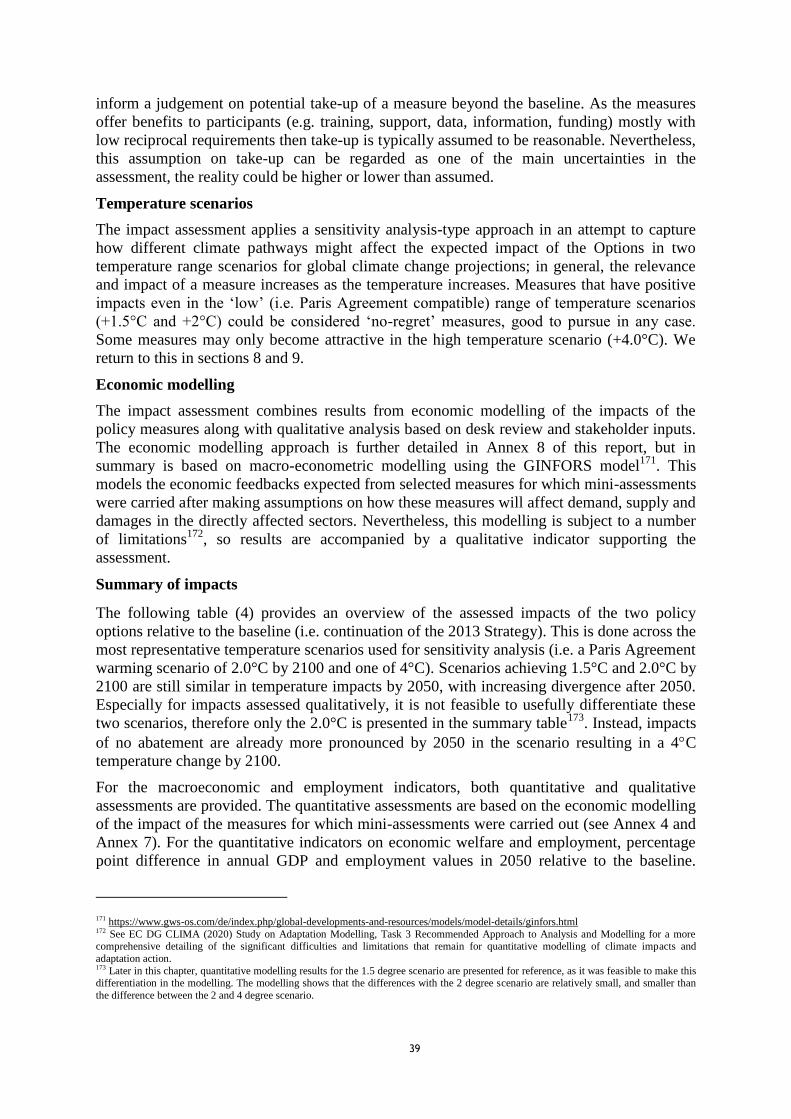
39
inform a judgement on potential take-up of a measure beyond the baseline. As the measures
offer benefits to participants (e.g. training, support, data, information, funding) mostly with
low reciprocal requirements then take-up is typically assumed to be reasonable. Nevertheless,
this assumption on take-up can be regarded as one of the main uncertainties in the
assessment, the reality could be higher or lower than assumed.
Temperature scenarios
The impact assessment applies a sensitivity analysis-type approach in an attempt to capture
how different climate pathways might affect the expected impact of the Options in two
temperature range scenarios for global climate change projections; in general, the relevance
and impact of a measure increases as the temperature increases. Measures that have positive
impacts even in the ‘low’ (i.e. Paris Agreement compatible) range of temperature scenarios
(+1.5°C and +2°C) could be considered ‘no-regret’ measures, good to pursue in any case.
Some measures may only become attractive in the high temperature scenario (+4.0°C). We
return to this in sections 8 and 9.
Economic modelling
The impact assessment combines results from economic modelling of the impacts of the
policy measures along with qualitative analysis based on desk review and stakeholder inputs.
The economic modelling approach is further detailed in Annex 8 of this report, but in
summary is based on macro-econometric modelling using the GINFORS model171
. This
models the economic feedbacks expected from selected measures for which mini-assessments
were carried after making assumptions on how these measures will affect demand, supply and
damages in the directly affected sectors. Nevertheless, this modelling is subject to a number
of limitations172
, so results are accompanied by a qualitative indicator supporting the
assessment.
Summary of impacts
The following table (4) provides an overview of the assessed impacts of the two policy
options relative to the baseline (i.e. continuation of the 2013 Strategy). This is done across the
most representative temperature scenarios used for sensitivity analysis (i.e. a Paris Agreement
warming scenario of 2.0°C by 2100 and one of 4°C). Scenarios achieving 1.5°C and 2.0°C by
2100 are still similar in temperature impacts by 2050, with increasing divergence after 2050.
Especially for impacts assessed qualitatively, it is not feasible to usefully differentiate these
two scenarios, therefore only the 2.0°C is presented in the summary table173
. Instead, impacts
of no abatement are already more pronounced by 2050 in the scenario resulting in a 4C
temperature change by 2100.
For the macroeconomic and employment indicators, both quantitative and qualitative
assessments are provided. The quantitative assessments are based on the economic modelling
of the impact of the measures for which mini-assessments were carried out (see Annex 4 and
Annex 7). For the quantitative indicators on economic welfare and employment, percentage
point difference in annual GDP and employment values in 2050 relative to the baseline.
171 https://www.gws-os.com/de/index.php/global-developments-and-resources/models/model-details/ginfors.html 172 See EC DG CLIMA (2020) Study on Adaptation Modelling, Task 3 Recommended Approach to Analysis and Modelling for a more comprehensive detailing of the significant difficulties and limitations that remain for quantitative modelling of climate impacts and
adaptation action. 173 Later in this chapter, quantitative modelling results for the 1.5 degree scenario are presented for reference, as it was feasible to make this differentiation in the modelling. The modelling shows that the differences with the 2 degree scenario are relatively small, and smaller than
the difference between the 2 and 4 degree scenario.

40
Comparison with the absolute numbers from the baseline is provided in the following
sections, and addresses the point that although the options are better than the baseline, they
still act only to reduce the scale of losses due to climate damages. Furthermore, given the
limited extent to which the selection of the proposed measures were captured by the
economic model used, it is very likely that these values (for the majority benefits) are lower
bounds, under-representing the positive impacts of the strategy along these dimensions. This
is a known problem in adaptation policy174
i.e. that its benefits are undervalued by not
integrating co-benefits the adaptation measures have, and by not accounting for the avoided
damages of climate change. The qualitative indicators aim to address these limitations, to
include a view on measures which were not modelled, and to bring in consideration of the
broader issues related to economic welfare and employment, for example skills. It is also
important to note that whilst the numbers for economic welfare may appear small at this
aggregate EU level, they can represent much more significant sums for localities particularly
affected by climate change, and which would also significantly benefit from the Options.
Table 9 uses a negative/positive scale from (---/--/-/0/+/++/+++). For all qualitative
indicators, the baseline would be represented as a zero (i.e. the reference). This is not shown
in the table, but the situation the baseline represents is described in the following sections,
which provide the full assessment per impact indicator and option. The colour shading
emphasises the assessed impacts: darker shading indicates greater impact, with red for
negative and green for positive impacts. The scores are based on the detailed assessments in
the following sections, which are built up from the mini-assessments provided in Annex 7
and high-level consideration of any significant additional impact of all measures under each
Option, as listed in Annex 6.
Table 9: Summary of impact assessment relative to the baseline
Impact
(by 2050) Sub-indicator
Paris scenario (2.0°C by
2100175
)
High temperature scenario
(+4.0°C by 2100176
)
Option 1 Option 2 Option 1 Option 2
Macroeconomic
Change in economic
(welfare) (p.p. GDP/year) +0.22pp +0.22pp +0.47pp +0.47pp
Qualitative (+/-) + +/++ +/++ ++
Competitiveness
trade and
investment
Impact on
competitiveness, trade
and (climate resilient)
investments (+/-)
+ +/++ ++ ++/+++
Regulatory
burden on
businesses
Regulatory burden (+/-)
0/- - 0/- -
Innovation and
research
Impact on adaptation
innovation (+/-) + +++ + +++
174 https://unfccc.int/resource/docs/publications/pub_nwp_costs_benefits_adaptation.pdf 175 Quantitative modelling results are presented for 2050 for an approximate 2.0°C temperature increase (by 2100) scenario based on RCP
4.5; in the following sections, results are also presented for a 1.5°C temperature increase (by 2100) scenario based on RCP 2. 176 Quantitative modelling results are presented for 2050 for an approximate 4.0°C temperature increase (by 2100) scenario based on RCP
8.5
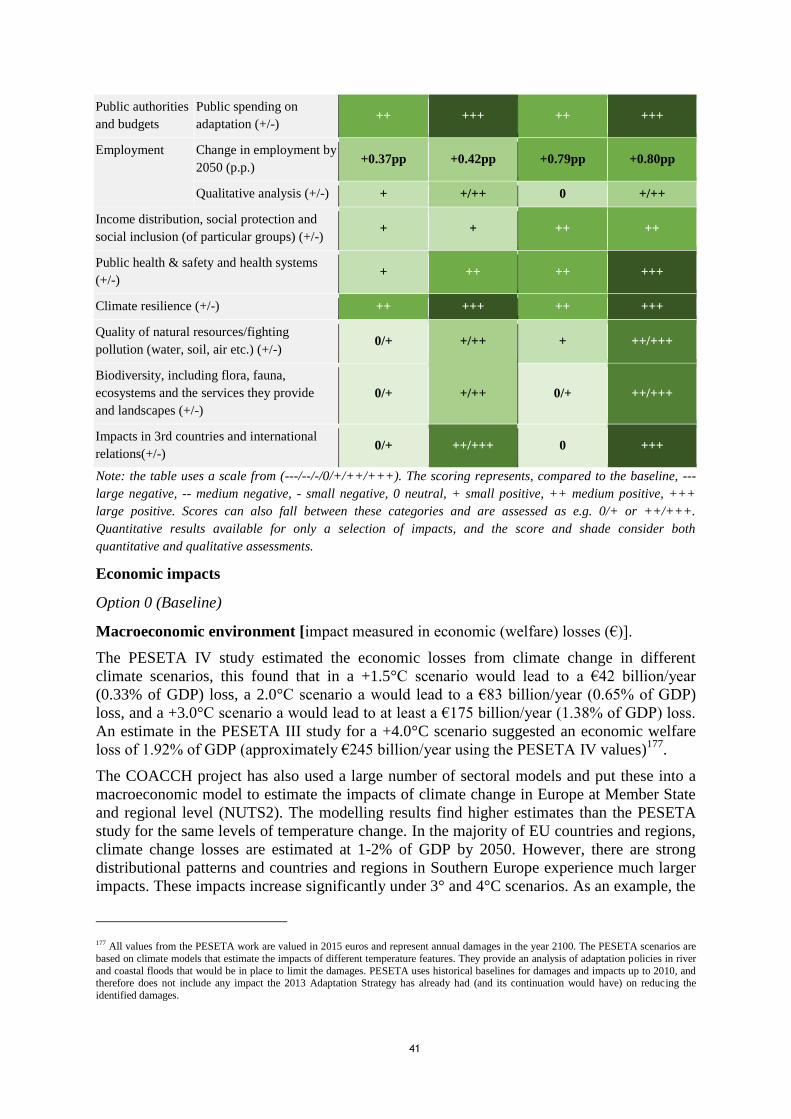
41
Public authorities
and budgets
Public spending on
adaptation (+/-) ++ +++ ++ +++
Employment
Change in employment by
2050 (p.p.) +0.37pp +0.42pp +0.79pp +0.80pp
Qualitative analysis (+/-) + +/++ 0 +/++
Income distribution, social protection and
social inclusion (of particular groups) (+/-) + + ++ ++
Public health & safety and health systems
(+/-) + ++ ++ +++
Climate resilience (+/-) ++ +++ ++ +++
Quality of natural resources/fighting
pollution (water, soil, air etc.) (+/-) 0/+ +/++ + ++/+++
Biodiversity, including flora, fauna,
ecosystems and the services they provide
and landscapes (+/-)
0/+ +/++ 0/+ ++/+++
Impacts in 3rd countries and international
relations(+/-) 0/+ ++/+++ 0 +++
Note: the table uses a scale from (---/--/-/0/+/++/+++). The scoring represents, compared to the baseline, ---
large negative, -- medium negative, - small negative, 0 neutral, + small positive, ++ medium positive, +++
large positive. Scores can also fall between these categories and are assessed as e.g. 0/+ or ++/+++.
Quantitative results available for only a selection of impacts, and the score and shade consider both
quantitative and qualitative assessments.
Economic impacts
Option 0 (Baseline)
Macroeconomic environment [impact measured in economic (welfare) losses (€)].
The PESETA IV study estimated the economic losses from climate change in different
climate scenarios, this found that in a +1.5°C scenario would lead to a €42 billion/year
(0.33% of GDP) loss, a 2.0°C scenario a would lead to a €83 billion/year (0.65% of GDP)
loss, and a +3.0°C scenario a would lead to at least a €175 billion/year (1.38% of GDP) loss.
An estimate in the PESETA III study for a +4.0°C scenario suggested an economic welfare
loss of 1.92% of GDP (approximately €245 billion/year using the PESETA IV values)177
.
The COACCH project has also used a large number of sectoral models and put these into a
macroeconomic model to estimate the impacts of climate change in Europe at Member State
and regional level (NUTS2). The modelling results find higher estimates than the PESETA
study for the same levels of temperature change. In the majority of EU countries and regions,
climate change losses are estimated at 1-2% of GDP by 2050. However, there are strong
distributional patterns and countries and regions in Southern Europe experience much larger
impacts. These impacts increase significantly under 3° and 4°C scenarios. As an example, the
177 All values from the PESETA work are valued in 2015 euros and represent annual damages in the year 2100. The PESETA scenarios are
based on climate models that estimate the impacts of different temperature features. They provide an analysis of adaptation policies in river
and coastal floods that would be in place to limit the damages. PESETA uses historical baselines for damages and impacts up to 2010, and therefore does not include any impact the 2013 Adaptation Strategy has already had (and its continuation would have) on reducing the
identified damages.
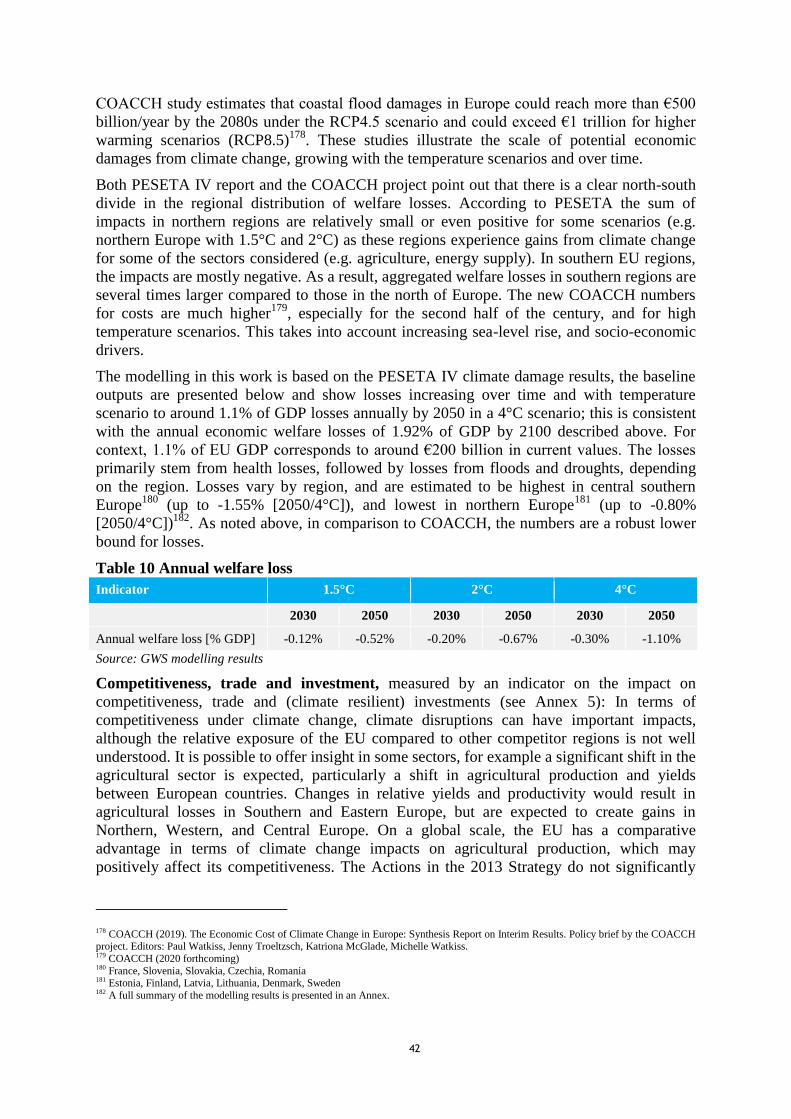
42
COACCH study estimates that coastal flood damages in Europe could reach more than €500
billion/year by the 2080s under the RCP4.5 scenario and could exceed €1 trillion for higher
warming scenarios (RCP8.5)178
. These studies illustrate the scale of potential economic
damages from climate change, growing with the temperature scenarios and over time.
Both PESETA IV report and the COACCH project point out that there is a clear north-south
divide in the regional distribution of welfare losses. According to PESETA the sum of
impacts in northern regions are relatively small or even positive for some scenarios (e.g.
northern Europe with 1.5°C and 2°C) as these regions experience gains from climate change
for some of the sectors considered (e.g. agriculture, energy supply). In southern EU regions,
the impacts are mostly negative. As a result, aggregated welfare losses in southern regions are
several times larger compared to those in the north of Europe. The new COACCH numbers
for costs are much higher179
, especially for the second half of the century, and for high
temperature scenarios. This takes into account increasing sea-level rise, and socio-economic
drivers.
The modelling in this work is based on the PESETA IV climate damage results, the baseline
outputs are presented below and show losses increasing over time and with temperature
scenario to around 1.1% of GDP losses annually by 2050 in a 4°C scenario; this is consistent
with the annual economic welfare losses of 1.92% of GDP by 2100 described above. For
context, 1.1% of EU GDP corresponds to around €200 billion in current values. The losses
primarily stem from health losses, followed by losses from floods and droughts, depending
on the region. Losses vary by region, and are estimated to be highest in central southern
Europe180
(up to -1.55% [2050/4°C]), and lowest in northern Europe181
(up to -0.80%
[2050/4°C])182
. As noted above, in comparison to COACCH, the numbers are a robust lower
bound for losses.
Table 10 Annual welfare loss
Indicator 1.5°C 2°C 4°C
2030 2050 2030 2050 2030 2050
Annual welfare loss [% GDP] -0.12% -0.52% -0.20% -0.67% -0.30% -1.10%
Source: GWS modelling results
Competitiveness, trade and investment, measured by an indicator on the impact on
competitiveness, trade and (climate resilient) investments (see Annex 5): In terms of
competitiveness under climate change, climate disruptions can have important impacts,
although the relative exposure of the EU compared to other competitor regions is not well
understood. It is possible to offer insight in some sectors, for example a significant shift in the
agricultural sector is expected, particularly a shift in agricultural production and yields
between European countries. Changes in relative yields and productivity would result in
agricultural losses in Southern and Eastern Europe, but are expected to create gains in
Northern, Western, and Central Europe. On a global scale, the EU has a comparative
advantage in terms of climate change impacts on agricultural production, which may
positively affect its competitiveness. The Actions in the 2013 Strategy do not significantly
178 COACCH (2019). The Economic Cost of Climate Change in Europe: Synthesis Report on Interim Results. Policy brief by the COACCH project. Editors: Paul Watkiss, Jenny Troeltzsch, Katriona McGlade, Michelle Watkiss. 179 COACCH (2020 forthcoming) 180 France, Slovenia, Slovakia, Czechia, Romania 181 Estonia, Finland, Latvia, Lithuania, Denmark, Sweden 182 A full summary of the modelling results is presented in an Annex.
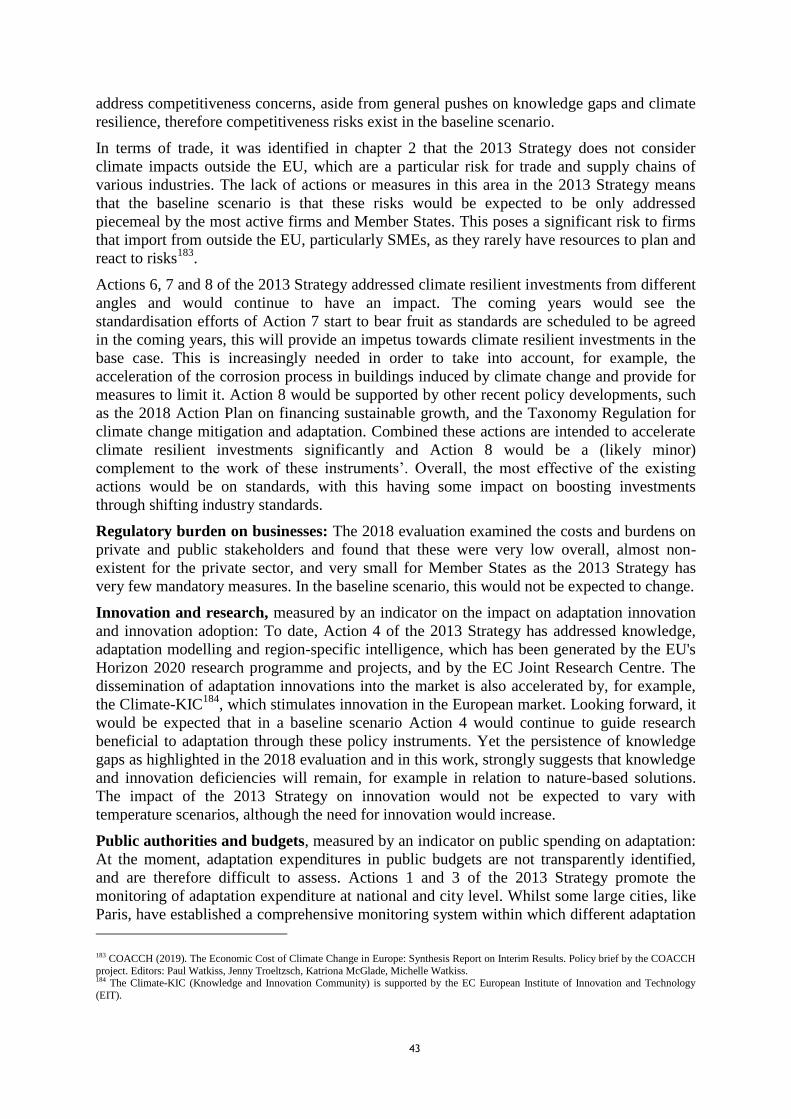
43
address competitiveness concerns, aside from general pushes on knowledge gaps and climate
resilience, therefore competitiveness risks exist in the baseline scenario.
In terms of trade, it was identified in chapter 2 that the 2013 Strategy does not consider
climate impacts outside the EU, which are a particular risk for trade and supply chains of
various industries. The lack of actions or measures in this area in the 2013 Strategy means
that the baseline scenario is that these risks would be expected to be only addressed
piecemeal by the most active firms and Member States. This poses a significant risk to firms
that import from outside the EU, particularly SMEs, as they rarely have resources to plan and
react to risks183
.
Actions 6, 7 and 8 of the 2013 Strategy addressed climate resilient investments from different
angles and would continue to have an impact. The coming years would see the
standardisation efforts of Action 7 start to bear fruit as standards are scheduled to be agreed
in the coming years, this will provide an impetus towards climate resilient investments in the
base case. This is increasingly needed in order to take into account, for example, the
acceleration of the corrosion process in buildings induced by climate change and provide for
measures to limit it. Action 8 would be supported by other recent policy developments, such
as the 2018 Action Plan on financing sustainable growth, and the Taxonomy Regulation for
climate change mitigation and adaptation. Combined these actions are intended to accelerate
climate resilient investments significantly and Action 8 would be a (likely minor)
complement to the work of these instruments’. Overall, the most effective of the existing
actions would be on standards, with this having some impact on boosting investments
through shifting industry standards.
Regulatory burden on businesses: The 2018 evaluation examined the costs and burdens on
private and public stakeholders and found that these were very low overall, almost non-
existent for the private sector, and very small for Member States as the 2013 Strategy has
very few mandatory measures. In the baseline scenario, this would not be expected to change.
Innovation and research, measured by an indicator on the impact on adaptation innovation
and innovation adoption: To date, Action 4 of the 2013 Strategy has addressed knowledge,
adaptation modelling and region-specific intelligence, which has been generated by the EU's
Horizon 2020 research programme and projects, and by the EC Joint Research Centre. The
dissemination of adaptation innovations into the market is also accelerated by, for example,
the Climate-KIC184
, which stimulates innovation in the European market. Looking forward, it
would be expected that in a baseline scenario Action 4 would continue to guide research
beneficial to adaptation through these policy instruments. Yet the persistence of knowledge
gaps as highlighted in the 2018 evaluation and in this work, strongly suggests that knowledge
and innovation deficiencies will remain, for example in relation to nature-based solutions.
The impact of the 2013 Strategy on innovation would not be expected to vary with
temperature scenarios, although the need for innovation would increase.
Public authorities and budgets, measured by an indicator on public spending on adaptation:
At the moment, adaptation expenditures in public budgets are not transparently identified,
and are therefore difficult to assess. Actions 1 and 3 of the 2013 Strategy promote the
monitoring of adaptation expenditure at national and city level. Whilst some large cities, like
Paris, have established a comprehensive monitoring system within which different adaptation
183 COACCH (2019). The Economic Cost of Climate Change in Europe: Synthesis Report on Interim Results. Policy brief by the COACCH
project. Editors: Paul Watkiss, Jenny Troeltzsch, Katriona McGlade, Michelle Watkiss. 184 The Climate-KIC (Knowledge and Innovation Community) is supported by the EC European Institute of Innovation and Technology
(EIT).
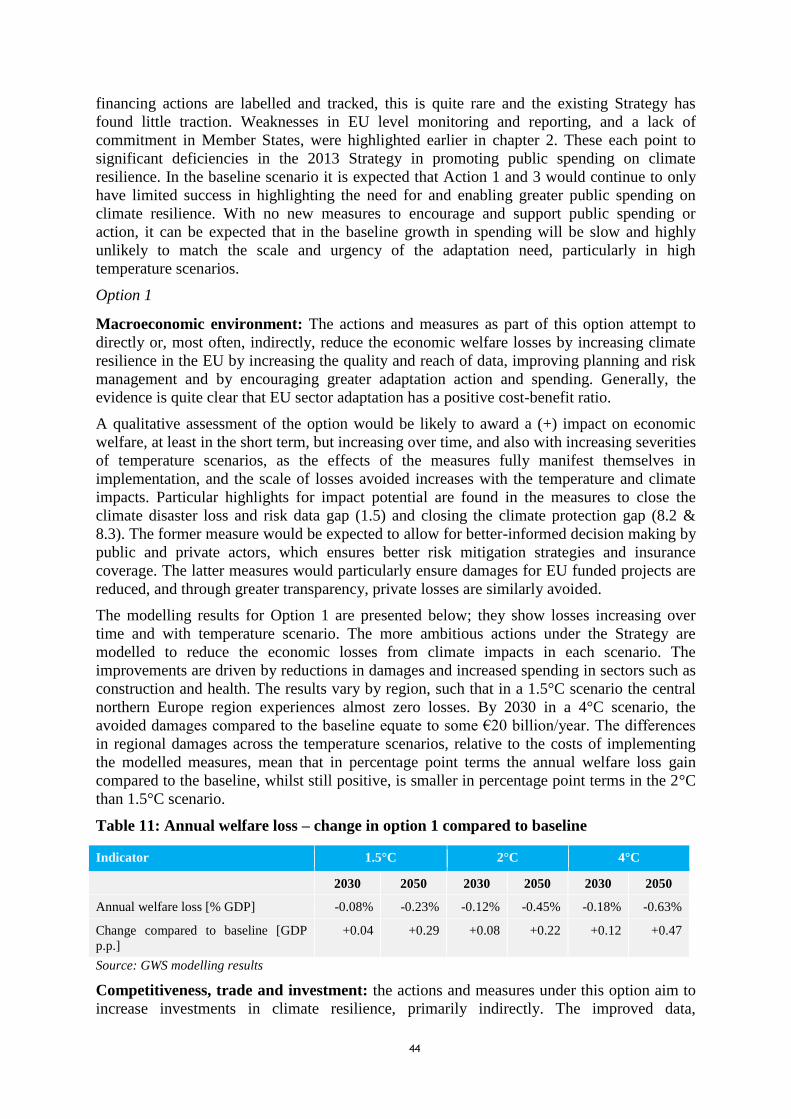
44
financing actions are labelled and tracked, this is quite rare and the existing Strategy has
found little traction. Weaknesses in EU level monitoring and reporting, and a lack of
commitment in Member States, were highlighted earlier in chapter 2. These each point to
significant deficiencies in the 2013 Strategy in promoting public spending on climate
resilience. In the baseline scenario it is expected that Action 1 and 3 would continue to only
have limited success in highlighting the need for and enabling greater public spending on
climate resilience. With no new measures to encourage and support public spending or
action, it can be expected that in the baseline growth in spending will be slow and highly
unlikely to match the scale and urgency of the adaptation need, particularly in high
temperature scenarios.
Option 1
Macroeconomic environment: The actions and measures as part of this option attempt to
directly or, most often, indirectly, reduce the economic welfare losses by increasing climate
resilience in the EU by increasing the quality and reach of data, improving planning and risk
management and by encouraging greater adaptation action and spending. Generally, the
evidence is quite clear that EU sector adaptation has a positive cost-benefit ratio.
A qualitative assessment of the option would be likely to award a (+) impact on economic
welfare, at least in the short term, but increasing over time, and also with increasing severities
of temperature scenarios, as the effects of the measures fully manifest themselves in
implementation, and the scale of losses avoided increases with the temperature and climate
impacts. Particular highlights for impact potential are found in the measures to close the
climate disaster loss and risk data gap (1.5) and closing the climate protection gap (8.2 &
8.3). The former measure would be expected to allow for better-informed decision making by
public and private actors, which ensures better risk mitigation strategies and insurance
coverage. The latter measures would particularly ensure damages for EU funded projects are
reduced, and through greater transparency, private losses are similarly avoided.
The modelling results for Option 1 are presented below; they show losses increasing over
time and with temperature scenario. The more ambitious actions under the Strategy are
modelled to reduce the economic losses from climate impacts in each scenario. The
improvements are driven by reductions in damages and increased spending in sectors such as
construction and health. The results vary by region, such that in a 1.5°C scenario the central
northern Europe region experiences almost zero losses. By 2030 in a 4°C scenario, the
avoided damages compared to the baseline equate to some €20 billion/year. The differences
in regional damages across the temperature scenarios, relative to the costs of implementing
the modelled measures, mean that in percentage point terms the annual welfare loss gain
compared to the baseline, whilst still positive, is smaller in percentage point terms in the 2°C
than 1.5°C scenario.
Table 11: Annual welfare loss – change in option 1 compared to baseline
Indicator 1.5°C 2°C 4°C
2030 2050 2030 2050 2030 2050
Annual welfare loss [% GDP] -0.08% -0.23% -0.12% -0.45% -0.18% -0.63%
Change compared to baseline [GDP
p.p.]
+0.04 +0.29 +0.08 +0.22 +0.12 +0.47
Source: GWS modelling results
Competitiveness, trade and investment: the actions and measures under this option aim to
increase investments in climate resilience, primarily indirectly. The improved data,

45
mainstreaming of climate resilience and other measures, are expected to encourage and
enable decision makers towards more resilient investment decisions. The benefit of this
would increase in higher temperature scenarios, as supply chain resilience would increase in
importance. As with the indicator for economic losses, particular highlights for impact
potential are found in the measures to close the climate disaster loss and risk data gap (1.5)
and close the climate protection gap (8.2 & 8.3). The former measure would allow
investments to better avoid or mitigate climate risks, and the latter measures would ensure
that EU investments take climate resilience more effectively into account and that private
investments are more transparent on their exposure to climate risks, encouraging more
resilient investment choices. Overall assessment of Option 1 impact: + (low temp. scenarios)
++ (high temp. scenarios)
Regulatory burden on businesses: The additional burdens and costs to private stakeholders
are estimated very low, as few of the actions and measures are mandatory. Requirements for
open data, improved access and greater transparency in reporting can impose additional costs
for (mostly) financial sector stakeholders compared to the baseline. These would be expected
to be more than offset by the benefits of improved data sharing and access, and also the co-
benefits of a number of other measures under Option 1, such as those with a focus on
improving workforce skills and developing sector specific knowledge; in addition, the overall
reduction in economic losses at the macroeconomic level could be expected to bolster
competitiveness of private stakeholders. The impact on non-financial SMEs is expected to be
a minor positive impact compared to baseline, as the resilience of the overall operating
environment increases. The cost impact would not change across temperature scenarios,
although the co-benefits to businesses of the measures would increase. Overall assessment of
Option 1 impact: -/0
Innovation and research: this option includes two actions (1 & 2) which directly address the
objective of improving knowledge of climate impacts and solutions, whilst a number of the
other actions also indirectly address knowledge, innovation and innovation adoption.
Specifically under action 1 the development of a Research, Development and Innovation
(RDI) roadmap and supporting models and tools will organise efforts towards specific
knowledge gaps. Furthermore, a variety of measures are designed to provide better, more
granular data, addressing the local level, and accessible to a broader audience, which will fill
gaps, spur further research and boost adaptation efforts and the adoption of measures. Efforts
under action 2 to improve the use of expert networks and provide exchange platforms would
be expected to increase the dissemination of relevant knowledge of climate risks and
solutions. In addition, measures under action 4 encourage further knowledge development,
and the piloting and adoption of adaptation measures, particularly nature-based solutions,
which can provide an important boost to innovation more broadly. No significant variation in
impact is expected in different temperature scenarios. The implementation of actions in
agriculture is stimulated by the EIP Agri185
operation groups and thematic focus groups in the
context of the Common Agricultural policy. Overall assessment of Option 1 impact: +
Public authorities and budgets: this option includes various actions with a strong focus on
public authorities, including under action 3 which focuses on strengthening their planning
and strategies, whilst bolstering and harmonising monitoring and reporting. Moreover, and
under action 5, this includes further technical support to local authorities and strengthening
the Covenant of Mayors, and other actions on mainstreaming that can bolster local action.
185 https://ec.europa.eu/eip/agriculture/en

46
The linking of EU funding to participation in the Covenant of Mayors and the consequent
encouragement of climate planning and action, would be expected to have an important
influence on public spending on climate resilience. In addition, the measures that provide
technical support, local data and mainstreaming of adaptation in other policies, mean that the
expertise, tools, data and resources available to public authorities will be improved.
Specifically, the sharing of higher quality disaster loss data will allow public authorities to
better target, plan and prepare their responses to climate disasters (see measure 1.5). Overall,
it can be expected that as a result climate resilience will be more readily taken into account
by public authorities and public spending which could be considered, as climate resilience
spending is likely to increase as a proportion of existing spending. The Option may also result
in greater public spending on resilience, as once plans are in place and reporting frameworks
established could incentivise their implementation. The Option does include measures that
will increase the costs incurred by public authorities, in terms of both increased reporting
requirements, or of additional resources needed to improve climate-related losses data
collection. The alignment and harmonisation of reporting, and further guidance and technical
support, will offset at least part of any additional costs. No significant variation in impact is
expected in different temperature scenarios. Overall assessment of Option 1 impact: ++
Option 2
Macroeconomic environment: The actions and measures as part of this option attempt to
directly or indirectly reduce the economic welfare losses by increasing climate resilience in
various ways. For reference, The EU’s green economy (i.e. environmental goods and services
for environmental protection and resource management is a small but growing segment of the
economy, providing ~ EUR 300 billion GVA per year (~ 2% of EU GDP) and 4.5 million
green jobs (ESTAT 2016 figures).
The macroeconomic impacts for the EU are not that strong for actions 9, 10 and 11, which
have a specific international focus. Whilst there are indirect benefits of reduced economic
losses in partner countries, these are addressed in the following indicator on competitiveness,
trade and investments. The main economic welfare benefits assessed derive indirectly from
action 12 which can bring gains and/or reduced losses for the forestry sector; from action 13
to close the climate protection gap, which will reduce overall macroeconomic exposure to
climate damages; and through action 14 which focuses on resilience in the water sector and
will serve to protect the sector itself and the multiple other sectors that are affected by it,
particularly agriculture, food and drink, services and manufacturing. These will each have
small positive macroeconomic effects. Overall the impact of Option 2 could be ranked as
(0/+), which when added to the (+) estimated for option 1, would result in a qualitative
assessment of a (+/++) impact on economic welfare. The impact of the option may increase
with higher temperature scenarios, as the scale of losses avoided increases with the
temperature and climate impacts.
Modelling of the impact of the option focuses on the potential changes in productivity and
damage avoidance to the land-based sectors (forestry, agriculture) as part of Action 12, the
other actions were not suitable for modelling. The quantitative results of the modelling show
the following impacts.
The modelling results for Option 2 are presented below; these are the same as for Option 1 as
the modelled measure for Option 2 does not have a significantly different impact at this level
of granularity. A small difference is observed for the connected employment impact.
Table 12: Annual welfare loss – change in option 2 compared to baseline
Indicator 1.5°C 2°C 4°C
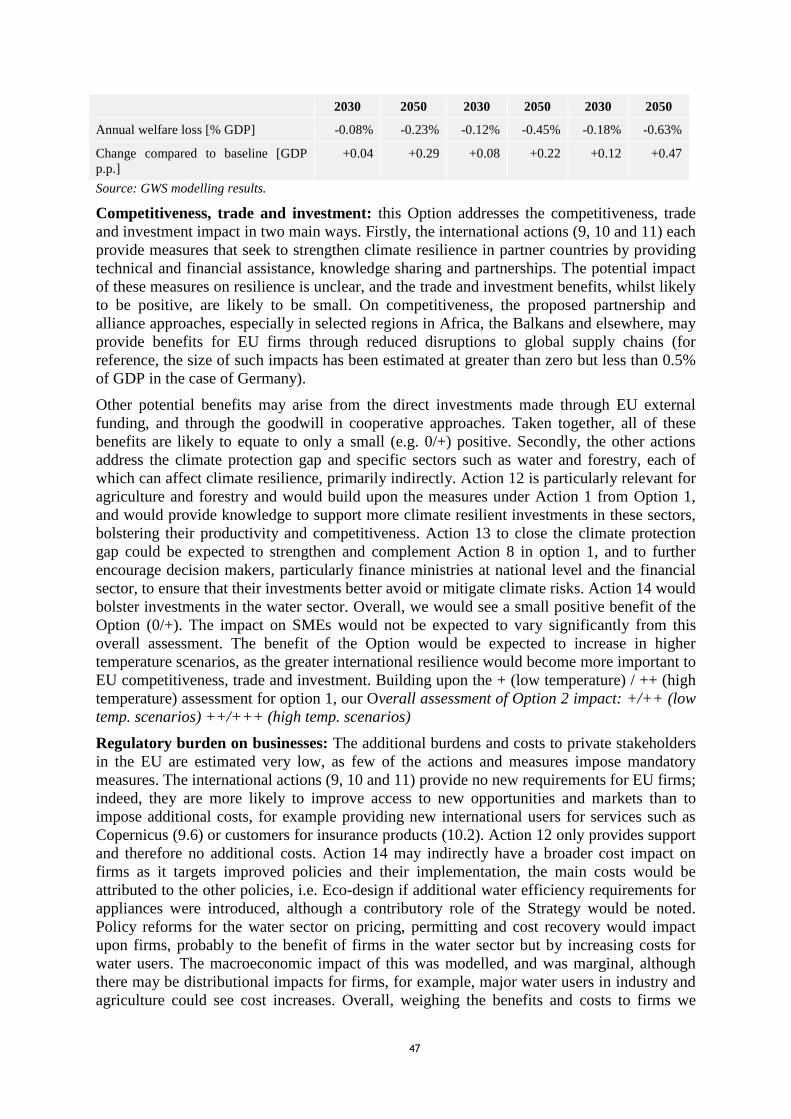
47
2030 2050 2030 2050 2030 2050
Annual welfare loss [% GDP] -0.08% -0.23% -0.12% -0.45% -0.18% -0.63%
Change compared to baseline [GDP
p.p.]
+0.04 +0.29 +0.08 +0.22 +0.12 +0.47
Source: GWS modelling results.
Competitiveness, trade and investment: this Option addresses the competitiveness, trade
and investment impact in two main ways. Firstly, the international actions (9, 10 and 11) each
provide measures that seek to strengthen climate resilience in partner countries by providing
technical and financial assistance, knowledge sharing and partnerships. The potential impact
of these measures on resilience is unclear, and the trade and investment benefits, whilst likely
to be positive, are likely to be small. On competitiveness, the proposed partnership and
alliance approaches, especially in selected regions in Africa, the Balkans and elsewhere, may
provide benefits for EU firms through reduced disruptions to global supply chains (for
reference, the size of such impacts has been estimated at greater than zero but less than 0.5%
of GDP in the case of Germany).
Other potential benefits may arise from the direct investments made through EU external
funding, and through the goodwill in cooperative approaches. Taken together, all of these
benefits are likely to equate to only a small (e.g. 0/+) positive. Secondly, the other actions
address the climate protection gap and specific sectors such as water and forestry, each of
which can affect climate resilience, primarily indirectly. Action 12 is particularly relevant for
agriculture and forestry and would build upon the measures under Action 1 from Option 1,
and would provide knowledge to support more climate resilient investments in these sectors,
bolstering their productivity and competitiveness. Action 13 to close the climate protection
gap could be expected to strengthen and complement Action 8 in option 1, and to further
encourage decision makers, particularly finance ministries at national level and the financial
sector, to ensure that their investments better avoid or mitigate climate risks. Action 14 would
bolster investments in the water sector. Overall, we would see a small positive benefit of the
Option (0/+). The impact on SMEs would not be expected to vary significantly from this
overall assessment. The benefit of the Option would be expected to increase in higher
temperature scenarios, as the greater international resilience would become more important to
EU competitiveness, trade and investment. Building upon the + (low temperature) / ++ (high
temperature) assessment for option 1, our Overall assessment of Option 2 impact: +/++ (low
temp. scenarios) ++/+++ (high temp. scenarios)
Regulatory burden on businesses: The additional burdens and costs to private stakeholders
in the EU are estimated very low, as few of the actions and measures impose mandatory
measures. The international actions (9, 10 and 11) provide no new requirements for EU firms;
indeed, they are more likely to improve access to new opportunities and markets than to
impose additional costs, for example providing new international users for services such as
Copernicus (9.6) or customers for insurance products (10.2). Action 12 only provides support
and therefore no additional costs. Action 14 may indirectly have a broader cost impact on
firms as it targets improved policies and their implementation, the main costs would be
attributed to the other policies, i.e. Eco-design if additional water efficiency requirements for
appliances were introduced, although a contributory role of the Strategy would be noted.
Policy reforms for the water sector on pricing, permitting and cost recovery would impact
upon firms, probably to the benefit of firms in the water sector but by increasing costs for
water users. The macroeconomic impact of this was modelled, and was marginal, although
there may be distributional impacts for firms, for example, major water users in industry and
agriculture could see cost increases. Overall, weighing the benefits and costs to firms we
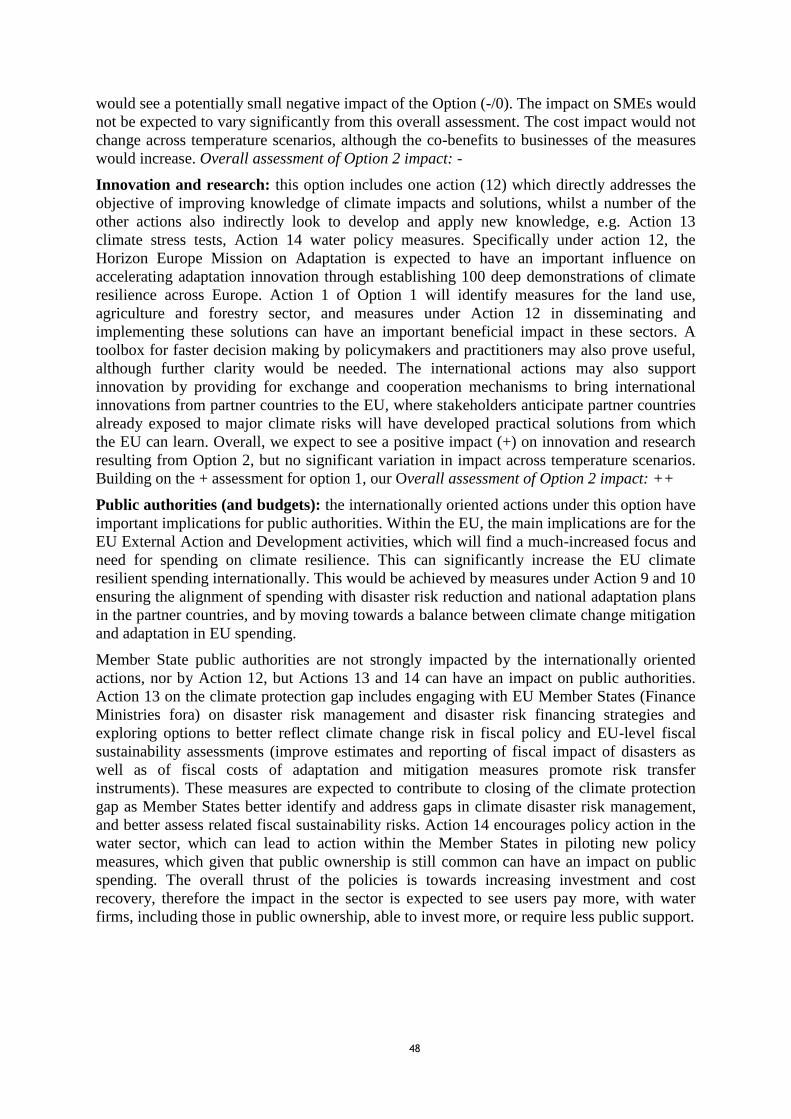
48
would see a potentially small negative impact of the Option (-/0). The impact on SMEs would
not be expected to vary significantly from this overall assessment. The cost impact would not
change across temperature scenarios, although the co-benefits to businesses of the measures
would increase. Overall assessment of Option 2 impact: -
Innovation and research: this option includes one action (12) which directly addresses the
objective of improving knowledge of climate impacts and solutions, whilst a number of the
other actions also indirectly look to develop and apply new knowledge, e.g. Action 13
climate stress tests, Action 14 water policy measures. Specifically under action 12, the
Horizon Europe Mission on Adaptation is expected to have an important influence on
accelerating adaptation innovation through establishing 100 deep demonstrations of climate
resilience across Europe. Action 1 of Option 1 will identify measures for the land use,
agriculture and forestry sector, and measures under Action 12 in disseminating and
implementing these solutions can have an important beneficial impact in these sectors. A
toolbox for faster decision making by policymakers and practitioners may also prove useful,
although further clarity would be needed. The international actions may also support
innovation by providing for exchange and cooperation mechanisms to bring international
innovations from partner countries to the EU, where stakeholders anticipate partner countries
already exposed to major climate risks will have developed practical solutions from which
the EU can learn. Overall, we expect to see a positive impact (+) on innovation and research
resulting from Option 2, but no significant variation in impact across temperature scenarios.
Building on the + assessment for option 1, our Overall assessment of Option 2 impact: ++
Public authorities (and budgets): the internationally oriented actions under this option have
important implications for public authorities. Within the EU, the main implications are for the
EU External Action and Development activities, which will find a much-increased focus and
need for spending on climate resilience. This can significantly increase the EU climate
resilient spending internationally. This would be achieved by measures under Action 9 and 10
ensuring the alignment of spending with disaster risk reduction and national adaptation plans
in the partner countries, and by moving towards a balance between climate change mitigation
and adaptation in EU spending.
Member State public authorities are not strongly impacted by the internationally oriented
actions, nor by Action 12, but Actions 13 and 14 can have an impact on public authorities.
Action 13 on the climate protection gap includes engaging with EU Member States (Finance
Ministries fora) on disaster risk management and disaster risk financing strategies and
exploring options to better reflect climate change risk in fiscal policy and EU-level fiscal
sustainability assessments (improve estimates and reporting of fiscal impact of disasters as
well as of fiscal costs of adaptation and mitigation measures promote risk transfer
instruments). These measures are expected to contribute to closing of the climate protection
gap as Member States better identify and address gaps in climate disaster risk management,
and better assess related fiscal sustainability risks. Action 14 encourages policy action in the
water sector, which can lead to action within the Member States in piloting new policy
measures, which given that public ownership is still common can have an impact on public
spending. The overall thrust of the policies is towards increasing investment and cost
recovery, therefore the impact in the sector is expected to see users pay more, with water
firms, including those in public ownership, able to invest more, or require less public support.

49
The Option does include measures that will increase the costs incurred by public
authorities186
, for the EU greater consideration of climate resilience in external finance will
require greater efforts and amendments to existing processes. The international cooperation
mechanisms, and creation of modelling tools, guidance, and monitoring and reporting
mechanisms for natural disaster insurance, will each require resources to establish and
implement. Costs to Member States are expected to be low and consist primarily in the time
and resources necessary to engage with the monitoring and reporting of natural disaster
insurance penetration, although it is noted that one of the measures (13.4) intends to
streamline these aspects. Other engagement will take place through existing fora.
No significant variation in impact is expected in different temperature scenarios. Overall, we
expect to see a positive impact (+) on innovation and research resulting from Option 2, but no
significant variation in impact across temperature scenarios. Building on the ++ assessment
for option 1, the Overall assessment of Option 2 impact is: +++
Social impacts
Option 0 (Baseline)
Employment: it has been estimated that up to 500,000 jobs could be created and a further
136,000 saved across the EU by 2050 in a reference scenario of some adaptation action
(which assumed, differently to this study, 0.5% of GDP spent on adaptation)187
, compared to
what would be expected in the absence of adaptation action. In an ambitious scenario,
(assuming 1% of GDP spent on adaptation) these impacts would increase further. The
impacts are net of the results from climate damages (and in some regions/cases benefits),
changes to labour productivity and investment in adaptation activities. However, the
development and take up of green jobs is heterogeneous across Members States, and they
experienced different patterns in the promotion of green skills and jobs188
.
The largest impacts are estimated in the sectors in which investment will be made
(construction) and those in which damages would be severe without action and which
therefore benefit most from greater resilience (manufacturing, public utilities, retail and
tourism). A few sectors in particular are likely to see the biggest investments and therefore
the largest net employment gains due to investment in climate change adaptation: water
management, construction, energy supply, and transport infrastructure. Analysis also suggests
that proportionally the largest employment gains will be in Central and Eastern Europe189
.
The modelling employed in this work includes an assumed effect of the 2013 Strategy and
make estimates of the baseline employment impact for 2030 and 2050. The modelled baseline
outputs for employment are presented below and show reductions in employment, with the
size of employment decline increasing over time and with temperature scenario to around
1.9% by 2050 in a 4°C scenario. Based on 2019 employment of 191 million people in the
EU, 1.9% represents around 3.6 million job losses. The percentage value demonstrates a
186 Assessment focused on the impact for the EU public authorities but note that the target of many of the actions of Option 2 is to strengthen
and support public authorities in partner countries and that significant support, finance and expertise will be provided to this end. This is
likely to have important beneficial impacts on climate resilience in partner countries and to encourage some matching increases in public spending on climate resilience in these countries. Part of the impact of this for the EU is seen above in the competitiveness, trade and
investment impact indicator. 187 Trinomics, TNO and Ricardo, for DG CLIMA (2014) Assessing the Implications of Climate Change Adaptation on Employment in the EU. Note: this study also models a baseline scenario of no adaptation action in which 410,000 jobs could be lost across the EU by 2050. 188 Cedefop (2019). Skills for green jobs: 2018 update. European synthesis report. Luxembourg: Publications Office. Cedefop reference
series; No 109. http://data.europa.eu/doi/10.2801/750438 189 Trinomics, TNO and Ricardo, for DG CLIMA (2014) Assessing the Implications of Climate Change Adaptation on Employment in
the EU
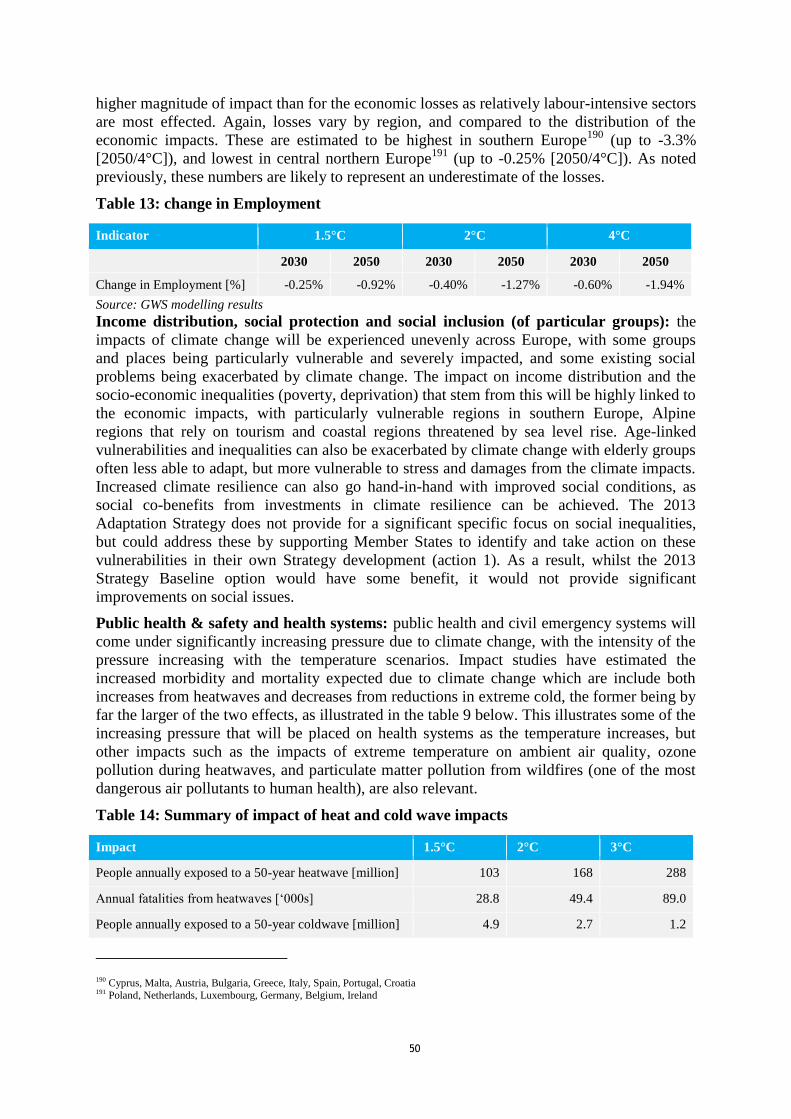
50
higher magnitude of impact than for the economic losses as relatively labour-intensive sectors
are most effected. Again, losses vary by region, and compared to the distribution of the
economic impacts. These are estimated to be highest in southern Europe190
(up to -3.3%
[2050/4°C]), and lowest in central northern Europe191
(up to -0.25% [2050/4°C]). As noted
previously, these numbers are likely to represent an underestimate of the losses.
Table 13: change in Employment
Indicator 1.5°C 2°C 4°C
2030 2050 2030 2050 2030 2050
Change in Employment [%] -0.25% -0.92% -0.40% -1.27% -0.60% -1.94%
Source: GWS modelling results
Income distribution, social protection and social inclusion (of particular groups): the
impacts of climate change will be experienced unevenly across Europe, with some groups
and places being particularly vulnerable and severely impacted, and some existing social
problems being exacerbated by climate change. The impact on income distribution and the
socio-economic inequalities (poverty, deprivation) that stem from this will be highly linked to
the economic impacts, with particularly vulnerable regions in southern Europe, Alpine
regions that rely on tourism and coastal regions threatened by sea level rise. Age-linked
vulnerabilities and inequalities can also be exacerbated by climate change with elderly groups
often less able to adapt, but more vulnerable to stress and damages from the climate impacts.
Increased climate resilience can also go hand-in-hand with improved social conditions, as
social co-benefits from investments in climate resilience can be achieved. The 2013
Adaptation Strategy does not provide for a significant specific focus on social inequalities,
but could address these by supporting Member States to identify and take action on these
vulnerabilities in their own Strategy development (action 1). As a result, whilst the 2013
Strategy Baseline option would have some benefit, it would not provide significant
improvements on social issues.
Public health & safety and health systems: public health and civil emergency systems will
come under significantly increasing pressure due to climate change, with the intensity of the
pressure increasing with the temperature scenarios. Impact studies have estimated the
increased morbidity and mortality expected due to climate change which are include both
increases from heatwaves and decreases from reductions in extreme cold, the former being by
far the larger of the two effects, as illustrated in the table 9 below. This illustrates some of the
increasing pressure that will be placed on health systems as the temperature increases, but
other impacts such as the impacts of extreme temperature on ambient air quality, ozone
pollution during heatwaves, and particulate matter pollution from wildfires (one of the most
dangerous air pollutants to human health), are also relevant.
Table 14: Summary of impact of heat and cold wave impacts
Impact 1.5°C 2°C 3°C
People annually exposed to a 50-year heatwave [million] 103 168 288
Annual fatalities from heatwaves [‘000s] 28.8 49.4 89.0
People annually exposed to a 50-year coldwave [million] 4.9 2.7 1.2
190 Cyprus, Malta, Austria, Bulgaria, Greece, Italy, Spain, Portugal, Croatia 191 Poland, Netherlands, Luxembourg, Germany, Belgium, Ireland
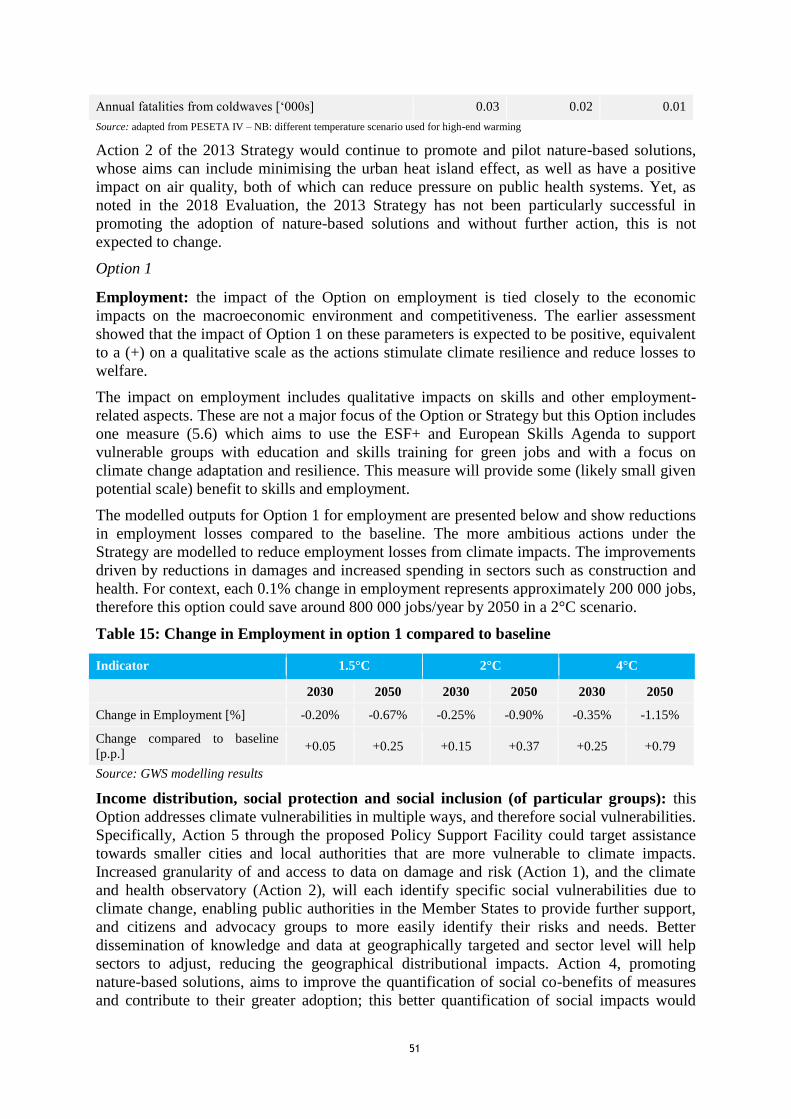
51
Annual fatalities from coldwaves [‘000s] 0.03 0.02 0.01
Source: adapted from PESETA IV – NB: different temperature scenario used for high-end warming
Action 2 of the 2013 Strategy would continue to promote and pilot nature-based solutions,
whose aims can include minimising the urban heat island effect, as well as have a positive
impact on air quality, both of which can reduce pressure on public health systems. Yet, as
noted in the 2018 Evaluation, the 2013 Strategy has not been particularly successful in
promoting the adoption of nature-based solutions and without further action, this is not
expected to change.
Option 1
Employment: the impact of the Option on employment is tied closely to the economic
impacts on the macroeconomic environment and competitiveness. The earlier assessment
showed that the impact of Option 1 on these parameters is expected to be positive, equivalent
to a (+) on a qualitative scale as the actions stimulate climate resilience and reduce losses to
welfare.
The impact on employment includes qualitative impacts on skills and other employment-
related aspects. These are not a major focus of the Option or Strategy but this Option includes
one measure (5.6) which aims to use the ESF+ and European Skills Agenda to support
vulnerable groups with education and skills training for green jobs and with a focus on
climate change adaptation and resilience. This measure will provide some (likely small given
potential scale) benefit to skills and employment.
The modelled outputs for Option 1 for employment are presented below and show reductions
in employment losses compared to the baseline. The more ambitious actions under the
Strategy are modelled to reduce employment losses from climate impacts. The improvements
driven by reductions in damages and increased spending in sectors such as construction and
health. For context, each 0.1% change in employment represents approximately 200 000 jobs,
therefore this option could save around 800 000 jobs/year by 2050 in a 2°C scenario.
Table 15: Change in Employment in option 1 compared to baseline
Indicator 1.5°C 2°C 4°C
2030 2050 2030 2050 2030 2050
Change in Employment [%] -0.20% -0.67% -0.25% -0.90% -0.35% -1.15%
Change compared to baseline
[p.p.] +0.05 +0.25 +0.15 +0.37 +0.25 +0.79
Source: GWS modelling results
Income distribution, social protection and social inclusion (of particular groups): this
Option addresses climate vulnerabilities in multiple ways, and therefore social vulnerabilities.
Specifically, Action 5 through the proposed Policy Support Facility could target assistance
towards smaller cities and local authorities that are more vulnerable to climate impacts.
Increased granularity of and access to data on damage and risk (Action 1), and the climate
and health observatory (Action 2), will each identify specific social vulnerabilities due to
climate change, enabling public authorities in the Member States to provide further support,
and citizens and advocacy groups to more easily identify their risks and needs. Better
dissemination of knowledge and data at geographically targeted and sector level will help
sectors to adjust, reducing the geographical distributional impacts. Action 4, promoting
nature-based solutions, aims to improve the quantification of social co-benefits of measures
and contribute to their greater adoption; this better quantification of social impacts would
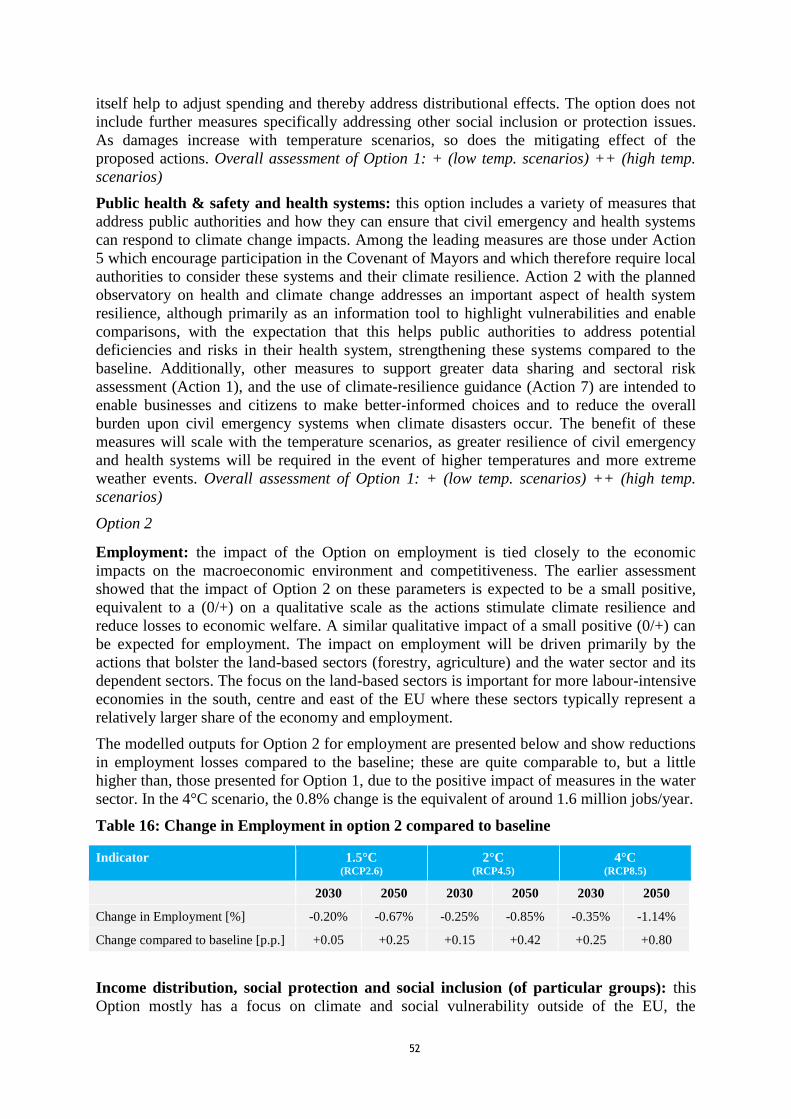
52
itself help to adjust spending and thereby address distributional effects. The option does not
include further measures specifically addressing other social inclusion or protection issues.
As damages increase with temperature scenarios, so does the mitigating effect of the
proposed actions. Overall assessment of Option 1: + (low temp. scenarios) ++ (high temp.
scenarios)
Public health & safety and health systems: this option includes a variety of measures that
address public authorities and how they can ensure that civil emergency and health systems
can respond to climate change impacts. Among the leading measures are those under Action
5 which encourage participation in the Covenant of Mayors and which therefore require local
authorities to consider these systems and their climate resilience. Action 2 with the planned
observatory on health and climate change addresses an important aspect of health system
resilience, although primarily as an information tool to highlight vulnerabilities and enable
comparisons, with the expectation that this helps public authorities to address potential
deficiencies and risks in their health system, strengthening these systems compared to the
baseline. Additionally, other measures to support greater data sharing and sectoral risk
assessment (Action 1), and the use of climate-resilience guidance (Action 7) are intended to
enable businesses and citizens to make better-informed choices and to reduce the overall
burden upon civil emergency systems when climate disasters occur. The benefit of these
measures will scale with the temperature scenarios, as greater resilience of civil emergency
and health systems will be required in the event of higher temperatures and more extreme
weather events. Overall assessment of Option 1: + (low temp. scenarios) ++ (high temp.
scenarios)
Option 2
Employment: the impact of the Option on employment is tied closely to the economic
impacts on the macroeconomic environment and competitiveness. The earlier assessment
showed that the impact of Option 2 on these parameters is expected to be a small positive,
equivalent to a (0/+) on a qualitative scale as the actions stimulate climate resilience and
reduce losses to economic welfare. A similar qualitative impact of a small positive (0/+) can
be expected for employment. The impact on employment will be driven primarily by the
actions that bolster the land-based sectors (forestry, agriculture) and the water sector and its
dependent sectors. The focus on the land-based sectors is important for more labour-intensive
economies in the south, centre and east of the EU where these sectors typically represent a
relatively larger share of the economy and employment.
The modelled outputs for Option 2 for employment are presented below and show reductions
in employment losses compared to the baseline; these are quite comparable to, but a little
higher than, those presented for Option 1, due to the positive impact of measures in the water
sector. In the 4°C scenario, the 0.8% change is the equivalent of around 1.6 million jobs/year.
Table 16: Change in Employment in option 2 compared to baseline
Indicator 1.5°C (RCP2.6)
2°C (RCP4.5)
4°C (RCP8.5)
2030 2050 2030 2050 2030 2050
Change in Employment [%] -0.20% -0.67% -0.25% -0.85% -0.35% -1.14%
Change compared to baseline [p.p.] +0.05 +0.25 +0.15 +0.42 +0.25 +0.80
Income distribution, social protection and social inclusion (of particular groups): this
Option mostly has a focus on climate and social vulnerability outside of the EU, the

53
international benefits of which are addressed in section 6.5. Through action 14 for the water
sectors, and to a lesser extent action 12 for the land-based sectors, the option can address
climate vulnerabilities in the EU linked to these issues. This can provide socio-economic
benefits to groups particularly vulnerable to damages from these sectors. However, the
measures in the water sector, if successful in encouraging better water pricing would add
costs to most households across the EU with negative impacts on low-income social groups.
It is unclear if compensating measures to address water saving would offset these additional
costs, but on balance it is likely Action 14 would have a small negative impact across the EU.
Nevertheless, the Horizon Europe Mission on Adaptation has a strong focus on issues of
equality and social justice, and as a result, the innovations, knowledge and pilots developed
under this initiative are likely to provide significant social impact. In addition, Action 13 aims
to address geographic inequalities by improving coverage for climate damages. Overall a
broad balance between the negative impact on water and the positive impact of the other
measures is assessed, so that the impact of Option 2 is scored as (0), which when added to the
(+) estimated for option 1 in low temperature scenarios and the ++ in high temperature
scenarios, would result in: Overall assessment of Option 2: + (low temp. scenarios) ++ (high
temp. scenarios)
Public health & safety and health systems: Actions 12, 13 and 14 each have measures that
indirectly address public health and safety systems, with a focus on the civil emergency more
than public health aspect. Action 12, through the Mission on Adaptation, aims to assess the
climate resilience of goals proposed under the Union Civil Protection Mechanism (UCPM)
and through the EU4Health programme contribute to the understanding of societal climate-
linked public health risks. Action 13 by engaging with finance ministries on climate
resilience is expected to result in Member States and then in-turn regional and local
authorities, to assess their climate vulnerabilities, and thereby to lead to greater protection
against financial impacts of climate damages. Action 14 on freshwater would both improve
the overall resilience of water companies and the water system, but would also ensure that
climate impacts are integrated into Water Safety Plans across the EU, which would improve
the preparedness of civil emergency services for water-related climate impacts. The benefit of
these measures will scale with the temperature scenarios, as greater resilience of civil
emergency and health systems will be required in the event of higher temperatures and more
extreme weather events. Overall, Option 2 is assessed as a further + impact in low and high
temperature scenarios, although the impact may also scale positively in high temperature
scenarios, which when added to Option 1 results in: Overall assessment of Option 2: ++ (low
temp. scenarios) +++ (high temp. scenarios)
Environmental impacts
Option 0 (Baseline)
Climate resilience: the key focus of the Adaptation Strategy is to improve climate resilience,
in line with the overarching objective of becoming ‘a climate-resilient society, fully adapted
to the unavoidable impacts of climate change, with reinforced adaptive capacity and minimal
vulnerability’. The actions and measures of the 2013 Strategy were designed to address
various aspects of this objective. The 2018 Evaluation of the Strategy examined progress
against the three specific objectives rather than the overarching objective, and found that
while substantial progress was being made, none of the three specific objectives had been
fully achieved, a deficiency in climate resilience being one of the logical outcomes thereof. In
the baseline scenario it is expected that similar deficiencies would remain, so that although
some progress would be made in improving knowledge, reinforcing planning and taking

54
actions, the actions and measures of the 2013 Strategy would be insufficient to address the
accelerating pace of climate change impacts and the need for action
Quality of natural resources/fighting pollution (water, soil, air etc.): climate change will
have significant impacts on natural resources such as water, air and soil, which are each
important for their functions for life, the economy, health and ecosystems. The 2013 Strategy
attempted to address these impacts mainly through actions and measures to promote nature-
based solutions, or through the assumption of co-benefits to natural resources from increased
climate resilience. Particularly under its Action 2 of the 2013 Strategy, the LIFE and Horizon
2020 programmes included projects to pilot nature-based solutions, with benefits to natural
resources. These types of projects and beneficial impacts would be expected to continue in
the baseline scenarios. The broader co-benefits to natural resources from the Strategy would
be quite indirect for most of the actions and measures in the 2013 Strategy, although there is
particular scope for these to be further addressed in the baseline via Action 3 and
consideration in the Covenant of Mayors of environmental quality and resource management
at city and regional level; similarly, through Actions 4 and 5 to further research and its
dissemination, and through Action 6 by mainstreaming adaptation into major EU spending
programmes and projects. Opportunities for further development were identified in the 2018
evaluation, such as with coastal protection and green and blue infrastructure, but these would
not be expected to be significantly addressed in the baseline.
Biodiversity, including flora, fauna, ecosystems and the services they provide and
landscapes: Closely linked to the natural resources indicator, the main avenues to address
this impact in the 2013 Strategy would be broadly the same, seeking primarily through
Action 2 to address biodiversity and ecosystems as part of the projects supported by the LIFE
programme, and more indirectly through the other actions. Whilst the baseline would
continue actions in these areas and lead to better outcomes for biodiversity and ecosystems
than no action, the co-benefits to this indicator would be limited.
Option 1
Climate resilience: the measures in Option 1 strengthen the Strategy and provide numerous
additional ways in which the original actions can contribute to increased climate resilience by
improving data, planning and management, and by supporting additional action by public and
private stakeholders. Action 1 contains measures that focus on improving and harmonising
monitoring, reporting and evaluation methodologies; by addressing these existing weaknesses
it is expected that public authorities and others will be better able to identify issues and gaps
in their planning and action, and to address these. Action 4 focuses on NbS, supporting their
piloting, dissemination and deployment; these measures directly benefit climate resilience
and often bring cost, social and environmental co-benefits. Action 5 can be particularly
powerful at increasing climate resilience of cities and local authorities, with a mix of
technical and methodological support, and reporting and funding requirements giving a
significant boost to planning and action on climate resilience. Actions 1 and 2 are more
indirect in their impact, but it is accepted that knowledge gaps are a major problem that
stakeholders need to address; therefore, these Actions, with measures that address these gaps
and weaknesses in multiple ways, are expected to empower many more stakeholders to take
action. Action 6, by further mainstreaming adaptation in EU programmes in the context of the
Green Deal and European Green Deal Investment Plan, would ensure increased availability
of multi-billion funding streams to address climate resilience. Action 7 will improve guidance
for climate resilient infrastructure and construction, and try to ensure these are used as widely
as possible, particularly within EU funded programmes such as TEN-E and TEN-T; this will
have an important benefit for long-term climate resilience for key infrastructure. Action 8, by

55
addressing the financial and public sector interface on climate resilience, is expected to
increase the appropriate assessment, pricing and coverage of climate risk by these
stakeholders, thereby increasing climate resilience.
The impact on climate resilience of the actions will be the same across temperature scenarios;
the increased beneficial impact of the increased resilience in higher temperature scenarios is
noted in the assessment of the other impact indicators. Overall assessment of Option 1: ++
Quality of natural resources/fighting pollution (water, soil, air etc.): the actions taken to
promote climate resilience often have co-benefits for the wider natural environment and
resources. Action 4 addresses the natural environment most directly, focusing on nature-
based solutions for climate resilience, with the types of solutions to be piloted and
disseminated having important benefits to natural resources. Action 5 contains measures that
will bring broader environmental quality and resources into closer focus at city and local
authority level. Other Actions and measures are also likely to bring indirect co-benefits for
natural resources and pollution control. Nevertheless, the impact of Option 1 on this indicator
is not assessed as large given the limited direct attention given to these impacts. The benefit
of the Option is expected to increase with the temperature scenario, as the beneficial impacts
on water especially would become more valuable. Overall assessment of Option 1: 0/+ (low
temp. scenarios) + (high temp. scenarios)
Biodiversity, including flora, fauna, ecosystems and the services they provide and
landscapes: the actions taken to promote climate resilience also often have co-benefits for
biodiversity and ecosystems. The support within Action 4 for nature-based solutions can be
expected to have beneficial impacts on biodiversity and ecosystems, as the use of these
solutions over ‘hard’ infrastructure or solutions provides more hospitable, less damaging
outcomes. The measures under Action 5, whilst bringing some benefit to environmental
quality and resources at city and local authority level, do not address biodiversity and
ecosystems as a headline objective. The other Actions and measures are likely to also
indirectly have co-benefits for biodiversity and ecosystems. The benefit of the Option is not
expected to significantly increase with temperature, as the beneficial impacts are quite small
and indirect. Overall assessment of Option 1: 0/+
Option 2
Climate resilience: within Option 2 the international actions focus primarily on increasing
climate resilience in partner countries, the benefits of which are assessed as part of the
crosscutting impacts. Nevertheless, there are measures within these actions, particularly
Action 11, that do focus on greater cooperation, exchange and learning for the EU from
partner countries, with China, India and the Balkan countries identified. Actions 12, 13 and
14 have a stronger focus on climate resilience in the EU. Action 12 and the Mission on
Adaptation is significantly geared towards the development and dissemination of knowledge
for climate resilience, including through deep demonstrations, this can have an important
impact. Action 13, addressing the climate protection gap, will better engage Member States
finance ministries and in-turn other public authorities to review and improve their National
Risk Assessments and to take actions to improve preparedness and protections. Action 14,
focusing specifically on the water sector will also have an important impact on resilience.
Overall, the climate resilience impact of this option is scored as a (+), added to Option 1,
which results in an overall assessment of Option 2: +++
Quality of natural resources/fighting pollution (water, soil, air etc.): the cross-boundary
nature of natural resources means that the international actions taken by the EU under Option
2 can also lead to co-benefits for these resources in the EU. Actions 9 and 11 include
56
measures supporting partner countries in their adaptation actions and mainstreaming
environmental and sustainability concerns into these, promoting ecosystem conservation and
restoration as a measure to boost resilience and measures to boost environmental concerns in
trade, each of which could indirectly provide co-benefits to natural resources in the EU.
Action 12 includes measures that specifically focus on land resources, particularly forests and
soils, with a focus on developing knowledge and innovations to improve the management and
resilience of these resources. In addition, Action 14 provides for a dedicated set of measures
to address water resources with a focus on improved, sustainable use and allocation of water,
and in improved management in disaster situations to reduce contamination risks. The
potential impact of these actions and measures is anticipated to be higher than Option 1,
given the specific focus and targeting of sustainability and natural resources, and is scored as
(+), increasing in high temperature scenarios to (+/++), added to Option 1, this results in an:
Overall assessment of Option 2 impact: +/++ (low temp. scenarios) ++/+++ (high temp.
scenarios)
Biodiversity, including flora, fauna, ecosystems and the services they provide and
landscapes: similar to the previous indicator there can be benefits to the EU from the cross-
boundary impacts of the international actions of this Option, but these are not expected to be
as strong as biodiversity and ecosystems are more localised, and therefore the impact
pathway is weaker. The co-benefits of international actions can provide for healthier
ecosystems in the EU and the conservation of ecosystems in partner countries that can be part
of EU species migration routes. The Mission on Adaptation in Action 12 includes an
alignment with the EU Biodiversity Strategy and therefore the solutions to be implemented
by this measure will provide benefits for ecosystems and biodiversity, particularly through
the deployment of nature-based solutions. Action 14 on water resources includes a focus on
securing environmental water flows and ensuring that environmental externalities are
included in water pricing, both of which can be powerful instruments to benefit ecosystem
quality and resilience. The potential impact of these actions and measures is anticipated to be
higher than for Option 1, given the specific focus and targeting of biodiversity and
ecosystems within actions 12 and 14, scoring a (+). In contrast to the assessment of option 1
and based on the more direct impact pathway of action 14, the benefits are expected to
increase in high temperature scenarios to (+/++). Added to Option 1, this results in an:
Overall assessment of Option 2 impact: +/++ (low temp. scenarios) ++/+++ (high temp.
scenarios)
Cross-cutting impacts
Option 0 (Baseline)
Impacts in 3rd
countries and international relations: The EU and its Member States have
taken on greater international commitments on adaptation and climate change through
various international treaties and programmes. For example, the EU and Member States are
committed under the Paris Agreement to continuing to scale up the mobilization of
international climate finance, as part of the developed countries' collective goal to jointly
mobilize USD 100 billion per year by 2020 through to 2025 for mitigation and adaptation
purposes. However, the 2013 Adaptation Strategy lacks alignment with these most recent
international policy developments. It therefore has very limited international focus with few
of the Actions having much more than minor avenues for international impact. In the baseline
scenario, this would be expected to result in neighbouring and partner countries to the EU
being less climate resilient than they would be with EU action. This has numerous
implications, including in the political and diplomatic sphere, where the EU’s global standing
57
could be reduced by lack of action in line with international treaties, and in the humanitarian
sphere, as greater numbers of people would suffer as climate impacts increased.
Beyond this, the potential spillover effects on the EU can also be significant, from the
economic impacts on trading partners reducing demand for EU goods and services, or the
impact on international supply chains. Security and migration concerns are also relevant, as
climate change could act as a threat multiplier and further exacerbate displacement of people,
and increase the risk of conflicts. PESETA IV indicated that it is very challenging to assess
these consequences, as detailed information is lacking. Other examples from sub-Saharan
Africa, South Asia and Latin America, suggest that the changing climate is expected to
displace more than 140 million people within their national borders by 2050192
. In the
baseline, there is a heightened risk of all of these impacts negatively affecting the EU and its
partners.
Option 1
Impacts in 3rd
countries and on international relations: this Option has very few measures
that take a specific international perspective. Some international benefits could induced by
the Option, for example through the changes in Action 3 to the Covenant of Mayors which
includes non-EU cities and a Policy Support Facility which would include an international
aspect; Actions 1 and 2 which provide data which can be globally useful; or Actions 6 and 7
which could mainstream climate resilience into funding and practice of EU programmes,
including those spending outside the EU. Whilst the latter Actions in particular can be
expected to have some impact, it is clear that only updating the existing actions of the 2013
Strategy does not significantly address the constraints and weaknesses of its international
impact as identified in the 2018 Evaluation. As a result, the impact on developing countries is
assessed as marginal, and as not significantly increasing with temperature scenario. Similarly,
the positive impact on international relations is minimal; indeed the lack of action may lead
to criticism of the EU, as well as increased humanitarian and emergency aid needs in third
countries (which are already only partially met). Overall assessment of Option 1 impact: 0/+
Option 2
Impacts in 3rd
countries and on international relations: one of the key aims of actions 9,
10 and 11 is to provide for a concerted set of measures to make EU international
commitments on adaptation an effective and visible part of the new Strategy. Action 9 takes a
strong focus on encouraging and supporting partner countries to improve their adaptation
arrangements, including a focus on disaster risk reduction, risk and vulnerability assessment
and strategy development. Action 10 is focused on the design of climate resilience supporting
policies and instruments and in the financing of such measures to support their
implementation, with the intention to use EU External Action and development aid to drive
significant resources to the adaptation issue in partner countries, at the very least ensuring
that EU spending in these countries is climate proof. Action 11 is intended to boost
engagement and cooperation for mutual benefit of the EU and partner countries, this is an
important diplomatic and political action, but can also bring practical lessons and benefits for
all participants. There is a particular focus on developing countries across these actions,
which is a natural focus given both the instruments to be used, the needs and the benefits for
the EU. Actions 12, 13 and 14 have no specific international dimension. Overall, Option 2,
with almost 20 proposed measures across three internationally targeted actions will already
192 Rigaud, K. K., Jones, B., Bergmann, J., Clement, V., Ober, K., Schewe, J., & Midgley, A. (2018). Groundswell: Preparing for Internal
Climate Migration. Washington, DC: World Bank.
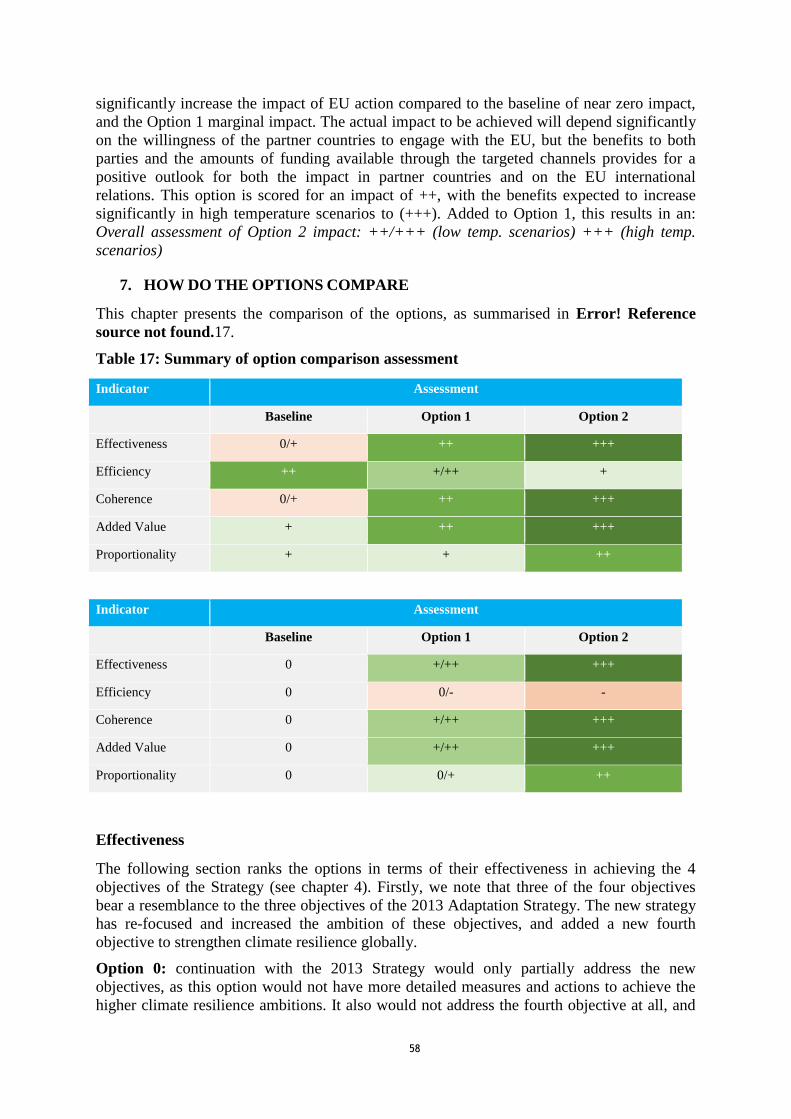
58
significantly increase the impact of EU action compared to the baseline of near zero impact,
and the Option 1 marginal impact. The actual impact to be achieved will depend significantly
on the willingness of the partner countries to engage with the EU, but the benefits to both
parties and the amounts of funding available through the targeted channels provides for a
positive outlook for both the impact in partner countries and on the EU international
relations. This option is scored for an impact of ++, with the benefits expected to increase
significantly in high temperature scenarios to (+++). Added to Option 1, this results in an:
Overall assessment of Option 2 impact: ++/+++ (low temp. scenarios) +++ (high temp.
scenarios)
7. HOW DO THE OPTIONS COMPARE
This chapter presents the comparison of the options, as summarised in Error! Reference
source not found.17.
Table 17: Summary of option comparison assessment
Indicator Assessment
Baseline Option 1 Option 2
Effectiveness 0/+ ++ +++
Efficiency ++ +/++ +
Coherence 0/+ ++ +++
Added Value + ++ +++
Proportionality + + ++
Indicator Assessment
Baseline Option 1 Option 2
Effectiveness 0 +/++ +++
Efficiency 0 0/- -
Coherence 0 +/++ +++
Added Value 0 +/++ +++
Proportionality 0 0/+ ++
Effectiveness
The following section ranks the options in terms of their effectiveness in achieving the 4
objectives of the Strategy (see chapter 4). Firstly, we note that three of the four objectives
bear a resemblance to the three objectives of the 2013 Adaptation Strategy. The new strategy
has re-focused and increased the ambition of these objectives, and added a new fourth
objective to strengthen climate resilience globally.
Option 0: continuation with the 2013 Strategy would only partially address the new
objectives, as this option would not have more detailed measures and actions to achieve the
higher climate resilience ambitions. It also would not address the fourth objective at all, and

59
this would be a significant deficiency. These deficiencies would become more apparent in
higher temperature scenarios. Option 0 overall assessment: 0/+
Option 1: by significantly deepening the existing actions and measures taken over from the
2013 Strategy, this option would constitute progress compared to baseline as shown in the
positive overall assessment of its impact on climate resilience. Yet Option 1 would not
address the fourth objective at all. Furthermore, it would not take full advantage of the
available knowledge instruments such as the Mission on Adaptation, nor would it fully
address all aspects of the climate protection gap or sector level needs, which would reduce its
potential to accelerate adaptation action. The lack of international actions would reduce the
effectiveness of this option in higher temperature scenarios when greater global cooperation
and resilience would be needed. Option 1 overall assessment: ++
Option 2: building on Option 1, this Option includes a suite of actions and measures that
specifically address the fourth objective for global climate resilience, and additionally it also
includes actions and measures which provide additional boosts to improving knowledge of
climate impacts and solutions, through the Mission on Adaptation, and in addressing
additional aspects of the climate protection gap and sector coverage. By addressing all
objectives, this option has the greatest impact on climate resilience, and would be particularly
beneficial in high temperature scenarios. Option 2 overall assessment: +++
Efficiency
As noted earlier in the assessment the Strategy imposes few additional mandatory obligations
or costs on non-EC stakeholders. The actions and measures are primarily voluntary and
provide assistance, support, knowledge, guidance, information and funding. Only in a few
cases do the proposed actions lead to costs for non-EC stakeholders, by affecting markets or
reporting requirements. In any case, the actions of the Strategy place an emphasis on
maximising co-benefits for stakeholders and society as a whole. The main expenditures,
which will require greater specification, fall upon the EC, with costs expected to be higher
than the baseline for Option 1 and higher again for Option 2.
Option 0: the existing actions of the 2013 Strategy impose few mandatory costs on non-EC
parties; this would not be expected to change. Therefore, whilst this option only partially
contributes to the objectives, it does so cost-efficiently. Option 0 overall assessment: ++
Option 1: the modifications to the existing actions of the 2013 Strategy would lead to some
additional spending by EC in various new programmes and initiatives. Cost estimates (see
chapter 6 and Annex 7) show that these are not likely to significantly increase the costs of the
Strategy. For example, the costs of the measure to establish a policy support facility (measure
5.4) are estimated at around €1.5 million. The move towards tying EC project funding to the
development of climate resilience plans would increase costs for public and private
stakeholders seeking EU funding, although the benefits of implementing the plans would be
expected to offset these costs. Increased reporting and monitoring requirements would also
increase costs for public authorities and a handful of financial sector stakeholders. Costs
would therefore be somewhat higher than baseline, but as the option is likely to be much
more effective, it remains quite cost efficient. Option 1 overall assessment: ++
Option 2: the additional actions of this Option address, largely, existing EC funds, e.g. in
development aid, or Horizon research spending, therefore the overall cost impact is neutral.
However, some of the new international actions and measures will require additional
resources and efforts by the EC to initiate and maintain, and the actions on the climate
protection gap will bring some additional reporting and engagement costs to Member States
and private stakeholders. The expenditure and investments required by the EC are expected to

60
be low, but higher than for Option 1. Finally, the action on water is likely to have significant
cost implications for users and the water industry. Overall, this option will cost the most, but
also delivers the most. Option 2 overall assessment: +
Coherence
Option 0: the 2013 Strategy was evaluated in 2018 to be adequately coherent with other EU
policies, but the developments in the policy context since 2018 such as the Climate Law and
European Green Deal stand out. There is a risk that this coherence would be reduced over
time and with insufficient flexibility within the Option to adjust to a changing policy
environment. This Option would not provide alignment with EU commitments under the
Paris Agreement and other international agreements. Option 0 overall assessment: 0/+
Option 1: the updated, deepened actions of Option 1 of the new Strategy would be much
more aligned with EU policy developments since 2018, including through measures
specifically designed to take advantage of and provide synergies with these developments. In
a similar way to Option 0, the main gap would be in the area of international climate policy
where the Option would not contribute to coherence. Option 1 overall assessment: ++
Option 2: in addition to the alignment with EU domestic policy noted for Option 1, this
option would provide an important additional alignment and coherence with other European
Green Deal policies (e.g. Biodiversity Strategy, Forest Strategy, Circular Economy Action
Plan, Zero Pollution Ambition) and well as international commitments and external policy
through the international actions. Option 2 overall assessment: +++
Added Value
Option 0: The rationale for EU added value was established and positively assessed in the
2018 evaluation: this would continue to be relevant, though the 2013 Strategy would become
increasingly deficient in addressing growing needs for transboundary cooperation and
contributing to EU international commitments. Option 0 overall assessment: +
Option 1: The updated, deepened actions would deliver more added value than the 2013
Strategy as shown in the effectiveness assessment; the improvements to the measures would
in particular improve the EU level added value of transboundary cooperation and knowledge
sharing. Option 1 overall assessment: ++
Option 2: The alignment of EU international action and addressing EU-wide problems
through the Mission on Adaptation and its deep demonstration and other projects, and
through sector-level measures such as Action 14, would provide significant additional EU
added value compared to other options. Option 2 overall assessment: +++
Proportionality
Option 0: The rationale for the proportionality of EU action was established for the 2013
Strategy and positively assessed in 2018. No changes would be expected, except perhaps that
the EU role could become disproportionately insufficient as climate impacts increase,
particularly in the international area. Option 0 overall assessment: +
Option 1: The deepening of actions and increase of outreach to local and citizen level moves
a step closer to what are usually regarded as Member State competencies, but remains within
the bounds of what the EC can and should do, complementing national action. It does not
impose significant new costs for public authorities and the voluntary and supporting nature of
the measures leaves the major responsibility for action and freedom to act with the relevant
national authorities. Option 1 overall assessment: +
61
Option 2: The additional international actions and measures increase the ambition of the
Strategy and fall under the umbrella of EU competences for External Action. The other
actions under this option also work proportionally under EU competences, through the
Horizon Europe programme, and sector policy on water (e.g. developing EU competencies
related to the Water Framework Directive). Option 2 overall assessment: ++
8. PREFERRED OPTION
Following the comparison of options in the previous chapters, Option 2 emerges as the
preferred option, as it is the most beneficial across the assessed impacts and criteria taking
account of the costs incurred and the expected benefits. In summary, Option 2 (the deepening
of existing actions supplemented with novel actions) adds greater ambition to the Union’s
actions on climate change adaptation, in particular with regard to international actions. Novel
actions that address the international dimension of the EU’s adaptation policy are needed to
progress on its objective to increase climate resilience globally. Moreover, international
actions also contribute to the Adaptation Strategy’s objective of ‘improving knowledge of
climate impacts and solutions’ by providing for exchange and cooperation mechanisms to
bring international innovations from partner countries to the EU. The other options do not
address this important international objective, and would hamper the EU approach to
adaptation.
Option 2 also ensures that the EU’s adaptation policies are aligned with broader EU policies
and the Commission priorities resulting from the European Green Deal. New actions to
reduce the climate protection gap and actions to increase transboundary cooperation address
Just Transition policy and the need to “build back better” after the COVID crisis. Moreover,
deepening actions to scale up private finance are aligned with the EU’s Renewed Strategy on
Sustainable Finance.
It follows from the summary tables in chapters 6 and 7 that option 2 does pose the highest
costs to business compared to the baseline and option 1. Overall, the additional burden and
costs to private stakeholders in the EU are estimated low, as few of the actions and measures
impose mandatory measures. Furthermore, the negative impact of higher costs is mitigated in
a few ways. Firstly, the Strategy provides a variety of guidance, support, data and funding
sources for firms that can help them take action on climate resilience and reduce their
exposure to damages. Secondly, this option has benefits across the whole macro-economic
environment, reducing the volume of economic losses. Finally, the costs of the Actions under
Option 2 (and 1) make use of existing funding infrastructure and knowledge platforms, such
as Climate-ADAPT, the Covenant of Mayors and the ESF+, reducing new burdens. Overall,
the additional costs are estimated proportional to the beneficial impacts achieved.
Similarly, the implementation of measures in option 2 may have some additional
administrative costs. These will be measured in the future impact assessments for
implementation of individual measures that will be announced in the strategy. We expect
these costs to be low to moderate and to be largely outweighed by the benefits of adaptation
action.
An intervention logic for the new EU Adaptation Strategy is presented below.

Figure 4 Intervention logic for the new EU Adaptation Strategy

63
9. HOW WILL ACTUAL IMPACTS BE MONITORED AND EVALUATED?
This impact assessment evaluates actions to further improve the resilience of the EU to the
impacts of climate change. Many of the actions under Option 2 are action oriented and
envisage immediate effects, while others anticipated to deliver their full effects in years to
come. Monitoring will be required not only to assess whether the actions defined in the
Strategy are on track but also to review the evolution of the global context and to determine
whether additional new measures need activation. The Adaptation Strategy is not a classical
case for monitoring and evaluation (neither for the baseline nor for the progress), the nature
of its key objective ‘climate resilient society’ is not something that can be measured
numerically. The long-term nature of both the problem being dealt with (climate change) and
the impact of the measures does not lend itself to tracking and evaluating the impact of the
Strategy.
Developments in adaptation tracking and indicators are somewhat limited, only a
handful of countries in Europe have developed frameworks to track their adaptation. The existing systems focus heavily on indicators that track the early parts of the adaptation
process, e.g. identifying climate change impacts and vulnerabilities, or on providing contextual
indicators on how the impacts may be felt. Work in Member States provides some useful
lessons to build on, and can help defining output and outcome indicators, that bridge the gap to
impact indicators.
At EU level, the implementation of the Governance Regulation and the mandate
assessment of progress as part of the Climate Law will provide an important new source
of information for monitoring and evaluation of progress. This would add to, and enrich,
the adaptation preparedness scoreboard exercise in 2017-2018, and the reporting under the
Monitoring Mechanism Regulation in 2015 and 2019. First reporting under the Governance
regulation will need to be assessed to consider how useful the information would be for
evaluation the Strategy. Refinements to reporting templates can be made in the future to
encourage MS to report the most useful information.
Indicators on public and private spending on adaptation can be valuable and can be
improved, taking advantage of the Taxonomy and international tracking. The gaps in
current data are addressed by actions in the Strategy and complementary policy initiatives.
Tracking of international adaptation climate finance, i.e. towards the $100 billion adaptation
fund goal, is currently more robust than most domestic public adaptation finance tracking.
Lessons can be learnt and indicators may be developed in this area. The taxonomy offers
potential for some simple tracking of spending towards adaptation.
Further development will be needed on the nature and purpose of indicators. Looking to
build indicators for which a time-series can be developed and indications of progress can be
made can already be an important step at this relatively early stage. Moving at a later stage
towards indicators more closely tied to and relevant to objectives could be valuable. Caution
also needs to be taken with numerical indicators, it is important to recognise that in many
cases, counting is not enough (e.g. whether a Member State has a NAS), as this misses
important issues and also potentially biases towards easy-to-measure, rather than relevant,
indicators. Quantitative indicators must be contextualised with qualitative analysis. Work of
the Global Commission on Adaptation will be useful for the definition of relevant
indicators193
.
193 See tables 1 and 2 especially in Leiter, T., Olhoff, A., Al Azar, R., Barmby, V., Bours, D., Clement, V.W.C., Dale, T.W., Davies, C., and Jacobs, H. 2019. “Adaptation metrics: current landscape and evolving practices”. Rotterdam and Washington,DC. Available online at
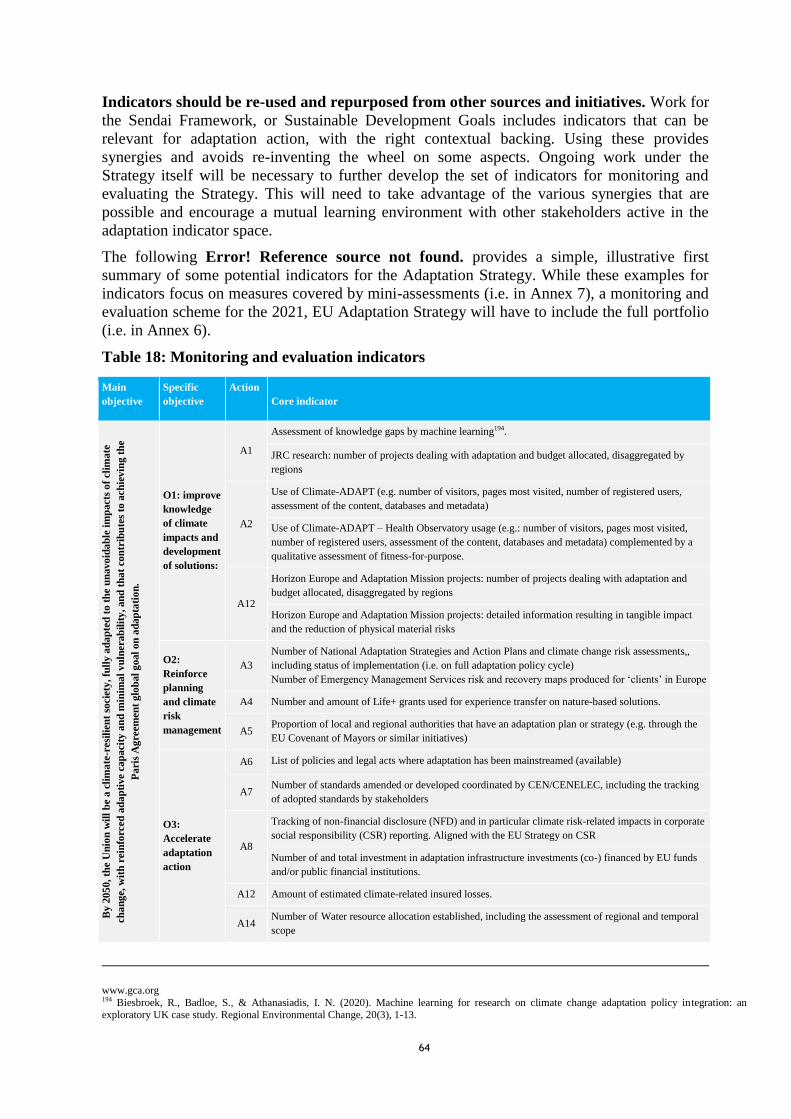
64
Indicators should be re-used and repurposed from other sources and initiatives. Work for
the Sendai Framework, or Sustainable Development Goals includes indicators that can be
relevant for adaptation action, with the right contextual backing. Using these provides
synergies and avoids re-inventing the wheel on some aspects. Ongoing work under the
Strategy itself will be necessary to further develop the set of indicators for monitoring and
evaluating the Strategy. This will need to take advantage of the various synergies that are
possible and encourage a mutual learning environment with other stakeholders active in the
adaptation indicator space.
The following Error! Reference source not found. provides a simple, illustrative first
summary of some potential indicators for the Adaptation Strategy. While these examples for
indicators focus on measures covered by mini-assessments (i.e. in Annex 7), a monitoring and
evaluation scheme for the 2021, EU Adaptation Strategy will have to include the full portfolio
(i.e. in Annex 6).
Table 18: Monitoring and evaluation indicators
Main
objective
Specific
objective
Action
Core indicator
By 2
05
0,
the U
nio
n w
ill
be
a c
lim
ate
-resi
lien
t so
cie
ty, fu
lly
ad
ap
ted
to t
he u
navo
ida
ble
im
pacts
of
clim
ate
ch
an
ge, w
ith
rein
forc
ed
ad
ap
tive c
ap
acit
y a
nd
min
ima
l v
uln
era
bil
ity
, an
d t
ha
t co
ntr
ibu
tes
to a
ch
ievin
g t
he
Pa
ris
Ag
reem
en
t g
lob
al
goal
on
ad
ap
tati
on
.
O1: improve
knowledge
of climate
impacts and
development
of solutions:
A1
Assessment of knowledge gaps by machine learning194.
JRC research: number of projects dealing with adaptation and budget allocated, disaggregated by
regions
A2
Use of Climate-ADAPT (e.g. number of visitors, pages most visited, number of registered users,
assessment of the content, databases and metadata)
Use of Climate-ADAPT – Health Observatory usage (e.g.: number of visitors, pages most visited,
number of registered users, assessment of the content, databases and metadata) complemented by a
qualitative assessment of fitness-for-purpose.
A12
Horizon Europe and Adaptation Mission projects: number of projects dealing with adaptation and
budget allocated, disaggregated by regions
Horizon Europe and Adaptation Mission projects: detailed information resulting in tangible impact
and the reduction of physical material risks
O2:
Reinforce
planning
and climate
risk
management
A3
Number of National Adaptation Strategies and Action Plans and climate change risk assessments,,
including status of implementation (i.e. on full adaptation policy cycle)
Number of Emergency Management Services risk and recovery maps produced for ‘clients’ in Europe
A4 Number and amount of Life+ grants used for experience transfer on nature-based solutions.
A5 Proportion of local and regional authorities that have an adaptation plan or strategy (e.g. through the
EU Covenant of Mayors or similar initiatives)
O3:
Accelerate
adaptation
action
A6 List of policies and legal acts where adaptation has been mainstreamed (available)
A7 Number of standards amended or developed coordinated by CEN/CENELEC, including the tracking
of adopted standards by stakeholders
A8
Tracking of non-financial disclosure (NFD) and in particular climate risk-related impacts in corporate
social responsibility (CSR) reporting. Aligned with the EU Strategy on CSR
Number of and total investment in adaptation infrastructure investments (co-) financed by EU funds
and/or public financial institutions.
A12 Amount of estimated climate-related insured losses.
A14 Number of Water resource allocation established, including the assessment of regional and temporal
scope
www.gca.org 194 Biesbroek, R., Badloe, S., & Athanasiadis, I. N. (2020). Machine learning for research on climate change adaptation policy integration: an exploratory UK case study. Regional Environmental Change, 20(3), 1-13.

65
Main
objective
Specific
objective
Action
Core indicator
O4:
Strengthen
climate
resilience
globally
A9 Monitoring Member State contributions by Adaptation Finance tracking in developing countries
A10
Number of and total private investment in adaptation investments (co-) financed by EU funds and/or
public financial institutions.
A11
Number of commitments made by EU Member States to engage with other Nations to increase the
bilateral exchange in knowledge and learning.

66
Annex 1: Procedural information
Lead DG, Decide Planning/CWP references
The Directorate-General (DG) for Climate Action was leading the preparation of this initiative
and the work on the Impact Assessment in the European Commission. The planning entry was
approved in Decide Planning under the reference PLAN/2020/7621. It is included in the 2020
Commission Work Programme under the policy objective “Commission contribution to
COP26 in Glasgow “.
Organisation and timing
The planned adoption date (Q3 2020) included in the Commission Work Programme adopted
on 29 January 2020, was changed to Q1 2021 in the revised version adopted on 27 May 2020
following the COVID-19 crisis. An inter-service steering group (ISSG) was established for
preparing this initiative, as well as several thematic sub-groups.
Consultation of the RSB
A draft Impact Assessment was submitted to the Regulatory Scrutiny Board (RSB) on 4
November 2020. Following the Board meeting on 2 December 2020, it issued a positive
opinion (with reservations) on 4 December 2020.
Several recommendations and feedback were made in the initial Impact Assessment Quality
Checklist, which have been incorporated in the final Impact Assessment. These include the
addition of a Glossary, indices of figures and tables, and a list of acronyms (in Annex 10).
Also in response to the Board’s feedback, several improvements and clarifications have been
made throughout the text, for example in the way modelling results were reported, or how the
expected degree of implementation of the proposed measures was integrated into the
assessment. The introduction of section 6 further details the voluntary take-up of measures and
compliance of parties – this is also expanded upon in Annex 7 for the mini-assessments. The
macroeconomic costs and benefits are evaluated together as part of the economic (welfare)
impact indicator, and the risks of higher damages are addressed by country in Annex 4 – with
relevant deviations from the average effect also noted in the full assessment in section 6. The
risks are also, importantly differentiated by temperature scenario (in section 6). Differences in
regional damages in different temperature scenarios and over time, compared to expenditures
influence the relative gain compared to baseline, in all scenarios there is positive change (as
damages increase with temperature, gains compared to baseline increase). This is particularly
relevant in Central Southern Europe (see Annex 4), where the timing and nature of damages
means that option 1 impacts more effectively in the 1.5 degree scenario than in the 2 degree
scenario - this was clarified in the report.
RSB Opinion 4 December 2020 [Ares(2020)7339457] – Positive with reservations
The Board notes the additional information provided in advance of the meeting and
commitments to make changes to the report. In forming its opinion, the Board took into
account that the impact assessment accompanies a high-level strategy, which raises particular
challenges in terms of proportionate level of analysis. However, the report still contains
67
significant shortcomings. The Board gives a positive opinion with reservations because it
expects the DG to rectify the following aspects:
(1) The report is not clear enough about what will be decided in this Strategy and which
actions will require separate (legislative) follow-up. It does not sufficiently specify what
actions should be taken at the EU-level, as opposed to national or local levels. It is not clear
to what extent the listed actions refer to new elements, or whether they are part of other
existing initiatives or programmes.
(2) There is a discrepancy between the positive outcome of the 2018 evaluation and the
problem description that identifies a lack of preparation for climate change impacts.
(3) It is not clear what an appropriate degree of preparedness would be, taking into account
the high degree of uncertainty on local climate change impacts.
The Board’s recommendations have been addressed in the final version of the Impact
Assessment as follows:
(1) The issues for decision in the Strategy have been clarified in the Introduction (Section 1.1),
and the Options description (Section 5). These pertain to the political choices on the level of
ambition, in line with the political mandate in the European Green Deal for a “new, more
ambitious EU strategy”.
The legal follow-up of certain of the actions, as well as the level at which these will be taken
has been clarified in Annex 7 (per the respective mini-assessment of each relevant action).
Several upcoming reviews (e.g. Urban Waste Water Treatment Directive) could see adaptation
mainstreaming reinforced. For other processes, legislative follow up was not deemed
necessary at this stage (e.g. there will be no revision of the Water Framework Directive
following its fitness check, so climate change adaptation will be reinforced via guidance for
the Common Implementation Strategy). Further work will require a pre-legislative follow up,
such as white papers or blueprints, but also pilots of initiative (e.g. trying out a pilot on loss
data collection before rolling it out in legislation).
Lastly, it has been clarified in Section 5, Policy Options, as well as the Annex 7 Mini-
assessments that all proposed actions and measures considered as part of the macro policy
options are referring to new elements, which would not otherwise be pursued. Several would,
however, be launched other already established instruments, like Horizon Europe, but the level
of detail would come in the programming stages, hence they would still be novel.
(2) The evaluation identified several shortcomings and room for improvement, in addition to
its positive assessment of the Strategy still being fit for purpose. The discrepancy between the
evaluation of the 2013 Strategy and the problem description justifying intervention for a new
Strategy was clarified in Section 2 Problem definition. Throughout the text (mainly in Section
5, where the 2013 Strategy acts as policy baseline), the articulation between the 2013 Strategy
and the new one has been further clarified.
(3) The adaptation gap is already large, as identified in global and European assessment
reports, and getting larger (both because impacts are increasingly prevalent and because
science is pushing our understanding of impacts e.g. on cascading impacts). This has been
clarified in Section 5 when dealing with the macro policy options, as well as further developed
68
in Section 9 (monitoring and evaluation). The Paris Agreement global goal on adaptation is a
dynamic one (i.e. enhancing adaptive capacity, strengthening resilience and reducing
vulnerability to climate change). As for any policy of disaster risk management (e.g.
pandemics, earthquakes), success of adaptation action is often invisible because it constitutes
averted damage (a counterfactual is difficult to construct). Dealing with climate impacts means
dealing with complexity, uncertainty, tipping points, cascading risk – adaptation to these
impacts therefore requires a dynamic implementation.
Annex 2: Stakeholder consultation – consultation synopsis
1. Outline of the consultation strategy
The ex-ante impact assessment of the new EU Adaptation Strategy supports the European
Commission’s efforts in updating the EU Adaptation strategy by: (1) Suggesting a range of
policy options to achieve specific objectives; (2) Analysing the likely economic, social and
environmental impacts of these options; and (3) Identifying the distributional aspects of
adaptation across the diverse climates and regions of the EU.
The outputs of the consultation activities’ form an important part of the evidence used to
complete the impact assessment. Key objectives of the consultation process were:
To ensure that all relevant stakeholders are identified and given the opportunity to engage
with the consultation
To provide the opportunity for stakeholders to inform the impact assessment, in
particular, offering an opportunity for them to inform the development of policy options
addressing the problems identified
To gather stakeholder opinion on the potential policy options together with data and
qualitative evidence concerning the relevant impacts of the policy options considered
To draw insights into triggers for behavioural changes and other triggers supporting the
take-up of adaptation measures
To provide insights for short analytical topic reports that were also developed as part of
the impact assessment process.
At the start of the impact assessment process, a comprehensive consultation strategy was
developed in order to ensure that the stakeholder consultation was effective and useful. The
consultation strategy helped to ensure that stakeholders’ views were sought on all key
questions in accordance with the requirements of the Better Regulation Guidelines.
Through various methods of engaging with stakeholders, the consultation informed the impact
assessment by providing answers to the following questions:
Are the problems identified in the previous strategy’s evaluation exhaustive? Have other
problems arisen which should be taken into consideration in the new EU Adaptation
Strategy? (Problem to be tackled)
What are other ongoing initiatives for adaptation at the local, regional, national and
international levels? What is the EU added value to existing efforts? Are other platforms
and/or levels of action more relevant for adaptation? Can the EU Adaptation Strategy’s
relevance and efficiency be threatened/enhanced by other actions and/or actors and/or
events? Does the EU Adaptation Strategy conflict/align with other EU international
engagements? (EU dimension)
69
Based on the 2013 EU Adaptation Strategy, what other interventions are needed, and what
are the policy options for these? Who should they reach? Where should the funding be
sourced? When should they be triggered? Which, if any, existing policies are deemed
redundant? (Available policy options, scope for efficiency improvement, simplification
measures)
Based on the 2013 EU Adaptation Strategy’s evaluation, have other unintended impacts
occurred since the evaluation and should be taken into consideration in the new EU
Adaptation Strategy? Based on future temperature and climate impact scenarios, what
policy implications can we foresee? How do those impacts and their magnitude differ
within the population? Across businesses? Across Member States’ borders? Across EU’s
borders? Across sectors of the economy? (Impacts of the policy options)
2. Consultation activities
The main consultation activities were the following: Open public consultation (OPC),
Targeted stakeholder engagement through interviews, Public webinar, and online stakeholder
workshops. Details of each of the consultation activities are provided below.
Open public consultation
An internet-based open public consultation was open for responses between 14 May 2020 and
20 August 2020, via the EC’s EU Survey system195
.
The OPC began with an introduction to the consultation and an initial set of background
questions about the respondent. The main body of the questionnaire contained 22 multiple-
choice questions. These consisted of statements, and respondents were asked about either their
familiarity with, or the perceived importance of, or their level of agreement with each of a set
of statements, using a scale, which was subsequently converted to Likert-scales of 5
options196
. The scales for all of the questions included ‘opt- out’ responses such as ‘Do not
know’ or ‘I am not familiar with’. This was to avoid agreement bias and to prevent
respondents feeling pressured to give an opinion that they may not feel qualified to give or are
uncomfortable providing. Finally, one open question at the end asked the respondent for any
further relevant feedback, information or opinions they wished to share. Respondents also had
the opportunity to upload any supporting documents (and were requested to summarise the
main ideas of these papers).
Targeted stakeholder interviews
In order to gather more detailed feedback, targeted stakeholder interviews were conducted
with key adaptation experts. In total, 40197
interviews were undertaken with key stakeholders.
Stakeholders were selected based on their field of expertise, their country of origin and in
order to ensure coverage of a range of stakeholder categories. Categories represented include
businesses; EU institutions, civil society/NGOs; research and academia; local authorities,
195 https://ec.europa.eu/info/law/better-regulation/have-your-say/initiatives/12381-EU-Strategy-on-Adaptation-to-Climate-Change 196 The questions on extent of familiarity, importance and agreement with statements were accompanied by the possibility of selecting from a
0-5 scale (6-point). However, 6-point scales present interpretation difficulties, as a ‘neutral’ response is not available. In contrast, 5-point
Likert scales are more widely used and enable clearer interpretation of questionnaire results, measuring respondents’ agreement with statements. For
this reason, revised interpretation scales were agreed on with the European Commission and have been used in the analysis. Full details of the
methodology that has been used are provided in Appendix 1.A. 197 The 40 interviews are calculated as follows: A total of 31 interviews were conducted. Two interviews were organised as group discussions
with multiple participants, who were intentionally interviewed for representing different Member States and thematic focuses. Given that each
of those interviewees provided different inputs to each interview questions, their contribution was analysed as separate interviews. As a result, the total number of interviews feeding in feedback from stakeholders representing different organisations is treated as being 40.
70
regional authorities and national authorities; development banks and other international
organisations.
The selection ensured a representative coverage of all geographical, thematic and stakeholder
categories across the EU. The interviews were conducted between March and October 2020
and were sequenced as follows:
17 preliminary interviews were undertaken to provide general directions in support of
the initial identification of the impact assessment policy options. These interviews also
helped to test the interview questionnaire and the method.
18 main interviews were then targeted at stakeholders with specific expertise on the
preliminary policy options identified.
Finally, five final gap-filling interviews were undertaken to address any gaps
identified in thematic, geographical or stakeholder coverage identified at the end of
the “main interview stage” and to help finalising the impact assessment.
Public webinar
A public webinar was held for two hours, on 2 July 2020. This included presentations from
key experts in the field, a panel discussion with these experts and a question and answer
(Q&A) session with the audience. The event featured a presentation by the consultants on the
planned method for impact assessment and the preliminary findings from the OPC. The
webinar aimed to raise awareness of the development of the new EU Adaptation Strategy, the
challenges it seeks to address and the added value of EU action. It was also used to promote
the OPC to the audience.
Online stakeholder workshops
Interactive online discussions with targeted stakeholders took place in a two hour-long online
workshop on 3 July 2020. This included breakout sessions to discuss potential policy options put
forward by the consultants building on the Commission’s Inception Impact Assessment (IIA).
A similar interactive online workshop was held on 7 July 2020, with members of the Working
Group 6 (WG6) on Climate Adaptation of the Climate Change Committee of the European
Commission. Breakout sessions were also organised to discuss the potential policy options put
forward by the consultants building on the IIA.
The two workshops allowed for discussion of the detailed policy options and the interactive
discussions between experts and facilitators from the breakout groups sought to gather feedback
and further suggestions on potential actions that could be included in the new Strategy.
3. Stakeholder groups participating
An overview of the audience reached across the stakeholder consultation activities is presented
in the figures below. A comprehensive stakeholder mapping exercise was undertaken at the
start of the impact assessment which helped to ensure that stakeholders who could be affected
by the policy; will implement it; or have a stated interest in it were engaged.
Figure 5 shows the total number of participants of each activity, while Figure 6 and Figure 7
show the share of participants by stakeholder type. Due to the pre-set tools used for the OPC,
stakeholder categories have been defined differently for that consultation activity (Figure 7).
Finally, Figure 8 shows the share of participants by Member State.
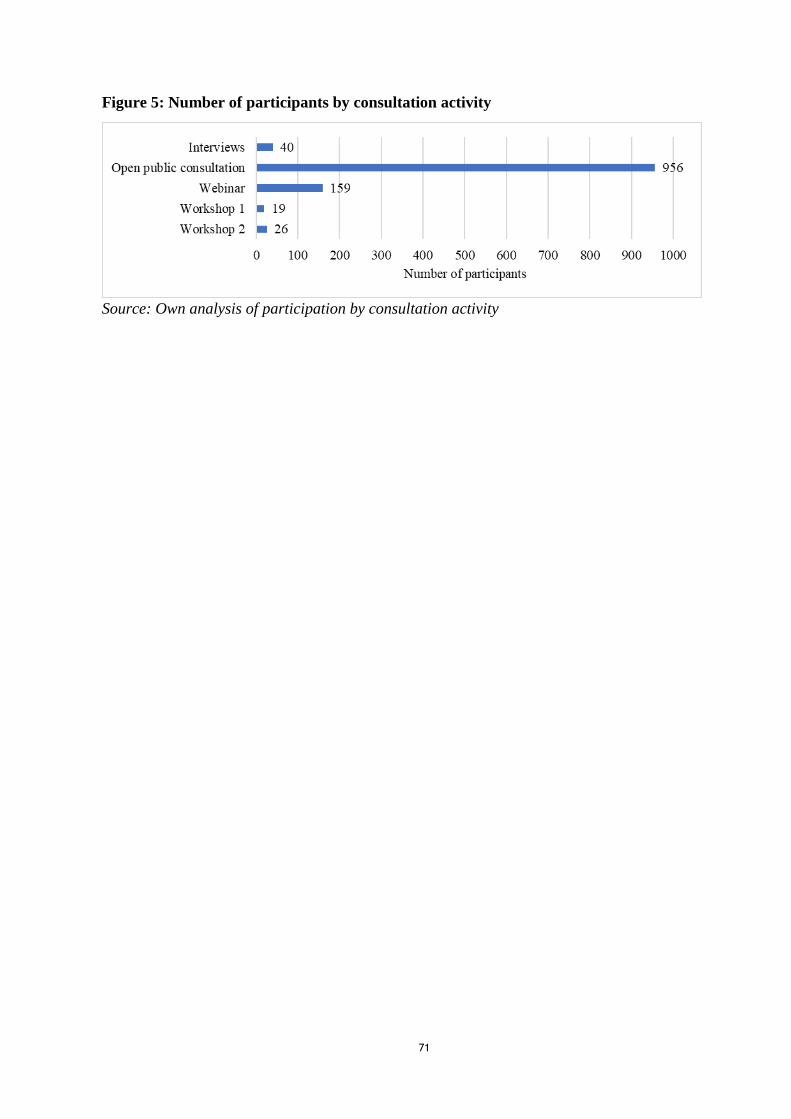
71
Figure 5: Number of participants by consultation activity
Source: Own analysis of participation by consultation activity
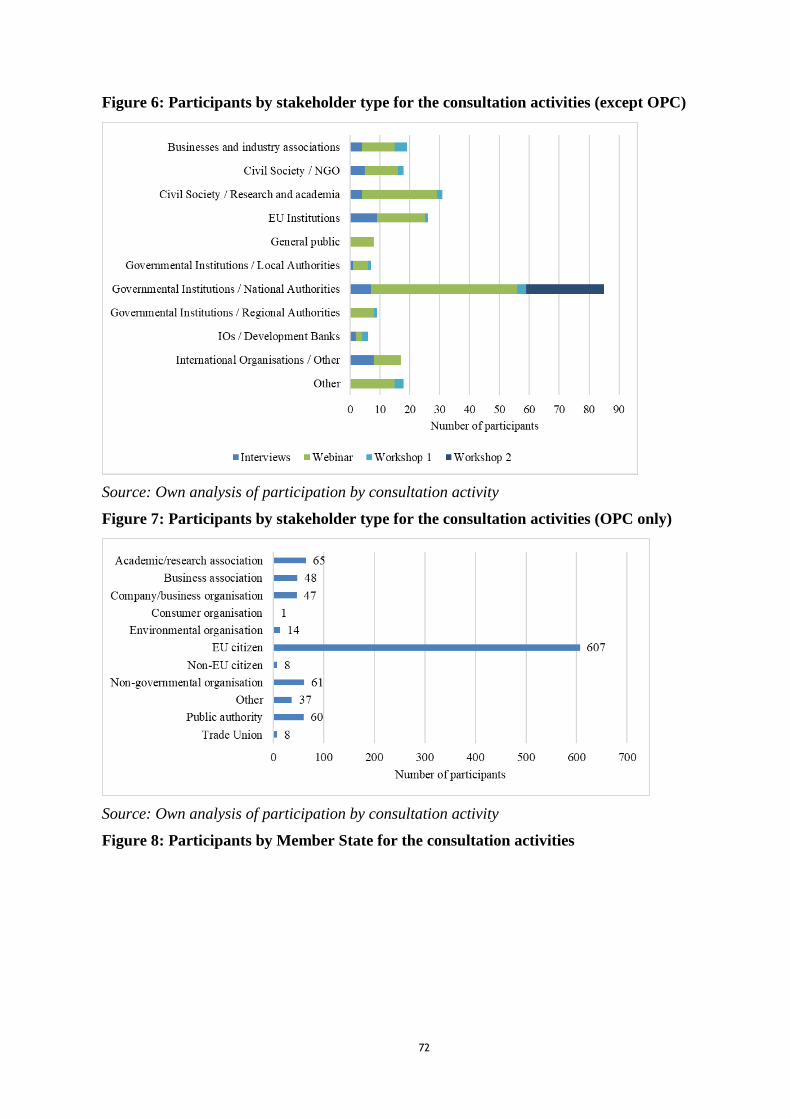
72
Figure 6: Participants by stakeholder type for the consultation activities (except OPC)
Source: Own analysis of participation by consultation activity
Figure 7: Participants by stakeholder type for the consultation activities (OPC only)
Source: Own analysis of participation by consultation activity
Figure 8: Participants by Member State for the consultation activities
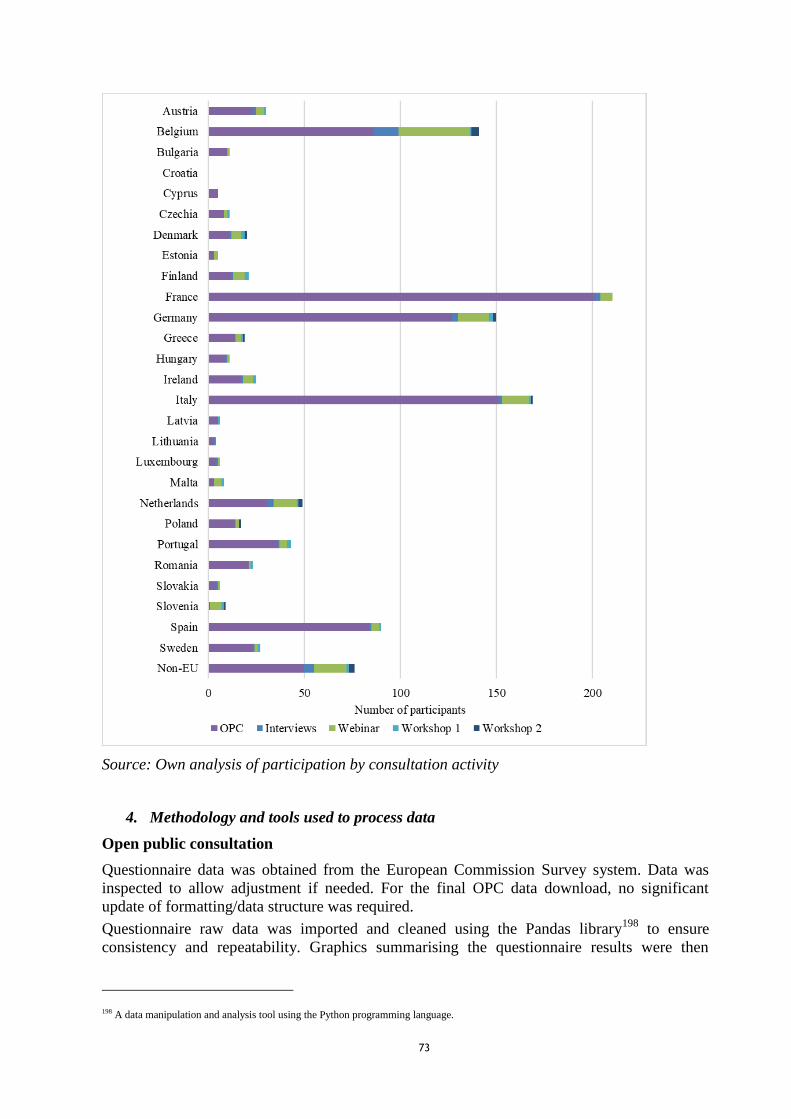
73
Source: Own analysis of participation by consultation activity
4. Methodology and tools used to process data
Open public consultation
Questionnaire data was obtained from the European Commission Survey system. Data was
inspected to allow adjustment if needed. For the final OPC data download, no significant
update of formatting/data structure was required.
Questionnaire raw data was imported and cleaned using the Pandas library198
to ensure
consistency and repeatability. Graphics summarising the questionnaire results were then
198 A data manipulation and analysis tool using the Python programming language.
74
created using an in-house survey analysis tool developed by Ricardo Plc based on Matplotlib
charting library in python.
Qualitative information collected through the OPC was analysed through a labelling system in
Excel. Those labels were identified based on the topics most covered in the respondents’
answers to open text questions, and on their position papers’ summaries. They are listed in the
box below.
Box 19: List of labels representing most frequently mentioned areas of action
List of labels representing most frequently mentioned areas of action
Agriculture and fisheries; Air quality; Biodiversity and ecosystems; Businesses; Cities;
Communication/ Citizen involvement/ Behavioural change (henceforth “Citizen
communication and involvement”); Disaster risk reduction; Energy; EU Added value;
Finance/ Funding; Forest; Health; Impacts; Infrastructure; Insurance; International
dimension; Mainstreaming/ climate proofing/ integration of actions (henceforth
“Mainstreaming/ proofing/ integration”); Monitoring/ reporting and guidelines; Nature based
solutions; Ocean; Other; Regional approaches; Standards/ standardisation; Technology and
knowledge sharing; Transport; Waste; Water.
Additional labels used to identify non-relevant responses: Emotive; Irrelevant; Mitigation
focused.
In addition, the responses to the final open text question were systematically checked for
overlapping responses to indicate possible coordinated replies by groups of respondents. Each
question’s open text answers were checked against all other open text responses in terms of
their textual similarity by checking the cosine similarity of all answers against all other
answers in python. This simple mathematical algorithm can be used to interpret text and is
resilient to slight wording changes between similar answers. The algorithm was calibrated to
identify similarities among any set of three or more responses.
Stakeholder and expert interviews and events
Trends identified based on the OPC analysis were verified against interview, webinar and
workshop notes.
Interviews
A contact pool was developed in collaboration with the Commission to identify key
stakeholders across all types of stakeholders and geographic regions. Some contacts were also
reused from the evaluation of the 2013 EU Adaptation Strategy.
Prior to reaching out to the potential interviewees an interview questionnaire was developed
which was tested as part of the preliminary phase of the interviews. The questionnaire was
revised for the main and gap-filling interviews.
Stakeholders were contacted via the central email address and were invited for an interview,
which was conducted via Microsoft Teams. In those cases where the interviewees agreed, the
interviews were recorded in order to help the interviewer to better capture the discussion.
Interview notes were taken and shared with the interviewees for approval.
Workshop and webinars
The webinar took place on GoToWebinar while the workshops were held through the Zoom
platform, to benefit from the functionalities allowing breakout sessions, question and answer
sessions, hand raising and polling features. An invitation to register was shared through the
consultants’ network and on social media. The stakeholders who were consulted during the
75
evaluation of the current Adaptation Strategy were also invited. Interviewees consulted as part
of this impact assessment were also directly invited via email. Panellists for the webinar were
selected, with the agreement of the Commission, to represent various stakeholder groups and
governance levels.
Several test sessions were organised amongst the consultants and with DG CLIMA to ensure
the functioning of the platforms. Detailed facilitators notes were developed for the project
team to help the smooth running of each event.
All participants were required to register through a site hosted by the consultants, featuring a
link to the consultant’s privacy note199
. In advance of the webinar, participants were sent
background documents including the Blueprint for the new Adaptation Strategy, the Inception
Impact Assessment and a link to the OPC. Similarly, a concept note was shared with
participants in advance of the workshops. After the events, presentation slides and recordings
were disseminated to attendees and workshop notes were sent to the panellists for approval.
5. Results of consultation activities
For each element of the impact assessment (problem drivers and problems, objectives and
actions, and impacts), we first present the most relevant results from the OPC, identifying the
answers that have received the most and the least support. When presenting those results, we
identify the percentage of responses in relation to each answer. We then compare the OPC
results to inputs received from the experts interviewed and the workshops, identifying key
similarities and differences. Unless specified otherwise, inputs from interviews and workshop
is reported in this section when it represents the views of the majority of participants and
interviewees.
Additional individual inputs and inputs provided by a minority of stakeholders are recorded in
the appendices accompanying this consultation synopsis: full details of the analysis of the
OPC results are provided in Appendix 1.A. An overview of the stakeholder interviews is
presented in Appendix 2.A. While notes from the stakeholder events are provided in Appendix
3.A. A full list of accompanying appendices is provided at the end of this annex.
Problem drivers and specific problems identified for the new EU Adaptation Strategy
Results from the OPC
Problem drivers: climate change
According to their responses to the OPC200
, stakeholders have most often experienced
seasonal shifts (94.8%), abnormally warm overall temperatures/droughts during one or
more seasons (93%), and heatwaves causing health problems and death among the
vulnerable (74.8%). Water-related events, such as a reduction in water availability (60%) and
river and coastal floods (70%), were less reported in the survey. Most of the respondents have
not experienced the disappearance of glaciers’ long-lasting snowfields (54.6%201
), seaside
storm surges (47.2%), intrusion of seawater in freshwater aquifers (44.2%) and emergence of
tropical diseases (42.5%).
These results may reflect the fact that seasonal shifts and warm overall temperatures/droughts
can be easily and/or frequently witnessed by the respondents, or that they tend to associate
199 https://ee.ricardo.com/climate-change/impact-assessment-for-the-new-eu-adaptation-strategy 200 See Figure 3-5 and Figure 3-6 in Appendix 1.A accompanying the consultation synopsis presenting the analysis of the OPC. 201 Percentage refer to the proportion of respondents that have provided a negative answer to the specific statement (here, “disappearance of glaciers’ long-lasting snowfields”)
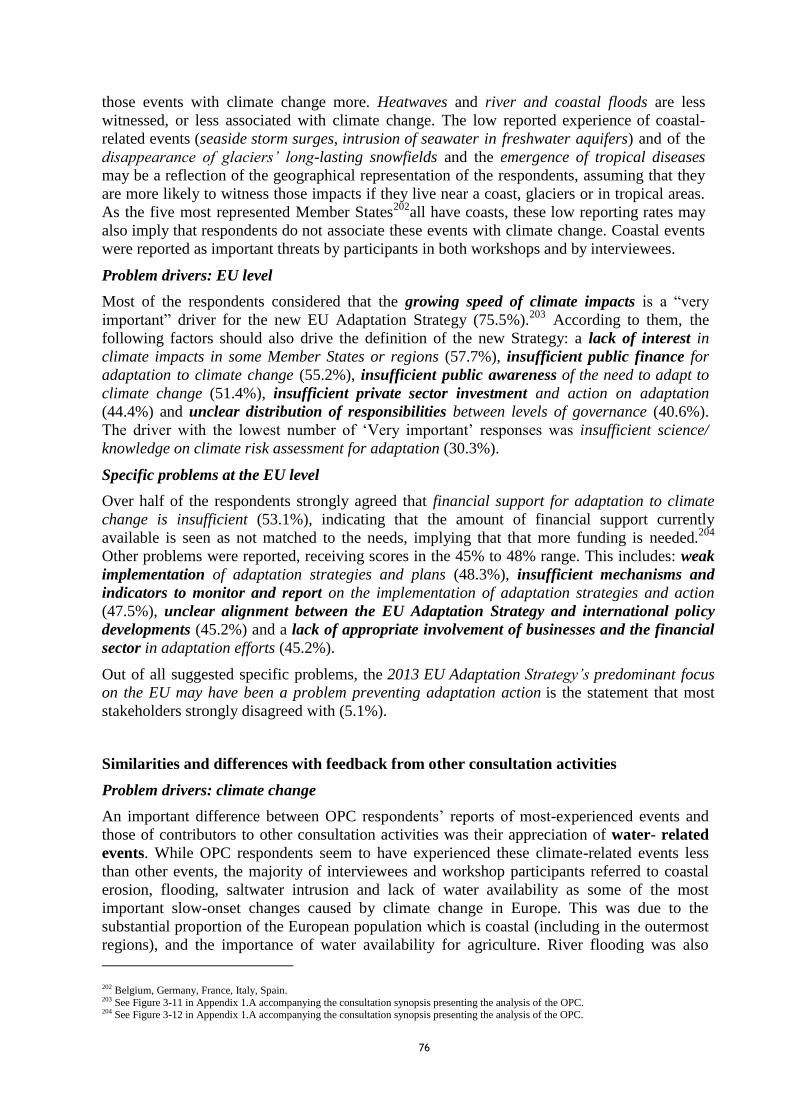
76
those events with climate change more. Heatwaves and river and coastal floods are less
witnessed, or less associated with climate change. The low reported experience of coastal-
related events (seaside storm surges, intrusion of seawater in freshwater aquifers) and of the
disappearance of glaciers’ long-lasting snowfields and the emergence of tropical diseases
may be a reflection of the geographical representation of the respondents, assuming that they
are more likely to witness those impacts if they live near a coast, glaciers or in tropical areas.
As the five most represented Member States202
all have coasts, these low reporting rates may
also imply that respondents do not associate these events with climate change. Coastal events
were reported as important threats by participants in both workshops and by interviewees.
Problem drivers: EU level
Most of the respondents considered that the growing speed of climate impacts is a “very
important” driver for the new EU Adaptation Strategy (75.5%).203
According to them, the
following factors should also drive the definition of the new Strategy: a lack of interest in
climate impacts in some Member States or regions (57.7%), insufficient public finance for
adaptation to climate change (55.2%), insufficient public awareness of the need to adapt to
climate change (51.4%), insufficient private sector investment and action on adaptation
(44.4%) and unclear distribution of responsibilities between levels of governance (40.6%).
The driver with the lowest number of ‘Very important’ responses was insufficient science/
knowledge on climate risk assessment for adaptation (30.3%).
Specific problems at the EU level
Over half of the respondents strongly agreed that financial support for adaptation to climate
change is insufficient (53.1%), indicating that the amount of financial support currently
available is seen as not matched to the needs, implying that that more funding is needed.204
Other problems were reported, receiving scores in the 45% to 48% range. This includes: weak
implementation of adaptation strategies and plans (48.3%), insufficient mechanisms and
indicators to monitor and report on the implementation of adaptation strategies and action
(47.5%), unclear alignment between the EU Adaptation Strategy and international policy
developments (45.2%) and a lack of appropriate involvement of businesses and the financial
sector in adaptation efforts (45.2%).
Out of all suggested specific problems, the 2013 EU Adaptation Strategy’s predominant focus
on the EU may have been a problem preventing adaptation action is the statement that most
stakeholders strongly disagreed with (5.1%).
Similarities and differences with feedback from other consultation activities
Problem drivers: climate change
An important difference between OPC respondents’ reports of most-experienced events and
those of contributors to other consultation activities was their appreciation of water- related
events. While OPC respondents seem to have experienced these climate-related events less
than other events, the majority of interviewees and workshop participants referred to coastal
erosion, flooding, saltwater intrusion and lack of water availability as some of the most
important slow-onset changes caused by climate change in Europe. This was due to the
substantial proportion of the European population which is coastal (including in the outermost
regions), and the importance of water availability for agriculture. River flooding was also
202 Belgium, Germany, France, Italy, Spain. 203 See Figure 3-11 in Appendix 1.A accompanying the consultation synopsis presenting the analysis of the OPC. 204 See Figure 3-12 in Appendix 1.A accompanying the consultation synopsis presenting the analysis of the OPC.
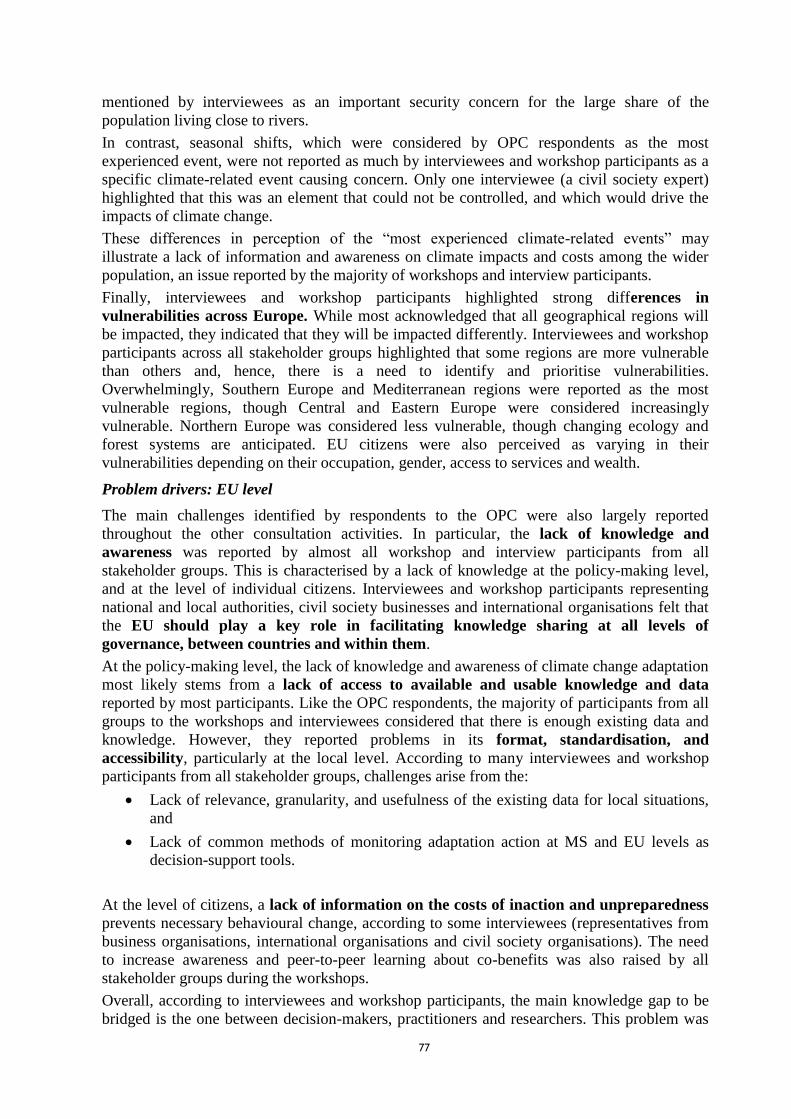
77
mentioned by interviewees as an important security concern for the large share of the
population living close to rivers.
In contrast, seasonal shifts, which were considered by OPC respondents as the most
experienced event, were not reported as much by interviewees and workshop participants as a
specific climate-related event causing concern. Only one interviewee (a civil society expert)
highlighted that this was an element that could not be controlled, and which would drive the
impacts of climate change.
These differences in perception of the “most experienced climate-related events” may
illustrate a lack of information and awareness on climate impacts and costs among the wider
population, an issue reported by the majority of workshops and interview participants.
Finally, interviewees and workshop participants highlighted strong differences in
vulnerabilities across Europe. While most acknowledged that all geographical regions will
be impacted, they indicated that they will be impacted differently. Interviewees and workshop
participants across all stakeholder groups highlighted that some regions are more vulnerable
than others and, hence, there is a need to identify and prioritise vulnerabilities.
Overwhelmingly, Southern Europe and Mediterranean regions were reported as the most
vulnerable regions, though Central and Eastern Europe were considered increasingly
vulnerable. Northern Europe was considered less vulnerable, though changing ecology and
forest systems are anticipated. EU citizens were also perceived as varying in their
vulnerabilities depending on their occupation, gender, access to services and wealth.
Problem drivers: EU level
The main challenges identified by respondents to the OPC were also largely reported
throughout the other consultation activities. In particular, the lack of knowledge and
awareness was reported by almost all workshop and interview participants from all
stakeholder groups. This is characterised by a lack of knowledge at the policy-making level,
and at the level of individual citizens. Interviewees and workshop participants representing
national and local authorities, civil society businesses and international organisations felt that
the EU should play a key role in facilitating knowledge sharing at all levels of
governance, between countries and within them.
At the policy-making level, the lack of knowledge and awareness of climate change adaptation
most likely stems from a lack of access to available and usable knowledge and data
reported by most participants. Like the OPC respondents, the majority of participants from all
groups to the workshops and interviewees considered that there is enough existing data and
knowledge. However, they reported problems in its format, standardisation, and
accessibility, particularly at the local level. According to many interviewees and workshop
participants from all stakeholder groups, challenges arise from the:
Lack of relevance, granularity, and usefulness of the existing data for local situations,
and
Lack of common methods of monitoring adaptation action at MS and EU levels as
decision-support tools.
At the level of citizens, a lack of information on the costs of inaction and unpreparedness
prevents necessary behavioural change, according to some interviewees (representatives from
business organisations, international organisations and civil society organisations). The need
to increase awareness and peer-to-peer learning about co-benefits was also raised by all
stakeholder groups during the workshops.
Overall, according to interviewees and workshop participants, the main knowledge gap to be
bridged is the one between decision-makers, practitioners and researchers. This problem was
78
widely reported among international organisations and civil society. Other knowledge gaps
reported by stakeholders across all stakeholder groups are gaps between EU Member States,
with countries internationally, and vertically between levels of governance.
Specific problems at the EU level
A frequently reported barrier was the weak implementation of adaptation action, sometimes
perceived by participants as “Member States inertia”. More specifically, participants mainly
from international organisations and civil society representatives pointed to the lack of formal
commitments to adaptation (especially in comparison to mitigation commitments), the lack of
clear political targets and commitments, the lack of mechanisms and indicators to monitor and
report implementation, and the lack of alignment of standard practices. Some stakeholders,
including civil society representatives but also stakeholders from EU institutions considered
that this lack of implementation may result from the lack of binding laws and/or constraints
or from the lack of centralised knowledge to build political case for adaptation. During
the workshops, implementation in Member States was also discussed, with specific attention
on how it should be monitored and reported. Participants in all consultation activities
expressed an interest in the EU providing consistent guidelines and indicators for monitoring
and reporting on adaptation.
A lack of funding was also identified by several interviewees (representing business
organisations, civil society, EU institutions, local authorities, national authorities and
international organisations) as a barrier to adaptation in the EU, though it was suggested that
this may not be due to differing priorities and commitments. During the webinar, a panellist
from an international organisation highlighted a further challenge to funding: ensuring that it
trickles down to all sectors and can be leveraged to increase resilience. Overall, lack of
funding was discussed less during interviews and workshops than implementation by Member
States and the availability of knowledge and data. However, an interviewee from EU
institutions identified the importance of making more funding available to implement
measures at the local level, which is consistent with further feedback received from the
workshops and the OPC.
Overall, interviewees and workshop participants highlighted the following additional
challenges, which were not reported by OPC respondents (challenges are listed in order from
the most to least reported):
Insufficient consideration for the international dimensions of climate change
adaptation. According to many interviewees and workshop participants, the current
strategy looks inward rather than also outwards. As a result, both interviewees and
workshop participants reported a lack of focus on spill-over effects of adaptation
(citing supply chain disruptions, climate migration, etc.), insufficient EU support for
adaptation in third countries, and a missed opportunity to share knowledge globally,
including learning from third countries currently experiencing more severe impacts.
Insufficient coherence of adaptation across EU policies. Workshop participants and
interviewees particularly mentioned the Common Agriculture Policy (CAP) and
Cohesion Policy. Other policies reported by interviewees as lacking coherence with
adaptation objectives included the Water Framework Directive. Lack of consideration
of potentially conflicting actions across such policy areas that could lead to
maladaptation was pointed out by interviewees and workshop participants.
Lack of certainty in the projections of climate impacts. According to workshop
participants, prospects of acting on uncertainty may be causing inertia. An interviewee
highlighted the need for a more proactive approach and the importance of preparing
and planning before adverse impacts arise.

79
Disconnect between climate change and climate security in European public
discourse. A few participants reported that that the security impacts of climate change
mainly affect vulnerable populations in poor countries, but that this is not a sustainable
view.
Insufficient focus on ecosystem-based adaptation and nature-based solutions,
including in the CAP.
Lack of long-term planning. Current action plans and policies were reported as
tending to be very short term, whereas adaptation also demands consideration of longer
time horizons (20-50 years).
Insufficient differentiation between slow onset and extreme weather events.
Too much focus on cities rather than local action more generally, as there is a need to
increase local resilience and, thereby, reduce inward migration to cities.
An insufficient focus on the adaptation-mitigation nexus. Some interviewees
highlighted that mitigation and adaptation should be considered as an overarching
synergistic objective.
While drivers of, and challenges to, the new EU Adaptation Strategy were not explicitly
discussed in the workshop, the challenges identified above were raised in the context of the
EU Adaptation Strategy’s existing actions and the need for new actions. Hence, they are also
reflected in the results presented below.
Objectives and actions of the new of the new EU Adaptation Strategy
Results from the OPC
Identification of objectives
According to OPC respondents, it is most important for the new EU Adaptation Strategy to
be aligned with the following EU and international policies: The Paris Agreement
(71.8%), the European Green Deal (69.4%), the UN Sustainable Development Goals
(62.2%) and the UN Convention of Biological Diversity (60.0%)205
. Fewer respondents
rated the Sendai Framework for Disaster Risk Reduction and the EU Civil Protection
Mechanism as important. This may indicate less concern for, and/or awareness of, the
immediate security issues needing to be addressed by climate change adaptation and an
insufficient appreciation of the “virtual certainty” (IPCC AR5) of the increasing frequency
and magnitude of extreme events as global mean temperatures rise.
Most respondents strongly agreed that an increased focus on implementation (in addition
to planning) is also needed (74.9%).206
The objective to increase focus on innovation (in
addition to research) had the lowest number of ‘Strongly agree’ responses (52.2%). This
echoes respondents’ identification that enough knowledge and solutions are available to
adapt to climate change now, indicating no need for further innovation and planning, but
rather a need for financing and action.
Among more specific objectives, most respondents strongly agreed that the EU should
support Member State-level action on adaptation (59.3%).207
EU support at the local level
also received strong support, though less than support at Member State level.
205 See Figure 3-10 in Appendix 1.A accompanying the consultation synopsis presenting the analysis of the OPC. 206 See Figure 3-13 in Appendix 1.A accompanying the consultation synopsis presenting the analysis of the OPC. 207 See Figure 3-14 in Appendix 1.A accompanying the consultation synopsis presenting the analysis of the OPC.

80
Respondents indicated that the lack of private sector investment and action on adaptation
should be a driver of the strategy. However, EU support to private sector action on
adaptation received the least support from respondents (33.1%). This may imply that
respondents would prefer to see public investment and actions compensate for the lack of
financing from private sources, rather than the EU Adaptation Strategy supporting its
development.
Identification of actions
Existing actions
Respondents mostly identified the water, agriculture, energy, and transport sectors as
well as ecosystems as requiring further action for sustainable adaptation to climate
change.208
Most of them neither agreed nor disagreed with implementing further action in
the insurance and finance sector, supporting the previous conclusion on the importance of
public action to make up for, rather than support, private actions.
Respondents agreed that all actions of the 2013 EU Adaptation Strategy should be “retained
and reinforced”209
.210
Action 1: Encourage all Member States to adopt comprehensive
adaptation strategies, received the highest level of support from respondents (74.2%),
which reflects responses received strongly agreeing with the objective to support Member
State-level action on adaptation. The action that fewest respondents suggested continuing
was Action 8: Promote insurance and other financial products for resilient investment and
business (9.6%). This may be due to a lack of awareness of it, as indicated in the previous
answers. It may also result from most insurance products only covering a narrow range of
climate-related risks, as indicated by EU citizens, businesses and NGOs alike.
Potential new actions
All potential actions for a new EU Adaptation Strategy suggested as part of the consultation
were considered important by respondents. The action that was considered “very important”
by most of the stakeholders was to support the resilience of agriculture and forest
ecosystems (65.2%), which reflects the priority sectors identified previously.211
In
addressing this action, nature-based solutions and diversification of systems were
considered the most important elements for climate-resilient agriculture and forests by the
respondents.
The second highest level of support for an action was for more open access to climate loss
and disaster risk data from private and public sources to allow all actors to take an active
role in adaptation action and to help integrate climate risks in decision-making (51%).
Hence, while stakeholders previously replied that knowledge and data already exists, they
indicated here that this data may not be sufficiently available. In another question, the
majority of respondents indicated that, out of all the stakeholder categories, citizens should
have the greatest priority for easier access to asset-specific information about the
physical and economic damage from past climate related disasters (101/133), then local
authorities (94/133).212
208 See Figure 3-16 in Appendix 1.A accompanying the consultation synopsis presenting the analysis of the OPC. 209 Currently, the actions of which the respondents were least aware of are actions pertaining to awareness raising on the availability of insurance
options against climate change damage (56.8%), the increase of green areas in towns to cope with heatwaves/floods (56.2%) and
reinforcement
of infrastructure to better withstand natural disasters like floods, heatwaves etc. (48.8%). 210 See Figure 3-15 in Appendix 1.A accompanying the consultation synopsis presenting the analysis of the OPC. 211 See Figure 3-17 in Appendix 1.A accompanying the consultation synopsis presenting the analysis of the OPC. 212 See Figure 3-23 in Appendix 1.A accompanying the consultation synopsis presenting the analysis of the OPC.
81
All the other actions were considered as ‘very important’ though without a clear majority.
Supporting resilience investments and natural disaster insurance penetration through EU
and MS policies and helping to identify health and/or social risks linked to climate change
(39.2% each) received the least support from respondents.
82
Similarities and differences with feedback from other consultation activities
Identification of objectives
Overall, the majority of interviewees and participants in the workshops agreed with the
objectives of the current strategy, and suggested the following enhancements:
Objective 1 – Promoting action by Member States - While recognising the importance
of supporting Member States, most interviewees and workshop participants
highlighted the importance of supporting adaptation at the local level, including
by supporting local authorities. Several interviewees also highlighted the
importance of promoting local action beyond cities, one pointing to the need to
increase local resilience and, thereby, reduce inward migration to cities.
Objective 2 - “Climate-proofing” action at EU level: Interviewees and workshop
participants overwhelmingly emphasised the need to ensure coherence and synergies
with other key EU policies.
Beyond “climate proofing”, mainstreaming of adaptation issues in all policies was
considered by all stakeholders to be a key objective of the new strategy, to ensure
that all policies’ actions are aligned with adaptation objectives and, where possible,
conducive to resilience. While the Green Deal was considered as a welcome step for
adaptation by many interviewees, the vast majority highlighted the importance of
ensuring coherence across policy areas, in order to direct investments towards climate-
friendly objectives and prevent maladaptation.
In particular, the Common Agricultural Policy and the Water Framework Directive
were mentioned by many participants. Interviewees and workshop participants alike
identified that both policies can currently lead to funding that may be contradictory to
adaptation objectives.
Objective 3 – Better-informed decision making: promoting better-informed
decision-making was recognised by all participants as a key objective to be
maintained and expanded, in particular, through ensuring standardised knowledge-
and implementation-sharing platforms.
While interviewees and workshop participants agreed with the existing objectives,
participants also suggested adding to them. Two new objectives were suggested by a large
majority of interviewees and workshop participants across all stakeholder groups:
An “outward-looking” objective to recognise the international dimension of
adaptation, enable global knowledge sharing, local-to-local knowledge sharing
between locations facing similar challenges, support to enhance adaptive capacity in
third countries and other preparatory actions to counter spill-over effects from
climate-related events elsewhere affecting Europe.
Given the importance of such an international dimension, this has been considered as
a new objective for the new Adaptation Strategy under the Impact Assessment;
therefore more detail on the comments received from stakeholders on this issue is
provided below.
A “citizens-focused” objective, dedicated to ensuring that citizens are more aware of
climate change impacts and associated costs, as well as the opportunities presented by
adaptation, and that they feel empowered to take adaptation actions.

83
Box 20: The international dimension of the new EU Adaptation Strategy
The international dimension of the new EU Adaptation Strategy
Open public consultation
77% of the OPC respondents agreed or strongly agreed that “the EU should support
internal action on adaptation”. When asked for”any further information that [they]
believed would be useful for preparing the EU’s new Adaptation Strategy”, 17 OPC
respondents provided further comments supporting an international dimension for the new
EU Adaptation Strategy. These included the following points:
Two stakeholders from academic and research institutions highlighted that “it is
also important to adapt to risks cascading on Europe though trade, financial and
political network” and that “it is important to develop innovative technological
tools […] not only pertaining to the European Union, but also to the global
extent and certainly developing countries.”
Two representatives from public authorities highlighted that “transnational
collaboration is key and further efforts are needed” and that “international
adaptation should also include adaptation in countries outside Europe where
climate change could lead to large scale economic damage or starvation, with
subsequently social unrest and conflicts which also could lead to large scale
migration”.
Among others, an NGO also provided the following statement: “We strongly
recommend the EU external relations be included and addressed in the strategy
beyond climate security. […] The EU should address the global challenges of
climate change adaptation, disaster risk reduction and environmental
degradation as a priority through its bilateral and multilateral relations, sending
a strong signal to the rest of the world on the importance of prioritising
adaptation planning and investment. We encourage the strengthening of
international and regional cooperation on climate (and disaster) resilience,
including attention to cross-border risks.”
An EU citizen has also highlighted that “governments should also cooperate, and
not only within the EU. […] The new Strategy should have a strong international
dimension, as shown with the current COVID crisis.”
Additional material submitted
In addition to the responses to the OPC, the international dimension was also apparent in
additional materials submitted by stakeholders. 25% of all position papers and other
documents submitted via the OPC or received directly via email or following experts’
interviews highlighted the importance of the international dimension in the new EU
Adaptation Strategy. Among them, 48% of all public authorities, 25% of all academic
and research institutions and 13% of all companies, business organisations and
association who submitted papers across all channels highlighted this. Additional
material received which highlighted the international dimension was submitted by
stakeholders from 17 different countries, and mainly from France, Belgium and
Germany.
Interviews and stakeholder events
When questioned about the existing and new actions of the new EU Adaptation Strategy,

84
the need to strengthen the international aspect of actions and/or to develop a new
internationally focused action was brought up by interviewees in 12 out of 31
interviews. Interviewees from EU institutions, international organisations, businesses,
and NGOs alike highlighted actions in two potential spheres internationally: (1)
“addressing spill-over effects” and (2) “assisting other countries to adapt (particularly
least developed countries)”. International actions were suggested in specific areas
including knowledge sharing, disaster risk reduction, security, mainstreaming and
development aid.
The same conclusions were drawn during stakeholder workshops, where the global
component was welcomed and highlighted as a very important element. Representatives
from different Member States across the Working Group 6 emphasised that global action
needs to be reinforced and further developed in the new Strategy. It was considered by one
participant as the most important improvement to the strategy, alongside the health
observatory.
Identification of actions
Existing actions
No participants in any of the consultation activities suggested discontinuing any of the
current EU Adaptation Strategy’s eight actions. Instead, they overwhelmingly suggested
there was a need to expand them, as discussed below.
Action 1 – Encourage all Member States to adopt comprehensive adaptation
strategies: All interviewees and workshop participants agreed that this should be
reinforced through the development of standardised monitoring and
reporting guidelines. In particular, participants in the Working Group 6
workshop representing national authorities highlighted that Member States are
insufficiently aware of the current progress of adaptation implementation, partly
because of lack of monitoring, partly because of the very nature of adaptation,
where actions such as flood risk management are not systematically labelled as
“adaptation”. To support Member States further, many interviewees and
workshop participants also mentioned the need for the EU to facilitate cross-
country knowledge exchange.
In a similar way to the OPC respondents, interviewees overwhelmingly
supported the need to move from planning to more implementation. Some
workshop participants representing Member States also highlighted that the
focus on implementation of the National Adaptation Strategies and/or National
Adaptation Plans should be strengthened, moving away from “planning” only. In
general, they supported a focus on implementation, while noting associated
challenges.
Action 2 – Provide LIFE funding to support capacity building and step up action
in Europe: LIFE funding was considered by most interviewees and workshop
participants (including EU institutions, international organisations and national
authorities) as insufficient by itself to support climate change adaptation. They
supported the need for greater funding and capacity building within but not only
through LIFE but also through existing sectoral actions, including the CAP, the
Cohesion Policy etc.
Action 3 – Introduce adaptation to the Covenant of Mayors framework: The
majority of interviewees and stakeholder participants supported the Covenant of
Mayors and suggested that this action should be expanded to support adaptation

85
action at the local level more generally. To this end, interviewees and workshop
participants alike highlighted that the Covenant of Mayor’s mandate could be
expanded to support adaptation not just in cities, but also to support resilience
in non-urban areas and/or at regional level, and to support knowledge
exchange across governance levels and between cities.
Action 4 - Bridge the knowledge gap: Like OPC respondents, more open access
to climate loss and disaster risk data received some support from other consultees,
in particular, during the workshops with national authorities but also according to
civil society, international organisations and businesses representatives.
However, this was mainly considered as a support for engagement from the
private sector by enabling the estimation of gains and losses from climate
change adaptation and inaction within relevant sectors. This also reflects calls
to enhance knowledge exchange across practitioners and to provide more
standardised data.
Most importantly, almost all interviewees and the majority of workshop
participants from all stakeholder groups indicated that the knowledge gap that
needs bridging is the one between decision-makers, practitioners and
researchers. To close this gap, they highlighted the importance of “learning-by-
doing” as a means of knowledge sharing.
Action 5 – Further develop Climate ADAPT as the ‘one-stop-shop’ for
adaptation information in Europe: While not all stakeholders were familiar with
the platform, the majority of interviewees across all stakeholder groups
suggested enhancing the role and reach of climate ADAPT to address the
knowledge gaps identified in Action 4.
Action 6 – Facilitate the climate proofing of the Common Agriculture Policy, the
Cohesion Policy and the Common Fisheries Policy: Most interviewees and
workshop participants, including members of Working Group 6 representing
national authorities, reported that there was a need for further mainstreaming of
adaptation objectives across these policy areas, particularly in relation to the
CAP, which it was suggested was potentially working against adaptation
objectives and promoting maladaptation.
Interviewees and workshop participants, including Working Group 6 participants
representing national authorities, suggested expanding this action to include
mainstreaming and implementation of adaptation action through all EU
instruments, with the Water Framework Directive often specifically mentioned.
Other suggested policies for mainstreaming included: European Pillar of Social
Rights; EU Skills Agenda; EU Cohesion Policy; EU Gender Equality Strategy;
Non-Financial Reporting Directive.
Action 7 – Ensuring more resilient infrastructure: While this action was less
discussed by interviewees and workshop participants than the other actions, the
majority of them highlighted the importance of making greater use of green
infrastructure and nature-based-solutions, implying that this action should also
be expanded.
Action 8 – Promote insurance and other financial products for resilient
investment and business decisions: While this action was the least supported by
OPC respondents, most interviewees highlighted the need to expand it beyond
the insurance sector and include other financial products and services in its
sphere of influence.
In the workshop’s breakout groups, participants representing national authorities
and international organisations notably pointed out the importance of overseeing
how private and public investments are made, and to develop guidance to

86
ensure win-wins between the adaptation/mitigation objectives of policymakers
on the one hand, and risk minimisation objectives of investors on the other. The
new EU taxonomy was mentioned as playing a major role in incentivising
investments. This can be seen as echoing the demand for more standardisation
in reporting and more prescriptive guidelines in the public sector.
Overall, private sector engagement was considered by interviewees and
workshop participants from all stakeholder groups as an important component of
the strategy to (1) ensure behavioural change and (2) to provide necessary
funding (though without being the main source). Interviewees from local
authorities pointed to a lack of direct return on investment (in terms of cash
flows) of adaptation projects in general, including at the local level.
Potential new actions
Additional actions frequently suggested by workshop participants and interviewees alike
include:
An emphasis on international action. A large majority of interviewee and workshop
participants noted the importance for the EU of continuing support for other
countries to enhance their adaptive capacity and thereby prevent spillover effects of
climate-related events elsewhere affecting Europe. This was highlighted by all
stakeholder groups, but less so among business representatives. Reported spillover
effects included climate-induced migration and disruption to supply chains. In turn, as
part of the knowledge sharing efforts previously reported, interviewees highlighted an
important opportunity for two-way learning on adaptation best practices with other
countries that are already facing the impacts of climate change more severely.
In addition, a new action encouraged by all stakeholders from interviews and workshops
alike was the communication to and involvement of EU citizens in climate change
adaptation. To this end, interviewees and webinar panellists mentioned the role of the
media and use of digital tools to actively engage citizens and make knowledge and data
accessible to all.
The following general considerations were also highlighted by the majority of interviewees
and workshop participants when discussing potential new actions (actions are listed in order
from the most to least suggested):
Unlike OPC respondents, most interviewees and workshop participants from all
stakeholder groups advocated that sectors should not be prioritised. Rather, they
highlighted the importance of identifying actions horizontally across all sectors, to
maximise cross-sectoral benefits and to prevent potential maladaptation. Those
interviewees who did prioritise specific sectors were mostly experts from the relevant
sectors (e.g. water was prioritised by an interviewee representing a water organisation,
forestry was prioritised by an interviewee representing a forestry organisation).
Instead of prioritising sectors, interviewees and workshop participants from all
stakeholder groups overwhelmingly recommended that actions should be prioritised
in relation to vulnerabilities, acknowledging the differences across Europe. The use
of an EU-wide vulnerability assessment was highlighted by several workshop
participants representing national authorities and was supported in some interviews by
international organisations, civil society and business representatives. However, some
workshop participants and interviewees from EU institutions and other national
authorities’ representatives did not consider it a priority in comparison to other
suggested actions and considered that it might duplicate current efforts by the
European Environment Agency.
87
Workshop participants and interviewees from civil society, national authorities and
businesses alike encouraged greater implementation of nature-based solutions and
the communication of successful and best-practice examples. Several references
were made to the value of water and forest ecosystems to the EU economy, justifying
the importance of specific actions in those sectors. The diversification of systems was
mentioned less by interviewees and workshop participants than by OPC respondents,
and the transport and energy sectors were mostly considered in light of synergies
between adaptation and mitigation.
Some interviewees and workshop participants, in particular from businesses and
national authorities, encouraged the promotion of actions that span the adaptation-
mitigation nexus. They suggested that actions should be prioritised where there is
potential for substantial synergies between mitigation and adaptation.
Workshop participants representing Member States highlighted the importance of
differentiating between adaptation to slow-onset and extreme-weather events. For
the latter, in particular, interviewees highlighted the importance of being proactive,
preparing, and planning before adverse impacts arise.
Given the importance of feedback received from national authorities, key points on their
opinion of potential new actions of the strategy are presented in the box below.
Box 21: Feedback from National Authorities
Open public consultation
In total, 60 public authorities completed the OPC for the new EU Adaptation Strategy,
including 23 national authorities from 14 EU Member States213
. These included
Austria, Belgium, Czechia, Estonia, Finland, France, Greece, Ireland, Italy, Latvia, the
Netherlands, Portugal, Romania and Slovakia. Furthermore, three non-EU national
authorities (one from Andorra and two from the United Kingdom) provided responses.
When asked to rate potential new actions for the new EU Adaptation Strategy, the
majority of national authorities have indicated that “helping to identify health and/or
social risks linked to climate change at an early stage by developing an
observatory of social/health vulnerability” was very important (9). Other actions
that were considered as fairly important by the majority of national authorities
included: “supporting resilience investments and natural disaster insurance
penetration through EU and MS policies” (11) and “increase in private investment
in adaptation via increased public-private investment opportunities or incentives”
(9). “Strengthening the climate risk and vulnerability assessment at EU level, including
on the EU outermost regions” was considered not important at all by 7 out of 23 national
authorities, with the majority considering it only slightly important. “Providing
tailored adaptation guidance and peer-to-peer knowledge exchange to public
authorities and non- state actors” was also deemed not important (5) or only slightly
important (8) by half of the national public authorities respondents, although it was the
action most identified as “very important” by the wider public authorities stakeholders’
group. Other actions were considered as important or slightly important.
National authorities who provided as an open-text response “further information that
213 Multiple responses were received from: Austria, Greece, Ireland and Portugal.

88
[they believed] would be useful for preparing the EU’s new Adaptation Strategy” have
highlighted the importance of knowledge exchange and further guidance on
adaptation. They also mentioned the following other areas needing action: better
integrating and supporting sub-national authorities, including in rural areas; ensuring
mainstreaming adaptation in sectoral policies; accounting for climate impacts outside
the EU and collaborating internationally; and integrating mitigation and adaptation
objectives together.
Additional material submitted
In total, eight position papers were received from EU national authorities, including
three via the OPC and five directly over email. These came from the following Member
States Denmark, Finland, France, Germany, Italy, Poland, Portugal and Spain.
Health and social impacts were only discussed in four of these position papers. These
reiterated their support for an observatory dedicated to social/health vulnerability, or
generally highlighted the importance for the Strategy to be equipped to address the
impacts of climate change on the most exposed and most vulnerable citizens. As in the
wider OPC results, the need to increase investment in adaptation was highlighted in
the majority of the position papers, though with no specific focus on private investment.
Respondents suggested an increase in adaptation funding overall, including through a
new financial instrument from EU funds, or in general by increasing EU funding for
adaptation. Public-private partnership was only specifically mentioned in one position
paper.
Climate risks and vulnerability assessments were not specifically emphasised in the
position papers. On the other hand, peer-to-peer knowledge exchange were deemed
important aspects of the new Strategy in seven of the nine position papers received.
National authorities called for a reinforcement of knowledge exchange and better
coordination of adaptation action at different levels including better knowledge
exchange across Member States, but also with governments outside the EU and
between public authorities and practitioners. They suggested that the EU adopt a
coordination role in these exchanges, by facilitating dialogue but also harmonising
monitoring and evaluation criteria and data collection, and ensuring the convergence of
national and regional strategies, climate plans, legal and technical regulations and
legislation between neighbouring states to account for the vulnerability of cross-border
territories and spill over effects.
Other areas for action suggested in national authorities’ position papers included
nature-based solutions, international cooperation, and mainstreaming adaptation
objectives in EU policies and funding.
Stakeholder events
At the second stakeholder workshop, representatives from different Member States
across the Working Group 6 were consulted again on potential actions for the new EU
Adaptation Strategy. Participating Member States included Austria, Belgium, Czechia,
Denmark, Finland, France, Germany, Greece, Ireland, Latvia, Portugal, Italy, Malta;
the Netherlands, Slovenia, Spain and Sweden.
Out of the four breakout groups, two groups supported a new action addressing the
health and social aspects of adaptation and three groups supported further action in
knowledge sharing. Investment and financing were not reported as needing a new
action or further enhancement by any group. In contrast, supporting Member States
through improved mechanisms for monitoring and evaluation of adaptation action
89
was highlighted as a key new strand of action in all groups. Three groups also
highlighted the need for better and harmonised data, and two groups explicitly
welcomed a new action in international cooperation. Potential new actions were also
welcome to (1) engage the wider public at an EU level, (2) increase the use of
ecosystem- based solutions, in particular for green infrastructure and (3) further involve
corporate businesses and the financial sector.
Impacts of the new EU Adaptation Strategy
Results from the OPC
Stakeholders mostly considered it very important for the new EU Adaptation Strategy to
achieve the following impacts:
Healthier ecosystems with improved resilience to climate impacts (73.3%),
Preventing climate risks (69.9%),
Enhancing the resilience of the agri-food system to climate change (66.8%) and
Enabling climate-informed decisions by citizens (60.9%).
The latter was one of the most common topics addressed in the final open text replies, with a
majority of respondents reiterating the importance of communication, citizen involvement and
behavioural change. In response to the question on ‘In your opinion, how important is it for
local authorities to promote the engagement in adaptation action of citizens and stakeholders
in the following ways?’ the majority of respondents indicated that informing about local
climate risks and impacts (74%) and ensuring resources are available for the development
and delivery of adaptation projects (70%)214
were very important.
Consistent with previous answers, more mixed responses were received for the closing of
climate protection gap (e.g. increasing insurance coverage), climate and risk proofing of
infrastructure and investments (45.8%), incorporating climate risk management into fiscal
frameworks (44.1%), averting, minimising and addressing population displacement (43.6%)
and increasing financial and economic resilience (35.8%).
Similarities and differences with feedback from other consultation activities
Impacts of the new EU Adaptation Strategy were only specifically discussed during
interviews. Interviewees were asked to identify whether the new EU Adaptation Strategy
should prioritise economic and/or social and/or environmental impacts.
All interviewees from all stakeholder groups emphasised the importance of considering all
impacts as interconnected, recognising that environmental impacts have economic and
social repercussions, economic impacts have environmental and social repercussions, etc. As
a result, it was not suggested that any specific impacts should be prioritised.
However, interviewees agreed with OPC respondents in highlighting the importance of
achieving healthier ecosystems with improved resilience to climate impacts.
Economic impacts were less discussed compared to social and environmental impacts, apart
from representatives of businesses. This may be due to most respondents’ understanding that
economic activity itself relies on the services that ecosystems provide. A large number of
214 See Figure 3-33 in Appendix 1.A accompanying the consultation synopsis presenting the analysis of the OPC.
90
workshop participants and interviewees from all stakeholder groups (mostly civil society but
also including businesses and national authorities) emphasised the importance of ecosystem-
based adaptation and nature-based solutions.
Health and other social impacts were considered very important by interviewees, despite
not being emphasised by the majority of OPC respondents. Differences in social impacts and
the “leaving no-one behind” principle were highlighted as underlying principles to be
considered in implementing each of the strategy’s actions. Some interviewees argued that the
current focus on social adaptation is insufficient, particularly for women and workers, in
particular among civil society representatives.
According to interviewees, focusing on social impacts is important due to:
Differing vulnerabilities across members of society (gender and occupation were
highlighted), requiring prioritisation of actions.
The risk of negative spillover effects of some actions potentially leading to maladaptation
in some social groups.
6. Identified campaigns for consultations
The OPC open text responses were analysed to see if any of them had been co-ordinated by
different respondents. Co-ordinated in this case refers to open text responses from different
respondents that are identical or almost identical. To see how similar two sentences are, a
Cosine Similarity calculation has been carried out215
. The higher the cosine similarity, the
more similar two responses are to one another, with a cosine similarity of 1.0 indicating
identical text submissions. A cosine similarity of 0.5 or above indicates similarity between
texts and hence the possibility of coordination.
The results of this analysis are summarised in Table 14. Each row in the table shows a set of
similar co-ordinated responses and the stakeholder type of each response. For example, the
first row shows that there were two responses, both submitted by trade union stakeholders, that
were most likely co-ordinated, with a very high level of similarity between responses. Very
high similarity has a cosine similarity of 0.9 and above.
The table indicates that there were only pairs and a triplet (see the second row of the table
which shows that there were two responses from business associations and one from a
company/business organisation, that were most likely co-ordinated) of organised responses,
and there were no large campaigns of similar answers. The most common stakeholder type
involved in these co-ordinated responses was business associations.
The triplet consisting of the same response highlighted that railways have adaptation plans in
place. The co-ordinated response states that due to interlinkages mainly with the energy sector,
a holistic approach is needed to guarantee resilience of the rail infrastructure.
215 The calculation involves converting sentences to vectors and the similarity calculation measures the cosine of angle between two vectors.

91
Table 22: Results of cosine similarity analysis detecting co-ordinated responses
Level of similarity
between the
responses 216
Stakeholder type
Trade
union NGO Business
association Company/
business
organisation
Public
authority Academic
research
institution
Other
Very high 2
Very high 2 1
Very high 2
Very high 1 1
Very high 1 1
High 1 1
High 2
High 2
High 1 1
High 1 1
High 1 1
7. Ad-hoc contributions
Ad-hoc contributions (i.e. position papers and other types of documents submitted) were
provided over email and referred to by stakeholders during the targeted stakeholders’
interviews. These contributions have been analysed in the same way as contributions
submitted via the OPC.
Overall, 26 contributions were received over emails from various stakeholders. Figure 9 shows
the topics covered in those contributions by stakeholder type.
216 Very high has a cosine similarity of 0.9 and above. High has a cosine similarity of 0.5 to 0.9
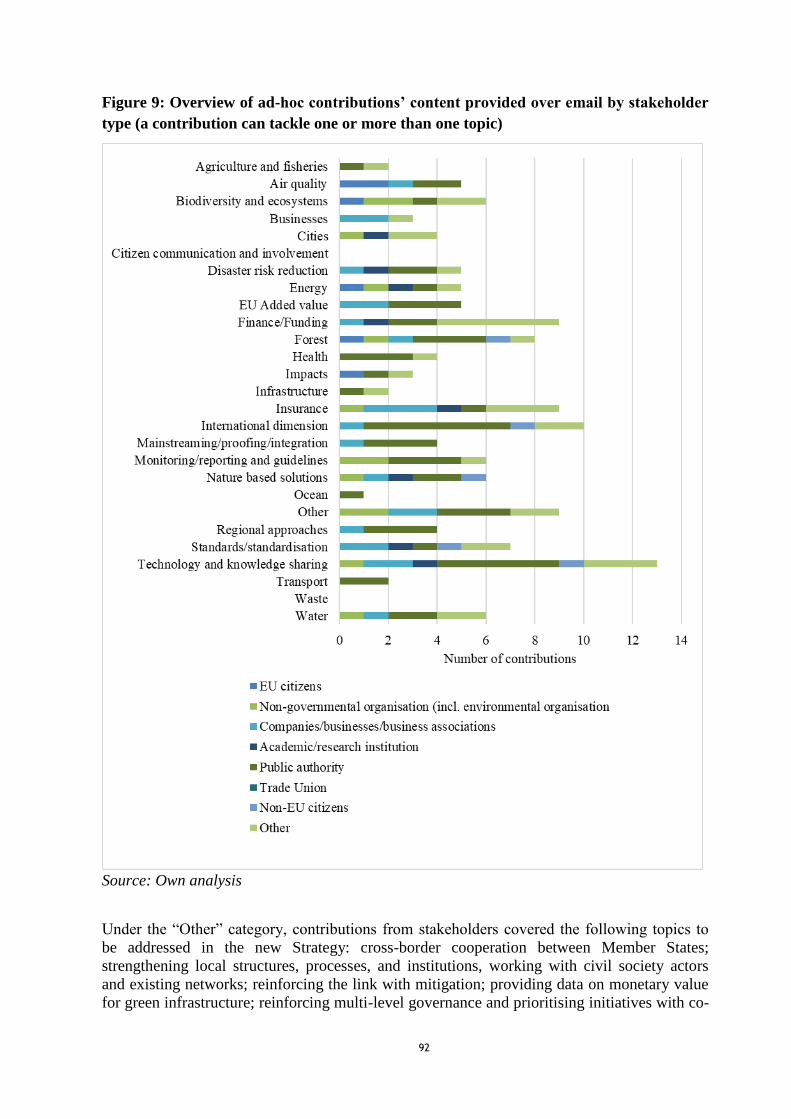
92
Figure 9: Overview of ad-hoc contributions’ content provided over email by stakeholder
type (a contribution can tackle one or more than one topic)
Source: Own analysis
Under the “Other” category, contributions from stakeholders covered the following topics to
be addressed in the new Strategy: cross-border cooperation between Member States;
strengthening local structures, processes, and institutions, working with civil society actors
and existing networks; reinforcing the link with mitigation; providing data on monetary value
for green infrastructure; reinforcing multi-level governance and prioritising initiatives with co-
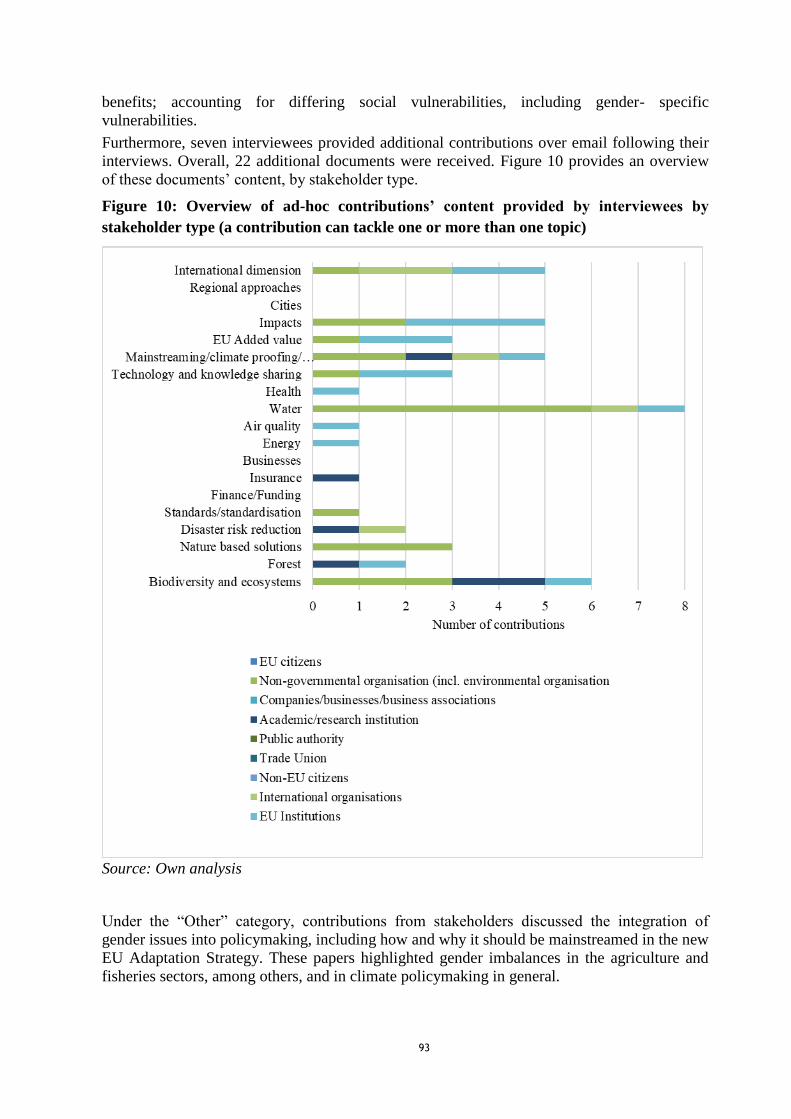
93
benefits; accounting for differing social vulnerabilities, including gender- specific
vulnerabilities.
Furthermore, seven interviewees provided additional contributions over email following their
interviews. Overall, 22 additional documents were received. Figure 10 provides an overview
of these documents’ content, by stakeholder type.
Figure 10: Overview of ad-hoc contributions’ content provided by interviewees by
stakeholder type (a contribution can tackle one or more than one topic)
Source: Own analysis
Under the “Other” category, contributions from stakeholders discussed the integration of
gender issues into policymaking, including how and why it should be mainstreamed in the new
EU Adaptation Strategy. These papers highlighted gender imbalances in the agriculture and
fisheries sectors, among others, and in climate policymaking in general.
94
8. How information from consultation is used in the impact assessment
The evidence-base collected through the consultation activities was recorded by the
consultation team in the form of interview notes, webinar and workshop notes; summaries of
position papers’ and additional material received through the OPC or other channels; and
graphs to visualise results from the OPC.
This information from the consultation formed a major part of the evidence considered in the
impact assessment. The evidence was compared with evidence from other strands of the
consultation and also with results of the literature review to identify the overall level of
agreement or divergence of the evidence.
This was done (1) upstream, by providing support to the impact assessment team through
weekly updates on the findings of the consultation activities, and (2) downstream, by
crosschecking each policy option suggested against the evidence provided by consultation
activities.
The full list of appendices accompanying this consultation synopsis include:
Appendix 0.A: Summaries of ad-hoc contributions Appendix 1.A: Open public
consultation
Appendix 1.B: Open public consultation questionnaire Appendix 1.C: Open public
consultation - Open text responses
Appendix 1.D: Open public consultation - Summaries of submitted position papers and
other documents
Appendix 1. E: Open public consultation - ‘Other’ responses Appendix 2.A:
Stakeholder interviews – Scripts and respondents Appendix 2.B: Stakeholder
interviews – Preliminary interview script Appendix 2.C: Stakeholder interviews –
Main interview script
Appendix 2.D: Stakeholder interviews – European Commission invitation to contribute
Appendix 3.A: Stakeholder events
Appendix 3.B: Stakeholder events - Presentation of the webinar on 2 July 2020
Appendix 3.C: Stakeholder events - Presentation of the workshop on 3 July 2020
Appendix 3.D: Stakeholder events - Concept note of workshop on 3 July 2020
Appendix 3.E: Stakeholder events - Presentation of the workshop on 7 July 2020
Appendix 3.F: Stakeholder events - Concept note developed for the workshop on 7
July 2020

95
Annex 3: Who is affected and how?
Table 23: Overview of Benefits (total for all provisions) – Preferred Option
I. Overview of Benefits (total for all provisions) – Preferred Option
Description Amount Comments
Direct benefits
A1 – Effective utilization of
knowledge through systematic
data collection and sharing,
between key public and private
partners.
Common benefits for public and private entities: Data
harmonization; effective alignment between public and
private responsibilities and effort sharing; improved
adaptation planning; better informed decision making;
better understanding between public and private losses.
Reduced costs to be expected as robust data can drive CBA
Assumption: Climate data and knowledge is
perceived as common good with great societal
relevance. Data is of sufficient granularity
A2 – Proven performance from
Climate-ADAPT as the ‘first-stop
shop’ for adaptation information
in Europe.
A single platform would reduce time to action, reducing
costs. A first stop platform can guide to others without
trying to stay up-to-date on everything at all time.
Distinction to be made between data provisioning,
gathering of information and knowledge sharing.
Different platforms for data, like Copernicus,
EUROSTAT already provide some climate-related
data. These services should be expanded per platform
and linked to Climate-ADAPT
A3 - Robust evaluation,
monitoring, reporting and
implementation of adaptation
strategies
Insight into Europe’s vulnerability at the efficient level of
granularity. Uniform and harmonized indicators can track
impacts across Europe, and promote better exchange
between Member States.
A4 - Mainstreaming nature-based
adaptation, including coastal
protection and green and blue
infrastructure.
Socio-economic and environmental benefits are more
easily associated with ecosystems services. Therefore
making more robust business cases warranting contribution
and progress for sustainable development goals
A5 - Stepping-up efforts to build
resilience in cities and empower
local action.
Reduced public expenditures on losses as result of climate
impacts as city action plans put into action.
A6 - Further mainstreaming and
integrating adaptation in EU
legislation and instruments
Greater spending on climate resilience in sectors affected
by policy.
A7 - Climate Proofing of
Infrastructure and Disaster Risk
Management.
Standardized guidelines and procedures to design, develop
and integrate climate proofing solutions to ensure robust
and resilient infrastructure across Europe
A8 - Closing the Climate
Protection gap - microeconomic
aspects of adaptation to climate
change.
Having systematic approach to assess, reduce, and
optimally transfer climate-related disaster risk in economic
activities
A9 - Supporting partner countries
and regions in their efforts on
climate change and disaster
preparedness
Implementation of NDCs and to building capacity at
national and sub-national level in line with national
priorities and vulnerabilities
A10 - Scaling up international
adaptation finance and disaster
risk financing, and unlocking
Having more funds available from both the public and
private sector, fostering the transition to be become climate
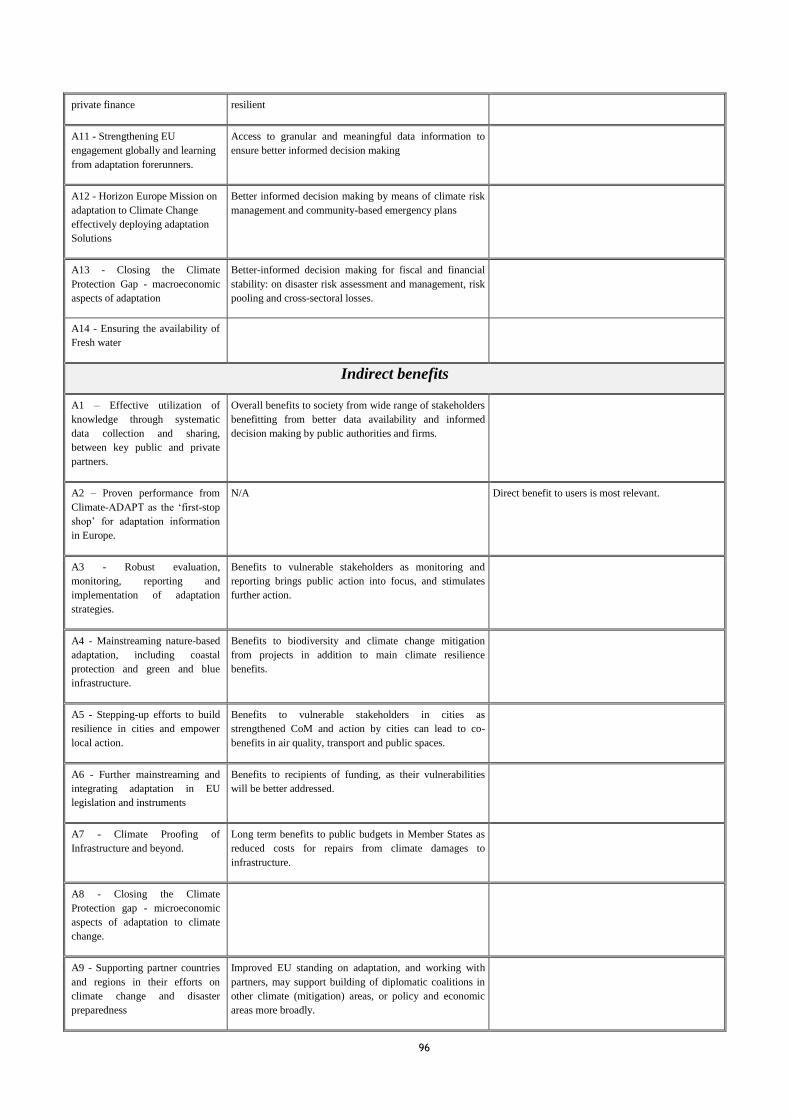
96
private finance resilient
A11 - Strengthening EU
engagement globally and learning
from adaptation forerunners.
Access to granular and meaningful data information to
ensure better informed decision making
A12 - Horizon Europe Mission on
adaptation to Climate Change
effectively deploying adaptation
Solutions
Better informed decision making by means of climate risk
management and community-based emergency plans
A13 - Closing the Climate
Protection Gap - macroeconomic
aspects of adaptation
Better-informed decision making for fiscal and financial
stability: on disaster risk assessment and management, risk
pooling and cross-sectoral losses.
A14 - Ensuring the availability of
Fresh water
Indirect benefits
A1 – Effective utilization of
knowledge through systematic
data collection and sharing,
between key public and private
partners.
Overall benefits to society from wide range of stakeholders
benefitting from better data availability and informed
decision making by public authorities and firms.
A2 – Proven performance from
Climate-ADAPT as the ‘first-stop
shop’ for adaptation information
in Europe.
N/A Direct benefit to users is most relevant.
A3 - Robust evaluation,
monitoring, reporting and
implementation of adaptation
strategies.
Benefits to vulnerable stakeholders as monitoring and
reporting brings public action into focus, and stimulates
further action.
A4 - Mainstreaming nature-based
adaptation, including coastal
protection and green and blue
infrastructure.
Benefits to biodiversity and climate change mitigation
from projects in addition to main climate resilience
benefits.
A5 - Stepping-up efforts to build
resilience in cities and empower
local action.
Benefits to vulnerable stakeholders in cities as
strengthened CoM and action by cities can lead to co-
benefits in air quality, transport and public spaces.
A6 - Further mainstreaming and
integrating adaptation in EU
legislation and instruments
Benefits to recipients of funding, as their vulnerabilities
will be better addressed.
A7 - Climate Proofing of
Infrastructure and beyond.
Long term benefits to public budgets in Member States as
reduced costs for repairs from climate damages to
infrastructure.
A8 - Closing the Climate
Protection gap - microeconomic
aspects of adaptation to climate
change.
A9 - Supporting partner countries
and regions in their efforts on
climate change and disaster
preparedness
Improved EU standing on adaptation, and working with
partners, may support building of diplomatic coalitions in
other climate (mitigation) areas, or policy and economic
areas more broadly.
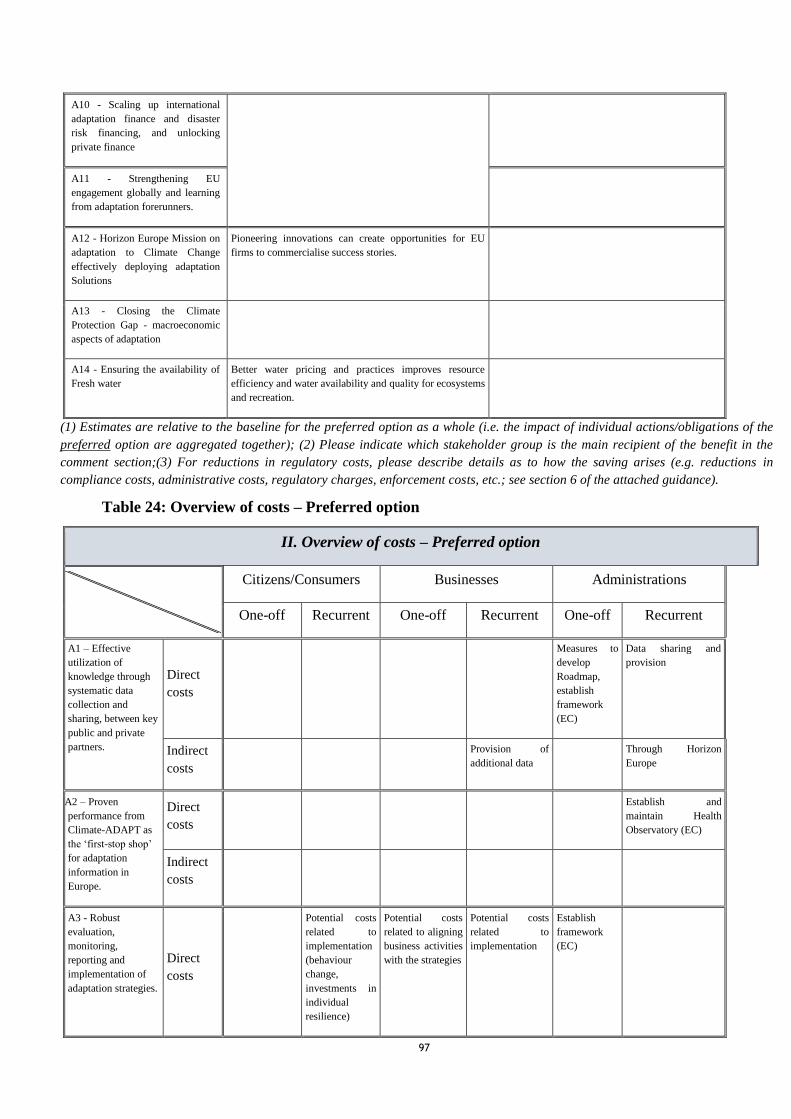
97
A10 - Scaling up international
adaptation finance and disaster
risk financing, and unlocking
private finance
A11 - Strengthening EU
engagement globally and learning
from adaptation forerunners.
A12 - Horizon Europe Mission on
adaptation to Climate Change
effectively deploying adaptation
Solutions
Pioneering innovations can create opportunities for EU
firms to commercialise success stories.
A13 - Closing the Climate
Protection Gap - macroeconomic
aspects of adaptation
A14 - Ensuring the availability of
Fresh water
Better water pricing and practices improves resource
efficiency and water availability and quality for ecosystems
and recreation.
(1) Estimates are relative to the baseline for the preferred option as a whole (i.e. the impact of individual actions/obligations of the
preferred option are aggregated together); (2) Please indicate which stakeholder group is the main recipient of the benefit in the
comment section;(3) For reductions in regulatory costs, please describe details as to how the saving arises (e.g. reductions in
compliance costs, administrative costs, regulatory charges, enforcement costs, etc.; see section 6 of the attached guidance).
Table 24: Overview of costs – Preferred option
II. Overview of costs – Preferred option
Citizens/Consumers Businesses Administrations
One-off Recurrent One-off Recurrent One-off Recurrent
A1 – Effective
utilization of
knowledge through
systematic data
collection and
sharing, between key
public and private
partners.
Direct
costs
Measures to
develop
Roadmap,
establish
framework
(EC)
Data sharing and
provision
Indirect
costs
Provision of
additional data
Through Horizon
Europe
A2 – Proven
performance from
Climate-ADAPT as
the ‘first-stop shop’
for adaptation
information in
Europe.
Direct
costs
Establish and
maintain Health
Observatory (EC)
Indirect
costs
A3 - Robust
evaluation,
monitoring,
reporting and
implementation of
adaptation strategies.
Direct
costs
Potential costs
related to
implementation
(behaviour
change,
investments in
individual
resilience)
Potential costs
related to aligning
business activities
with the strategies
Potential costs
related to
implementation
Establish
framework
(EC)
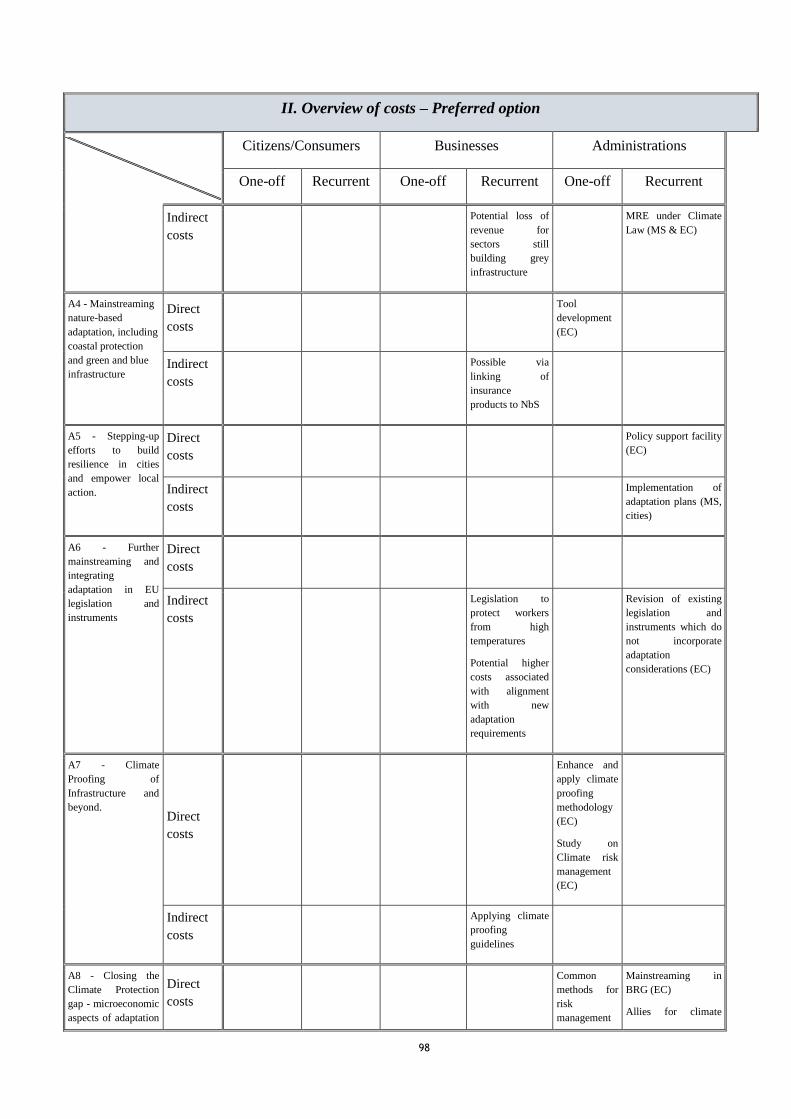
98
II. Overview of costs – Preferred option
Citizens/Consumers Businesses Administrations
One-off Recurrent One-off Recurrent One-off Recurrent
Indirect
costs
Potential loss of
revenue for
sectors still
building grey
infrastructure
MRE under Climate
Law (MS & EC)
A4 - Mainstreaming
nature-based
adaptation, including
coastal protection
and green and blue
infrastructure
Direct
costs
Tool
development
(EC)
Indirect
costs
Possible via
linking of
insurance
products to NbS
A5 - Stepping-up
efforts to build
resilience in cities
and empower local
action.
Direct
costs
Policy support facility
(EC)
Indirect
costs
Implementation of
adaptation plans (MS,
cities)
A6 - Further
mainstreaming and
integrating
adaptation in EU
legislation and
instruments
Direct
costs
Indirect
costs
Legislation to
protect workers
from high
temperatures
Potential higher
costs associated
with alignment
with new
adaptation
requirements
Revision of existing
legislation and
instruments which do
not incorporate
adaptation
considerations (EC)
A7 - Climate
Proofing of
Infrastructure and
beyond. Direct
costs
Enhance and
apply climate
proofing
methodology
(EC)
Study on
Climate risk
management
(EC)
Indirect
costs
Applying climate
proofing
guidelines
A8 - Closing the
Climate Protection
gap - microeconomic
aspects of adaptation
Direct
costs
Common
methods for
risk
management
Mainstreaming in
BRG (EC)
Allies for climate
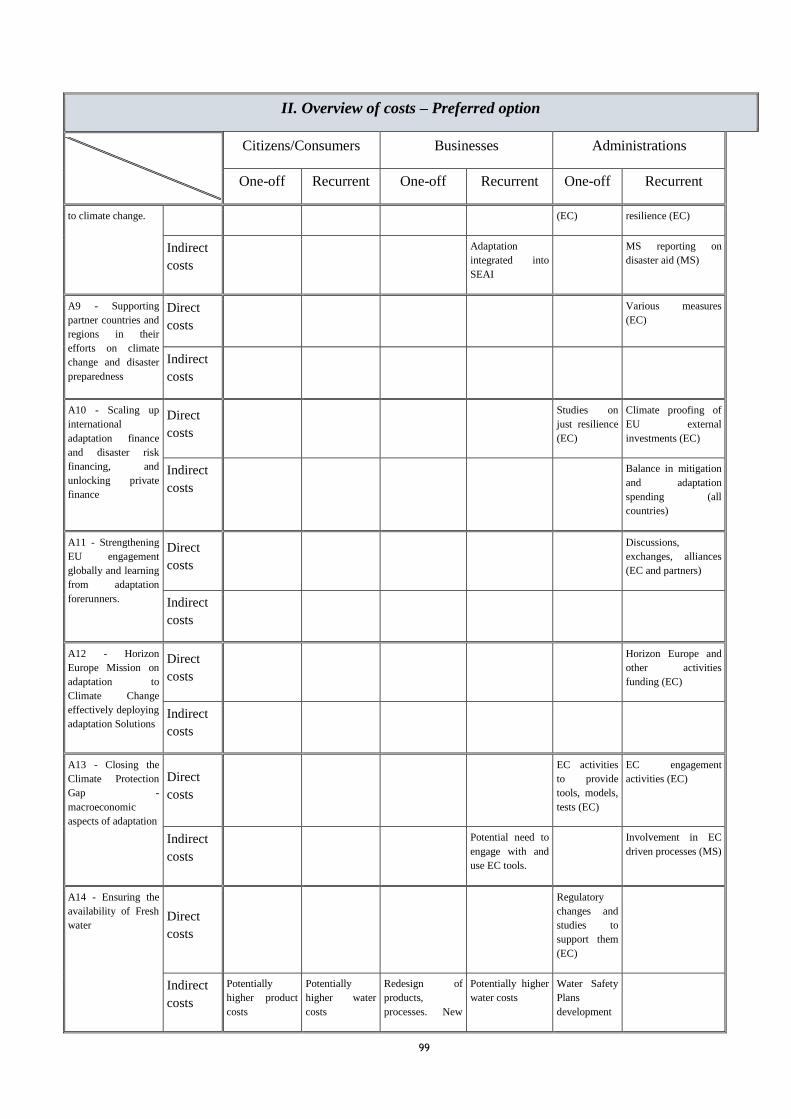
99
II. Overview of costs – Preferred option
Citizens/Consumers Businesses Administrations
One-off Recurrent One-off Recurrent One-off Recurrent
to climate change. (EC) resilience (EC)
Indirect
costs
Adaptation
integrated into
SEAI
MS reporting on
disaster aid (MS)
A9 - Supporting
partner countries and
regions in their
efforts on climate
change and disaster
preparedness
Direct
costs
Various measures
(EC)
Indirect
costs
A10 - Scaling up
international
adaptation finance
and disaster risk
financing, and
unlocking private
finance
Direct
costs
Studies on
just resilience
(EC)
Climate proofing of
EU external
investments (EC)
Indirect
costs
Balance in mitigation
and adaptation
spending (all
countries)
A11 - Strengthening
EU engagement
globally and learning
from adaptation
forerunners.
Direct
costs
Discussions,
exchanges, alliances
(EC and partners)
Indirect
costs
A12 - Horizon
Europe Mission on
adaptation to
Climate Change
effectively deploying
adaptation Solutions
Direct
costs
Horizon Europe and
other activities
funding (EC)
Indirect
costs
A13 - Closing the
Climate Protection
Gap -
macroeconomic
aspects of adaptation
Direct
costs
EC activities
to provide
tools, models,
tests (EC)
EC engagement
activities (EC)
Indirect
costs
Potential need to
engage with and
use EC tools.
Involvement in EC
driven processes (MS)
A14 - Ensuring the
availability of Fresh
water Direct
costs
Regulatory
changes and
studies to
support them
(EC)
Indirect
costs
Potentially
higher product
costs
Potentially
higher water
costs
Redesign of
products,
processes. New
Potentially higher
water costs
Water Safety
Plans
development

100
II. Overview of costs – Preferred option
Citizens/Consumers Businesses Administrations
One-off Recurrent One-off Recurrent One-off Recurrent
standards/labels (MS)
(1) Estimates to be provided with respect to the baseline; (2) costs are provided for each identifiable action/obligation of the
preferred option otherwise for all retained options when no preferred option is specified; (3) If relevant and available, please present
information on costs according to the standard typology of costs (compliance costs, regulatory charges, hassle costs, administrative
costs, enforcement costs, indirect costs; see section 6 of the attached guidance).
101
Annex 4: Analytical methods
Aside from desk review, thematics reports and consultative approaches the Impact Assessment
also utilised economic modelling to estimate the impact of a handful of the measures taken for
mini-assessment (see Annex 7). The key characteristics of this are described below.
Economic modelling
The GINFORS-E model was used to provide macro-econometric estimations of the impact of
measures under the Adaptation Strategy. A more complete description of baseline assumptions
and how measures proposed under the Strategy were modelled is provided below, along with
the summary of the main model features.
Three climate change scenarios and the respective adaptation scenarios are compared against a
references scenario, which is mainly calibrated to the IEA’s WEO 2019 stated policies
scenario (IEA 2019). For EU countries, GDP and population development is calibrated to meet
the EU (2018) aging report results (Lutz et al. 2020). GINFORS-E217
is a global economy-
energy model including national models for all EU countries and major trade partners linked
by bilateral trade at industry level (solved annually until 2050). It is a macro econometric
model similar to E3ME (Barker et al. 2011; Lehr, Lutz 2020).
Using quantifications of damages from past events as input, GINFORS_E estimates impacts at
industry level, including macroeconomic effects (GDP, employment, production, consumer
prices) and impacts on income and consumption structure for each EU Member State. Other
examples include the detailed economic assessment of the German adaptation policies,
applying a single country model with the same philosophy as GINFORS-E (Lehr et al. 2020).
Results are reported as relative differences in 2030, 2040 and 2050 against the reference
scenario. Country specific economic structures, damages due to climate change and policy
measures to adapt to climate change translate into different impacts on country level. The
results are available on country level, but are shown for four regions and the current EU-27.
The economic losses are calculated for 2050, the model interpolates from today. The sources
are used as follows:
• EEA Report No 1/2017 Climate change, impacts and vulnerability in Europe 2016
• An indicator-based report is used to determine the losses in agriculture for the RCP4.5
scenario. The upper and lower scenario is calculated based on own assumptions.
• Energy costs are simulated using the changes in electricity production costs from
PESETA IV. The results are assumed for 2050 with model interpolation from today.
The assumptions used for the reference scenario are taken from a variety of sources and are
combined in a methodologically rough way for feasibility of impact assessment study. One
example, while the results from PESETA come from a comparative static analysis, the
GINFORS-E model is a dynamic environment where the economies of the member states
develop over time. The increasing (or in some cases possibly decreasing) vulnerability of a
217 https://www.gws-os.com/de/index.php/energy-and-climate/models/model-details/ginfors-e.html
102
member state’s economy by 2050 is not accounted for. This would be a relevant and
interesting, but far more comprehensive study than can be provided here. The different types
of models used in the analyses make comparison difficult, but the most comprehensive work
on climate damages in Europe stems from the PESETA project cycle. Therefore, the results
from the comparative static analysis in PESETA IV haven been interpreted against the
macroeconometric models background and tried to reach similar results.
Five types of damages due to climate change have been implemented in the baseline. (1) For
agriculture, climate change effects result in higher prices for the products, if the sector suffers
from climate change. They translate into output losses via the input-output tables, mainly for
agriculture, but also for other industries, such as food, that use agricultural products. (2)
Higher cooling and lower heating demand are implemented in the physical energy balances of
the models, i.e. as changes in consumption of electricity (for cooling) and different energy
carriers (for heating). Changes in energy consumption (and transformation) in physical terms
are translated into the monetary demand changes in the input-output tables and respective
percentage changes. Consumers will adjust their consumption structure. (3) Changes in
tourism turnover are interpreted as changes in final demand for the sector accommodation and
food services. Intermediate inputs and other final demand categories will also change
according to the economic structures in the IO tables. It is assumed that lower demand will not
be compensated by additional demand in other categories to get a more pronounced negative
economic impact of lower tourism activities and thus to be able to isolate and track effects. (4)
Coastal damages and damages of the transport system are related to less transport. As in (3)
these damages have been modelled as lower demand for (maritime) transport, which also has
negative impacts on output of the transport industry and of other connected industries. (5)
Health impacts of climate change, i.e. of heat waves and an increase in average temperature
are considered as lower labour productivity. This is introduced to the model as an increase in
user costs, which determine production prices, for all industries. This means that negative
health impacts will increase the price level of the respective economy, which has negative
effects on international competitiveness and reduces the purchasing power of consumers in the
country. In contrast to (1) to (4) the effects spread widely across the economy. Changes in
GDP in the countries reflect direct, indirect and induced effects of these assumptions for
changes in prices and in demand. Employment is also a result of the model, mainly depending
on production and relative prices (labour costs to production prices) in each industry. Wages in
turn are a function of productivity development and price levels. As a consequence, percentage
changes in employment as the number of employees are in general lower than percentage
changes in production or GDP respectively.
Modelling reduced damages due to adaptation measures is straightforward. If adaptation
reduces a damage by e.g. 10%, assumptions described above to model climate change have
been reduced by 10% as well. Additional economic effects stem from explicit modelling of
adaptation measures. Adaptation measures in retention areas, resilient cities and infrastructure
(measures 4.1, 5.6, 7.2 respectively) have been modelled as additional investment of the
construction industry. There is no crowding out assumed. Adaptation that improves the health
situation (measure 2.1) is modelled as additional investment of the sector “human health and
social work”. Again, no potential crowding out is assumed. Adaptation measures to reduce the
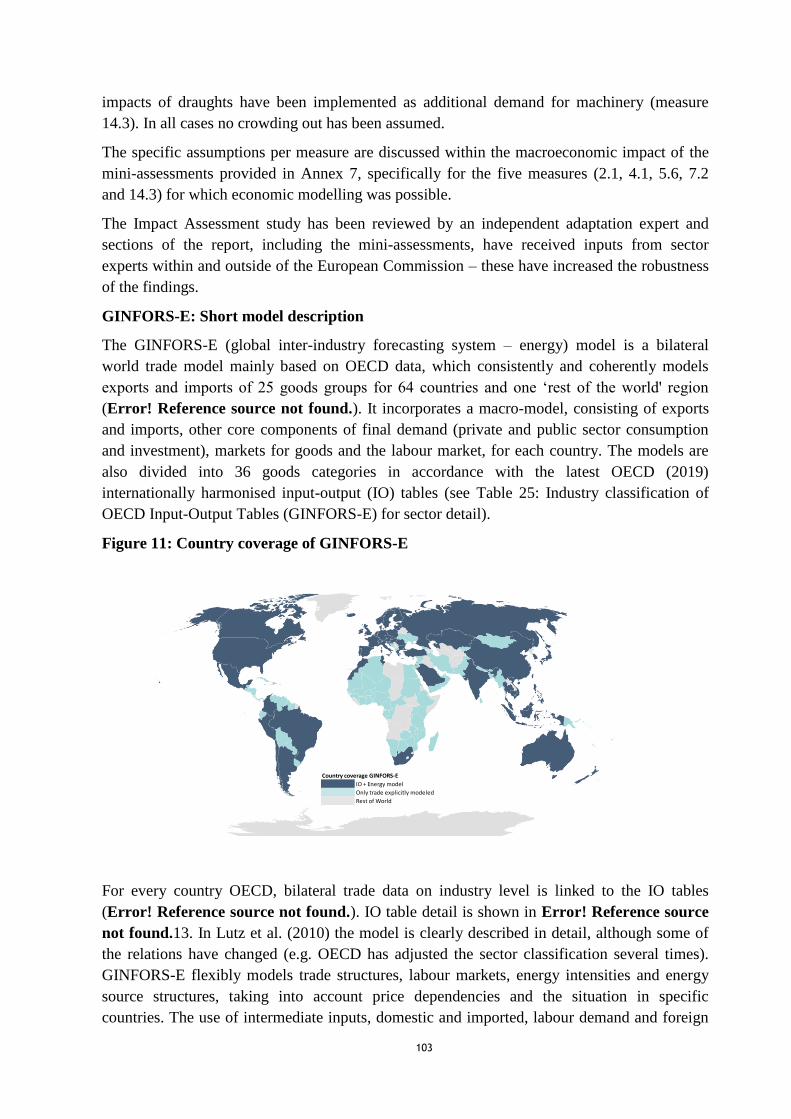
103
impacts of draughts have been implemented as additional demand for machinery (measure
14.3). In all cases no crowding out has been assumed.
The specific assumptions per measure are discussed within the macroeconomic impact of the
mini-assessments provided in Annex 7, specifically for the five measures (2.1, 4.1, 5.6, 7.2
and 14.3) for which economic modelling was possible.
The Impact Assessment study has been reviewed by an independent adaptation expert and
sections of the report, including the mini-assessments, have received inputs from sector
experts within and outside of the European Commission – these have increased the robustness
of the findings.
GINFORS-E: Short model description
The GINFORS-E (global inter-industry forecasting system – energy) model is a bilateral
world trade model mainly based on OECD data, which consistently and coherently models
exports and imports of 25 goods groups for 64 countries and one ‘rest of the world' region
(Error! Reference source not found.). It incorporates a macro-model, consisting of exports
and imports, other core components of final demand (private and public sector consumption
and investment), markets for goods and the labour market, for each country. The models are
also divided into 36 goods categories in accordance with the latest OECD (2019)
internationally harmonised input-output (IO) tables (see Table 25: Industry classification of
OECD Input-Output Tables (GINFORS-E) for sector detail).
Figure 11: Country coverage of GINFORS-E
For every country OECD, bilateral trade data on industry level is linked to the IO tables
(Error! Reference source not found.). IO table detail is shown in Error! Reference source
not found.13. In Lutz et al. (2010) the model is clearly described in detail, although some of
the relations have changed (e.g. OECD has adjusted the sector classification several times).
GINFORS-E flexibly models trade structures, labour markets, energy intensities and energy
source structures, taking into account price dependencies and the situation in specific
countries. The use of intermediate inputs, domestic and imported, labour demand and foreign
Country coverage GINFORS-E
IO + Energy model
Only trade explicitly modeled
Rest of World
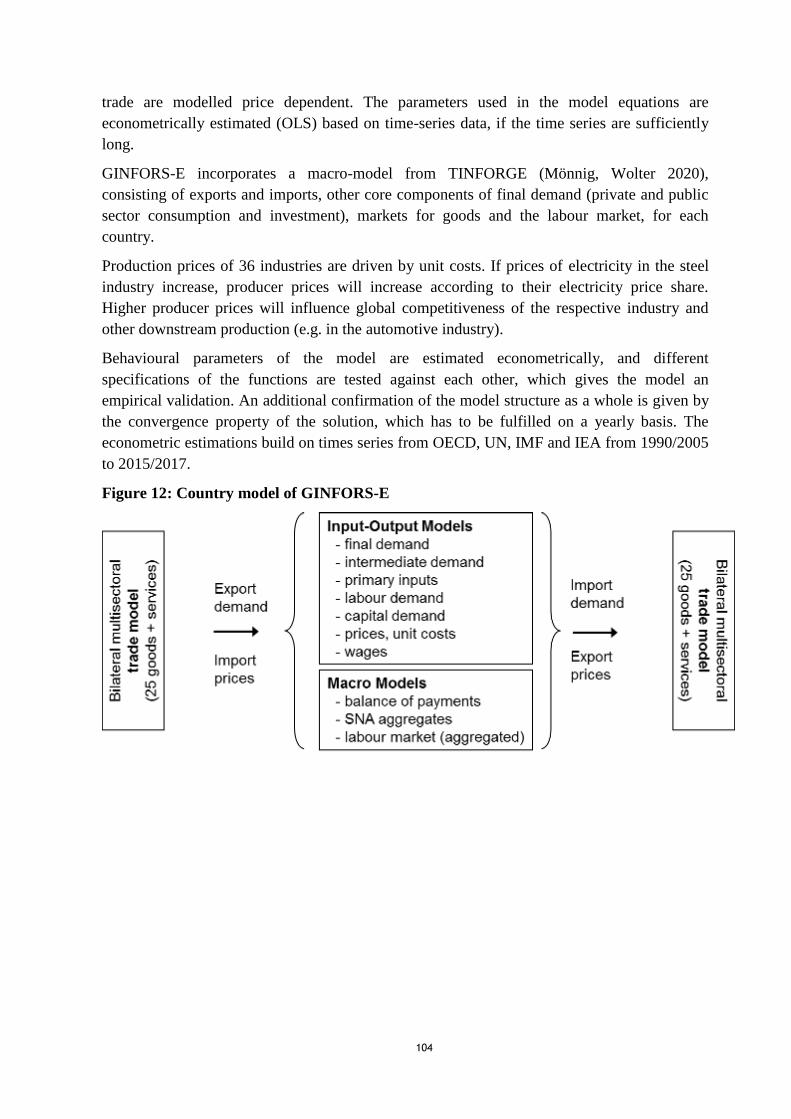
104
trade are modelled price dependent. The parameters used in the model equations are
econometrically estimated (OLS) based on time-series data, if the time series are sufficiently
long.
GINFORS-E incorporates a macro-model from TINFORGE (Mönnig, Wolter 2020),
consisting of exports and imports, other core components of final demand (private and public
sector consumption and investment), markets for goods and the labour market, for each
country.
Production prices of 36 industries are driven by unit costs. If prices of electricity in the steel
industry increase, producer prices will increase according to their electricity price share.
Higher producer prices will influence global competitiveness of the respective industry and
other downstream production (e.g. in the automotive industry).
Behavioural parameters of the model are estimated econometrically, and different
specifications of the functions are tested against each other, which gives the model an
empirical validation. An additional confirmation of the model structure as a whole is given by
the convergence property of the solution, which has to be fulfilled on a yearly basis. The
econometric estimations build on times series from OECD, UN, IMF and IEA from 1990/2005
to 2015/2017.
Figure 12: Country model of GINFORS-E
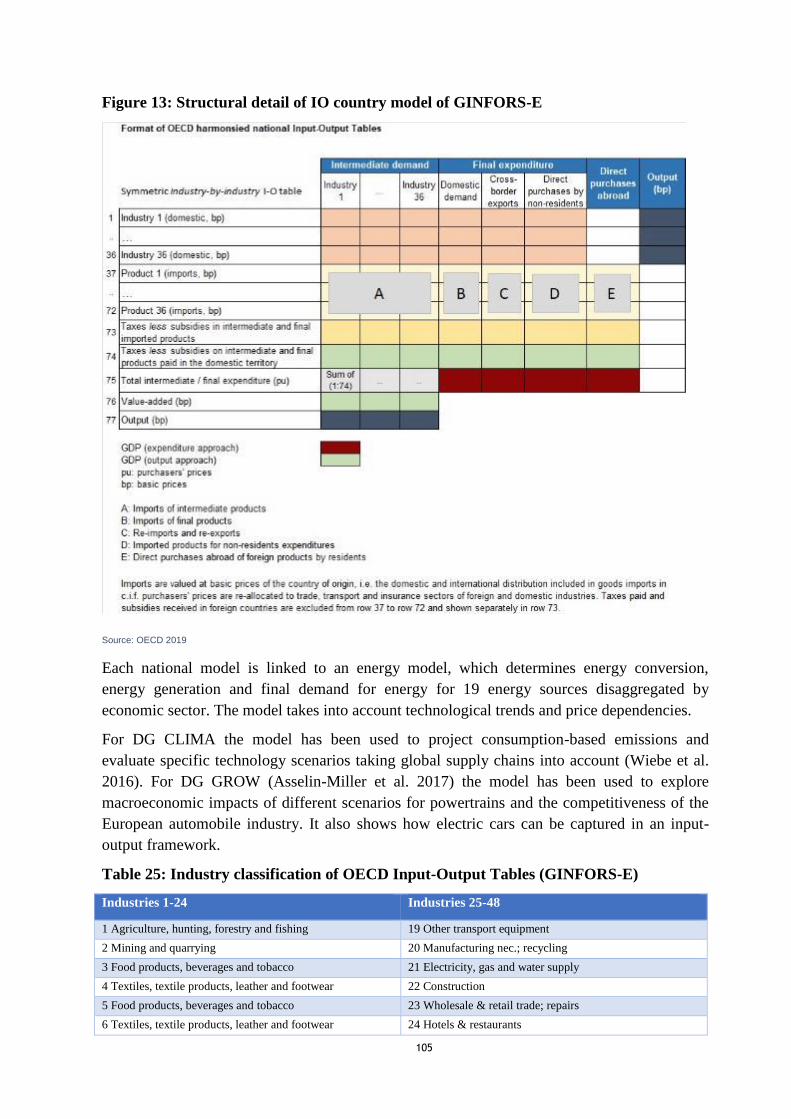
105
Figure 13: Structural detail of IO country model of GINFORS-E
Source: OECD 2019
Each national model is linked to an energy model, which determines energy conversion,
energy generation and final demand for energy for 19 energy sources disaggregated by
economic sector. The model takes into account technological trends and price dependencies.
For DG CLIMA the model has been used to project consumption-based emissions and
evaluate specific technology scenarios taking global supply chains into account (Wiebe et al.
2016). For DG GROW (Asselin-Miller et al. 2017) the model has been used to explore
macroeconomic impacts of different scenarios for powertrains and the competitiveness of the
European automobile industry. It also shows how electric cars can be captured in an input-
output framework.
Table 25: Industry classification of OECD Input-Output Tables (GINFORS-E)
Industries 1-24 Industries 25-48
1 Agriculture, hunting, forestry and fishing 19 Other transport equipment
2 Mining and quarrying 20 Manufacturing nec.; recycling
3 Food products, beverages and tobacco 21 Electricity, gas and water supply
4 Textiles, textile products, leather and footwear 22 Construction
5 Food products, beverages and tobacco 23 Wholesale & retail trade; repairs
6 Textiles, textile products, leather and footwear 24 Hotels & restaurants

106
7 Wood and products of wood and cork 25 Transport & storage
8 Pulp, paper, paper products, printing and publishing 26 Post & telecommunications
9 Coke, refined petroleum products and nuclear fuel 27 Financial intermediation
10 Chemicals and chemical products 28 Real estate activities
11 Rubber & plastics products 29 Renting of machinery & equipment
12 Other non-metallic mineral products 30 Computer & related activities
13 Basic metals 31 Computer & related activities
14 Fabricated metal products 32 Research & development and other business activities
15 Machinery & equipment, nec 33 Public admin. & defence; compulsory social security
16 Computer, Electronic and optical equipment 34 Education
17 Electrical machinery & apparatus, nec 35 Health & social work
18 Motor vehicles, trailers & semi-trailers 36 Other community, social & personal services
Source: OECD 2019 https://www.oecd.org/sti/ind/IOT_Industries_Items.pdf
Ultimately, two basic types of macroeconomic models can be distinguished, which are used
for the macroeconomic assessment of the energy transition and climate policies or climate
change: general equilibrium models (CGE) and macro-econometric models (sometimes also
known as macro-econometric input-output models). According to an EC study, the two types
of models can be distinguished as follows (Pollitt et al. 2017): Computable General
Equilibrium (CGE) models are based on neo-classical theory that households and businesses
maximize their benefits and profits. The markets of different goods are cleared (are in an
equilibrium), i.e. supply and demand balance and economic resources are fully utilized.
Involuntary unemployment is not possible in the standard case. Higher demand for a good (for
example, renewable energy required for the energy transition) leads to higher prices of
primary factors (energy, capital, labour) and a reallocation of resources away from the
optimal. Macro-econometric models are based on the post-Keynesian theory that emphasizes
the demand side, with both market sides playing an important role, unlike simple input-output
approaches. Behavioural parameters are determined by econometric estimation of time series
data, so the empirical estimation of model parameters is of great importance. Markets are
usually not cleared, as the economy is assumed not to be in equilibrium. Involuntary
unemployment and idle capital are included. Imbalances between supply and demand are more
likely to be offset by demand-driven rather than price effects. However, the study also
emphasizes that the models used in policy advice break away from rigid theories to more
adequately reflect reality.
Uncertainty and sensitivity analysis
Uncertainty has an important role in analysis of climate change and its future impacts as there
is both (1) uncertainty in the modelling of impacts, with our understanding of these improving
but not complete; and, (2) uncertainty in the mitigation efforts that will shape the future
climate impacts we will face. Uncertainty in climate analysis is typically dealt with using
climate scenarios, modelling different policy, emissions and temperature pathways. This work
also utilises a scenario-based approach to sensitivity check the impacts. Quantitatively, as
described above three scenarios are modelled based on the IPCC RCP scenarios 2.6, 4.5 and
8.5. These correspond to estimated temperature increases, although within a range due to the
modelling uncertainty described above (1), which could be described as low-medium-high.
The detailed quantitative results for economic welfare and employment in chapter 6 present
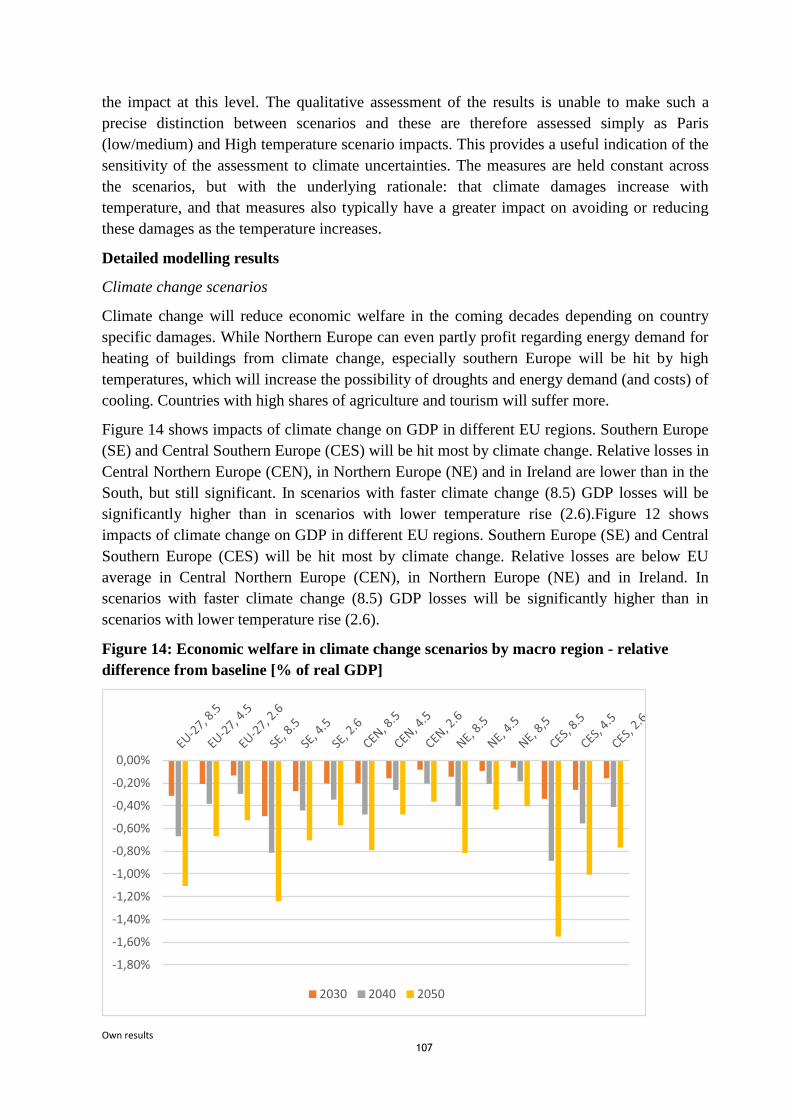
107
the impact at this level. The qualitative assessment of the results is unable to make such a
precise distinction between scenarios and these are therefore assessed simply as Paris
(low/medium) and High temperature scenario impacts. This provides a useful indication of the
sensitivity of the assessment to climate uncertainties. The measures are held constant across
the scenarios, but with the underlying rationale: that climate damages increase with
temperature, and that measures also typically have a greater impact on avoiding or reducing
these damages as the temperature increases.
Detailed modelling results
Climate change scenarios
Climate change will reduce economic welfare in the coming decades depending on country
specific damages. While Northern Europe can even partly profit regarding energy demand for
heating of buildings from climate change, especially southern Europe will be hit by high
temperatures, which will increase the possibility of droughts and energy demand (and costs) of
cooling. Countries with high shares of agriculture and tourism will suffer more.
Figure 14 shows impacts of climate change on GDP in different EU regions. Southern Europe
(SE) and Central Southern Europe (CES) will be hit most by climate change. Relative losses in
Central Northern Europe (CEN), in Northern Europe (NE) and in Ireland are lower than in the
South, but still significant. In scenarios with faster climate change (8.5) GDP losses will be
significantly higher than in scenarios with lower temperature rise (2.6).Figure 12 shows
impacts of climate change on GDP in different EU regions. Southern Europe (SE) and Central
Southern Europe (CES) will be hit most by climate change. Relative losses are below EU
average in Central Northern Europe (CEN), in Northern Europe (NE) and in Ireland. In
scenarios with faster climate change (8.5) GDP losses will be significantly higher than in
scenarios with lower temperature rise (2.6).
Figure 14: Economic welfare in climate change scenarios by macro region - relative
difference from baseline [% of real GDP]
Own results
-1,80%
-1,60%
-1,40%
-1,20%
-1,00%
-0,80%
-0,60%
-0,40%
-0,20%
0,00%
2030 2040 2050
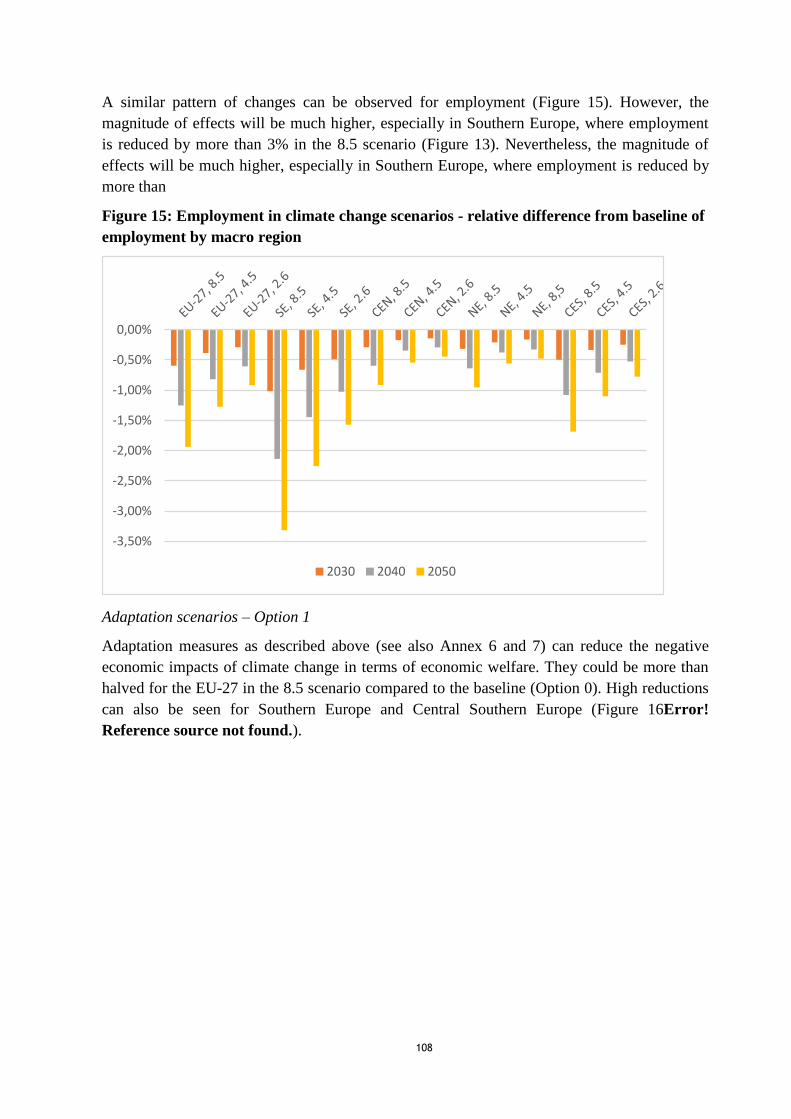
108
A similar pattern of changes can be observed for employment (Figure 15). However, the
magnitude of effects will be much higher, especially in Southern Europe, where employment
is reduced by more than 3% in the 8.5 scenario (Figure 13). Nevertheless, the magnitude of
effects will be much higher, especially in Southern Europe, where employment is reduced by
more than
Figure 15: Employment in climate change scenarios - relative difference from baseline of
employment by macro region
Adaptation scenarios – Option 1
Adaptation measures as described above (see also Annex 6 and 7) can reduce the negative
economic impacts of climate change in terms of economic welfare. They could be more than
halved for the EU-27 in the 8.5 scenario compared to the baseline (Option 0). High reductions
can also be seen for Southern Europe and Central Southern Europe (Figure 16Error!
Reference source not found.).
-3,50%
-3,00%
-2,50%
-2,00%
-1,50%
-1,00%
-0,50%
0,00%
2030 2040 2050
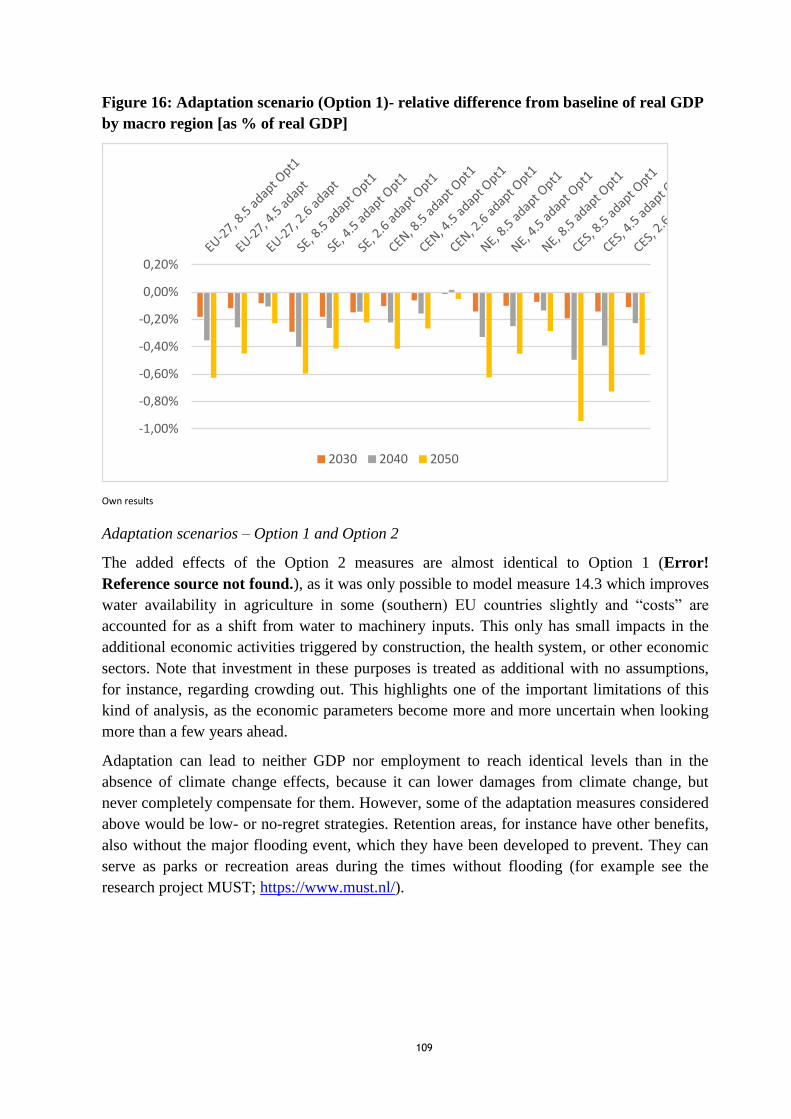
109
Figure 16: Adaptation scenario (Option 1)- relative difference from baseline of real GDP
by macro region [as % of real GDP]
Own results
Adaptation scenarios – Option 1 and Option 2
The added effects of the Option 2 measures are almost identical to Option 1 (Error!
Reference source not found.), as it was only possible to model measure 14.3 which improves
water availability in agriculture in some (southern) EU countries slightly and “costs” are
accounted for as a shift from water to machinery inputs. This only has small impacts in the
additional economic activities triggered by construction, the health system, or other economic
sectors. Note that investment in these purposes is treated as additional with no assumptions,
for instance, regarding crowding out. This highlights one of the important limitations of this
kind of analysis, as the economic parameters become more and more uncertain when looking
more than a few years ahead.
Adaptation can lead to neither GDP nor employment to reach identical levels than in the
absence of climate change effects, because it can lower damages from climate change, but
never completely compensate for them. However, some of the adaptation measures considered
above would be low- or no-regret strategies. Retention areas, for instance have other benefits,
also without the major flooding event, which they have been developed to prevent. They can
serve as parks or recreation areas during the times without flooding (for example see the
research project MUST; https://www.must.nl/).
-1,00%
-0,80%
-0,60%
-0,40%
-0,20%
0,00%
0,20%
2030 2040 2050
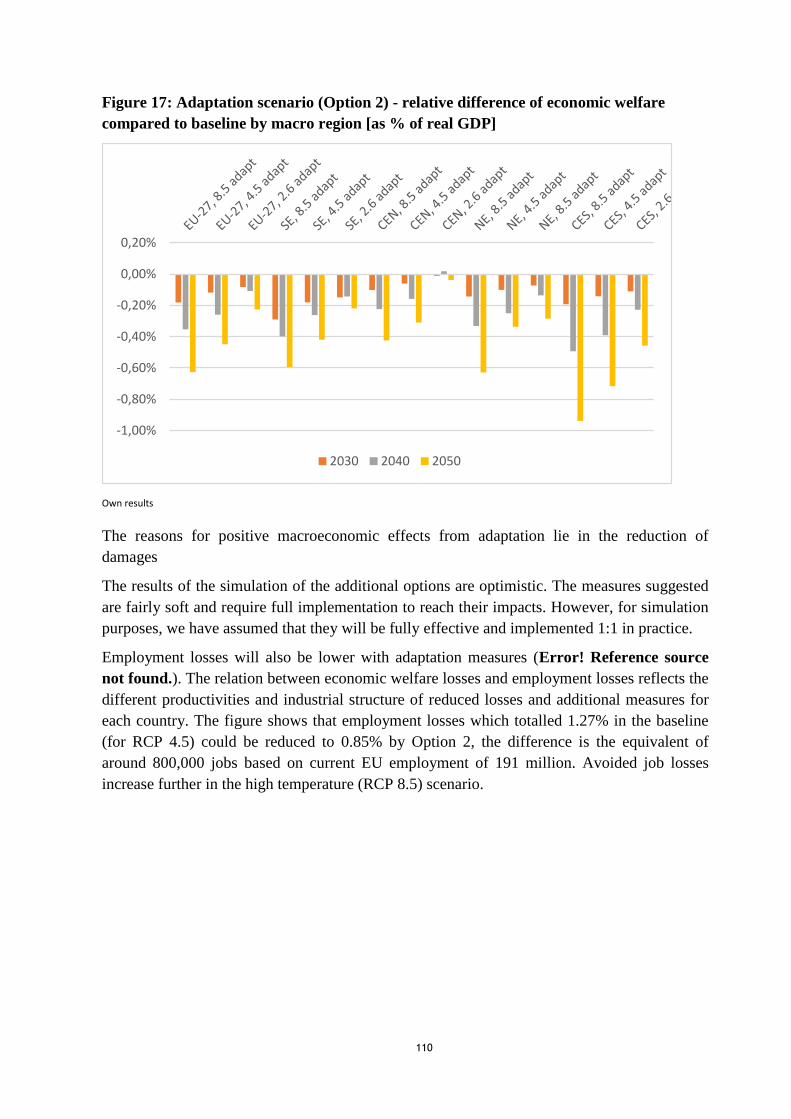
110
Figure 17: Adaptation scenario (Option 2) - relative difference of economic welfare
compared to baseline by macro region [as % of real GDP]
Own results
The reasons for positive macroeconomic effects from adaptation lie in the reduction of
damages
The results of the simulation of the additional options are optimistic. The measures suggested
are fairly soft and require full implementation to reach their impacts. However, for simulation
purposes, we have assumed that they will be fully effective and implemented 1:1 in practice.
Employment losses will also be lower with adaptation measures (Error! Reference source
not found.). The relation between economic welfare losses and employment losses reflects the
different productivities and industrial structure of reduced losses and additional measures for
each country. The figure shows that employment losses which totalled 1.27% in the baseline
(for RCP 4.5) could be reduced to 0.85% by Option 2, the difference is the equivalent of
around 800,000 jobs based on current EU employment of 191 million. Avoided job losses
increase further in the high temperature (RCP 8.5) scenario.
-1,00%
-0,80%
-0,60%
-0,40%
-0,20%
0,00%
0,20%
2030 2040 2050
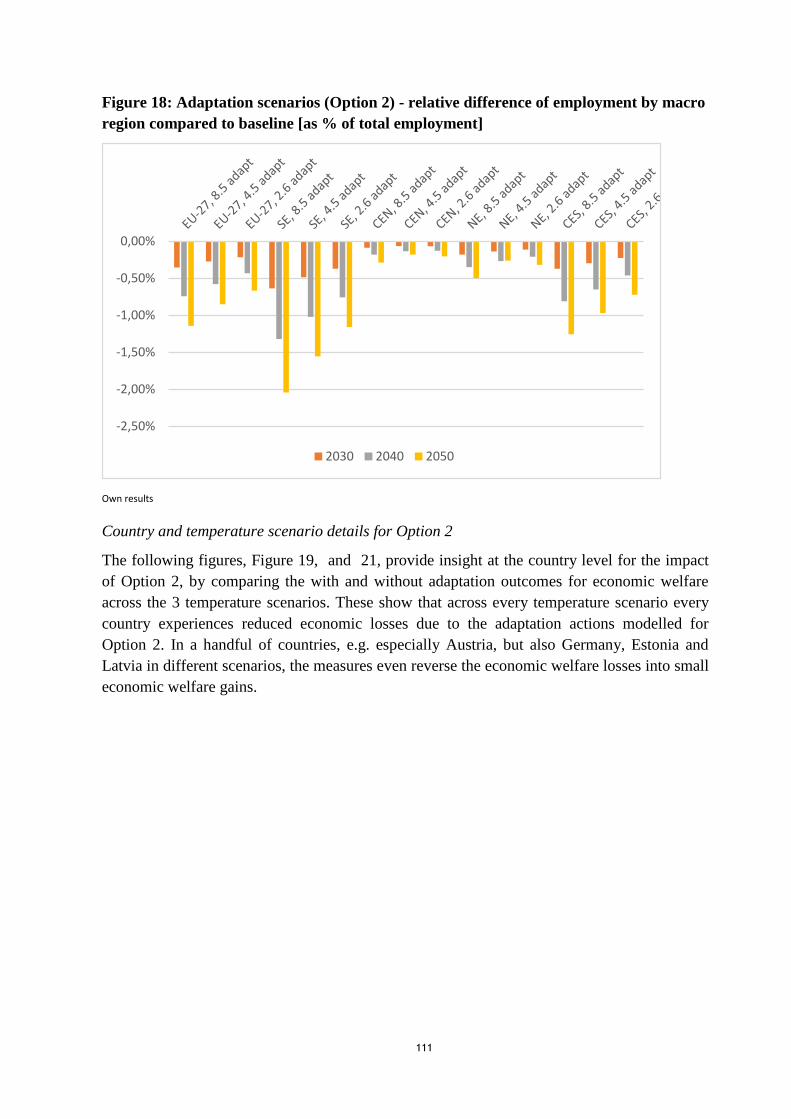
111
Figure 18: Adaptation scenarios (Option 2) - relative difference of employment by macro
region compared to baseline [as % of total employment]
Own results
Country and temperature scenario details for Option 2
The following figures, Figure 19, and 21, provide insight at the country level for the impact
of Option 2, by comparing the with and without adaptation outcomes for economic welfare
across the 3 temperature scenarios. These show that across every temperature scenario every
country experiences reduced economic losses due to the adaptation actions modelled for
Option 2. In a handful of countries, e.g. especially Austria, but also Germany, Estonia and
Latvia in different scenarios, the measures even reverse the economic welfare losses into small
economic welfare gains.
-2,50%
-2,00%
-1,50%
-1,00%
-0,50%
0,00%
2030 2040 2050

112
Figure 19: 1.5°C scenario (RCP 2.6) Relative differences in economic welfare compared
to baseline by 2050 [as % of real annual GDP]
Figure 20: 2.0°C scenario (RCP 4.5) Relative differences in economic welfare by 2050
compared to baseline [as % of real annual GDP]
-0.025
-0.02
-0.015
-0.01
-0.005
0
0.005
2050 CC 2050 Adapt
-0.03
-0.025
-0.02
-0.015
-0.01
-0.005
0
0.005
2050 CC 2050 Adapt

113
Figure 21: 4°C scenario (RCP 8.5) Relative differences in economic welfare by 2050
compared to baseline [as % of real GDP]
References
Asselin-Miller, N., Horton, G., Amaral, S., Figg, H., Sheldon, D., Lutz, C., Flaute, M. &
Wells, P. (2017): GEAR 2030 Strategy 2015–2017. Comparative analysis of the
competitive position of the EU automotive industry and the impact of the introduction of
autonomous vehicles. Final report for DG GROWTH – Directorate General for Internal
Market, Industry, Entrepreneurship and SMEs, Luxembourg.
Barker, T., Lutz, C., Meyer, B. & Pollitt, H. (2011): Models for Projecting the Impacts of
ETR. In: Ekins, P. & Speck, S. [ed.]: Environmental Tax Reform (ETR) - A Policy for
Green Growth, Oxford University Press, New York, pp. 175-203.
Lehr, U., Flaute, M., Ahmann, L., Nieters, A., Hirschfeld, J., Welling, M., Wolff, C., Gall, A.,
Kersting,J., Mahlbacher, M., von Möllendorff, C. (2020): Vertiefte ökonomische Analyse
einzelner Politikinstrumente und Maßnahmen zur Anpassung an den Klimawandel
(forthcoming).
Lehr, U. & Lutz, C. (2020): Macro-econometric and structural models. In: Soytas, U, Sari, R.
(eds.): Routledge Handbook of Energy Economics. Routledge, London, New York, pp.
472–480.
Lutz, C., Banning, M., Paroussos, L., Fragkiadakis, K. (2020): Models to analyse international
interrelations of the EU ETS. Reference scenario documentation – draft. (unpublished draft
report for a project for the German Federal Environment Agency UBA).
Lutz, C., Meyer, B. & Wolter, M. I. (2010): The Global Multisector/Multicountry 3-E Model
GINFORS. A Description of the Model and a Baseline Forecast for Global Energy Demand
and CO2 Emissions. International Journal of Global Environmental Issues, 10, 25-45.
IEA (2019): World Energy Outlook 2019, Paris.
-0.045
-0.04
-0.035
-0.03
-0.025
-0.02
-0.015
-0.01
-0.005
0
0.005
2050 CC 2050 Adapt
114
EU (2018): The 2018 Ageing Report: Economic & Budgetary Projections for the 28 EU
Member States (2016–2070). Institutional Paper 079, European Commission, Brussels.
Mönnig, A. & Wolter, M. I. (2020): TINFORGE – Trade in INFORGE. Methoden-Update
2020. GWS Discussion Paper 2020/4, Osnabrück.
OECD (2019): Input-Output Tables. URL: http://www.oecd.org/sti/ind/input-outputtables.htm
[retrieved on January 23 2020].
Orlov, A., Sillmann, J., Aaheim, A., Aunan, K., de Bruin, K. (2019): Economic Losses of
Heat-Induced Reductions in Outdoor Worker Productivity: a Case Study of Europe,
Economics of Disasters and Climate Change (2019) 3:191–211,
https://doi.org/10.1007/s41885-019-00044-0
Pollitt, H., Alexandri, E., Anagnostopoulos, F., De Rose, A., Farhangi, C., Hoste, T.,
Markkanen, S., Theillard, P., Vergez, C., Boogt, M. (2017): The macro-level and sectoral
impacts of Energy Efficiency policies. Final report. European Union, July 2017.
Szewczyk, W., Feyen. L., Ciscar, J.C., Matei, A.,Mulholland, E., Soria, A. (2020): Economic
analysis of selected climate impacts, JRC PESETA IV project – Task 14
UN (2019): UN, World Population Prospects 2019, "Medium Variant". URL:
https://population.un.org/wpp/Download/Standard/Population/ [retrieved on January 23
2020].
Wiebe, K. S. & Lutz, C. (2016): Endogenous technological change and the policy mix in
renewable power generation. In: Renewable and Sustainable Energy Reviews 60, 739-751.
DOI: 10.1016/j.rser.2015.12.176.
115
Annex 5: Impact screening
Following Better Regulation Tool #19 we have undertaken an impact screening to identify the
most significant impacts to be assessed as part of the IA. The impacts to be assessed flow from
the problem definition and the objectives as presented in chapters 2 and 4 of the main IA.
The Adaptation Strategy has, through the various actions and proposed measures, a huge mix
of intended direct and indirect actions and behavioural changes interlinked across the many
actions and measures considered under the policy options. The Strategy also aims to address
almost all levels of society and public authorities, and across multiple themes and economic
sectors, as the need for adaptation is quite all-encompassing. The impact screening involved
consideration of the following channels of action:
Direct behavioural changes
Obligations to public authorities, particularly Member States, but potentially also other
levels, and also private sector organisations. E.g. to produce adaptation strategies, to
integrate adaptation in industry standards, etc.;
Support to organisations, public and private, to take action, e.g. Pilot programmes funded
under LIFE, Horizon Europe, or other programmes, policy (technical) support facilities;
Obligations within EC on mainstreaming of action across policy areas, e.g. inclusion of
resilience in major project funding;
Indirect behavioural changes
Increased information and awareness – including through the production of guidance,
development of methodologies, orientation of research programmes, organisation and
dissemination of their outputs and solutions, good practices
Better decision making – by encouraging planning and action, and broadening the
knowledge base especially on solutions and good practice
Ultimate impacts on public policy goals
Increased resilience from greater implementation, from better decisions, based on
increased knowledge
As the number and variety of actions and measures under the Adaptation Strategy is high (see
Annex 6), the specific impacts of individual measures and actions are too numerous to form
the basis of the impact assessment therefore the impacts need to be considered at a higher,
aggregated level. Starting from the base list of the Better Regulation Tool we made the
following screening, as shown in Table 18.
The results of Q12 of the OPC have been taken into account in this screening, highlighting the
importance attached to healthier ecosystems – addressed via the impact indicator on ‘Use of
ecosystem-based solutions and increased resilience of ecosystems’; on preventing climate
risks – addressed as part of the indicator on ‘Impact on climate resilience‘; and enabling
climate-informed decisions by citizens – addressed as part of the impact indicator on
’distributional and equity impacts’.
The results of the interviews are also considered, which identified that the impacts are all
linked, and that environmental and social impacts are at least as important as economic
impacts for adaptation. Reduced damages were identified as a key economic indicator, and
impacts on wellbeing and health were highlighted amongst the social indicators. For economic
damages, it may be covered with the Gross Value Added (GVA) indicator, which will reduce
with damages, or we consider to potentially also have a damage indicator to sit alongside.
Wellbeing is encompassed within the social protection aspect of the impact indicator on
‘Distributional and equity impacts’, whilst health is covered by both this and the impact
indicator on ‘impact on public health and civil emergency systems’.
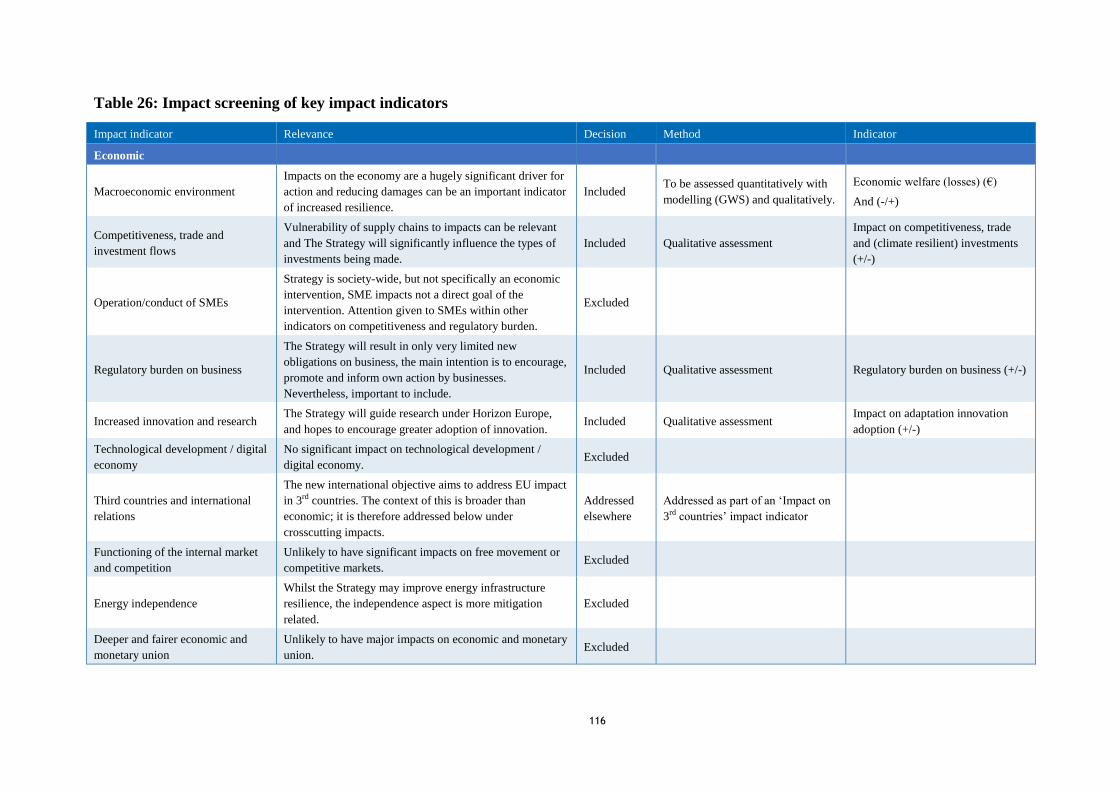
116
Table 26: Impact screening of key impact indicators
Impact indicator Relevance Decision Method Indicator
Economic
Macroeconomic environment
Impacts on the economy are a hugely significant driver for
action and reducing damages can be an important indicator
of increased resilience.
Included To be assessed quantitatively with
modelling (GWS) and qualitatively.
Economic welfare (losses) (€)
And (-/+)
Competitiveness, trade and
investment flows
Vulnerability of supply chains to impacts can be relevant
and The Strategy will significantly influence the types of
investments being made.
Included Qualitative assessment
Impact on competitiveness, trade
and (climate resilient) investments
(+/-)
Operation/conduct of SMEs
Strategy is society-wide, but not specifically an economic
intervention, SME impacts not a direct goal of the
intervention. Attention given to SMEs within other
indicators on competitiveness and regulatory burden.
Excluded
Regulatory burden on business
The Strategy will result in only very limited new
obligations on business, the main intention is to encourage,
promote and inform own action by businesses.
Nevertheless, important to include.
Included Qualitative assessment Regulatory burden on business (+/-)
Increased innovation and research The Strategy will guide research under Horizon Europe,
and hopes to encourage greater adoption of innovation. Included Qualitative assessment
Impact on adaptation innovation
adoption (+/-)
Technological development / digital
economy
No significant impact on technological development /
digital economy. Excluded
Third countries and international
relations
The new international objective aims to address EU impact
in 3rd countries. The context of this is broader than
economic; it is therefore addressed below under
crosscutting impacts.
Addressed
elsewhere
Addressed as part of an ‘Impact on
3rd countries’ impact indicator
Functioning of the internal market
and competition
Unlikely to have significant impacts on free movement or
competitive markets. Excluded
Energy independence
Whilst the Strategy may improve energy infrastructure
resilience, the independence aspect is more mitigation
related.
Excluded
Deeper and fairer economic and
monetary union
Unlikely to have major impacts on economic and monetary
union. Excluded
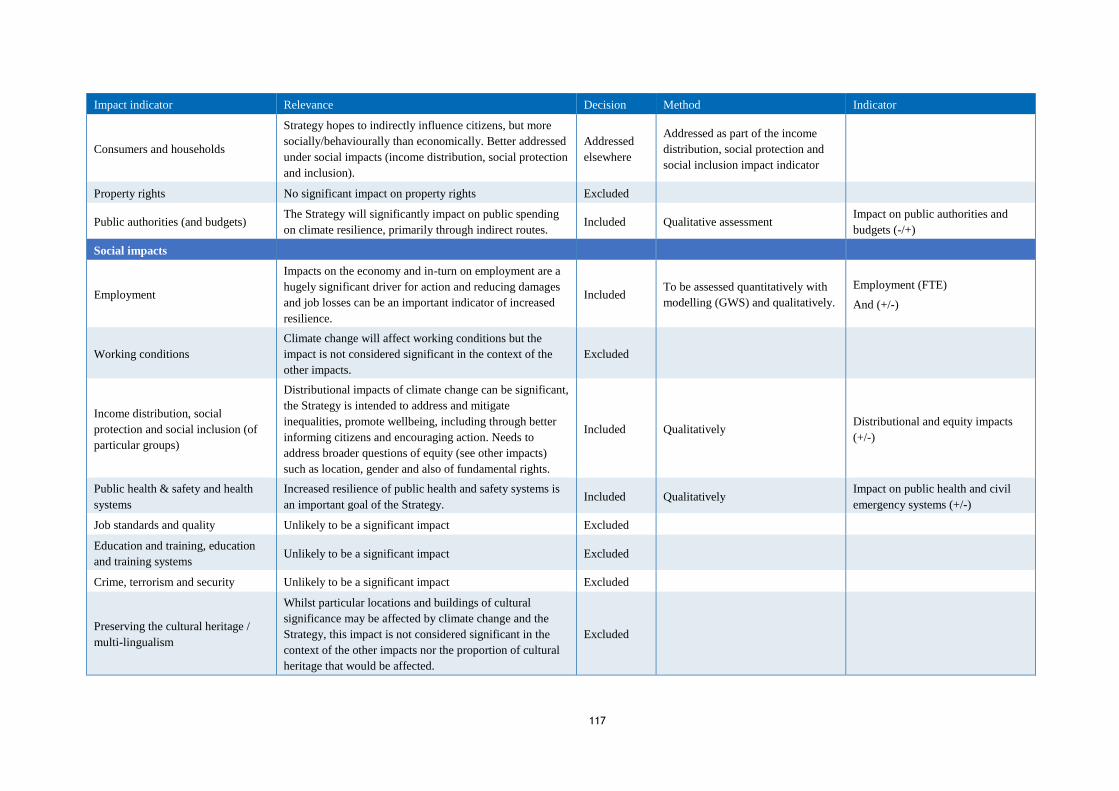
117
Impact indicator Relevance Decision Method Indicator
Consumers and households
Strategy hopes to indirectly influence citizens, but more
socially/behaviourally than economically. Better addressed
under social impacts (income distribution, social protection
and inclusion).
Addressed
elsewhere
Addressed as part of the income
distribution, social protection and
social inclusion impact indicator
Property rights No significant impact on property rights Excluded
Public authorities (and budgets) The Strategy will significantly impact on public spending
on climate resilience, primarily through indirect routes. Included Qualitative assessment
Impact on public authorities and
budgets (-/+)
Social impacts
Employment
Impacts on the economy and in-turn on employment are a
hugely significant driver for action and reducing damages
and job losses can be an important indicator of increased
resilience.
Included To be assessed quantitatively with
modelling (GWS) and qualitatively.
Employment (FTE)
And (+/-)
Working conditions
Climate change will affect working conditions but the
impact is not considered significant in the context of the
other impacts.
Excluded
Income distribution, social
protection and social inclusion (of
particular groups)
Distributional impacts of climate change can be significant,
the Strategy is intended to address and mitigate
inequalities, promote wellbeing, including through better
informing citizens and encouraging action. Needs to
address broader questions of equity (see other impacts)
such as location, gender and also of fundamental rights.
Included Qualitatively Distributional and equity impacts
(+/-)
Public health & safety and health
systems
Increased resilience of public health and safety systems is
an important goal of the Strategy. Included Qualitatively
Impact on public health and civil
emergency systems (+/-)
Job standards and quality Unlikely to be a significant impact Excluded
Education and training, education
and training systems Unlikely to be a significant impact Excluded
Crime, terrorism and security Unlikely to be a significant impact Excluded
Preserving the cultural heritage /
multi-lingualism
Whilst particular locations and buildings of cultural
significance may be affected by climate change and the
Strategy, this impact is not considered significant in the
context of the other impacts nor the proportion of cultural
heritage that would be affected.
Excluded
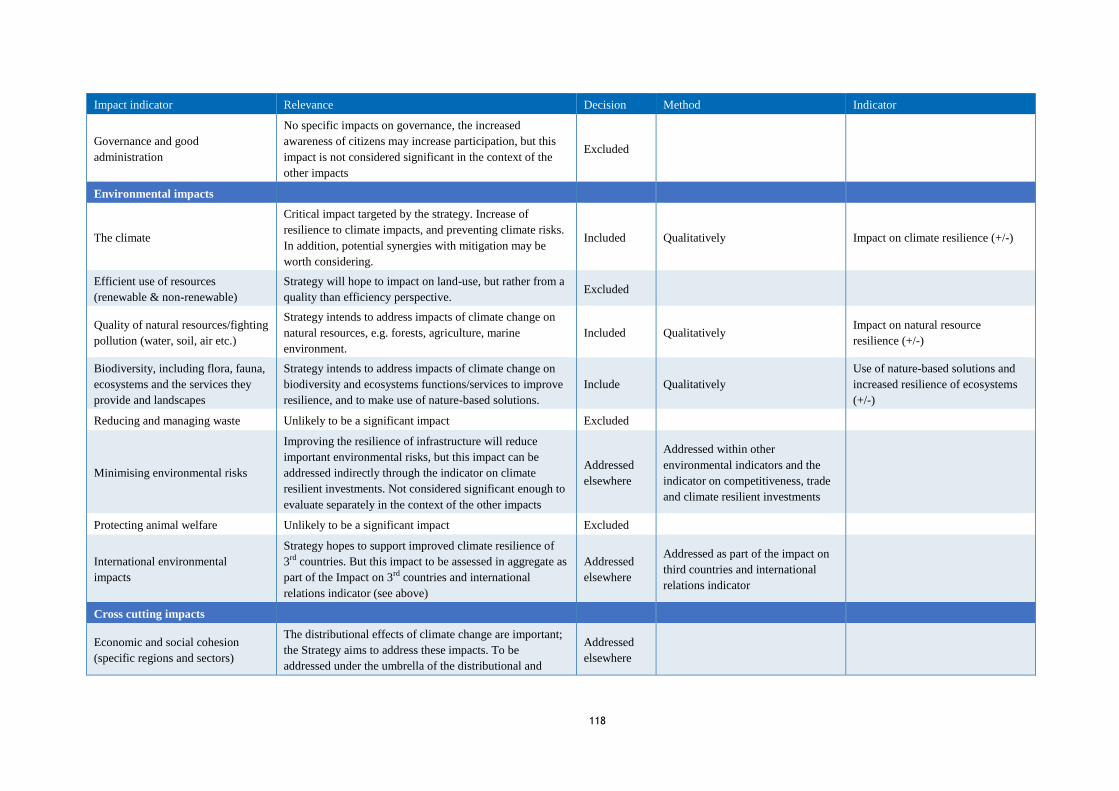
118
Impact indicator Relevance Decision Method Indicator
Governance and good
administration
No specific impacts on governance, the increased
awareness of citizens may increase participation, but this
impact is not considered significant in the context of the
other impacts
Excluded
Environmental impacts
The climate
Critical impact targeted by the strategy. Increase of
resilience to climate impacts, and preventing climate risks.
In addition, potential synergies with mitigation may be
worth considering.
Included Qualitatively Impact on climate resilience (+/-)
Efficient use of resources
(renewable & non-renewable)
Strategy will hope to impact on land-use, but rather from a
quality than efficiency perspective. Excluded
Quality of natural resources/fighting
pollution (water, soil, air etc.)
Strategy intends to address impacts of climate change on
natural resources, e.g. forests, agriculture, marine
environment.
Included Qualitatively Impact on natural resource
resilience (+/-)
Biodiversity, including flora, fauna,
ecosystems and the services they
provide and landscapes
Strategy intends to address impacts of climate change on
biodiversity and ecosystems functions/services to improve
resilience, and to make use of nature-based solutions.
Include Qualitatively
Use of nature-based solutions and
increased resilience of ecosystems
(+/-)
Reducing and managing waste Unlikely to be a significant impact Excluded
Minimising environmental risks
Improving the resilience of infrastructure will reduce
important environmental risks, but this impact can be
addressed indirectly through the indicator on climate
resilient investments. Not considered significant enough to
evaluate separately in the context of the other impacts
Addressed
elsewhere
Addressed within other
environmental indicators and the
indicator on competitiveness, trade
and climate resilient investments
Protecting animal welfare Unlikely to be a significant impact Excluded
International environmental
impacts
Strategy hopes to support improved climate resilience of
3rd countries. But this impact to be assessed in aggregate as
part of the Impact on 3rd countries and international
relations indicator (see above)
Addressed
elsewhere
Addressed as part of the impact on
third countries and international
relations indicator
Cross cutting impacts
Economic and social cohesion
(specific regions and sectors)
The distributional effects of climate change are important;
the Strategy aims to address these impacts. To be
addressed under the umbrella of the distributional and
Addressed
elsewhere
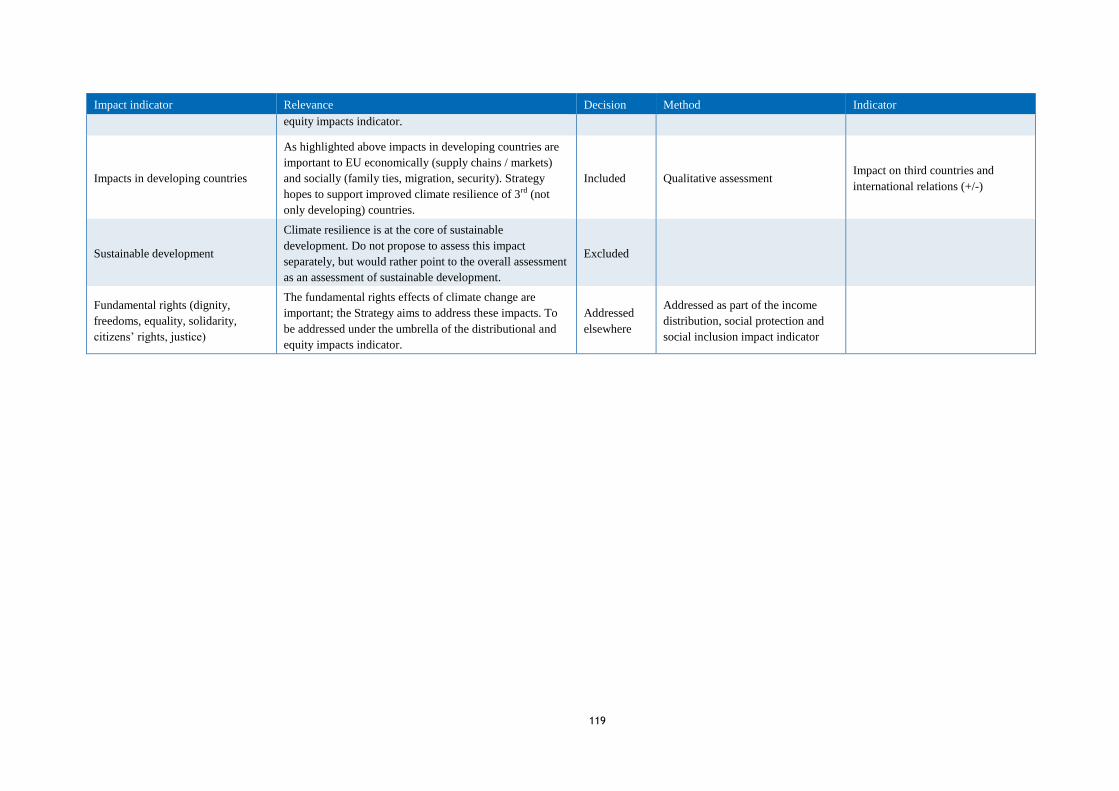
119
Impact indicator Relevance Decision Method Indicator
equity impacts indicator.
Impacts in developing countries
As highlighted above impacts in developing countries are
important to EU economically (supply chains / markets)
and socially (family ties, migration, security). Strategy
hopes to support improved climate resilience of 3rd (not
only developing) countries.
Included Qualitative assessment Impact on third countries and
international relations (+/-)
Sustainable development
Climate resilience is at the core of sustainable
development. Do not propose to assess this impact
separately, but would rather point to the overall assessment
as an assessment of sustainable development.
Excluded
Fundamental rights (dignity,
freedoms, equality, solidarity,
citizens’ rights, justice)
The fundamental rights effects of climate change are
important; the Strategy aims to address these impacts. To
be addressed under the umbrella of the distributional and
equity impacts indicator.
Addressed
elsewhere
Addressed as part of the income
distribution, social protection and
social inclusion impact indicator

120
Annex 6: Non-exhaustive list of measures to be developed under the new EU Adaptation Strategy
As described in chapter 5, not all measures envisaged under this strategy have been assessed in this impact assessment. The table in this annex lists a
more comprehensive, yet not exhaustive list of measures that are considered for the strategy. The measures in green have been subjected to the impact
assessment treatment, providing an analysis of the impact of measures based on desk review and impact pathways targeted or expected up to 2050.
Table 27: Non-exhaustive list of measures to be developed under the new EU Adaptation Strategy up to 2050
ACTIONS MEASURES
POLICY OPTION 1
1. Closing further gaps in adaptation-
relevant knowledge, through systematic
data collection and sharing, and working
with key public and private partners.
1.1: Ensure broad data collection, exploit new data sources and involve citizens in the collection of data
(e.g. citizen science). Promote access to comparable and granular data related to adaptation and climate
risks.
1.2: Develop an research and innovation roadmap and progress the state of the art on adaptation
modelling (including agent-based modelling) and risk assessment tools – “Towards asset-level
modelling”
1.3: Develop a spatially explicit assessment of future climate risks, and ecosystems vulnerabilities and
shifts under different climate change scenarios.
1.4: Research supporting wetland and floodplain restoration and nature-based solutions in drought and
flood management
1.5: Close the climate disaster loss and risk data gap through (1) facilitating the recording,
collecting and sharing of loss data from public and private sources through standards (2)
establishing a climate risk data governance framework and ensuring open access to data, (3)
collecting data on direct economic losses, non-economic losses and slow-onset events, and aligning
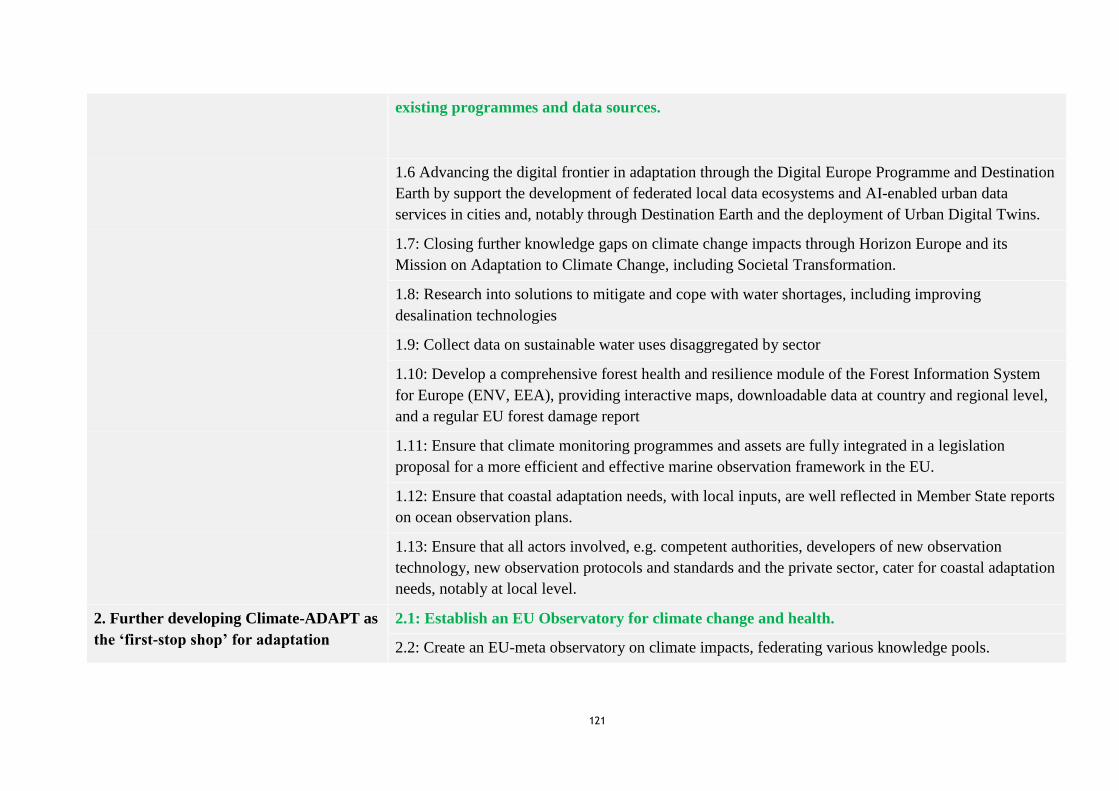
121
existing programmes and data sources.
1.6 Advancing the digital frontier in adaptation through the Digital Europe Programme and Destination
Earth by support the development of federated local data ecosystems and AI-enabled urban data
services in cities and, notably through Destination Earth and the deployment of Urban Digital Twins.
1.7: Closing further knowledge gaps on climate change impacts through Horizon Europe and its
Mission on Adaptation to Climate Change, including Societal Transformation.
1.8: Research into solutions to mitigate and cope with water shortages, including improving
desalination technologies
1.9: Collect data on sustainable water uses disaggregated by sector
1.10: Develop a comprehensive forest health and resilience module of the Forest Information System
for Europe (ENV, EEA), providing interactive maps, downloadable data at country and regional level,
and a regular EU forest damage report
1.11: Ensure that climate monitoring programmes and assets are fully integrated in a legislation
proposal for a more efficient and effective marine observation framework in the EU.
1.12: Ensure that coastal adaptation needs, with local inputs, are well reflected in Member State reports
on ocean observation plans.
1.13: Ensure that all actors involved, e.g. competent authorities, developers of new observation
technology, new observation protocols and standards and the private sector, cater for coastal adaptation
needs, notably at local level.
2. Further developing Climate-ADAPT as
the ‘first-stop shop’ for adaptation
2.1: Establish an EU Observatory for climate change and health.
2.2: Create an EU-meta observatory on climate impacts, federating various knowledge pools.
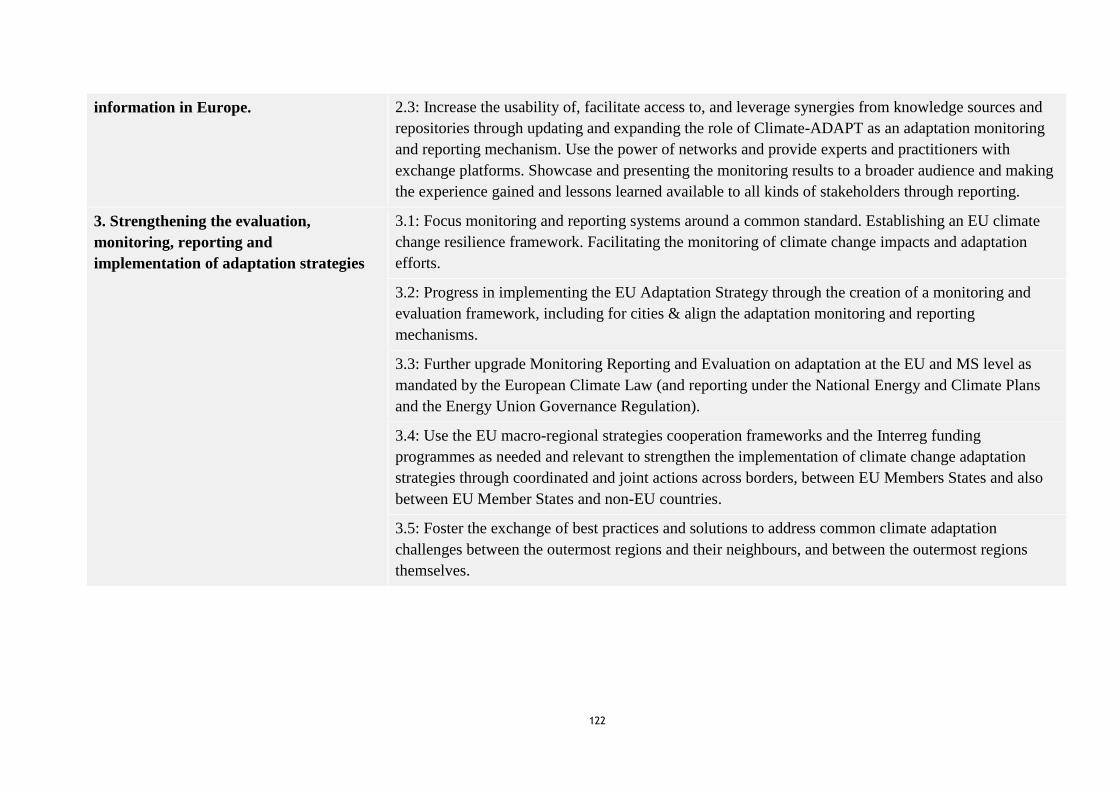
122
information in Europe.
2.3: Increase the usability of, facilitate access to, and leverage synergies from knowledge sources and
repositories through updating and expanding the role of Climate-ADAPT as an adaptation monitoring
and reporting mechanism. Use the power of networks and provide experts and practitioners with
exchange platforms. Showcase and presenting the monitoring results to a broader audience and making
the experience gained and lessons learned available to all kinds of stakeholders through reporting.
3. Strengthening the evaluation,
monitoring, reporting and
implementation of adaptation strategies
3.1: Focus monitoring and reporting systems around a common standard. Establishing an EU climate
change resilience framework. Facilitating the monitoring of climate change impacts and adaptation
efforts.
3.2: Progress in implementing the EU Adaptation Strategy through the creation of a monitoring and
evaluation framework, including for cities & align the adaptation monitoring and reporting
mechanisms.
3.3: Further upgrade Monitoring Reporting and Evaluation on adaptation at the EU and MS level as
mandated by the European Climate Law (and reporting under the National Energy and Climate Plans
and the Energy Union Governance Regulation).
3.4: Use the EU macro-regional strategies cooperation frameworks and the Interreg funding
programmes as needed and relevant to strengthen the implementation of climate change adaptation
strategies through coordinated and joint actions across borders, between EU Members States and also
between EU Member States and non-EU countries.
3.5: Foster the exchange of best practices and solutions to address common climate adaptation
challenges between the outermost regions and their neighbours, and between the outermost regions
themselves.

123
4. Prioritising nature-based adaptation,
including coastal protection and green
and blue infrastructure.
4.1: Building inter alia on relevant provisions under the CBD and on the new IUCN Global
Standard for Nature-based Solutions, promote the deployment of robust and effective nature-
based solutions (NBS) for adaptation to climate change, notably by stepping up and scaling up
their implementation and by further developing methods and tools.
4.2: Further link insurance products and services to nature-based adaptation efforts.
4.3: Provide legislative incentives to protect and restore ecosystems with important water cleaning and
regulating functions, such as wetlands and floodplains. Promotion of Natural Water Retention.
Measures, through legislation if appropriate
4.4: Improve compliance with Water Framework Directive requirements for good ecological status on
floods infrastructure.
4.5: Update the Natura 2000 and climate change guidance
5. Stepping-up efforts to build resilience
in cities and empower local action.
5.1: Strengthen the reporting and planning on adaptation in the Common Reporting Framework of the
Covenant of Mayors by refining the Covenant Office work and strengthening awareness and co-
benefits of adaptation at city-level.
5.2: Encourage more involvement of intermediate actors at regional level crucial for urban adaptation.
5.3: Enable the Covenant of Mayors to focus more on identifying and targeting climate change
adaptation in the sectors currently lagging behind in adopting actions, such as the water and health
sectors.
5.4: Launch a climate change adaptation Policy Support Facility / Technical Assistance project
supporting local climate change adaptation action through the Covenant of Mayors.
5.5: Develop a work placement programme for students with experience related to urban planning and
resilience, to work in local authorities through the Erasmus+ programme
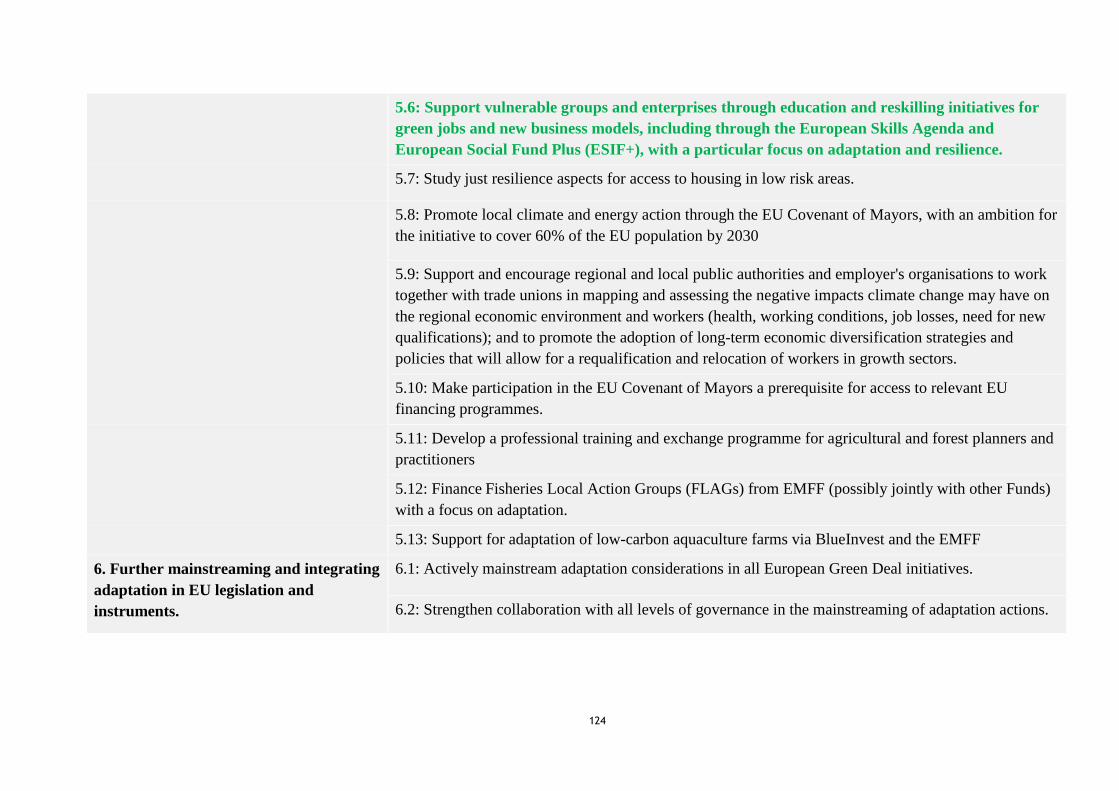
124
5.6: Support vulnerable groups and enterprises through education and reskilling initiatives for
green jobs and new business models, including through the European Skills Agenda and
European Social Fund Plus (ESIF+), with a particular focus on adaptation and resilience.
5.7: Study just resilience aspects for access to housing in low risk areas.
5.8: Promote local climate and energy action through the EU Covenant of Mayors, with an ambition for
the initiative to cover 60% of the EU population by 2030
5.9: Support and encourage regional and local public authorities and employer's organisations to work
together with trade unions in mapping and assessing the negative impacts climate change may have on
the regional economic environment and workers (health, working conditions, job losses, need for new
qualifications); and to promote the adoption of long-term economic diversification strategies and
policies that will allow for a requalification and relocation of workers in growth sectors.
5.10: Make participation in the EU Covenant of Mayors a prerequisite for access to relevant EU
financing programmes.
5.11: Develop a professional training and exchange programme for agricultural and forest planners and
practitioners
5.12: Finance Fisheries Local Action Groups (FLAGs) from EMFF (possibly jointly with other Funds)
with a focus on adaptation.
5.13: Support for adaptation of low-carbon aquaculture farms via BlueInvest and the EMFF
6. Further mainstreaming and integrating
adaptation in EU legislation and
instruments.
6.1: Actively mainstream adaptation considerations in all European Green Deal initiatives.
6.2: Strengthen collaboration with all levels of governance in the mainstreaming of adaptation actions.
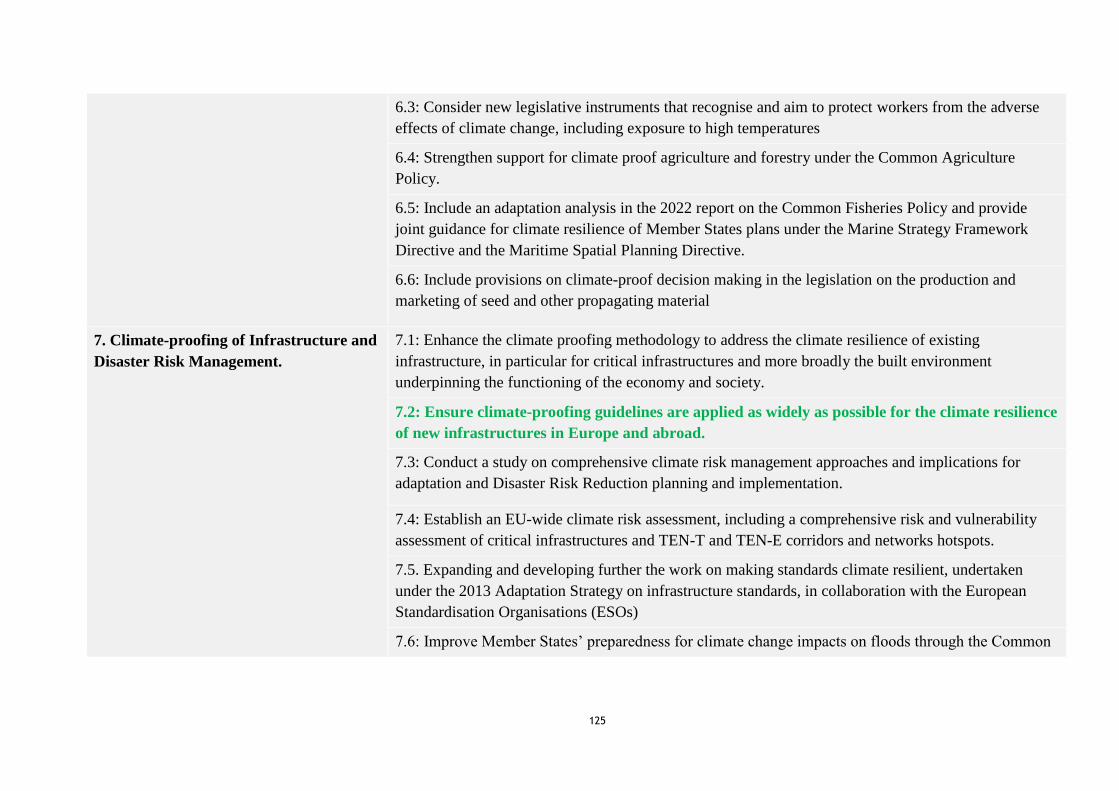
125
6.3: Consider new legislative instruments that recognise and aim to protect workers from the adverse
effects of climate change, including exposure to high temperatures
6.4: Strengthen support for climate proof agriculture and forestry under the Common Agriculture
Policy.
6.5: Include an adaptation analysis in the 2022 report on the Common Fisheries Policy and provide
joint guidance for climate resilience of Member States plans under the Marine Strategy Framework
Directive and the Maritime Spatial Planning Directive.
6.6: Include provisions on climate-proof decision making in the legislation on the production and
marketing of seed and other propagating material
7. Climate-proofing of Infrastructure and
Disaster Risk Management.
7.1: Enhance the climate proofing methodology to address the climate resilience of existing
infrastructure, in particular for critical infrastructures and more broadly the built environment
underpinning the functioning of the economy and society.
7.2: Ensure climate-proofing guidelines are applied as widely as possible for the climate resilience
of new infrastructures in Europe and abroad.
7.3: Conduct a study on comprehensive climate risk management approaches and implications for
adaptation and Disaster Risk Reduction planning and implementation.
7.4: Establish an EU-wide climate risk assessment, including a comprehensive risk and vulnerability
assessment of critical infrastructures and TEN-T and TEN-E corridors and networks hotspots.
7.5. Expanding and developing further the work on making standards climate resilient, undertaken
under the 2013 Adaptation Strategy on infrastructure standards, in collaboration with the European
Standardisation Organisations (ESOs)
7.6: Improve Member States’ preparedness for climate change impacts on floods through the Common
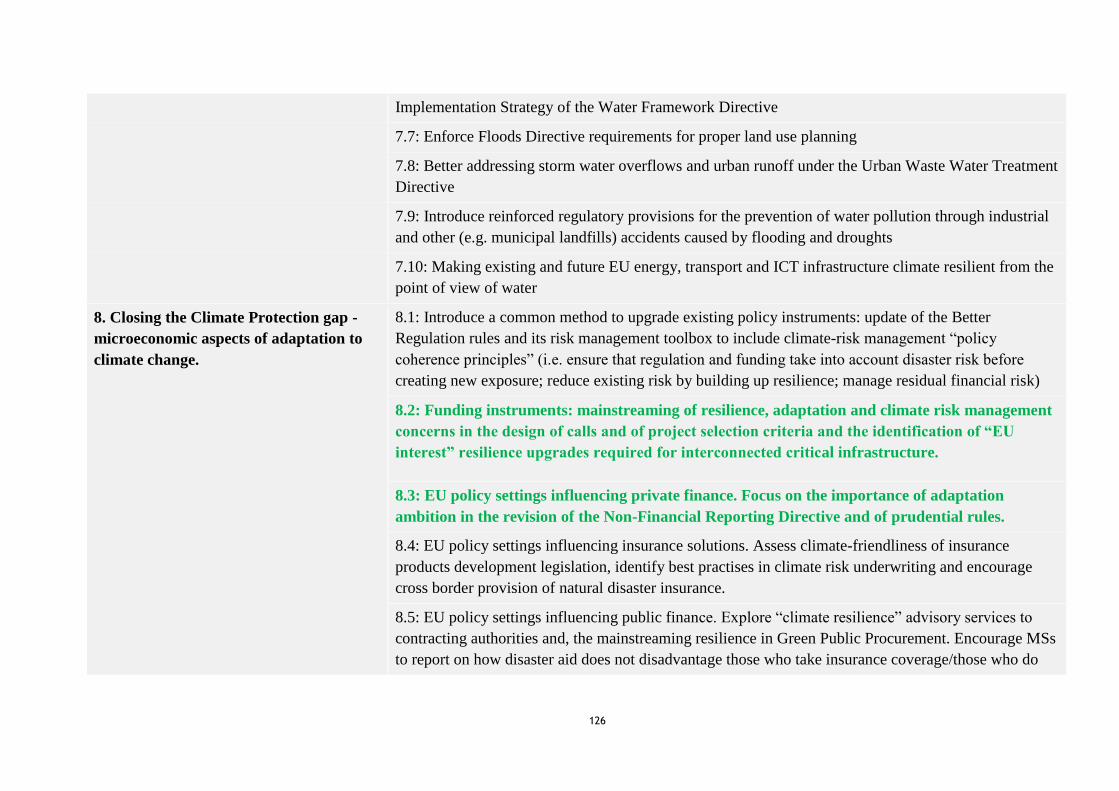
126
Implementation Strategy of the Water Framework Directive
7.7: Enforce Floods Directive requirements for proper land use planning
7.8: Better addressing storm water overflows and urban runoff under the Urban Waste Water Treatment
Directive
7.9: Introduce reinforced regulatory provisions for the prevention of water pollution through industrial
and other (e.g. municipal landfills) accidents caused by flooding and droughts
7.10: Making existing and future EU energy, transport and ICT infrastructure climate resilient from the
point of view of water
8. Closing the Climate Protection gap -
microeconomic aspects of adaptation to
climate change.
8.1: Introduce a common method to upgrade existing policy instruments: update of the Better
Regulation rules and its risk management toolbox to include climate-risk management “policy
coherence principles” (i.e. ensure that regulation and funding take into account disaster risk before
creating new exposure; reduce existing risk by building up resilience; manage residual financial risk)
8.2: Funding instruments: mainstreaming of resilience, adaptation and climate risk management
concerns in the design of calls and of project selection criteria and the identification of “EU
interest” resilience upgrades required for interconnected critical infrastructure.
8.3: EU policy settings influencing private finance. Focus on the importance of adaptation
ambition in the revision of the Non-Financial Reporting Directive and of prudential rules.
8.4: EU policy settings influencing insurance solutions. Assess climate-friendliness of insurance
products development legislation, identify best practises in climate risk underwriting and encourage
cross border provision of natural disaster insurance.
8.5: EU policy settings influencing public finance. Explore “climate resilience” advisory services to
contracting authorities and, the mainstreaming resilience in Green Public Procurement. Encourage MSs
to report on how disaster aid does not disadvantage those who take insurance coverage/those who do
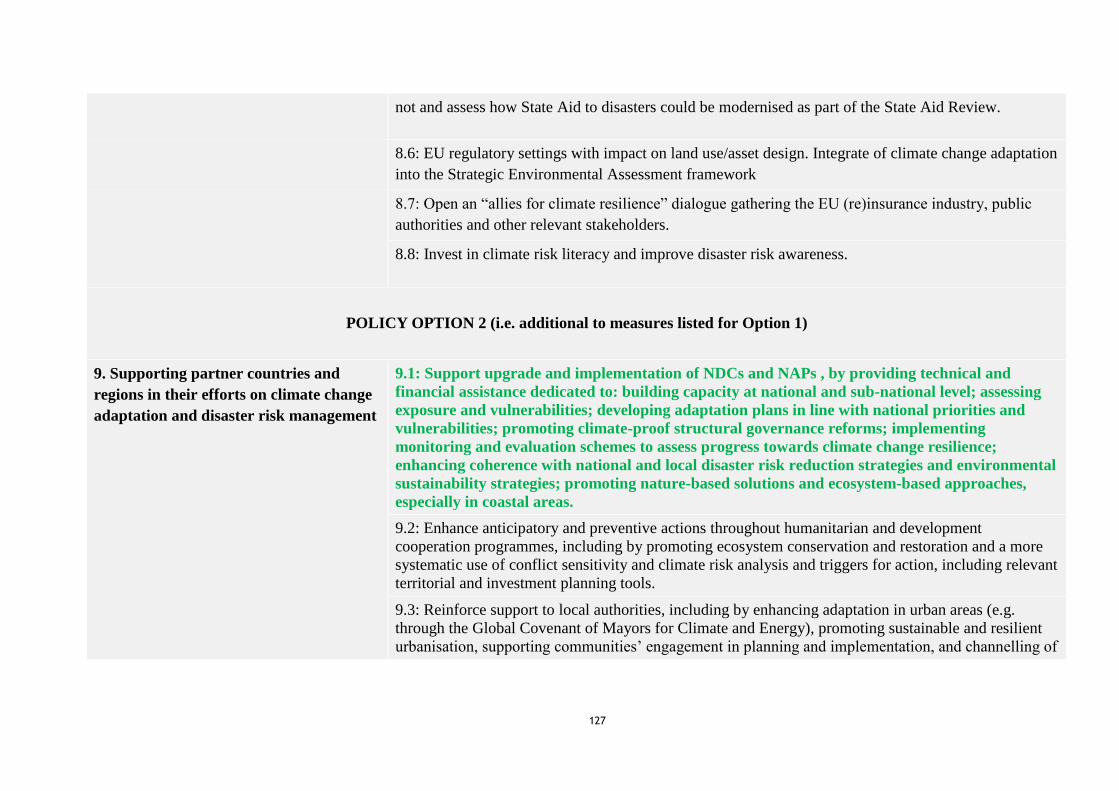
127
not and assess how State Aid to disasters could be modernised as part of the State Aid Review.
8.6: EU regulatory settings with impact on land use/asset design. Integrate of climate change adaptation
into the Strategic Environmental Assessment framework
8.7: Open an “allies for climate resilience” dialogue gathering the EU (re)insurance industry, public
authorities and other relevant stakeholders.
8.8: Invest in climate risk literacy and improve disaster risk awareness.
POLICY OPTION 2 (i.e. additional to measures listed for Option 1)
9. Supporting partner countries and
regions in their efforts on climate change
adaptation and disaster risk management
9.1: Support upgrade and implementation of NDCs and NAPs , by providing technical and
financial assistance dedicated to: building capacity at national and sub-national level; assessing
exposure and vulnerabilities; developing adaptation plans in line with national priorities and
vulnerabilities; promoting climate-proof structural governance reforms; implementing
monitoring and evaluation schemes to assess progress towards climate change resilience;
enhancing coherence with national and local disaster risk reduction strategies and environmental
sustainability strategies; promoting nature-based solutions and ecosystem-based approaches,
especially in coastal areas.
9.2: Enhance anticipatory and preventive actions throughout humanitarian and development
cooperation programmes, including by promoting ecosystem conservation and restoration and a more
systematic use of conflict sensitivity and climate risk analysis and triggers for action, including relevant
territorial and investment planning tools.
9.3: Reinforce support to local authorities, including by enhancing adaptation in urban areas (e.g.
through the Global Covenant of Mayors for Climate and Energy), promoting sustainable and resilient
urbanisation, supporting communities’ engagement in planning and implementation, and channelling of

128
financial resources to the local level.
9.4: Work with leading institutions in Africa, the Caribbean and the Pacific to support regional
climate change adaptation and disaster risk management approaches building on ongoing
initiatives such as the Africa Adaptation Initiative, and develop regional adaptation plans and
action.
9.5: Launch a regional programme for climate change adaptation and exchanges in the Western
Balkans, as well as with EU Southern Neighbourhood countries in line with the Union for the
Mediterranean Ministerial Declaration on Environment and Climate Action, and enhance identification
and implementation of climate resilience and adaptation measures in the Eastern Neighbourhood.
9.6: Support data collection, analysis and policy-relevant use, on the climate change – security –
migration interconnections by: promoting the use of space based applications, enhancing the role of
climate change in the EU Conflict Early Warning System, and integrating climate change adaptation as
an instrument towards conflict prevention and resolution with a focus on fragile countries and regions.
9.7: Support climate change considerations in the works of the relevant Regional Fisheries
Management Organisations and Agreements (RFMO/As) within their respective mandates. Continue to
table proposals to establish marine protected areas (MPAs) in the Weddell Sea and East Antarctica,
respectively, in the Southern Ocean at the Commission of the Conservation of Antarctic Marine Living
Resources.
10. Scaling up international adaptation
finance and climate disaster risk
financing, unlocking innovative finance
and mobilising the private sector
10.1: Strive towards achieving a balance between international climate finance for mitigation and
adaptation, in line with the Paris Agreement, of at least 50% of international climate finance from the
EU budget for external action, on a grant basis, dedicated to climate change adaptation in the 2021-
2027 period.
10.2: Promote the use of innovative financial instruments for climate risks reduction and increase
countries’ financial resilience to climate related disasters, including by promoting disaster risk
financing strategies, risk and forecast based financing for early intervention and joining global
initiatives such as InsuResilience Global Partnership.
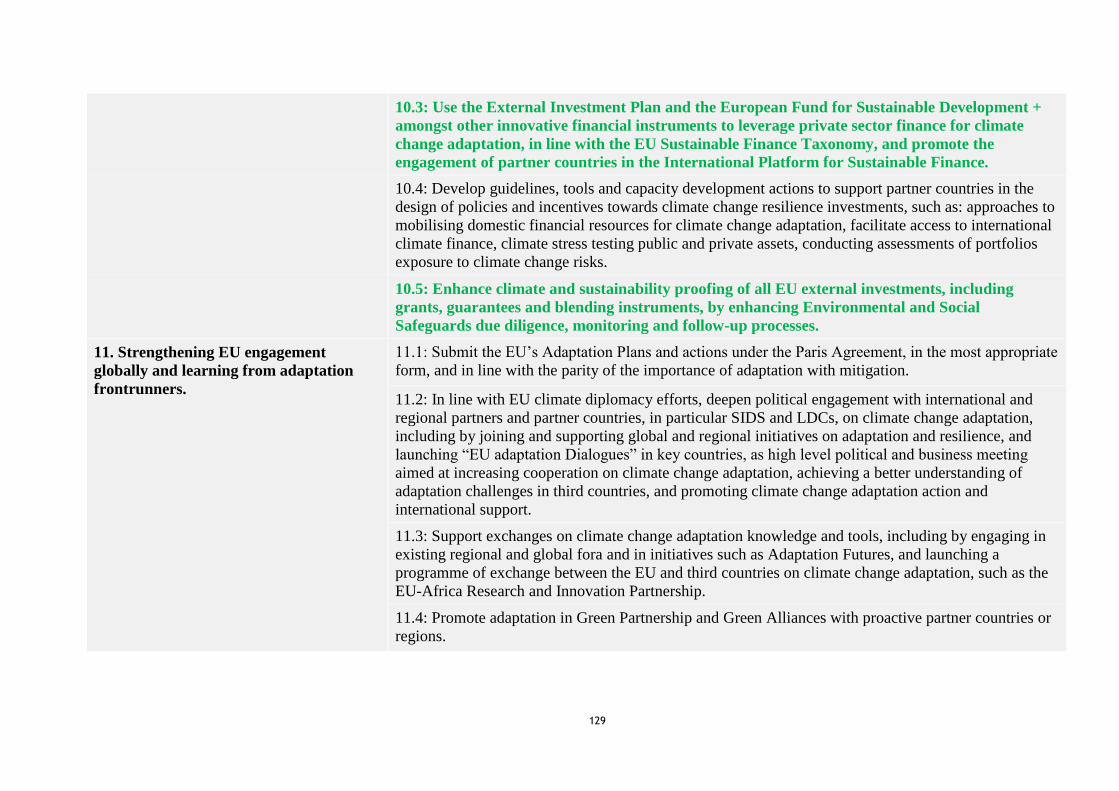
129
10.3: Use the External Investment Plan and the European Fund for Sustainable Development +
amongst other innovative financial instruments to leverage private sector finance for climate
change adaptation, in line with the EU Sustainable Finance Taxonomy, and promote the
engagement of partner countries in the International Platform for Sustainable Finance.
10.4: Develop guidelines, tools and capacity development actions to support partner countries in the
design of policies and incentives towards climate change resilience investments, such as: approaches to
mobilising domestic financial resources for climate change adaptation, facilitate access to international
climate finance, climate stress testing public and private assets, conducting assessments of portfolios
exposure to climate change risks.
10.5: Enhance climate and sustainability proofing of all EU external investments, including
grants, guarantees and blending instruments, by enhancing Environmental and Social
Safeguards due diligence, monitoring and follow-up processes.
11. Strengthening EU engagement
globally and learning from adaptation
frontrunners.
11.1: Submit the EU’s Adaptation Plans and actions under the Paris Agreement, in the most appropriate
form, and in line with the parity of the importance of adaptation with mitigation.
11.2: In line with EU climate diplomacy efforts, deepen political engagement with international and
regional partners and partner countries, in particular SIDS and LDCs, on climate change adaptation,
including by joining and supporting global and regional initiatives on adaptation and resilience, and
launching “EU adaptation Dialogues” in key countries, as high level political and business meeting
aimed at increasing cooperation on climate change adaptation, achieving a better understanding of
adaptation challenges in third countries, and promoting climate change adaptation action and
international support.
11.3: Support exchanges on climate change adaptation knowledge and tools, including by engaging in
existing regional and global fora and in initiatives such as Adaptation Futures, and launching a
programme of exchange between the EU and third countries on climate change adaptation, such as the
EU-Africa Research and Innovation Partnership.
11.4: Promote adaptation in Green Partnership and Green Alliances with proactive partner countries or
regions.

130
11.5: Strengthen the production and delivery of, and access to, user-friendly and timely climate
data and information (climate services), in particular through the promotion of space based
application, the use of Copernicus Climate Change Services and Emergency Management
Services in partner countries, thus building on the existing European investments in climate
research, data, information and services.
11.6: In line with EU climate diplomacy efforts, strengthen the role of trade agreements and aid for
trade programmes in promoting environmental and climate action in partner countries.
11.7: Adhesion to the International Coral Reef Initiative.
11.8: Support the conclusion of an ambitious legally binding agreement on marine biological diversity
of areas beyond national jurisdiction (BBNJ) by the end of 2020, in line with the International Ocean
Governance agenda
11.9: Broaden the All-Atlantic Ocean Research Alliance by including more Small Island Developing
States of the Atlantic (including the Caribbean).
11.10: Support climate change considerations in the works of the relevant Regional Fisheries
Management Organisations and Agreements (RFMO/As) within their respective mandates. Continue to
table proposals to establish marine protected areas (MPAs) in the Weddell Sea and East Antarctica,
respectively, in the Southern Ocean at the Commission of the Conservation of Antarctic Marine Living
Resources.
12. Adaptation Solutions / Horizon
Europe Mission on adaptation to Climate
Change, including Societal
Transformation
12.1: Implement the Horizon Europe Mission on Adaptation to Climate Change, including
Societal Transformation with the objectives of preparing Europe, Accelerating the transition,
and building deep resilience.
12.2: Develop forestry and agriculture decision support tools, indicating e.g. trees and crop
suitability, weather and climate forecasts and disturbance risks.
12.3: Facilitate rapid decision-making and enriching toolbox for practitioners through (1) developing
solutions for policy makers that allow a rapid analysis to support rapid policy response, (2) developing
rapid decision-making tools for cities and citizens, and (3) developing solutions for the business and
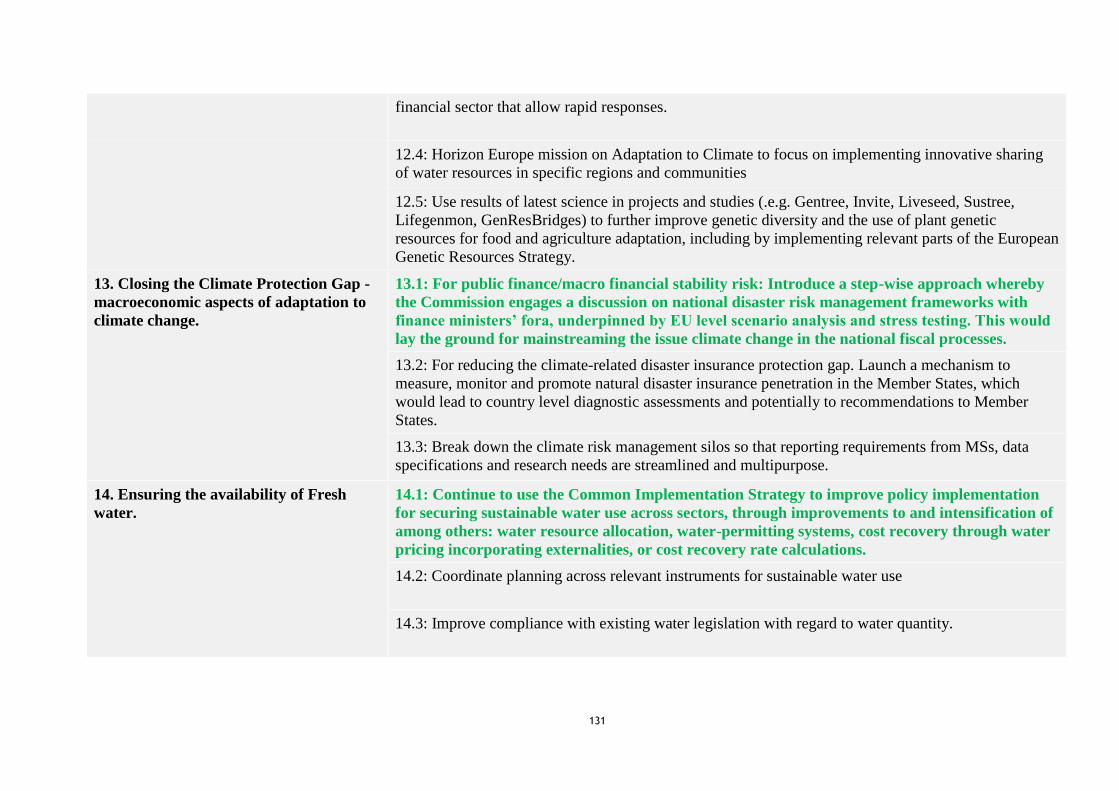
131
financial sector that allow rapid responses.
12.4: Horizon Europe mission on Adaptation to Climate to focus on implementing innovative sharing
of water resources in specific regions and communities
12.5: Use results of latest science in projects and studies (.e.g. Gentree, Invite, Liveseed, Sustree,
Lifegenmon, GenResBridges) to further improve genetic diversity and the use of plant genetic
resources for food and agriculture adaptation, including by implementing relevant parts of the European
Genetic Resources Strategy.
13. Closing the Climate Protection Gap -
macroeconomic aspects of adaptation to
climate change.
13.1: For public finance/macro financial stability risk: Introduce a step-wise approach whereby
the Commission engages a discussion on national disaster risk management frameworks with
finance ministers’ fora, underpinned by EU level scenario analysis and stress testing. This would
lay the ground for mainstreaming the issue climate change in the national fiscal processes.
13.2: For reducing the climate-related disaster insurance protection gap. Launch a mechanism to
measure, monitor and promote natural disaster insurance penetration in the Member States, which
would lead to country level diagnostic assessments and potentially to recommendations to Member
States.
13.3: Break down the climate risk management silos so that reporting requirements from MSs, data
specifications and research needs are streamlined and multipurpose.
14. Ensuring the availability of Fresh
water.
14.1: Continue to use the Common Implementation Strategy to improve policy implementation
for securing sustainable water use across sectors, through improvements to and intensification of
among others: water resource allocation, water-permitting systems, cost recovery through water
pricing incorporating externalities, or cost recovery rate calculations.
14.2: Coordinate planning across relevant instruments for sustainable water use
14.3: Improve compliance with existing water legislation with regard to water quantity.

132
14.4: Promoting the use of drought management plans more widely in the EU through the Common
Implementation Strategy.
14.3 Reduce exposure to contaminated or acutely polluted water due to climate impacts such as
low flows, higher water temperature or flooding, and to ensure availability of adequate quantities
of tap water.
14.6: More ambitious requirements on water saving for products subject to eco-design, energy
labelling, ecolabel and green public procurement.
14.7: Address water saving and reuse in the revised Industrial Emissions Directive and its
implementation.
14.8: Reducing agriculture’s water footprint through promoting water reuse and other measures.
14.9: Addressing water use by the energy sector.
14.10: Introduce measures supporting zero water new sanitation systems in housing
developments/buildings.
14.11: Promote financing mechanisms to smoothen the transition to higher water prices through water-
saving technologies.
14.12: Develop monitoring services by applying new technologies (such as smart sensors) in a
coordinated way.
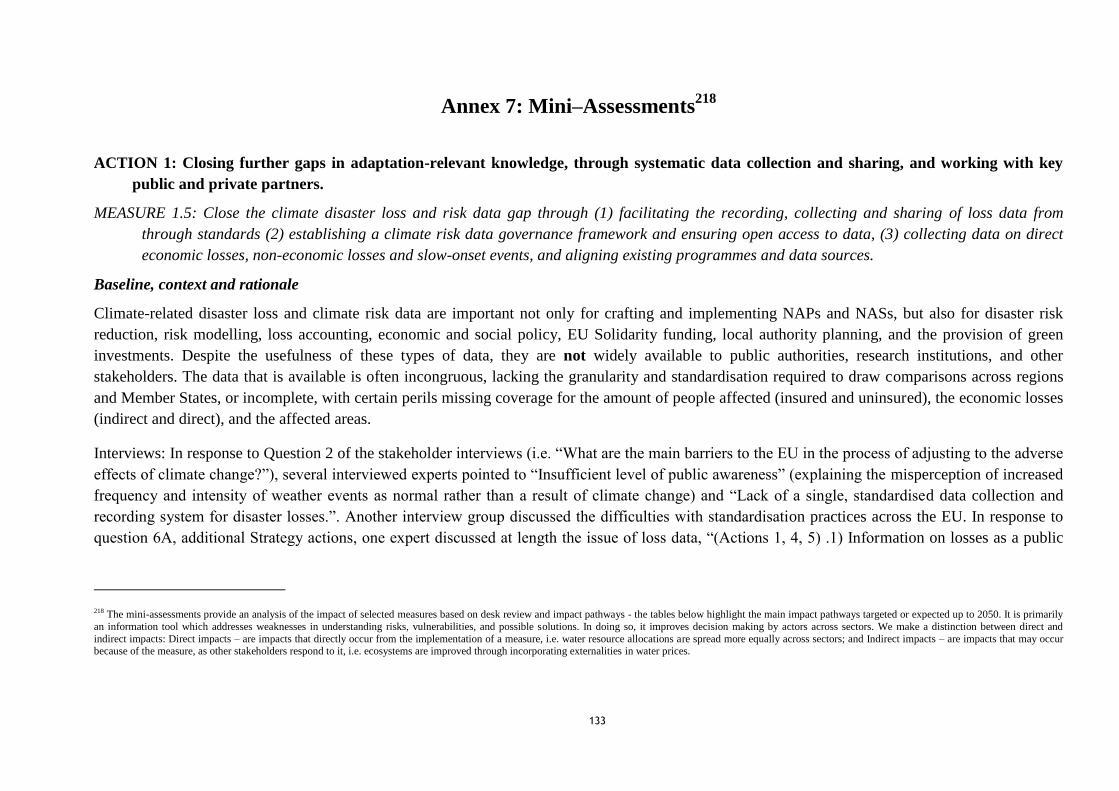
133
Annex 7: Mini–Assessments218
ACTION 1: Closing further gaps in adaptation-relevant knowledge, through systematic data collection and sharing, and working with key
public and private partners.
MEASURE 1.5: Close the climate disaster loss and risk data gap through (1) facilitating the recording, collecting and sharing of loss data from
through standards (2) establishing a climate risk data governance framework and ensuring open access to data, (3) collecting data on direct
economic losses, non-economic losses and slow-onset events, and aligning existing programmes and data sources.
Baseline, context and rationale
Climate-related disaster loss and climate risk data are important not only for crafting and implementing NAPs and NASs, but also for disaster risk
reduction, risk modelling, loss accounting, economic and social policy, EU Solidarity funding, local authority planning, and the provision of green
investments. Despite the usefulness of these types of data, they are not widely available to public authorities, research institutions, and other
stakeholders. The data that is available is often incongruous, lacking the granularity and standardisation required to draw comparisons across regions
and Member States, or incomplete, with certain perils missing coverage for the amount of people affected (insured and uninsured), the economic losses
(indirect and direct), and the affected areas.
Interviews: In response to Question 2 of the stakeholder interviews (i.e. “What are the main barriers to the EU in the process of adjusting to the adverse
effects of climate change?”), several interviewed experts pointed to “Insufficient level of public awareness” (explaining the misperception of increased
frequency and intensity of weather events as normal rather than a result of climate change) and “Lack of a single, standardised data collection and
recording system for disaster losses.”. Another interview group discussed the difficulties with standardisation practices across the EU. In response to
question 6A, additional Strategy actions, one expert discussed at length the issue of loss data, “(Actions 1, 4, 5) .1) Information on losses as a public
218 The mini-assessments provide an analysis of the impact of selected measures based on desk review and impact pathways - the tables below highlight the main impact pathways targeted or expected up to 2050. It is primarily
an information tool which addresses weaknesses in understanding risks, vulnerabilities, and possible solutions. In doing so, it improves decision making by actors across sectors. We make a distinction between direct and
indirect impacts: Direct impacts – are impacts that directly occur from the implementation of a measure, i.e. water resource allocations are spread more equally across sectors; and Indirect impacts – are impacts that may occur because of the measure, as other stakeholders respond to it, i.e. ecosystems are improved through incorporating externalities in water prices.

134
good. 2) EEA and EIOPA should be empowered and resourced to be able to monitor and map risks. 3) Transparent reporting mechanisms for climate
risks and climate-related disaster losses. 4) Developing EU metrics to evaluate the impacts of adaptation efforts.”
OPC: Over half of respondents to the OPC responded that it was very important to support a more open access to climate loss and disaster risk data
from private and public sectors (51%) (75% with very important and fairly important combined).
Description of measure
The new Adaptation Strategy aims to become a catalyst to promote consistent and comparable loss data recording, storage, and sharing among Member
States. Measures taken in this regard recognise that a governance solution is necessary to promote and ensure the (voluntary) provision of this data and
create open repositories for academia, public authorities, and industry partners to utilise loss data more effectively. In addition, it is important that risk
models based on such data are transparent in both their underlying data and methodologies.
Objectives and actions
Close the climate-related disaster loss and risk data gaps through the following activities:
(a) Collection of data on direct economic losses, non-economic losses and slow-onset events aligned with existing programmes and databases
(b) Facilitation of the recording, collection and sharing of loss data according to standard methodologies through the creation of a climate (and disaster)
loss data mandate: in that context the European Commission should develop harmonised loss recording data standards with and for public and private
actors.
(c) Establishment of a climate risk data governance framework, with a consistent taxonomy, and ensured open access to data with the possibility for the
European Commission to mandate the recording, collection and sharing of standardised climate-related disaster loss data streams
d) Improved observation of changes in the environment on which the loss data are based that are partly or wholly caused by climate change including a
new legislative initiative on ocean observation.
Impact pathways
In the table below impacts are assessed using a scale from (--/-/0/+/++) negative to positive. Impacts are assessed up to 2050 relative to the baseline. It
assumes the full uptake of the measure as the increasing severity of physical climate risks is more widely recognized, and consequently the relevance
of sharing data.

135
Table 28: Mini-assessment on Closing further gaps in adaptation-relevant knowledge
Impact
indicator Relevance Indicator Baseline impact pathway Envisaged impact 2050 (relative to baseline)
Economic
impacts
Macroeconomic
environment
Impacts on the economy are a hugely
significant driver for action and reducing
damages can be an important indicator of
increased resilience.
Economic
welfare
(losses) (-
/+)
Economic damages and losses impacts
of hazards associated with a changing
climate are not well known, and risk
models are not able to adequately
forecast damages. Risk reduction
strategies do not see full potential, and
European infrastructure, built
environments, and communities face
significant annual losses.
Direct impact
More accurate, robust, granular and comparable data leads to better-informed
decision making. Areas facing high risk are able to develop more effective
risk reduction and adaptation strategies, reducing their vulnerability to
damages. The insurance and re-insurance industries are able to better predict
insurance premiums and offer products suitable to regions, and collaborate
with local authorities where risk cannot/should not be mitigated by insurance
alone.
Assessment: (+)
Competitiveness
, trade and
investment
flows
Vulnerability of supply chains to impacts
can be relevant and The Strategy will
significantly influence the types of
investments being made.
Impact on
competitiv
eness,
trade and
(climate
resilient)
investment
s (+/-)
Supply chains and industries face
unmitigated risks to perils and hazard
further exasperated by a changing
climate. There will continue to be
direct damages to physical
infrastructure, and indirect losses due
to shutdowns and reduced operations
during the recovery of events.
Indirect impact
Harmonised climate-related disaster loss data will lead to risk that is more
effective reduction measures and bolster adaptation to climate change.
Industries are able to better understand, predict, prevent and prepare for their
risk thanks to more accurate risk models.
Sustainable investment decisions require data, and where disclosure and data
exist, there tends to be insight that leads to record investment. For a
significant contribution to the adaptation objective in the taxonomy on
Sustainable Finance, a risk analysis should be made where this type of
collected loss data is one of the key elements.
Loss data availability would not only allow models to be more precise, but
also provide investors with quantitative information on climate-related losses
related to a particular asset. Due to the role of the taxonomy, the impact can
be higher than the one of innovation and research.
Assessment: (++)
Regulatory
burden on
business
Requirements for open access to data and
introduction of new standard frameworks
can lead to additional costs for firms.
Regulatory
burden on
business
(+/-)
Financial and insurance sector
businesses have some data sharing
requirements, but as established
processes should not lead to additional
costs in the baseline scenario.
Direct impact
Requiring greater provision of data and defining the format and granularity of
this data would impose additional costs on firms that hold and would need to
provide this data. Affected firms will be mostly large firms concentrated in
the financial sector.
Assessment: (-)

136
Increased
innovation and
research
The Strategy will guide research under
Horizon Europe and aims to encourage
greater adoption of innovation.
Impact on
adaptation
innovation
adoption
(+/-)
Climate-related loss data that is not
comparable is not useful multiple
applications, and hampers both closing
the knowledge gap on climate impacts,
and research into predictive risk
models.
Direct Impact
This measure would provide data that is more precise (clear taxonomy and
definitions) comprehensive (total losses including both insured and public
losses, for every disaster type, and every sector), comparable (every event is
unambiguously defined across databases and data can be aggregated or
compared) and transparent (metadata and uncertainty assessment). Such data
would benefit decision-making and research reliant on historical climate-
related disaster loss data, such as determining vulnerability, establishing
baselines, building models to predict future risk, and drawing comparisons
between regions and Member States.
Assessment: (++)
Public authorities
(and budgets)
The Strategy will significantly impact on
public spending on climate resilience,
primarily through indirect routes.
Public
spending
on
adaptation
(€)
Public authorities lack the key metrics
to make informed decisions on
adaptation measures and risk reduction
strategies. The current and future costs
in terms of economic damages and loss
due to climate change are not well
understood or known, and thus it is not
known how much needs to be budgeted
to address these risks.
Direct Impact
The facilitation of harmonised climate-related disaster loss data will ease the
reporting burden for Member States and contribute to collecting data once and
having it serve multiple initiatives. High-quality climate-related disaster loss
data are used as crucial evidence for disaster forensic, which seeks to identify
loss drivers to improve DRR measures. Disaster forensic is particularly useful
to municipalities and other public authorities, who require high levels of detail
to plan risk reduction actions, model risk (both current and ex ante risk and
loss models), and develop contingency plans. Thus with the better provision
of this data, public authorities are able to mobilise effort to reduce risk, budget
for future costs, and more easily apply for Solidarity funding if needed.
Assessment: (+)
Social impacts
Employment
Impacts on the economy and in-turn on
employment are a hugely significant driver
for action and reducing damages and job
losses can be an important indicator of
increased resilience.
Employme
nt (FTE)
Businesses, especially SMEs, suffer
during catastrophic events. Operations
can be halted, assets destroyed, and
business can slow down in the
aftermath of events. The recent
COVID-19 crisis has demonstrated the
adverse effect hazards and perils can
have on employment and the economy
in general.
Indirect Impact
Livelihoods, business operations and thus employment can be adversely
affected by climate impacts. Establishing vulnerability through the provision
of granular, comparable, decision-useful climate-related disaster loss data
leads to measures to reduce these adverse effects, establish those in need of
solidarity funding, and shorten the amount of time needed for recovery after
an event.
Assessment: (+)
Income
distribution,
social protection
and social
inclusion (of
Distributional impacts of climate change can
be significant, the Strategy is intended to
address and mitigate inequalities, including
through better informing citizens and
encouraging action. Needs to address
Distributio
nal and
equity
impacts
(+/-)
Those most vulnerable to the impacts
of national catastrophes and perils are
those on the lower end of the socio-
economic spectrum. The exposure of
this group to climate change risks is not
Indirect impact
More informed decisions could be taken to provide support to vulnerable
groups. More assessable climate-related disaster loss data allows for public
authorities to measure the losses not typically captured (due to low insurance
penetration) for vulnerable groups and regions. Furthermore, this assists with
Solidarity Fund applications, ensuring that losses of vulnerable groups are

137
219 Climate Protection Gap Scoping Report of Working Group 3- Data aspects
particular
groups) broader questions of equity (see other
impacts) such as location, economic and
social cohesion, gender and of fundamental
rights.
fully understood. captured, and the appropriate level of support is provided.
Assessment: (+)
Public health &
safety and health
systems
Increased resilience of public health and
safety systems is an important goal of the
Strategy.
Impact on
public
health and
civil
emergency
systems
(+/-)
Losses will increase for the next
decades without adaptation investments
unleashed at scale219. Public support
systems will be burdened and there will
be loss of life and livelihood that could
have been mitigated.
Direct impact
Better-informed decisions making because of this measure will lead to
increased resilience of public health and safety systems. This is due to being
able to accurately determine the impacts of a given event and share this
information with local authorities so they are better able to tailor their
response and budget for emergencies. Better climate-related disaster loss data
also enables citizens to increase their understanding of the impacts of climate
change on their community, and take steps and make plans to increase the
resilience of their household to relevant perils.
Assessment: (+)
Environmental
impacts
The climate
Critical impact targeted by the strategy.
Increase of resilience to climate impacts and
preventing climate risks. In addition,
potential synergies with mitigation may be
worth considering.
Impact on
climate
resilience
(+/-)
(possible)
Synergy
with
climate
mitigation
(+/-)
Climate impacts will continue to
threaten all parts of society, and
strategies will not be as effective in
reducing these impacts due to large
knowledge gaps around who is/will be
impacted, to what extent, and what can
be done.
Direct Impact
Leverage the power of data for increased resilience of society to climate-
related risks going forward. Importantly, it also allows broadening the
resilience approach beyond climate-related risk information to other risk
information such as those from geological, biosafety or environmental risks.
Assessment: (+)
Quality of
natural
resources/fightin
g pollution
(water, soil, air
etc.)
Strategy intends to address impacts of
climate change on natural resources, e.g.
forests, agriculture, marine environment.
Impact on
natural
resource
resilience
(+/-)
Minimal Impact
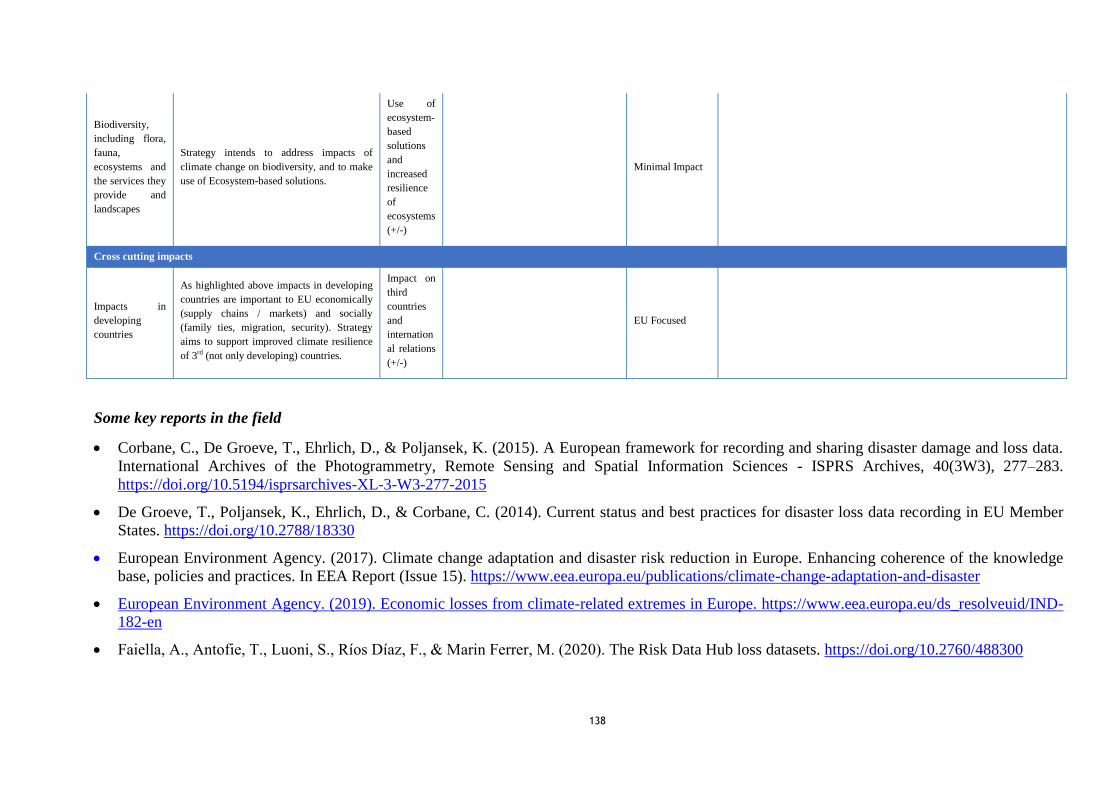
138
Some key reports in the field
Corbane, C., De Groeve, T., Ehrlich, D., & Poljansek, K. (2015). A European framework for recording and sharing disaster damage and loss data.
International Archives of the Photogrammetry, Remote Sensing and Spatial Information Sciences - ISPRS Archives, 40(3W3), 277–283.
https://doi.org/10.5194/isprsarchives-XL-3-W3-277-2015
De Groeve, T., Poljansek, K., Ehrlich, D., & Corbane, C. (2014). Current status and best practices for disaster loss data recording in EU Member
States. https://doi.org/10.2788/18330
European Environment Agency. (2017). Climate change adaptation and disaster risk reduction in Europe. Enhancing coherence of the knowledge
base, policies and practices. In EEA Report (Issue 15). https://www.eea.europa.eu/publications/climate-change-adaptation-and-disaster
European Environment Agency. (2019). Economic losses from climate-related extremes in Europe. https://www.eea.europa.eu/ds_resolveuid/IND-
182-en
Faiella, A., Antofie, T., Luoni, S., Rios Diaz, F., & Marin Ferrer, M. (2020). The Risk Data Hub loss datasets. https://doi.org/10.2760/488300
Biodiversity,
including flora,
fauna,
ecosystems and
the services they
provide and
landscapes
Strategy intends to address impacts of
climate change on biodiversity, and to make
use of Ecosystem-based solutions.
Use of
ecosystem-
based
solutions
and
increased
resilience
of
ecosystems
(+/-)
Minimal Impact
Cross cutting impacts
Impacts in
developing
countries
As highlighted above impacts in developing
countries are important to EU economically
(supply chains / markets) and socially
(family ties, migration, security). Strategy
aims to support improved climate resilience
of 3rd (not only developing) countries.
Impact on
third
countries
and
internation
al relations
(+/-)
EU Focused

139
Joint Research Centre. (2015). Guidance for Recording and Sharing Disaster Damage and Loss Data. JRC Science and Policy Reports, 28.
https://doi.org/10.2788/186107
Integrated Research on Disaster Risk. (2014). Perils Classification and Hazards Glossary (IRDR DATA Publication No. 1).
Marin Ferrer, M., Do Ó, A., Poljanšek, K., & Vallés, A. C. (2018). Disaster damage and loss data for policy: Pre- and post-event damage
assessment and collection of data for evidence-based policies. https://doi.org/10.2760/840421
Marín Ferrer, M., Antofie, T., Eklund, G., & Luoni, S. (2019). THE DISASTER RISK MANAGEMENT KNOWLEDGE CENTRE – RISK
DATA HUB: Vision Paper & Roadmap. https://drmkc.jrc.ec.europa.eu/doc/18150
Ríos Díaz, F., & Marín Ferrer, M. (2017). Loss database architecture for disaster risk management. https://doi.org/10.2760/647488
Schneiderbauer, S., Calliari, E., Eidsvig, U., & Hagenlocher, M. (2017). The most recent view of vulnerability. Science for Disaster Risk
Management 2017: Knowing Better and Loosing Less, 68–82. https://doi.org/10.2788/688605
UNDRR (2015). Global Assessment Report on Disaster Risk Reduction (GAR).
UNDRR (2017). Technical Guidance for Monitoring and Reporting on Progress in Achieving the Global Targets of the Sendai Framework for
Disaster Risk Reduction, https://www.unisdr.org/files/54970_techguidancefdigitalhr.pdf
Whitaker, D., Genillard, C. (2020). H2020 Oasis project and its implications for the future of EU policy to promote climate adaptation and
understanding of risk for all.
140
ACTION 2: Further developing Climate-ADAPT as the ‘first-stop shop’ for adaptation information in Europe.
MEASURE 2.1: Establish an EU Observatory for climate change and health
Baseline, context and rationale
Climate change is already affecting health of human beings, animals and plants, and this will get worse over time, scaling with climate impacts
(heatwaves, forest fires, floods, landslides, food and water safety, pests and diseases, and more). Specific vulnerable groups exist, especially low
income, children, elderly, and those with existing medical conditions. Climate will also affect public (and private) health systems and their ability to
function effectively. Equally, for plant health and the environment where effects of climate change will challenge the resilience of phytosanitary
services and agri-food systems to cope effectively with new emerging pests and diseases.
Public health competence is national, so the main channel for EU action is not direct; it needs to act indirectly through supporting / promoting action by
Member States. The virtual observatory intends to build on and connect existing initiatives in the areas of climate, health and environment under a
single platform to bring knowledge together to help bridge the gaps and deficiencies. Improving knowledge to fill gaps and better connecting the
knowledge that is available, but dispersed across organisations and places, can improve insights and (Member States and others) responses, increasing
resilience.
A global report/tool does already exist – The Lancet Countdown on Health and Climate Change220
- launched in 2015, and publishing annually, with a
report and data explorer dashboard. This tracks 41 indicators relevant for climate change and health across 5 domains: climate change impacts,
exposures, and vulnerability; adaptation planning and resilience for health; mitigation actions and their health co-benefits; economics and finance; and
public and political engagement. In terms of preparedness it identifies (not EU specific) around half of countries have a national health and climate
plan, but comprehensiveness, scope, update status, and implementation remain major challenges, as does financing. It notes climate information
services are not usually informing policy (only 4 of 47 WHO members). According to indicator 2.2 of the Lancet Countdown, 22 European countries
provide some climate information services for health. Spending on health and adaptation is increasing (see Fig 11 of the 2019 report), is around €3-€4
per capita annually in Europe. It is somewhat cumbersome to filter for EU only data and some indicators are not as relevant as for developing countries
– therefore there can be some value in an EU-focused dashboard. Lancet Countdown would be a partner in the development of the Observatory to bring
lessons across and potentially an EU-focused pilot in early 2021.
220 https://www.lancetcountdown.org/
141
Various EU tools exist which provide part of the data needs, and could be target for connection and integration in the Observatory, e.g. C3S European
Health Service, many of these have already been identified as part of a concept paper for the Health Observatory.
Many stakeholders identified health as an important sector and theme for adaptation, and noted the potential synergies/opportunity presented by
COVID19 to increase resilience in this area. The impacts on vulnerable groups, and in particular the possibility to identify and cater for specific
vulnerabilities and distributional effects of climate change impacts, were identified as a specific potential benefit.
OPC: The public responses were positive on the importance of health and climate change, yet less so than the experts. This could point to a possible
lack of awareness. Response to Q10 suggested health was important, e.g. further action agreed by around 80% of respondents, which is a little less than
Water, Agriculture, Energy, Transport, Water and Ecosystems. Q12 importance of impact, improved health, social cohesion and resilience was noted
as very important by around 60% of respondents, ranking 4th
of 11 impacts, behind Healthier ecosystems, enabling climate-informed decisions by
citizens and preventing climate risks.
Description of measure
A virtual observatory with strong contribution from other EU Agencies such as ECDC and EFSA, and hosted by EEA on Climate-ADAPT, aiming to
pool relevant work, knowledge and expertise especially from across the Commission, but also from other technical experts (WHO, EFSA, ECDC, C3S,
UN agencies such as FAO/IPCC, Lancet) in a multi-disciplinary platform based on the ‘One Health’ approach – addressing not only human health, but
also animal and plant health. Aims are (1) to monitor, analyse, assess, anticipate, prevent, address and communicate effects of climate change on
human health; (2) Improve knowledge base for better-informed decision-making; and (3) raise awareness of the health benefits of climate adaptation
policies in the relevant fields. Based on the experiences of the Climate-ADAPT evaluation, the coordination function across sectors and across Europe
as well as across all governance levels is an important benefit of Climate-ADAPT - since the Health observatory would be embedded in Climate-
ADAPT, it would also benefit from the added value of a multi-governance approach. Expected primary users are EU and Member State institutions.
Objectives and actions:
Gathering evidence on climate change and health – by expanding information, developing new methods and tools, gathering good practices –
specific actions include: produce an annual report, preparation of GIS and data mapping
Enhance climate change preparedness in health systems across Member States and policy – by conducting situation analyses, improving early
warning and rapid response capacities with relevant information, analysing the political, socio-economic and financial dimensions, assessing cost-
efficiency of measures, integrating existing monitoring and early warning systems keeping into account the One Health approach when relevant–
142
specific actions include: updating guidance on heat and health, country factsheets on policies, links to warning systems, handbook on vulnerability
and impacts, integration with health reporting and other relevant sources of information.
Build, manage and scale up the observatory portal – by adjusting and further developing the content and functionalities of Climate-ADAPT –
specific actions include: integrating an explorer into the portal, develop the structure and web-pages, combine GIS info and statistics, regular
maintenance and further development of databases, development of case studies and adaptation options (and interlink them), and develop and
decision-making tools.
Connect knowledge providers with target groups – by making target groups aware of the launch of the observatory, creating perception of trust in it
as source, securing return visits to site and contributions / subscriptions – specific actions include: adjusting Climate-ADAPT newsletter, climate
code for citizens, factsheet for general public on heatwaves and health, highlighting observatory, presenting observatory at relevant working
groups.
Cost
The observatory would start with a pilot in early 2021 based on partner contributions; further decision leading to the full-fledged observatory will be
taken in 2021 following a review.
Impact pathways
The table below notes the main impact pathways targeted or expected up to 2050 for the observatory, which is primarily as an information tool which
aims to address weaknesses in understanding and knowledge of vulnerabilities, risks and solutions and in doing so lead to better informed decision
making by actors across the EU health systems. It is assumed that the demand for health information will further increase, as the severance of physical
climate risks increases, and consequently the relevance of sharing data. This is also hoped to (indirectly) spur action by Member States, sectors and
within the EC, in doing so it can help to increase resilience and reduce impacts for vulnerable groups.
In the table below impacts are assessed using a scale from (--/-/0/+/++) negative to positive. Impacts are assessed relative to the baseline.
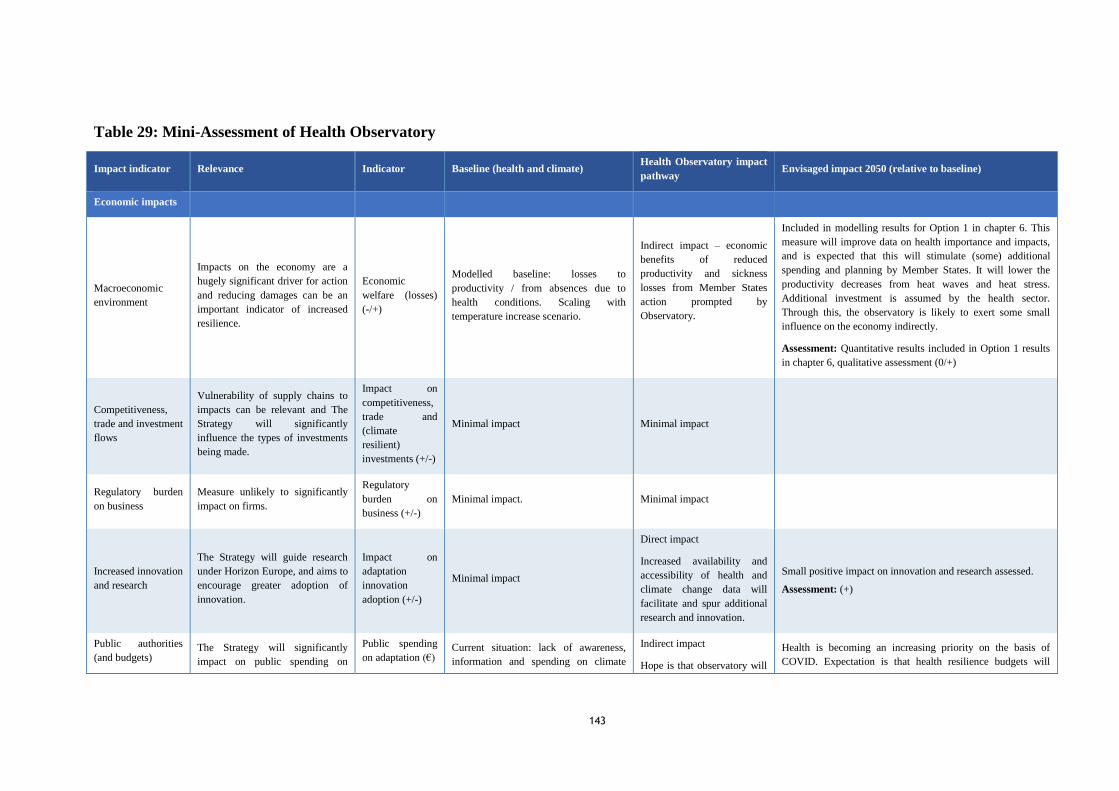
143
Table 29: Mini-Assessment of Health Observatory
Impact indicator Relevance Indicator Baseline (health and climate) Health Observatory impact
pathway Envisaged impact 2050 (relative to baseline)
Economic impacts
Macroeconomic
environment
Impacts on the economy are a
hugely significant driver for action
and reducing damages can be an
important indicator of increased
resilience.
Economic
welfare (losses)
(-/+)
Modelled baseline: losses to
productivity / from absences due to
health conditions. Scaling with
temperature increase scenario.
Indirect impact – economic
benefits of reduced
productivity and sickness
losses from Member States
action prompted by
Observatory.
Included in modelling results for Option 1 in chapter 6. This
measure will improve data on health importance and impacts,
and is expected that this will stimulate (some) additional
spending and planning by Member States. It will lower the
productivity decreases from heat waves and heat stress.
Additional investment is assumed by the health sector.
Through this, the observatory is likely to exert some small
influence on the economy indirectly.
Assessment: Quantitative results included in Option 1 results
in chapter 6, qualitative assessment (0/+)
Competitiveness,
trade and investment
flows
Vulnerability of supply chains to
impacts can be relevant and The
Strategy will significantly
influence the types of investments
being made.
Impact on
competitiveness,
trade and
(climate
resilient)
investments (+/-)
Minimal impact Minimal impact
Regulatory burden
on business
Measure unlikely to significantly
impact on firms.
Regulatory
burden on
business (+/-)
Minimal impact. Minimal impact
Increased innovation
and research
The Strategy will guide research
under Horizon Europe, and aims to
encourage greater adoption of
innovation.
Impact on
adaptation
innovation
adoption (+/-)
Minimal impact
Direct impact
Increased availability and
accessibility of health and
climate change data will
facilitate and spur additional
research and innovation.
Small positive impact on innovation and research assessed.
Assessment: (+)
Public authorities
(and budgets) The Strategy will significantly
impact on public spending on
Public spending
on adaptation (€) Current situation: lack of awareness,
information and spending on climate
Indirect impact
Hope is that observatory will
Health is becoming an increasing priority on the basis of
COVID. Expectation is that health resilience budgets will

144
climate resilience, primarily
through indirect routes. and health – unlikely to scale much with
temperature scenarios.
Knowledge is dispersed, not consistently
reaching decision makers – information
tools not influencing spending.
Indicator 2.4 of Lancet Countdown and
WHO survey can help provide baseline
e.g. €3-€4/per person spent on this issue.
COVID19 will likely result in baseline
scenario of significant increase in
investments in public health systems
preparedness in coming years – will not
necessarily address climate risks.
spur additional spending by
public authorities on health
and climate resilience.
significantly increase in baseline in any case. Question of how
much consideration climate may receive in any case (baseline)
and how much influence the EU Observatory may have.
Evidence from WHO survey shows that health and climate
information tools do not tend to influence policy and spending.
The planned actions under the observatory do include
consideration of these aspects and plans to connect to decision
makers. It could therefore be expected for the measure to exert
a (minor) influence in increasing public spending on climate
change and health, ensuring that it finds a place in the review
and improvement of health systems in the COVID aftermath.
Assessment: not monetised, but positive (+), may increase in
high temperature (3°C / 4.5°C) scenarios (+/++)
Social impacts
Employment
Impacts on the economy and in-
turn on employment are a hugely
significant driver for action and
reducing damages and job losses
can be an important indicator of
increased resilience.
Employment
(FTE) Minimal impact Minimal impact
Income distribution,
social protection and
social inclusion (of
particular groups)
Distributional impacts of climate
change can be significant, the
Strategy is intended to address and
mitigate inequalities, including
through better informing citizens
and encouraging action. Needs to
address broader questions of
equity (see other impacts) such as
location, economic and social
cohesion, gender and of
fundamental rights.
Distributional
and equity
impacts (+/-)
Current situation: health inequalities
across EU, different vulnerabilities.
Likely to change / increase with
temperature scenarios.
COVID is exacerbating inequalities, and
will leave legacy of vulnerable people,
but also tried and tested mechanisms to
shield these.
Indirect impact
Vulnerable groups’ situation
will be highlighted, and will
benefit from any action
spurred by Observatory.
Observatory will draw attention to variety of vulnerabilities by
location, age, income, gender and other aspects. Likely to also
show how these increase with temperature scenario.
Will improve information and add weight to cases within
Member States to target their planning and actions. Some
Member States will already have plans and better national
understanding, some may not use the tools. Expect some
(minor) influence on Member States action.
Will improve information available to citizens, providing a
resource they can use, although they are not a specific target
group of the Observatory.
Assessment: Positive impact (+), likely increasing in high
temperature (3°C / 4.5°C) scenarios (++) as it details
increasing vulnerabilities.
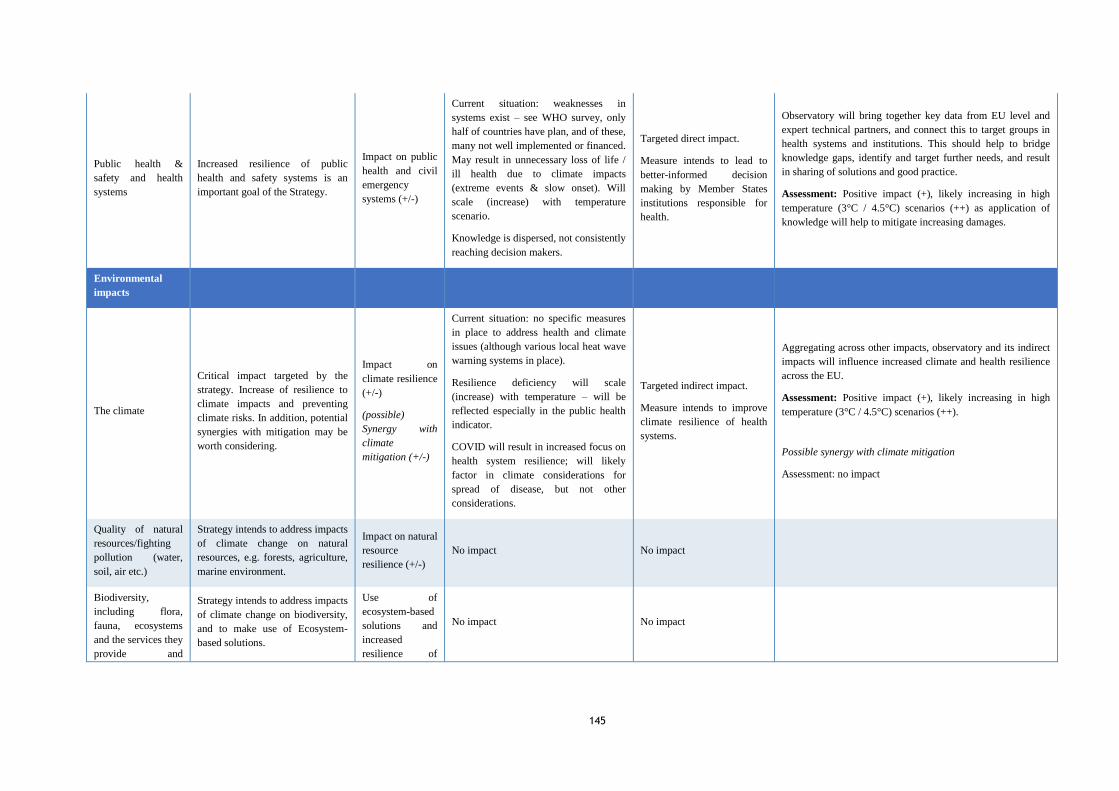
145
Public health &
safety and health
systems
Increased resilience of public
health and safety systems is an
important goal of the Strategy.
Impact on public
health and civil
emergency
systems (+/-)
Current situation: weaknesses in
systems exist – see WHO survey, only
half of countries have plan, and of these,
many not well implemented or financed.
May result in unnecessary loss of life /
ill health due to climate impacts
(extreme events & slow onset). Will
scale (increase) with temperature
scenario.
Knowledge is dispersed, not consistently
reaching decision makers.
Targeted direct impact.
Measure intends to lead to
better-informed decision
making by Member States
institutions responsible for
health.
Observatory will bring together key data from EU level and
expert technical partners, and connect this to target groups in
health systems and institutions. This should help to bridge
knowledge gaps, identify and target further needs, and result
in sharing of solutions and good practice.
Assessment: Positive impact (+), likely increasing in high
temperature (3°C / 4.5°C) scenarios (++) as application of
knowledge will help to mitigate increasing damages.
Environmental
impacts
The climate
Critical impact targeted by the
strategy. Increase of resilience to
climate impacts and preventing
climate risks. In addition, potential
synergies with mitigation may be
worth considering.
Impact on
climate resilience
(+/-)
(possible)
Synergy with
climate
mitigation (+/-)
Current situation: no specific measures
in place to address health and climate
issues (although various local heat wave
warning systems in place).
Resilience deficiency will scale
(increase) with temperature – will be
reflected especially in the public health
indicator.
COVID will result in increased focus on
health system resilience; will likely
factor in climate considerations for
spread of disease, but not other
considerations.
Targeted indirect impact.
Measure intends to improve
climate resilience of health
systems.
Aggregating across other impacts, observatory and its indirect
impacts will influence increased climate and health resilience
across the EU.
Assessment: Positive impact (+), likely increasing in high
temperature (3°C / 4.5°C) scenarios (++).
Possible synergy with climate mitigation
Assessment: no impact
Quality of natural
resources/fighting
pollution (water,
soil, air etc.)
Strategy intends to address impacts
of climate change on natural
resources, e.g. forests, agriculture,
marine environment.
Impact on natural
resource
resilience (+/-) No impact No impact
Biodiversity,
including flora,
fauna, ecosystems
and the services they
provide and
Strategy intends to address impacts
of climate change on biodiversity,
and to make use of Ecosystem-
based solutions.
Use of
ecosystem-based
solutions and
increased
resilience of
No impact No impact
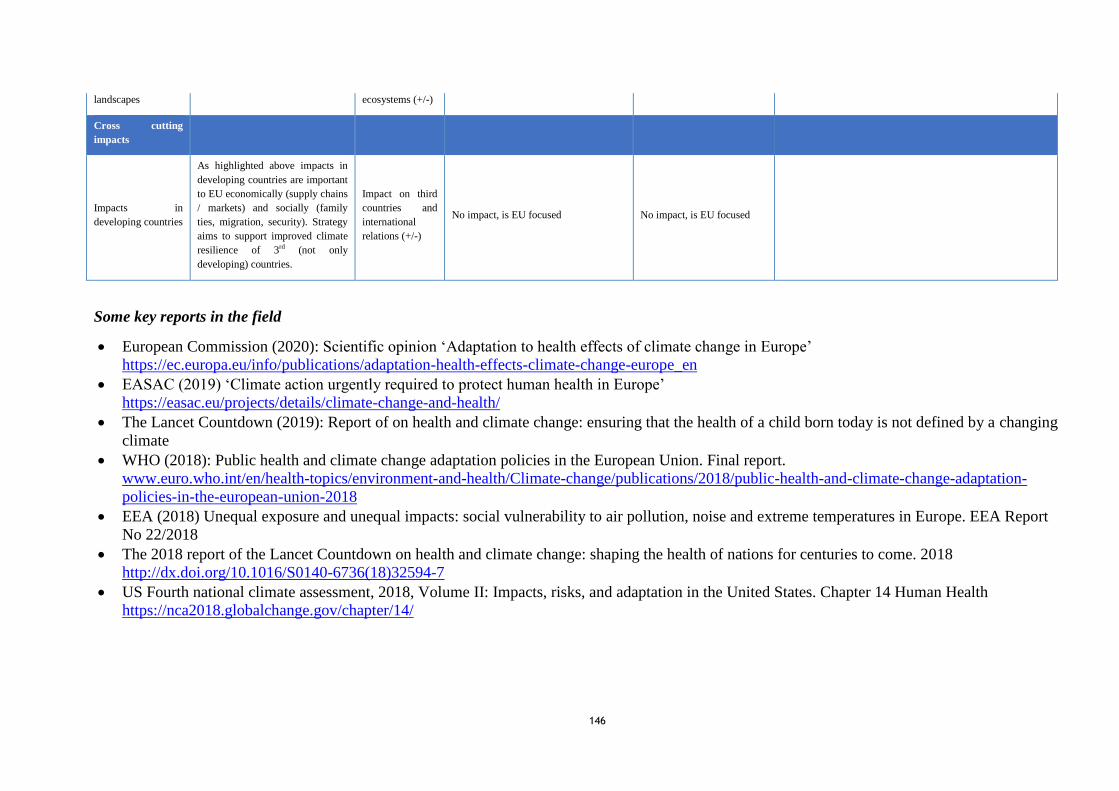
146
landscapes ecosystems (+/-)
Cross cutting
impacts
Impacts in
developing countries
As highlighted above impacts in
developing countries are important
to EU economically (supply chains
/ markets) and socially (family
ties, migration, security). Strategy
aims to support improved climate
resilience of 3rd (not only
developing) countries.
Impact on third
countries and
international
relations (+/-)
No impact, is EU focused No impact, is EU focused
Some key reports in the field
European Commission (2020): Scientific opinion ‘Adaptation to health effects of climate change in Europe’
https://ec.europa.eu/info/publications/adaptation-health-effects-climate-change-europe_en
EASAC (2019) ‘Climate action urgently required to protect human health in Europe’
https://easac.eu/projects/details/climate-change-and-health/
The Lancet Countdown (2019): Report of on health and climate change: ensuring that the health of a child born today is not defined by a changing
climate
WHO (2018): Public health and climate change adaptation policies in the European Union. Final report.
www.euro.who.int/en/health-topics/environment-and-health/Climate-change/publications/2018/public-health-and-climate-change-adaptation-
policies-in-the-european-union-2018
EEA (2018) Unequal exposure and unequal impacts: social vulnerability to air pollution, noise and extreme temperatures in Europe. EEA Report
No 22/2018
The 2018 report of the Lancet Countdown on health and climate change: shaping the health of nations for centuries to come. 2018
http://dx.doi.org/10.1016/S0140-6736(18)32594-7
US Fourth national climate assessment, 2018, Volume II: Impacts, risks, and adaptation in the United States. Chapter 14 Human Health
https://nca2018.globalchange.gov/chapter/14/

147
ACTION 3: Strengthening the evaluation, monitoring, reporting and implementation of adaptation strategies at national and subnational
levels, including in cities, cross-border, and in the Outermost Regions (including through the Climate Law via Climate-ADAPT).
NO MEASURE impact assessed for Action 3
ACTION 4: Prioritising nature-based adaptation, including coastal protection and green and blue infrastructure.
MEASURE 4.1: Building inter alia on relevant provisions under the CBD and on the new IUCN Global Standard for Nature-based Solutions,
promote the deployment of robust and effective nature-based solutions (NBS) for adaptation to climate change, notably by stepping up and
scaling up their implementation and by further developing methods and tools.
Baseline, context, and rationale
Climate change and biodiversity loss are linked and interdependent. We can only achieve climate, biodiversity and sustainable development goals if we
scale up and speed up the implementation of technological, societal and nature-based solutions. There is growing global consensus on the importance
of addressing these challenges (and the wider set of Sustainable Development Goals) in an integrated manner and, consequently, on the urgency of
identifying and implementing win-win solutions.
Nature-based solutions (NbS), actions that conserve, manage or restore nature to support biodiversity to help address societal challenges, empower
people and provide job and business opportunities can be powerful tools for combatting biodiversity loss and supporting climate change mitigation
and/or adaptation and disaster risk reduction while delivering further benefits to human well-being (e.g. health). NbS are based on the principle that
ecosystems in healthy condition deliver multiple benefits and services for human well-being and can thereby address economic, social and
environmental goals simultaneously. Depending on their context, NbS are also framed as Ecosystem-based Adaptation (EbA), Green Infrastructure
(GI), Ecosystem-based Disaster Risk Reduction (EcoDRR), or Natural Water Retention Measures (NWRM).
148
Despite the fact that ecosystem-based solutions have proved to be cost-efficient policy approaches to address climate change adaptation, they are yet
not used fully.221
Reasons for this relatively low uptake are multiple (e.g. cultural perceptions, knowledge gaps, low guidance), and have driven to,
among others, unevenness of climate adaptation action across Member States.
In 2017, though the interest for the ecosystem-based adaptation concept is increasing in different areas, it has mainly been applied in the agriculture
and forestry sectors; and therefore, experts continuously have advocated for supporting legislation that enables its systematic mainstreaming into urban
planning, i.e., incorporating its principles into relevant policies and planning tools across sectors. .222
Since then, both development and implementation
of NbS have significantly increased. Nonetheless, there is still a large gap between the research efforts concerning small- (i.e. at urban or local scale
such as filter drains, porous pavements, green roofs, etc.) and large-scale NbS (i.e. solutions which are applied in rural and coastal areas, river basins
and/or at the regional scale such as large retention basins, lakes, flood plains, wetlands, beach nourishment, etc.).223
During the targeted stakeholder consultation activities undertaken in the framework of this study it was indicated that, besides funding support, the EU
should promote the development of standard methodologies to quantify the costs and benefits of ecosystem-based approaches, in order to help with the
implementation of solutions. Projects supported under consecutive EU research framework programmes have investigated in these issues and results
are made available in a series of reports. 224
Stakeholders also suggested the Strategy could support a dedicated mechanism to provide tailored
adaptation guidance and peer-to-peer knowledge sharing for local public authorities and non-state actors. The upcoming EEA report on nature-based
solutions – ecosystem-based approaches to climate change adaptation and disaster risk reduction partly fulfils this request.225
Moreover, many
stakeholders referred to the importance of ecosystem-based adaptation to increase the resilience of the infrastructural sector, for example in the context
of coastal protection. The COVID 19 crisis has further amplified the importance of resilience and the importance of having access to nature for general
well-being.
221 European Commission (2019). Review of Progress on the Implementation of the EU Green Infrastructure Strategy. SWD (2019) 184 final.
Retrieved from: https://eur-lex.europa.eu/legal-content/EN/TXT/PDF/?uri=CELEX:52019DC0236&qid=1562053537296 222 Pauleit, S. et. al (2017). Nature-based solutions and climate change–four shades of green. In Nature-Based Solutions to Climate Change Adaptation in Urban Areas (pp. 29-49). Springer, Cham. 223 European Commission (2020) Nature-based solutions for flood mitigation and coastal resilience 224 See sectorial reports: https://ec.europa.eu/info/news/new-publication-what-nature-based-solutions-can-do-us-2020-jul-16_en 225 EEA (forthcoming) Nature-based solutions and ecosystem-based approaches to climate change adaptation and DRR in Europe

149
OPC: Respondents to the OPC reported that one of the main actions to support resilience building is information/guidance about management practices
and nature-based solutions. During the interviews, stakeholders also highlighted the importance of NbS and recommended to give NbS interventions
similar priority as for the Strategy’s eight existing actions.
Description of measure
This measure of the new strategy seeks greater prioritising/promoting of nature-based solutions- ecosystem-based adaptation in relevant areas (see
References below). This will be achieved through scaling up and stepping up the implementation of nature-based solutions and ecosystem-based
approaches.
Objectives and actions:
This measure seeks to enhance NbS, including coastal protection, through their wider adoption and upscaling of blue and green infrastructure. Building
inter alia on relevant provisions under the CBD and on the new IUCN Global Standard for Nature-based Solutions226
, promote the deployment of
robust and effective nature-based solutions (NbS) for adaptation to climate change by developing methods and tools to
a) assess the vulnerability and expected resilience of planned NbS to projected climate change;
b) determine their cost-efficiency and effectiveness with regards to their expected adaptation functions;
c) quantify their wider economic, social and environmental co-benefits.
Guide the introduction of decision criteria when assessing adaptation strategies that allow to include multiple benefits in order to promote nature-based
solutions-ecosystem-based approaches, in accordance with the EU Biodiversity and EU Forest Strategy.
Use public tendering to stimulate the deployment of ecosystem-based solutions by, for instance, sponsoring the building of green infrastructure in
public buildings (EU Procurement Guides)
226 Relevant provision include: Assessing the impacts of climate change on biodiversity (UNEP/CBD/COP/DEC/X/33); Voluntary guidelines for the design and effective implementation of ecosystem-based approaches to
climate change adaptation and disaster risk reduction (CBD COP 14/5) (CBD/SBSTTA/22/INF/1); Guidance on enhancing positive and minimizing negative impacts on biodiversity of climate change adaptation activities (UNEP/CBD/SBSTTA/20/INF/1); Synthesis report on experiences with ecosystem-based approaches to climate change adaptation and disaster risk reduction (CBD Technical Series N° 85)
150
Amplify and consolidate capacity building and experience exchange among rural, coastal and urban practitioners, to incentivise the shift from the
traditional bias towards built infrastructure to nature-based solutions-ecosystem-based approaches, including practitioners from other regions (e.g.
Global South) where NbS have been successfully implemented.
Advance in the study of the climate resilience of the NBS, ensuring that the new NBS/infrastructures are climate-resilient, which would also incentive
investments from the private sector.
Further linking insurance products and services to nature-based solutions -ecosystem-based approaches adaptation, which may offer several financial
opportunities for the risk industry (e.g. by reducing insured losses, creating new insurance opportunities).
The results of this work will be used to inform and guide all relevant EU funding and investment programmes, to support the implementation of the
network of protected areas and of the EU Nature Restoration Plan under the Biodiversity Strategy for 2030 (including the legally binding restoration
targets; the new EU Forest Strategy, the EU Soil Thematic Strategy, the EU Urban Greening Platform), and to contribute to the European Climate Pact.
Cost
The EU Biodiversity Strategy227
indicates that actions to tackling biodiversity loss and restoring ecosystems (including NbS) will require significant
public and private investments at the national and European levels. Therefore, the Commission estimates that to meet investment priorities for Natura
2000 and green infrastructure, at least €20 billion a year should be unlocked for spending on nature. Specifically, 25% of the EU budget dedicated to
climate action will be invested in biodiversity and nature-based solutions.
Impact pathways
In the table below impacts are assessed using a scale from (--/-/0/+/++) negative to positive. Impacts are assessed up to 2050 relative to the baseline. It
assumes the full uptake of the measure as the increasing severance of physical climate risks is more widely recognized the benefits from nature-based
adaptation become apparent and proven, and consequently the acceleration in the adoption of solutions.
227 European Commission (2020) EU Biodiversity Strategy for 2030, from the Commission to the European Parliament, the Council, the European Economic and Social Committee and the Committee of the Regions, COM/2020/380 final, available at - https://eur-lex.europa.eu/legal-content/EN/TXT/?qid=1590574123338&uri=CELEX:52020DC0380
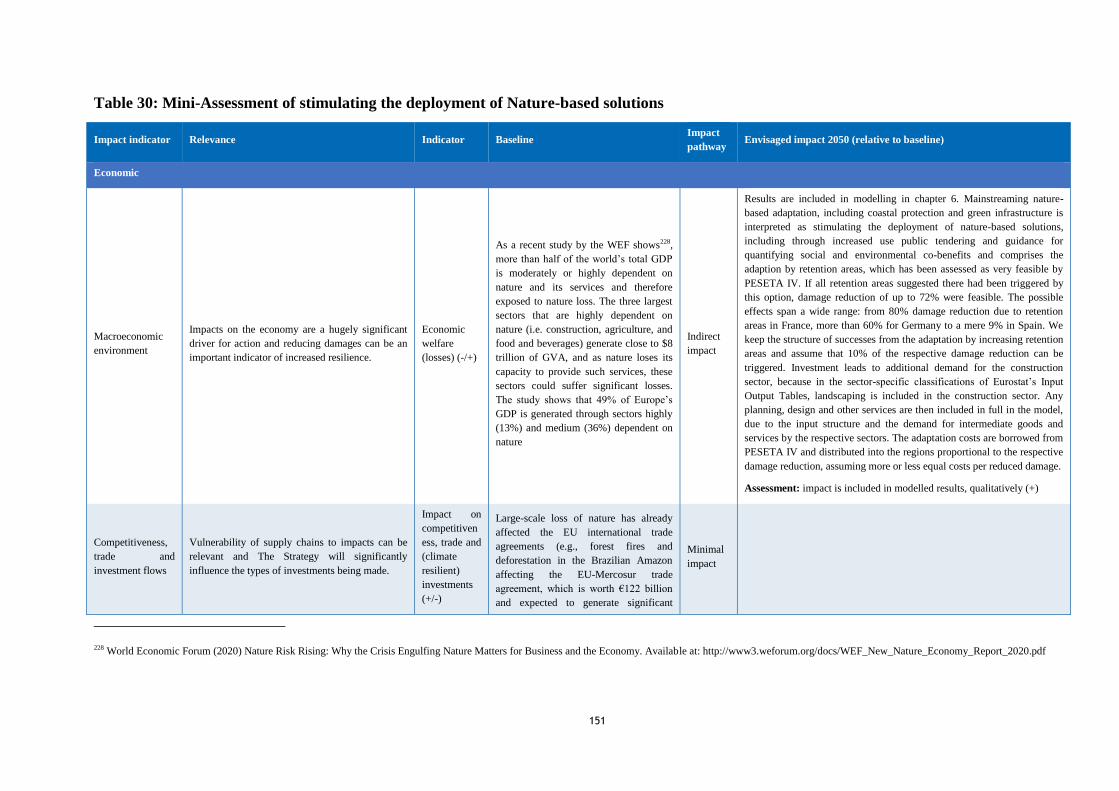
151
Table 30: Mini-Assessment of stimulating the deployment of Nature-based solutions
Impact indicator Relevance Indicator Baseline Impact
pathway Envisaged impact 2050 (relative to baseline)
Economic
Macroeconomic
environment
Impacts on the economy are a hugely significant
driver for action and reducing damages can be an
important indicator of increased resilience.
Economic
welfare
(losses) (-/+)
As a recent study by the WEF shows228,
more than half of the world’s total GDP
is moderately or highly dependent on
nature and its services and therefore
exposed to nature loss. The three largest
sectors that are highly dependent on
nature (i.e. construction, agriculture, and
food and beverages) generate close to $8
trillion of GVA, and as nature loses its
capacity to provide such services, these
sectors could suffer significant losses.
The study shows that 49% of Europe’s
GDP is generated through sectors highly
(13%) and medium (36%) dependent on
nature
Indirect
impact
Results are included in modelling in chapter 6. Mainstreaming nature-
based adaptation, including coastal protection and green infrastructure is
interpreted as stimulating the deployment of nature-based solutions,
including through increased use public tendering and guidance for
quantifying social and environmental co-benefits and comprises the
adaption by retention areas, which has been assessed as very feasible by
PESETA IV. If all retention areas suggested there had been triggered by
this option, damage reduction of up to 72% were feasible. The possible
effects span a wide range: from 80% damage reduction due to retention
areas in France, more than 60% for Germany to a mere 9% in Spain. We
keep the structure of successes from the adaptation by increasing retention
areas and assume that 10% of the respective damage reduction can be
triggered. Investment leads to additional demand for the construction
sector, because in the sector-specific classifications of Eurostat’s Input
Output Tables, landscaping is included in the construction sector. Any
planning, design and other services are then included in full in the model,
due to the input structure and the demand for intermediate goods and
services by the respective sectors. The adaptation costs are borrowed from
PESETA IV and distributed into the regions proportional to the respective
damage reduction, assuming more or less equal costs per reduced damage.
Assessment: impact is included in modelled results, qualitatively (+)
Competitiveness,
trade and
investment flows
Vulnerability of supply chains to impacts can be
relevant and The Strategy will significantly
influence the types of investments being made.
Impact on
competitiven
ess, trade and
(climate
resilient)
investments
(+/-)
Large-scale loss of nature has already
affected the EU international trade
agreements (e.g., forest fires and
deforestation in the Brazilian Amazon
affecting the EU-Mercosur trade
agreement, which is worth €122 billion
and expected to generate significant
Minimal
impact
228 World Economic Forum (2020) Nature Risk Rising: Why the Crisis Engulfing Nature Matters for Business and the Economy. Available at: http://www3.weforum.org/docs/WEF_New_Nature_Economy_Report_2020.pdf

152
market opportunities).
Regulatory burden
on business
Rewarding use of NbS in public tendering will
incentivise firms to include it in their offers, may
require additional efforts. Nevertheless, these
would be voluntary.
Under the EU Taxonomy, investments are required
Regulatory
burden on
business (+/-)
Minimal (mandatory) impact Minimal
impact
Increased
innovation and
research
The Strategy will guide research under Horizon
Europe and aims to encourage greater adoption of
innovation.
Impact on
adaptation
innovation
adoption (+/-
)
According to the latest review of the
state of the art of EU-funded projects, the
relevant NBS strands of the Horizon
2020 programme include 35 projects
with a total budget of €288m, delivered
within dedicated focus areas e.g. 'Smart
and Sustainable Cities with NbS. Further
investments in NbS research and
innovation have been delivered through
other EU instruments (e.g. COST,
ERDF, LIFE+ and EIB’s Natural Capital
Financing Facility). Furthermore, H2020
calls for proposals on NbS have been
oversubscribed with nearly 300
proposals received for 11 call areas
relating to NBS.229
In parallel, as part of the EU Biodiversity
Strategy the Commission will promote
and facilitate partnerships, including a
dedicated Biodiversity Partnership, to
facilitate the bridge between science,
policy and practice in regards to nature-
based solutions. 230
Direct
impact
The Horizon Europe Missions on Adaptation to Climate Change will aim
to boost nature-based solutions and green-blue multipurpose infrastructure
investments in ecosystems. 231 By promoting the deployment of NbS, this
measure of the new Strategy is expected to incentivise the research in NbS
and encourage the adoption of NbS-related innovative measures in cities.
Assessment: Positive impact (+)
229 European Commission (forthcoming) Nature-based solutions- State of the art in the EU-Funded projects. 230 European Commission (2020) EU Biodiversity Strategy for 2030, from the Commission to the European Parliament, the Council, the European Economic and Social Committee and the Committee of the Regions,
COM/2020/380 final, available at - https://eur-lex.europa.eu/legal-content/EN/TXT/?qid=1590574123338&uri=CELEX:52020DC0380 231 European Commission (2020) “Accelerating the Transition to a Climate Prepared and Resilient Europe Interim report of the Mission Board for Adaptation to Climate Change, including Societal Transformation” Available at: https://op.europa.eu/en/publication-detail/-/publication/1d5234b9-b68a-11ea-bb7a-01aa75ed71a1
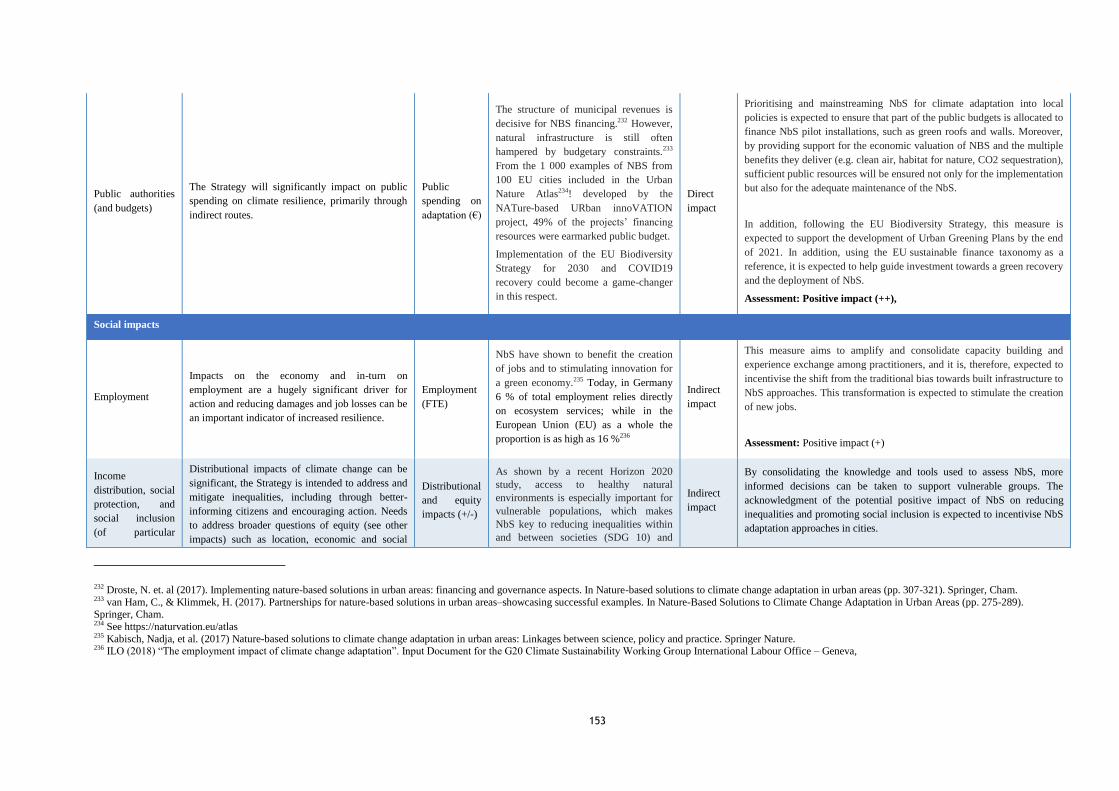
153
Public authorities
(and budgets)
The Strategy will significantly impact on public
spending on climate resilience, primarily through
indirect routes.
Public
spending on
adaptation (€)
The structure of municipal revenues is
decisive for NBS financing.232 However,
natural infrastructure is still often
hampered by budgetary constraints.233
From the 1 000 examples of NBS from
100 EU cities included in the Urban
Nature Atlas234! developed by the
NATure-based URban innoVATION
project, 49% of the projects’ financing
resources were earmarked public budget.
Implementation of the EU Biodiversity
Strategy for 2030 and COVID19
recovery could become a game-changer
in this respect.
Direct
impact
Prioritising and mainstreaming NbS for climate adaptation into local
policies is expected to ensure that part of the public budgets is allocated to
finance NbS pilot installations, such as green roofs and walls. Moreover,
by providing support for the economic valuation of NBS and the multiple
benefits they deliver (e.g. clean air, habitat for nature, CO2 sequestration),
sufficient public resources will be ensured not only for the implementation
but also for the adequate maintenance of the NbS.
In addition, following the EU Biodiversity Strategy, this measure is
expected to support the development of Urban Greening Plans by the end
of 2021. In addition, using the EU sustainable finance taxonomy as a
reference, it is expected to help guide investment towards a green recovery
and the deployment of NbS.
Assessment: Positive impact (++),
Social impacts
Employment
Impacts on the economy and in-turn on
employment are a hugely significant driver for
action and reducing damages and job losses can be
an important indicator of increased resilience.
Employment
(FTE)
NbS have shown to benefit the creation
of jobs and to stimulating innovation for
a green economy.235 Today, in Germany
6 % of total employment relies directly
on ecosystem services; while in the
European Union (EU) as a whole the
proportion is as high as 16 %236
Indirect
impact
This measure aims to amplify and consolidate capacity building and
experience exchange among practitioners, and it is, therefore, expected to
incentivise the shift from the traditional bias towards built infrastructure to
NbS approaches. This transformation is expected to stimulate the creation
of new jobs.
Assessment: Positive impact (+)
Income
distribution, social
protection, and
social inclusion
(of particular
Distributional impacts of climate change can be
significant, the Strategy is intended to address and
mitigate inequalities, including through better-
informing citizens and encouraging action. Needs
to address broader questions of equity (see other
impacts) such as location, economic and social
Distributional
and equity
impacts (+/-)
As shown by a recent Horizon 2020
study, access to healthy natural
environments is especially important for
vulnerable populations, which makes
NbS key to reducing inequalities within
and between societies (SDG 10) and
Indirect
impact
By consolidating the knowledge and tools used to assess NbS, more
informed decisions can be taken to support vulnerable groups. The
acknowledgment of the potential positive impact of NbS on reducing
inequalities and promoting social inclusion is expected to incentivise NbS
adaptation approaches in cities.
232 Droste, N. et. al (2017). Implementing nature-based solutions in urban areas: financing and governance aspects. In Nature-based solutions to climate change adaptation in urban areas (pp. 307-321). Springer, Cham. 233 van Ham, C., & Klimmek, H. (2017). Partnerships for nature-based solutions in urban areas–showcasing successful examples. In Nature-Based Solutions to Climate Change Adaptation in Urban Areas (pp. 275-289). Springer, Cham. 234 See https://naturvation.eu/atlas 235 Kabisch, Nadja, et al. (2017) Nature-based solutions to climate change adaptation in urban areas: Linkages between science, policy and practice. Springer Nature. 236 ILO (2018) “The employment impact of climate change adaptation”. Input Document for the G20 Climate Sustainability Working Group International Labour Office – Geneva,

154
groups) cohesion, gender, and of fundamental rights. improving health and well-being
(SDG3).237
Regarding social inclusion, NbS have
proven to be an effective means to build
processes and practices for sustainable
communities, with many NbS projects
giving attention to how to involve groups
such as refugees, young people and
women.238
Assessment: Positive impact (+)
Public health &
safety and health
systems
Increased resilience of public health and safety
systems is an important goal of the Strategy.
Impact on
public health
and civil
emergency
systems (+/-)
The effect of NbS in reducing the urban
heat effect (UHI) is only one example of
how NBS can benefit public health,
which has been studied in different
European countries. For instance, the
EU-RAMSES project found that in
northern cities increasing green areas
from the current 25% to 60% would
allow an average cooling of around
0.6°.239
In addition, it has been shown that crime
prevention can be significantly improved
by green infrastructure development.240
Indirect
impact
By providing evidence of the multiple benefits that NbS deliver regarding
public health and safety systems (e.g. heat stress, air pollution, and crime
prevention) is expected that city governments and communities be
encouraged to support NbS interventions.
Assessment: Positive impact (+)
Environmental impacts
The climate
Critical impact targeted by the strategy. Increase of
resilience to climate impacts and preventing
climate risks. In addition, potential synergies with
mitigation may be worth considering.
Impact on
climate
resilience
(+/-)
(possible)
Synergy with
climate
mitigation
There is growing scientific evidence that
NbS offer multiple benefits for climate
change adaptation and disaster risk
reduction in particular for sectors that
depend on ecosystems and natural
resources (e.g. water), such as forestry
and agriculture; in urban areas, NbS are
effective in providing benefits for
adaptation and disaster risk reduction
Targeted
direct
impact.
The measure will increase the deployment of NbS and is expected to
motivate cities and communities to sign up to more ambitions 2030
targets, and to support the implementation of other NbS-related strategies
at the EU level, such as the EU Biodiversity Strategy. The climate impact
of the measure is expected to influence both climate adaptation and
mitigation in Europe.
Assessment: Positive impact (++)
237 Faivre, Nicolas, et al. "Nature-Based Solutions in the EU: Innovating with nature to address social, economic and environmental challenges." Environmental research 159 (2017): 509-518. 238 European Commission (2020) Nature-based solutions towards sustainable communities 239 European Commission (2020) Nature-based solutions for microclimate regulation and air quality 240 Shepley, Mardelle, et al. "The impact of green space on violent crime in urban environments: An evidence synthesis." International journal of environmental research and public health 16.24 (2019): 5119.

155
(+/-) (e.g. reducing damage from heavy
precipitation and
flooding, alleviating impacts of droughts
and heat-related challenges)241
Moreover, NBS can contribute to climate
mitigation through both storing and
sequestering carbon and reducing energy
demand (e.g. by improving thermal
comfort cities and promoting the use of
walking and cycling routes).242
Quality of natural
resources/fighting
pollution (water,
soil, air, etc.)
Strategy intends to address impacts of climate
change on natural resources, e.g. forests,
agriculture, marine environment.
Impact on
natural
resource
resilience
(+/-)
NbS interventions such as green roofs
can achieve cost-effective reductions in
drainage systems, whilst improving
urban environmental quality, decreasing
nutrient and chemical pollution level243
Moreover, a number of studies, such as
the BRIDGE project, have evidenced the
NBS’s contribution to removing air
pollutants such as O3, PM2.5, NOX, and
SO2.244
Targeted
direct
impact.
The quality of natural resources (including soil, water, and air) will be
positively impacted by the increased adoption of NbS, which will be
mainly achieved through prioritising and mainstreaming NbS for climate
adaptation at local level.
Assessment: Positive impact (+)
Biodiversity,
including flora,
fauna, ecosystems
and the services
they provide, and
landscapes
Strategy intends to address impacts of climate
change on biodiversity, and to make use of
Ecosystem-based solutions.
Use of
ecosystem-
based
solutions and
increased
resilience of
ecosystems
Several EU-funded projects have
identified types of NbS that have offer
particularly high benefits for
biodiversity. Examples of relevant NBS
include renaturing landfill sites,
brownfields and river corridors,
restoration of catchments and coastal
Targeted
direct
impact.
The measure is expected to increase the attractiveness and thus
deployment of NbS. Based on the identified benefits of NbS, the EU
biodiversity will be positively impacted as more NbS interventions are
supported.
Assessment: Positive impact (+)
241EEA (forthcoming) Nature-based solutions and ecosystem-based approaches to climate change adaptation and DRR in Europe 242 European Commission (forthcoming) Nature-based solutions- State of the art in the EU-Funded projects. 243 European Commission (2020) Nature-based solutions improving water quality and waterbody conditions 244 European Commission (2020) Nature-based solutions for microclimate regulation and air quality

156
(+/-) landscapes, arboreal interventions, and
pollinator sites.245
Impacts in
developing
countries
As highlighted above impacts in developing
countries are important to the EU economically
(supply chains / markets) and socially (family ties,
migration, security). Strategy aims to support
improved climate resilience of 3rd (not only
developing) countries.
Impact on
third
countries and
international
relations (+/-)
NbS are becoming increasingly
important in international agreements
and policy frameworks,246 including the
UN Framework Convention on Climate
Change and the Convention on
Biological Diversity. To support the
impact of NBS implementation in third
countries, the EU has established
different programs such as the
Strengthening international cooperation
on sustainable urbanisation: nature-
based solutions for restoration and
rehabilitation of urban ecosystems.247
Specific NBS sector dialogues have also
been conducted with successful results,
such as the EU – Brazil Sector Dialogue
on nature-based solutions.248
Indirect
impact
Particular measures taken to promote global mainstreaming of NBS
include Sector Dialogues, which intend to capitalise upon existing
experiences and good practices in Europe and beyond. In accordance, this
measure is expected to have an indirect impact in developing countries, as
knowledge and experience exchange is incentivised.
Impact indicator Relevance Indicator Baseline Impact
pathway Envisaged impact 2050 (relative to baseline)
Economic
Macroeconomic
environment
Impacts on the economy are a hugely significant
driver for action and reducing damages can be an
important indicator of increased resilience.
Economic
welfare
(losses) (-/+)
As a recent study by the WEF shows249,
more than half of the world’s total GDP
is moderately or highly dependent on
nature and its services and therefore
exposed to nature loss. The three largest
sectors that are highly dependent on
nature (i.e. construction, agriculture, and
Indirect
impact
Results are included in modelling in chapter 6. Mainstreaming nature-
based adaptation, including coastal protection and green infrastructure is
interpreted as stimulating the deployment of nature-based solutions,
including through increased use public tendering and guidance for
quantifying social and environmental co-benefits and comprises the
adaption by retention areas, which has been assessed as very feasible by
PESETA IV. If all retention areas suggested there had been triggered by
245 European Commission (2020) Biodiversity and Nature-based Solutions 246 European Commission (forthcoming) Nature-based solutions- State of the art in the EU-Funded projects. 247 See: https://ec.europa.eu/info/funding-tenders/opportunities/portal/screen/opportunities/topic-details/sc5-13-2018-2019 248 European Commission (2019) The EU – Brazil Sector Dialogue on nature-based solutions. Available at: https://oppla.eu/sites/default/files/docs/EU-Brazil-NBS-dialogue-1610.pdf 249 World Economic Forum (2020) Nature Risk Rising: Why the Crisis Engulfing Nature Matters for Business and the Economy. Available at: http://www3.weforum.org/docs/WEF_New_Nature_Economy_Report_2020.pdf
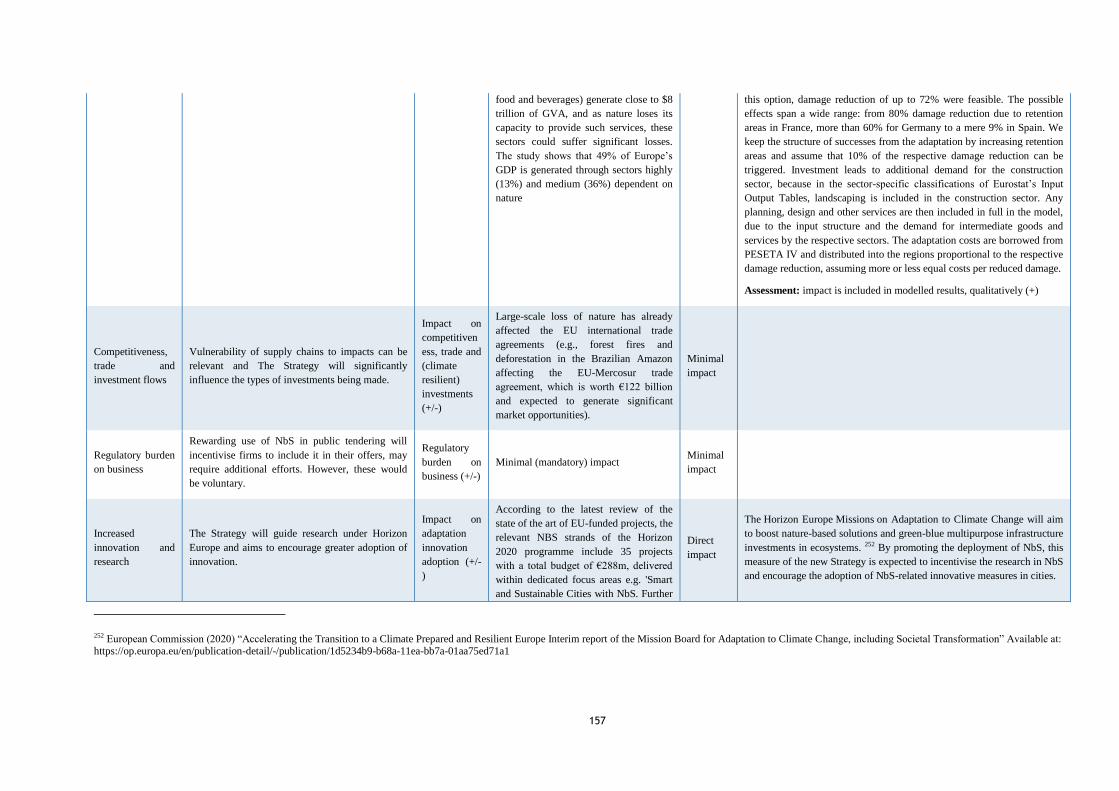
157
food and beverages) generate close to $8
trillion of GVA, and as nature loses its
capacity to provide such services, these
sectors could suffer significant losses.
The study shows that 49% of Europe’s
GDP is generated through sectors highly
(13%) and medium (36%) dependent on
nature
this option, damage reduction of up to 72% were feasible. The possible
effects span a wide range: from 80% damage reduction due to retention
areas in France, more than 60% for Germany to a mere 9% in Spain. We
keep the structure of successes from the adaptation by increasing retention
areas and assume that 10% of the respective damage reduction can be
triggered. Investment leads to additional demand for the construction
sector, because in the sector-specific classifications of Eurostat’s Input
Output Tables, landscaping is included in the construction sector. Any
planning, design and other services are then included in full in the model,
due to the input structure and the demand for intermediate goods and
services by the respective sectors. The adaptation costs are borrowed from
PESETA IV and distributed into the regions proportional to the respective
damage reduction, assuming more or less equal costs per reduced damage.
Assessment: impact is included in modelled results, qualitatively (+)
Competitiveness,
trade and
investment flows
Vulnerability of supply chains to impacts can be
relevant and The Strategy will significantly
influence the types of investments being made.
Impact on
competitiven
ess, trade and
(climate
resilient)
investments
(+/-)
Large-scale loss of nature has already
affected the EU international trade
agreements (e.g., forest fires and
deforestation in the Brazilian Amazon
affecting the EU-Mercosur trade
agreement, which is worth €122 billion
and expected to generate significant
market opportunities).
Minimal
impact
Regulatory burden
on business
Rewarding use of NbS in public tendering will
incentivise firms to include it in their offers, may
require additional efforts. However, these would
be voluntary.
Regulatory
burden on
business (+/-)
Minimal (mandatory) impact Minimal
impact
Increased
innovation and
research
The Strategy will guide research under Horizon
Europe and aims to encourage greater adoption of
innovation.
Impact on
adaptation
innovation
adoption (+/-
)
According to the latest review of the
state of the art of EU-funded projects, the
relevant NBS strands of the Horizon
2020 programme include 35 projects
with a total budget of €288m, delivered
within dedicated focus areas e.g. 'Smart
and Sustainable Cities with NbS. Further
Direct
impact
The Horizon Europe Missions on Adaptation to Climate Change will aim
to boost nature-based solutions and green-blue multipurpose infrastructure
investments in ecosystems. 252 By promoting the deployment of NbS, this
measure of the new Strategy is expected to incentivise the research in NbS
and encourage the adoption of NbS-related innovative measures in cities.
252 European Commission (2020) “Accelerating the Transition to a Climate Prepared and Resilient Europe Interim report of the Mission Board for Adaptation to Climate Change, including Societal Transformation” Available at: https://op.europa.eu/en/publication-detail/-/publication/1d5234b9-b68a-11ea-bb7a-01aa75ed71a1

158
investments in NbS research and
innovation have been delivered through
other EU instruments (e.g. COST,
ERDF, LIFE+ and EIB’s Natural Capital
Financing Facility). Furthermore, H2020
calls for proposals on NbS have been
oversubscribed with nearly 300
proposals received for 11 call areas
relating to NBS.250
In parallel, as part of the EU Biodiversity
Strategy the Commission will promote
and facilitate partnerships, including a
dedicated Biodiversity Partnership, to
facilitate the bridge between science,
policy and practice in regards to nature-
based solutions. 251
Assessment: Positive impact (+)
250 European Commission (forthcoming) Nature-based solutions- State of the art in the EU-Funded projects. 251 European Commission (2020) EU Biodiversity Strategy for 2030, from the Commission to the European Parliament, the Council, the European Economic and Social Committee and the Committee of the Regions, COM/2020/380 final, available at - https://eur-lex.europa.eu/legal-content/EN/TXT/?qid=1590574123338&uri=CELEX:52020DC0380
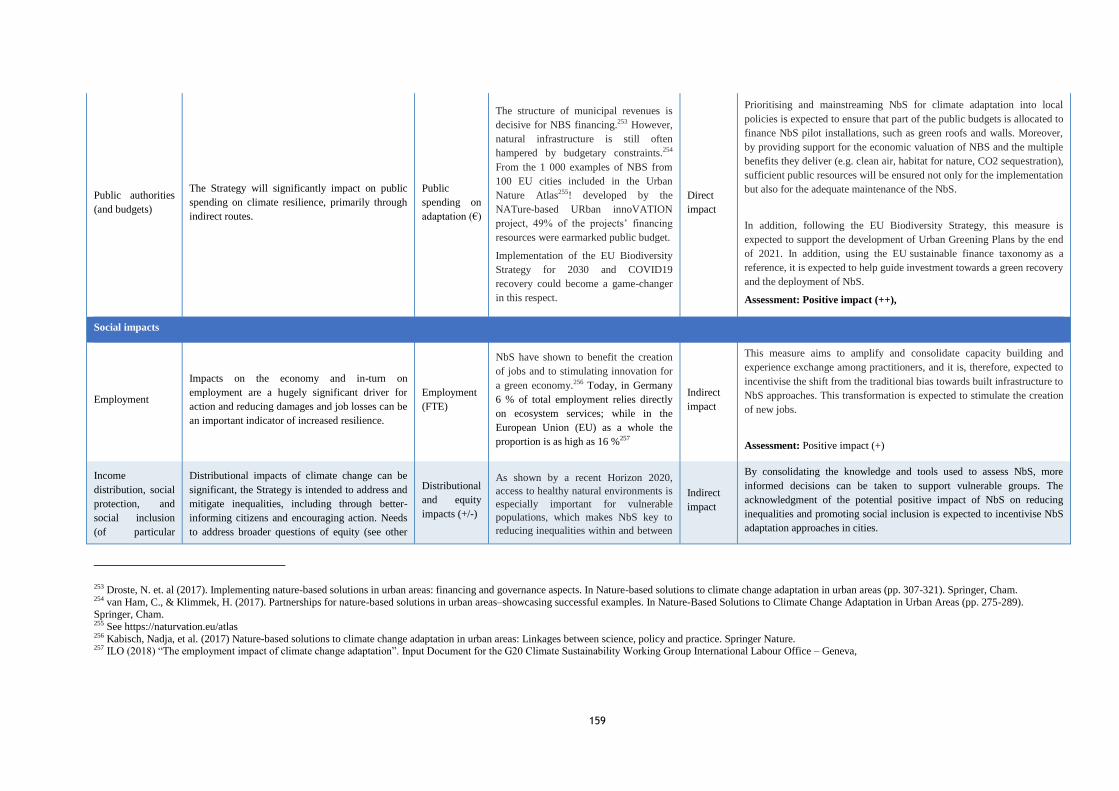
159
Public authorities
(and budgets)
The Strategy will significantly impact on public
spending on climate resilience, primarily through
indirect routes.
Public
spending on
adaptation (€)
The structure of municipal revenues is
decisive for NBS financing.253 However,
natural infrastructure is still often
hampered by budgetary constraints.254
From the 1 000 examples of NBS from
100 EU cities included in the Urban
Nature Atlas255! developed by the
NATure-based URban innoVATION
project, 49% of the projects’ financing
resources were earmarked public budget.
Implementation of the EU Biodiversity
Strategy for 2030 and COVID19
recovery could become a game-changer
in this respect.
Direct
impact
Prioritising and mainstreaming NbS for climate adaptation into local
policies is expected to ensure that part of the public budgets is allocated to
finance NbS pilot installations, such as green roofs and walls. Moreover,
by providing support for the economic valuation of NBS and the multiple
benefits they deliver (e.g. clean air, habitat for nature, CO2 sequestration),
sufficient public resources will be ensured not only for the implementation
but also for the adequate maintenance of the NbS.
In addition, following the EU Biodiversity Strategy, this measure is
expected to support the development of Urban Greening Plans by the end
of 2021. In addition, using the EU sustainable finance taxonomy as a
reference, it is expected to help guide investment towards a green recovery
and the deployment of NbS.
Assessment: Positive impact (++),
Social impacts
Employment
Impacts on the economy and in-turn on
employment are a hugely significant driver for
action and reducing damages and job losses can be
an important indicator of increased resilience.
Employment
(FTE)
NbS have shown to benefit the creation
of jobs and to stimulating innovation for
a green economy.256 Today, in Germany
6 % of total employment relies directly
on ecosystem services; while in the
European Union (EU) as a whole the
proportion is as high as 16 %257
Indirect
impact
This measure aims to amplify and consolidate capacity building and
experience exchange among practitioners, and it is, therefore, expected to
incentivise the shift from the traditional bias towards built infrastructure to
NbS approaches. This transformation is expected to stimulate the creation
of new jobs.
Assessment: Positive impact (+)
Income
distribution, social
protection, and
social inclusion
(of particular
Distributional impacts of climate change can be
significant, the Strategy is intended to address and
mitigate inequalities, including through better-
informing citizens and encouraging action. Needs
to address broader questions of equity (see other
Distributional
and equity
impacts (+/-)
As shown by a recent Horizon 2020,
access to healthy natural environments is
especially important for vulnerable
populations, which makes NbS key to
reducing inequalities within and between
Indirect
impact
By consolidating the knowledge and tools used to assess NbS, more
informed decisions can be taken to support vulnerable groups. The
acknowledgment of the potential positive impact of NbS on reducing
inequalities and promoting social inclusion is expected to incentivise NbS
adaptation approaches in cities.
253 Droste, N. et. al (2017). Implementing nature-based solutions in urban areas: financing and governance aspects. In Nature-based solutions to climate change adaptation in urban areas (pp. 307-321). Springer, Cham. 254 van Ham, C., & Klimmek, H. (2017). Partnerships for nature-based solutions in urban areas–showcasing successful examples. In Nature-Based Solutions to Climate Change Adaptation in Urban Areas (pp. 275-289). Springer, Cham. 255 See https://naturvation.eu/atlas 256 Kabisch, Nadja, et al. (2017) Nature-based solutions to climate change adaptation in urban areas: Linkages between science, policy and practice. Springer Nature. 257 ILO (2018) “The employment impact of climate change adaptation”. Input Document for the G20 Climate Sustainability Working Group International Labour Office – Geneva,

160
groups) impacts) such as location, economic and social
cohesion, gender, and of fundamental rights. societies (SDG 10) and improving health
and well-being (SDG3).258
Regarding social inclusion, NbS have
proven to be an effective means to build
processes and practices for sustainable
communities, with many NbS projects
giving attention to how to involve groups
such as refugees, young people and
women.259
Assessment: Positive impact (+)
Public health &
safety and health
systems
Increased resilience of public health and safety
systems is an important goal of the Strategy.
Impact on
public health
and civil
emergency
systems (+/-)
The effect of NbS in reducing the urban
heat effect (UHI) is only one example of
how NBS can benefit public health,
which has been studied in different
European countries. For instance, the
EU-RAMSES project found that in
northern cities increasing green areas
from the current 25% to 60% would
allow an average cooling of around
0.6°.260
In addition, it has been shown that crime
prevention can be significantly improved
by green infrastructure development.261
Indirect
impact
By providing evidence of the multiple benefits that NbS deliver regarding
public health and safety systems (e.g. heat stress, air pollution, and crime
prevention) is expected that city governments and communities are
encouraged to support NbS interventions.
Assessment: Positive impact (+)
Environmental impacts
The climate
Critical impact targeted by the strategy. Increase of
resilience to climate impacts and preventing
climate risks. In addition, potential synergies with
mitigation may be worth considering.
Impact on
climate
resilience
(+/-)
(possible)
Synergy with
climate
mitigation
There is growing scientific evidence that
NbS offer multiple benefits for climate
change adaptation and disaster risk
reduction in particular for sectors that
depend on ecosystems and natural
resources (e.g. water), such as forestry
and agriculture; in urban areas, NbS are
effective in providing benefits for
adaptation and disaster risk reduction
Targeted
direct
impact.
The measure will increase the deployment of NbS and is expected to
motivate cities and communities to sign up to more ambitions 2030
targets, and to support the implementation of other NbS-related strategies
at the EU level, such as the EU Biodiversity Strategy. The climate impact
of the measure is expected to influence both climate adaptation and
mitigation in Europe.
Assessment: Positive impact (++)
258 Faivre, Nicolas, et al. "Nature-Based Solutions in the EU: Innovating with nature to address social, economic and environmental challenges." Environmental research 159 (2017): 509-518. 259 European Commission (2020) Nature-based solutions towards sustainable communities 260 European Commission (2020) Nature-based solutions for microclimate regulation and air quality 261 Shepley, Mardelle, et al. "The impact of green space on violent crime in urban environments: An evidence synthesis." International journal of environmental research and public health 16.24 (2019): 5119.

161
(+/-) (e.g. reducing damage from heavy
precipitation and
flooding, alleviating impacts of droughts
and heat-related challenges)262
Moreover, NBS can contribute to climate
mitigation through both storing and
sequestering carbon and reducing energy
demand (e.g. by improving thermal
comfort cities and promoting the use of
walking and cycling routes).263
Quality of natural
resources/fighting
pollution (water,
soil, air, etc.)
Strategy intends to address impacts of climate
change on natural resources, e.g. forests,
agriculture, marine environment.
Impact on
natural
resource
resilience
(+/-)
NbS interventions such as green roofs
can achieve cost-effective reductions in
drainage systems, whilst improving
urban environmental quality, decreasing
nutrient and chemical pollution level264
Moreover, a number of studies, such as
the BRIDGE project, have evidenced the
NBS’s contribution to removing air
pollutants such as O3, PM2.5, NOX, and
SO2.265
Targeted
direct
impact.
The quality of natural resources (including soil, water, and air) will be
positively impacted by the increased adoption of NbS, which will be
mainly achieved through prioritising and mainstreaming NbS for climate
adaptation at local level.
Assessment: Positive impact (+)
Biodiversity,
including flora,
fauna, ecosystems
and the services
they provide, and
landscapes
Strategy intends to address impacts of climate
change on biodiversity, and to make use of
Ecosystem-based solutions.
Use of
ecosystem-
based
solutions and
increased
resilience of
ecosystems
Several EU-funded projects have
identified types of NbS that have offer
particularly high benefits for
biodiversity. Examples of relevant NBS
include renaturing landfill sites,
brownfields and river corridors,
restoration of catchments and coastal
Targeted
direct
impact.
The measure is expected to increase the attractiveness and thus
deployment of NbS. Based on the identified benefits of NbS, the EU
biodiversity will be positively impacted as more NbS interventions are
supported.
Assessment: Positive impact (+)
262EEA (forthcoming) Nature-based solutions and ecosystem-based approaches to climate change adaptation and DRR in Europe 263 European Commission (forthcoming) Nature-based solutions- State of the art in the EU-Funded projects. 264 European Commission (2020) Nature-based solutions improving water quality and waterbody conditions 265 European Commission (2020) Nature-based solutions for microclimate regulation and air quality
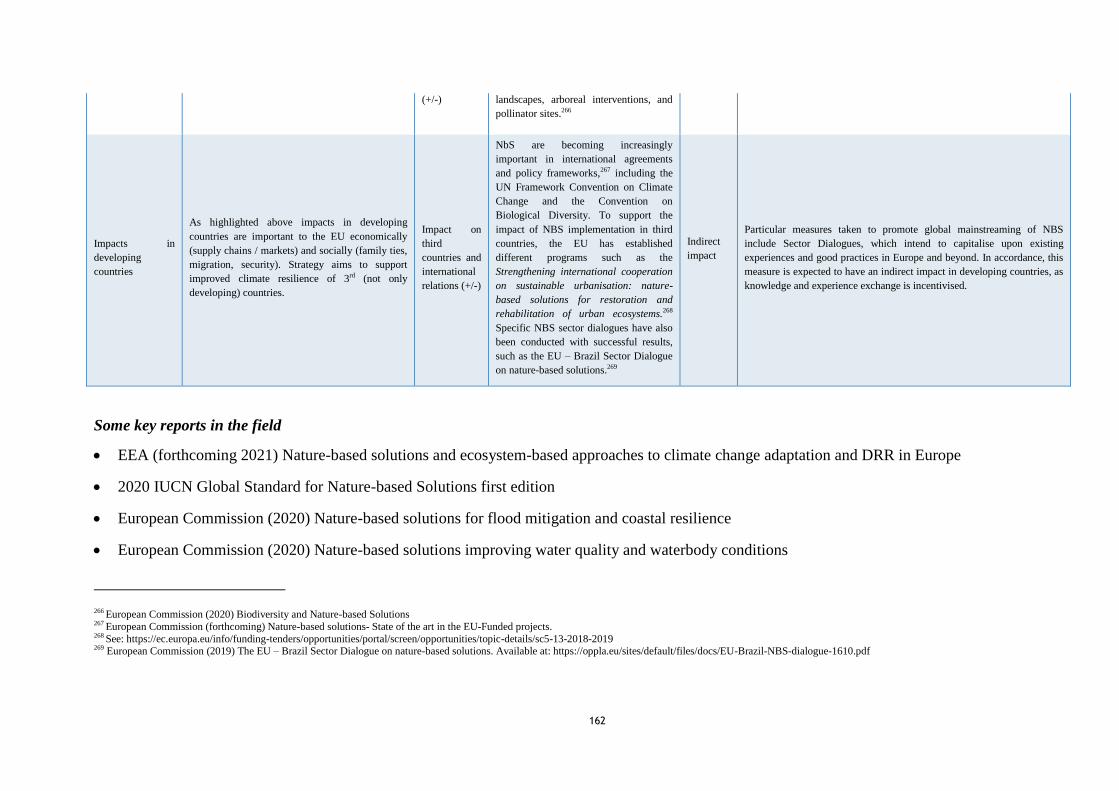
162
(+/-) landscapes, arboreal interventions, and
pollinator sites.266
Impacts in
developing
countries
As highlighted above impacts in developing
countries are important to the EU economically
(supply chains / markets) and socially (family ties,
migration, security). Strategy aims to support
improved climate resilience of 3rd (not only
developing) countries.
Impact on
third
countries and
international
relations (+/-)
NbS are becoming increasingly
important in international agreements
and policy frameworks,267 including the
UN Framework Convention on Climate
Change and the Convention on
Biological Diversity. To support the
impact of NBS implementation in third
countries, the EU has established
different programs such as the
Strengthening international cooperation
on sustainable urbanisation: nature-
based solutions for restoration and
rehabilitation of urban ecosystems.268
Specific NBS sector dialogues have also
been conducted with successful results,
such as the EU – Brazil Sector Dialogue
on nature-based solutions.269
Indirect
impact
Particular measures taken to promote global mainstreaming of NBS
include Sector Dialogues, which intend to capitalise upon existing
experiences and good practices in Europe and beyond. In accordance, this
measure is expected to have an indirect impact in developing countries, as
knowledge and experience exchange is incentivised.
Some key reports in the field
EEA (forthcoming 2021) Nature-based solutions and ecosystem-based approaches to climate change adaptation and DRR in Europe
2020 IUCN Global Standard for Nature-based Solutions first edition
European Commission (2020) Nature-based solutions for flood mitigation and coastal resilience
European Commission (2020) Nature-based solutions improving water quality and waterbody conditions
266 European Commission (2020) Biodiversity and Nature-based Solutions 267 European Commission (forthcoming) Nature-based solutions- State of the art in the EU-Funded projects. 268 See: https://ec.europa.eu/info/funding-tenders/opportunities/portal/screen/opportunities/topic-details/sc5-13-2018-2019 269 European Commission (2019) The EU – Brazil Sector Dialogue on nature-based solutions. Available at: https://oppla.eu/sites/default/files/docs/EU-Brazil-NBS-dialogue-1610.pdf
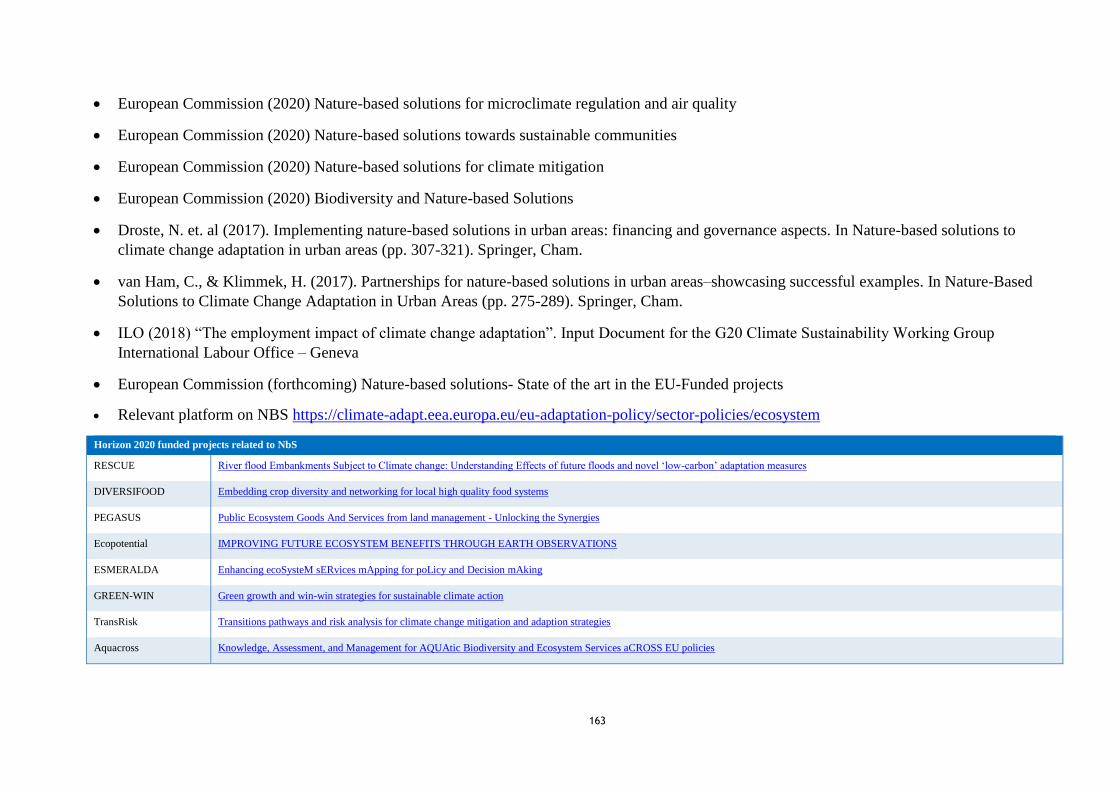
163
European Commission (2020) Nature-based solutions for microclimate regulation and air quality
European Commission (2020) Nature-based solutions towards sustainable communities
European Commission (2020) Nature-based solutions for climate mitigation
European Commission (2020) Biodiversity and Nature-based Solutions
Droste, N. et. al (2017). Implementing nature-based solutions in urban areas: financing and governance aspects. In Nature-based solutions to
climate change adaptation in urban areas (pp. 307-321). Springer, Cham.
van Ham, C., & Klimmek, H. (2017). Partnerships for nature-based solutions in urban areas–showcasing successful examples. In Nature-Based
Solutions to Climate Change Adaptation in Urban Areas (pp. 275-289). Springer, Cham.
ILO (2018) “The employment impact of climate change adaptation”. Input Document for the G20 Climate Sustainability Working Group
International Labour Office – Geneva
European Commission (forthcoming) Nature-based solutions- State of the art in the EU-Funded projects
Relevant platform on NBS https://climate-adapt.eea.europa.eu/eu-adaptation-policy/sector-policies/ecosystem
Horizon 2020 funded projects related to NbS
RESCUE River flood Embankments Subject to Climate change: Understanding Effects of future floods and novel ‘low-carbon’ adaptation measures
DIVERSIFOOD Embedding crop diversity and networking for local high quality food systems
PEGASUS Public Ecosystem Goods And Services from land management - Unlocking the Synergies
Ecopotential IMPROVING FUTURE ECOSYSTEM BENEFITS THROUGH EARTH OBSERVATIONS
ESMERALDA Enhancing ecoSysteM sERvices mApping for poLicy and Decision mAking
GREEN-WIN Green growth and win-win strategies for sustainable climate action
TransRisk Transitions pathways and risk analysis for climate change mitigation and adaption strategies
Aquacross Knowledge, Assessment, and Management for AQUAtic Biodiversity and Ecosystem Services aCROSS EU policies

164
INSPIRATION INtegrated Spatial PlannIng, land use and soil management Research ActTION
BiodivERsA3 Consolidating the European Research Area on biodiversity and ecosystem services
Placard PLAtform for Climate Adaptation and Risk reDuction
RESIN Climate Resilient Cities and Infrastructures
SMR Smart Mature Resilience
INNOVCITIES Institutional Innovation for Adapting to Climate Change in Water Governance within Cities
OPTWET Finding optimal size and location for wetland restoration sites for best nutrient removal performance using spatial analysis and modelling
BlueHealth Linking Up Environment, Health and Climate for Inter-sector Health Promotion and Disease Prevention in a Rapidly Changing Environment
INHERIT INter-sectoral Health Environment Research for InnovaTions
Sim4Nexus Sustainable Integrated Management FOR the NEXUS of water-land-food-energy-climate for a resource-efficient Europe
INCOVER Innovative Eco-Technologies for Resource Recovery from Wastewater
Aquanes Demonstrating synergies in combined natural and engineered processes for water treatment systems
MERCES Marine Ecosystem Restoration in Changing European Seas
AMBER Adaptive Management of Barriers in European Rivers
BRIGAID BRIdges the GAp for Innovations in Disaster resilience
FOODEV Food and Gastronomy as leverage for local development
SustUrbanFoods Integrated sustainability assessment of social and technological innovations towards urban food systems
BioCarbon Rapid tree-planting through the use of remote sensing and unmanned vehicle planting technologies for large scale reforestation
UNALAB Urban Nature Labs
CONNECTING nature COproductioN with NaturE for City Transitioning, INnovation and Governance
NATURVATION Nature Based Urban Innovation
EN-SUGI Eranet Sustainable Urbanisation Global Initiative

165
GROW GREEN Green Cities for Climate and Water Resilience, Sustainable Economic Growth, Healthy Citizens and Environments
Think Nature Development of a multi-stakeholder dialogue platform and Think tank to promote innovation with Nature based solutions
Clarity Integrated Climate Adaptation Service Tools for Improving Resilience Measure Efficiency
UrbanGreenUp New Strategy for Re-Naturing Cities through Nature-Based Solutions
Nature4Cities Nature Based Solutions for re-naturing cities: knowledge diffusion and decision support platform through new collaborative models
NAIAD NAture Insurance value: Assessment and Demonstration
ProGIReg productive Green Infrastructure for post-industrial urban regeneration
CLEVER Cities Co-designing Locally tailored Ecological solutions for Value added, socially inclusivE Regeneration in Cities
EdiCitNet Edible Cities Network Integrating Edible City Solutions for social resilient and sustainably productive cities
Phusicos 'According to nature' - solutions to reduce risk in mountain landscapes
URBiNAT Healthy corridors as drivers of social housing neighbourhoods for the co-creation of social, environmental and marketable NBS
Operandum OPEn-air laboRAtories for Nature baseD solUtions to Manage environmental risks
Reconect Regenarating ECOsystems with Nature-based solutions for hydro-meteorological risk rEduCTion
ReNature promoting Research Excellence in NAture-based soluTions for innovation, sUstainable economic GRowth and human wEll-being in Malta
EU-VNP-Net EU Valuing Nature Programme and Network
CLEARING HOUSE Collaborative Learning in Research, Information-sharing and Governance on How Urban tree-based solutions support Sino-European urban futures
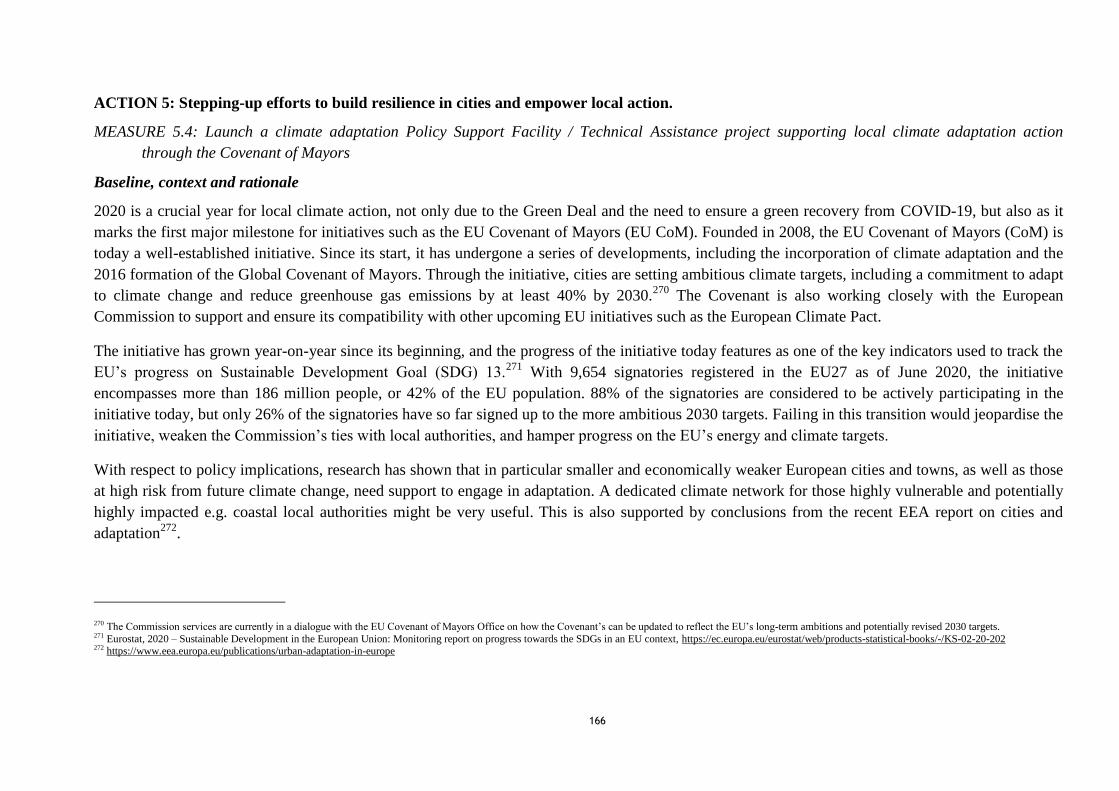
166
ACTION 5: Stepping-up efforts to build resilience in cities and empower local action.
MEASURE 5.4: Launch a climate adaptation Policy Support Facility / Technical Assistance project supporting local climate adaptation action
through the Covenant of Mayors
Baseline, context and rationale
2020 is a crucial year for local climate action, not only due to the Green Deal and the need to ensure a green recovery from COVID-19, but also as it
marks the first major milestone for initiatives such as the EU Covenant of Mayors (EU CoM). Founded in 2008, the EU Covenant of Mayors (CoM) is
today a well-established initiative. Since its start, it has undergone a series of developments, including the incorporation of climate adaptation and the
2016 formation of the Global Covenant of Mayors. Through the initiative, cities are setting ambitious climate targets, including a commitment to adapt
to climate change and reduce greenhouse gas emissions by at least 40% by 2030.270
The Covenant is also working closely with the European
Commission to support and ensure its compatibility with other upcoming EU initiatives such as the European Climate Pact.
The initiative has grown year-on-year since its beginning, and the progress of the initiative today features as one of the key indicators used to track the
EU’s progress on Sustainable Development Goal (SDG) 13.271
With 9,654 signatories registered in the EU27 as of June 2020, the initiative
encompasses more than 186 million people, or 42% of the EU population. 88% of the signatories are considered to be actively participating in the
initiative today, but only 26% of the signatories have so far signed up to the more ambitious 2030 targets. Failing in this transition would jeopardise the
initiative, weaken the Commission’s ties with local authorities, and hamper progress on the EU’s energy and climate targets.
With respect to policy implications, research has shown that in particular smaller and economically weaker European cities and towns, as well as those
at high risk from future climate change, need support to engage in adaptation. A dedicated climate network for those highly vulnerable and potentially
highly impacted e.g. coastal local authorities might be very useful. This is also supported by conclusions from the recent EEA report on cities and
adaptation272
.
270 The Commission services are currently in a dialogue with the EU Covenant of Mayors Office on how the Covenant’s can be updated to reflect the EU’s long-term ambitions and potentially revised 2030 targets. 271 Eurostat, 2020 – Sustainable Development in the European Union: Monitoring report on progress towards the SDGs in an EU context, https://ec.europa.eu/eurostat/web/products-statistical-books/-/KS-02-20-202 272 https://www.eea.europa.eu/publications/urban-adaptation-in-europe

167
Description of measure
The 3-year technical assistance project on climate adaptation would be implemented to provide support for some 200 cities/local authorities in Europe.
The primary goal of this project is to assist EU cities to catalyse their action on adaptation, and in turn, reduce the vulnerability of Europeans to the
impacts of climate change. Through its focus on small and medium-sized cities with lower capacities, the project will target the cities in greatest need
and support the Commission’s goal of ensuring no one is left behind in the transition to a more sustainable Europe.
The technical assistance will be facilitated in three ways: remote/virtual and on-site technical assistance, and mutual learning webinars and workshops.
First, the remote technical assistance will be provided supporting their work on climate adaptation, and including the development and implementation
of their Sustainable Energy and Climate Action Plans (SECAPs). Second, the missions will consist on a 2-day visit to the selected cities by a technical
expert, who will work on the ground with the city officials to underpin and support the remote assistance. Finally, the mutual learning webinars and
workshops will be conducted to complement and further support the technical assistance and promote knowledge exchange among cities at the EU
level and internationally.
Objectives and actions:
o Provide tailor-made assistance to EU cities over a period of 3 years to catalyse their action on adaptation, and in turn, reduce the vulnerability of
Europeans to the impacts of climate change.
o Assist climate adaptation in vulnerable, small and medium-sized cities (e.g. fewer than 150,000 inhabitants) with limited capacity to adapt to the
impacts of climate change.
o Support EU cities in identifying adaptation actions, moving from planning to implementation, and beyond guidance (i.e. capacity building).
o Increase the political visibility and attractiveness of the EU CoM as the key flagship initiative for local climate action in the EU as well as globally,
incentivising cities for joining the initiative and signing up to the 2030 targets.
o Facilitate access and knowledge on tools to enable cities to independently continue their work on climate adaptation, increase their adaptive
capacity, and eventually become leaders on adaptation in their regions, who disseminate their knowledge to other cities that face similar challenges.
o Establish the baseline to consider the establishment of a stand-alone climate adaptation support facility.

168
Cost
The project would be delivered through assistance provided by consultants or technical experts. For example, this would be done through an
amendment of the existing Covenant of Mayors contract, and the EU Covenant of Mayors Office subcontracting the technical assistance services. The
overall budget for the project is estimated to a total of ~EUR 1,5M.
Impact pathways
In the table below impacts are assessed using a scale from (--/-/0/+/++) negative to positive. Impacts are assessed up to 2050 relative to the baseline. It
assumes the full uptake of the measure as the increasing severity of physical climate risks is more widely recognized in cities, and consequently the
relevance for the provision of tailored support to cities.
Table 31: Mini-assessment of Policy Support Facility / Technical Assistance project
Impact indicator Relevance Indicator Baseline Impact pathway Envisaged impact 2050 (relative to baseline)
Economic
Macroeconomic
environment
Impacts on the economy are a
hugely significant driver for
action and reducing damages
can be an important indicator of
increased resilience.
Economic
welfare (losses)
(-/+)
Losses to productivity from absences due to
effects of climate change in cities. The CoM
signatories are encouraged to evaluate and
report impacts on socio-economic sectors of
climate change. The baseline would be based
on the contributions by the top 10 cities to
GVA.
Indirect impact –
economic benefits
of reduced
productivity
losses from
climate adaptation
action in cities
prompted by the
technical
assistance project.
Impacts included in modelling results in chapter 6. This measure is
interpreted as reducing the heat stress in urban areas, largely through green
infrastructure and climate resilient adapted buildings. The direct measure is
to launch climate adaptation policy support facility and/or a technical
assistance project. Assuming such a facility will improve investment in
adaptation, we modelled investment in cities. We assumed this leading to
increased resilience and a damage reduction of 1% of the productivity
losses from heat waves (Orlov et al. (2019)) for the RCP2.6 scenario, 5%
reduction under the warmer RCP4.5 scenario and a 10% less productivity
loss under the 4°C scenario. These values are based on own assumptions.
The productivity losses from heat in the reference case are modelled to
match (Orlov et al. (2019)). They range from 0.7% in the North to 2.8% in
the southern Member states. The spread over different warming scenarios is
taken from Orlov, the distribution over European regions stems from the
distribution of fatalities across Europe in Szewczyk (2020). The investment
goes mostly into additional demand for construction. The amounts are taken
from Lehr et al. (2020) and are rescaled for the Member States proportional
to the population.
Assessment: Quantitative results included in chapter 6, qualitative
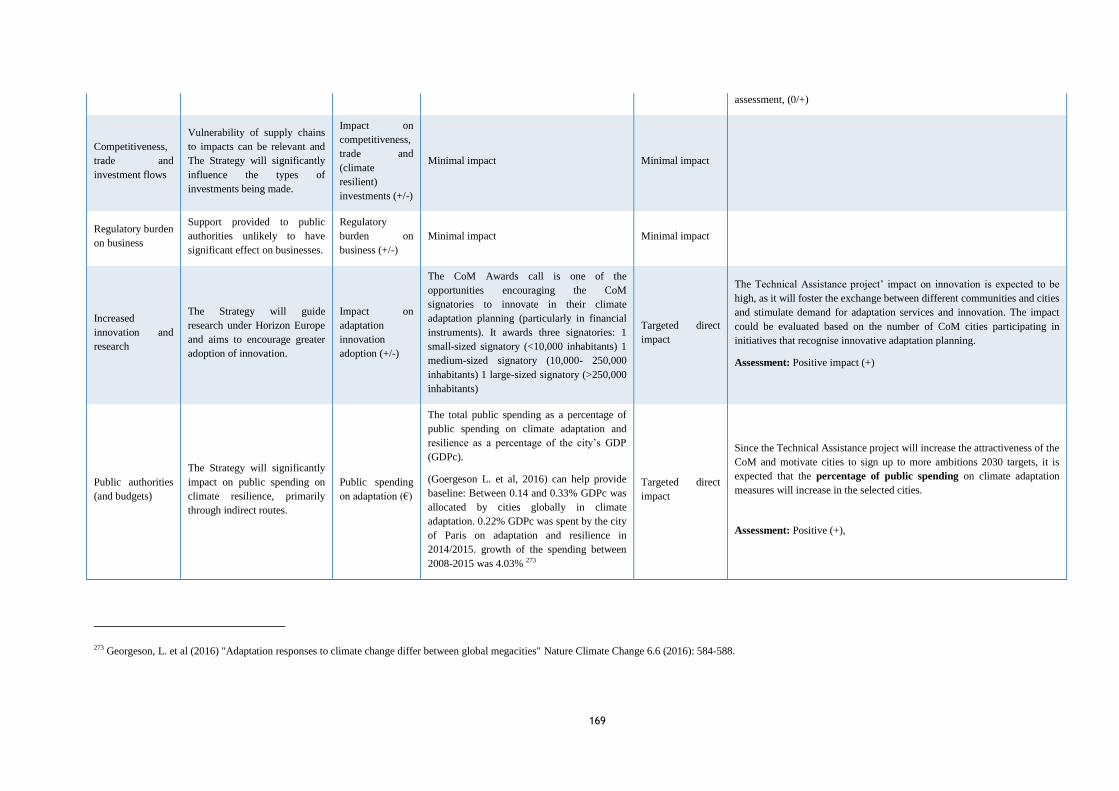
169
assessment, (0/+)
Competitiveness,
trade and
investment flows
Vulnerability of supply chains
to impacts can be relevant and
The Strategy will significantly
influence the types of
investments being made.
Impact on
competitiveness,
trade and
(climate
resilient)
investments (+/-)
Minimal impact Minimal impact
Regulatory burden
on business
Support provided to public
authorities unlikely to have
significant effect on businesses.
Regulatory
burden on
business (+/-)
Minimal impact Minimal impact
Increased
innovation and
research
The Strategy will guide
research under Horizon Europe
and aims to encourage greater
adoption of innovation.
Impact on
adaptation
innovation
adoption (+/-)
The CoM Awards call is one of the
opportunities encouraging the CoM
signatories to innovate in their climate
adaptation planning (particularly in financial
instruments). It awards three signatories: 1
small-sized signatory (<10,000 inhabitants) 1
medium-sized signatory (10,000- 250,000
inhabitants) 1 large-sized signatory (>250,000
inhabitants)
Targeted direct
impact
The Technical Assistance project’ impact on innovation is expected to be
high, as it will foster the exchange between different communities and cities
and stimulate demand for adaptation services and innovation. The impact
could be evaluated based on the number of CoM cities participating in
initiatives that recognise innovative adaptation planning.
Assessment: Positive impact (+)
Public authorities
(and budgets)
The Strategy will significantly
impact on public spending on
climate resilience, primarily
through indirect routes.
Public spending
on adaptation (€)
The total public spending as a percentage of
public spending on climate adaptation and
resilience as a percentage of the city’s GDP
(GDPc).
(Goergeson L. et al, 2016) can help provide
baseline: Between 0.14 and 0.33% GDPc was
allocated by cities globally in climate
adaptation. 0.22% GDPc was spent by the city
of Paris on adaptation and resilience in
2014/2015. growth of the spending between
2008-2015 was 4.03% 273
Targeted direct
impact
Since the Technical Assistance project will increase the attractiveness of the
CoM and motivate cities to sign up to more ambitions 2030 targets, it is
expected that the percentage of public spending on climate adaptation
measures will increase in the selected cities.
Assessment: Positive (+),
273 Georgeson, L. et al (2016) "Adaptation responses to climate change differ between global megacities" Nature Climate Change 6.6 (2016): 584-588.

170
Moreover, according to the 2019 CoM
assessment274, 700 million EUR have been
allocated to adaptation by CoM signatories.
Social impacts
Employment
Impacts on the economy and in-
turn on employment are a
hugely significant driver for
action and reducing damages
and job losses can be an
important indicator of increased
resilience.
Employment
(FTE)
Adaptation measures can lead to employment
gains and prevent job losses. Evidence
suggests that in Europe around 500,000
additional jobs will be directly and indirectly
created by 2050 as a result of the increase in
adaptation-related activities.275
Today, in Germany 6 % of total employment
relies directly on ecosystem services; while in
the European Union (EU) as a whole the
proportion is as high as 16 %.276
Targeted direct
impact
Skills development is a core component of the Technical Assistant project.
Capacity-building activities increase the adaptive capacity of a city because
it helps displaced workers to move on to sectors where there is employment
growth, thus protecting them against income losses and other adverse
effects of climate change. A shortage of skills would in any case be an
obstacle to the implementation of adaptation measures.277
The number of participants on the capacity building activities related to
skills development on climate adaptation of the Technical Assistant project
will provide an indication of the impact of initiative on the resilience of the
employment in the selected cities.
Assessment: Positive impact (+)
Income
distribution, social
protection and
social inclusion
(of particular
groups)
Distributional impacts of
climate change can be
significant, the Strategy is
intended to address and
mitigate inequalities, including
through better informing
citizens and encouraging action.
Needs to address broader
questions of equity (see other
impacts) such as location,
economic and social cohesion,
gender and of fundamental
rights.
Distributional
and equity
impacts (+/-)
Based on the 2019 CoM assessment278:
Most of the Covenant of Mayors signatories
(90 %) are small- and medium-sized towns,
which are in more need of support due to
limited financial and human resources.
Regarding the participation across different
EU countries, the CoM still plays a very
different role in each country. The large
majority of CoM signatories reporting
adaptation goals (82%) are from Italy, Spain
and Belgium.
In addition, the percentage of the CoM
Indirect impact
The Technical Assistance project aims to primarily support small and
medium-sized cities, which are most vulnerable to climate change.
However, it has been reported that the proportion of cities with an
autonomous and comprehensive adaptation plan increases in line with their
size279, which suggests that small cities are more likely to lack adaptation
strategies in place.
Assessment: Positive impact (+)
Targeted direct
impact
The impact of the Technical Assistance project on social inclusion is
expected to be reflected in:
- percentage of population covered by CoM signatures per country.
- percentage of CoM signatories reporting vulnerabilities that are small- and
274 Bertoldi, P et. Al (2020), “Covenant of Mayors: 2019 Assessment”, Publications Office of the European Union, Luxembourg” ISBN 978-92-76-10722-4, doi:10.2760/775755, JRC118927 275 Triple E Consulting. (2014). “Assessing the implications of climate change adaptation on employment in the EU: Final report and annexes” 276 ILO (2018) “The employment impact of climate change adaptation”. Input Document for the G20 Climate Sustainability Working Group International Labour Office – Geneva, 277 Ibid. 278 Bertoldi, P et. Al (2020), “Covenant of Mayors: 2019 Assessment”, Publications Office of the European Union, Luxembourg” ISBN 978-92-76-10722-4, doi:10.2760/775755, JRC118927 279 Reckien, D. et al. (2018). How are cities planning to respond to climate change? Assessment of local climate plans from 885 cities in the EU-28. Journal of Cleaner Production. 191. 207-219. 10.1016/j.jclepro.2018.03.220.
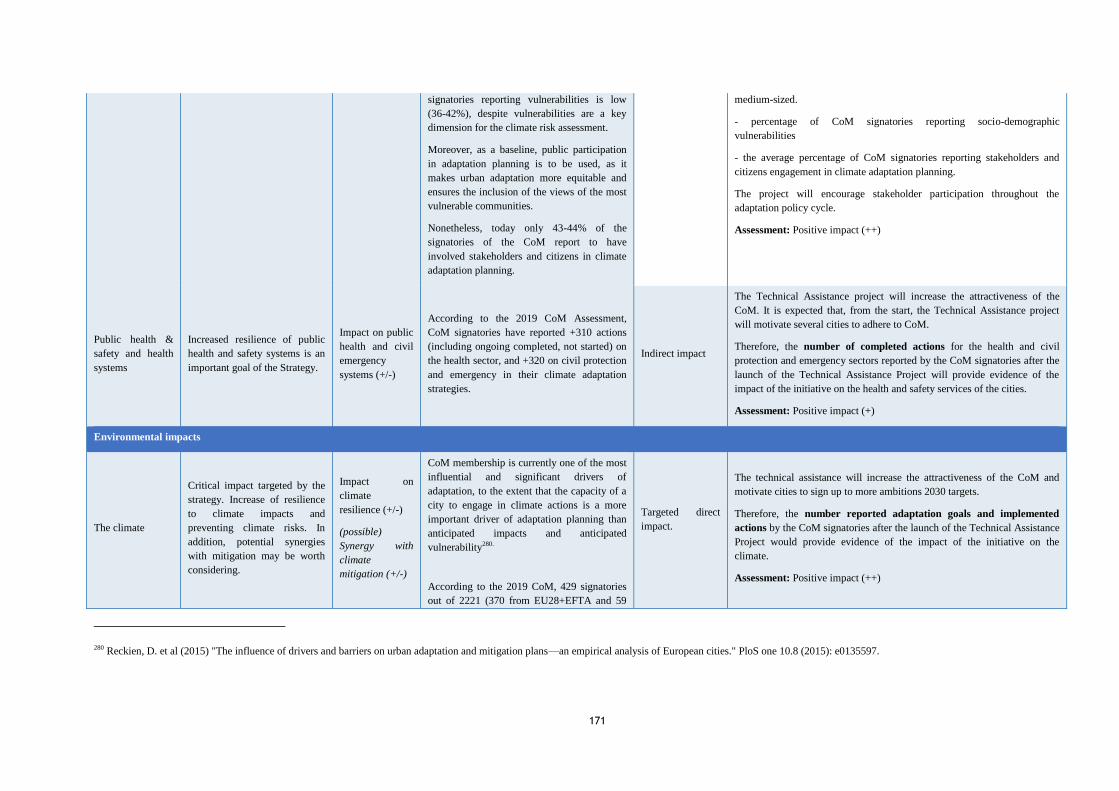
171
signatories reporting vulnerabilities is low
(36-42%), despite vulnerabilities are a key
dimension for the climate risk assessment.
Moreover, as a baseline, public participation
in adaptation planning is to be used, as it
makes urban adaptation more equitable and
ensures the inclusion of the views of the most
vulnerable communities.
Nonetheless, today only 43-44% of the
signatories of the CoM report to have
involved stakeholders and citizens in climate
adaptation planning.
medium-sized.
- percentage of CoM signatories reporting socio-demographic
vulnerabilities
- the average percentage of CoM signatories reporting stakeholders and
citizens engagement in climate adaptation planning.
The project will encourage stakeholder participation throughout the
adaptation policy cycle.
Assessment: Positive impact (++)
Public health &
safety and health
systems
Increased resilience of public
health and safety systems is an
important goal of the Strategy.
Impact on public
health and civil
emergency
systems (+/-)
According to the 2019 CoM Assessment,
CoM signatories have reported +310 actions
(including ongoing completed, not started) on
the health sector, and +320 on civil protection
and emergency in their climate adaptation
strategies.
Indirect impact
The Technical Assistance project will increase the attractiveness of the
CoM. It is expected that, from the start, the Technical Assistance project
will motivate several cities to adhere to CoM.
Therefore, the number of completed actions for the health and civil
protection and emergency sectors reported by the CoM signatories after the
launch of the Technical Assistance Project will provide evidence of the
impact of the initiative on the health and safety services of the cities.
Assessment: Positive impact (+)
Environmental impacts
The climate
Critical impact targeted by the
strategy. Increase of resilience
to climate impacts and
preventing climate risks. In
addition, potential synergies
with mitigation may be worth
considering.
Impact on
climate
resilience (+/-)
(possible)
Synergy with
climate
mitigation (+/-)
CoM membership is currently one of the most
influential and significant drivers of
adaptation, to the extent that the capacity of a
city to engage in climate actions is a more
important driver of adaptation planning than
anticipated impacts and anticipated
vulnerability280.
According to the 2019 CoM, 429 signatories
out of 2221 (370 from EU28+EFTA and 59
Targeted direct
impact.
The technical assistance will increase the attractiveness of the CoM and
motivate cities to sign up to more ambitions 2030 targets.
Therefore, the number reported adaptation goals and implemented
actions by the CoM signatories after the launch of the Technical Assistance
Project would provide evidence of the impact of the initiative on the
climate.
Assessment: Positive impact (++)
280 Reckien, D. et al (2015) "The influence of drivers and barriers on urban adaptation and mitigation plans—an empirical analysis of European cities." PloS one 10.8 (2015): e0135597.
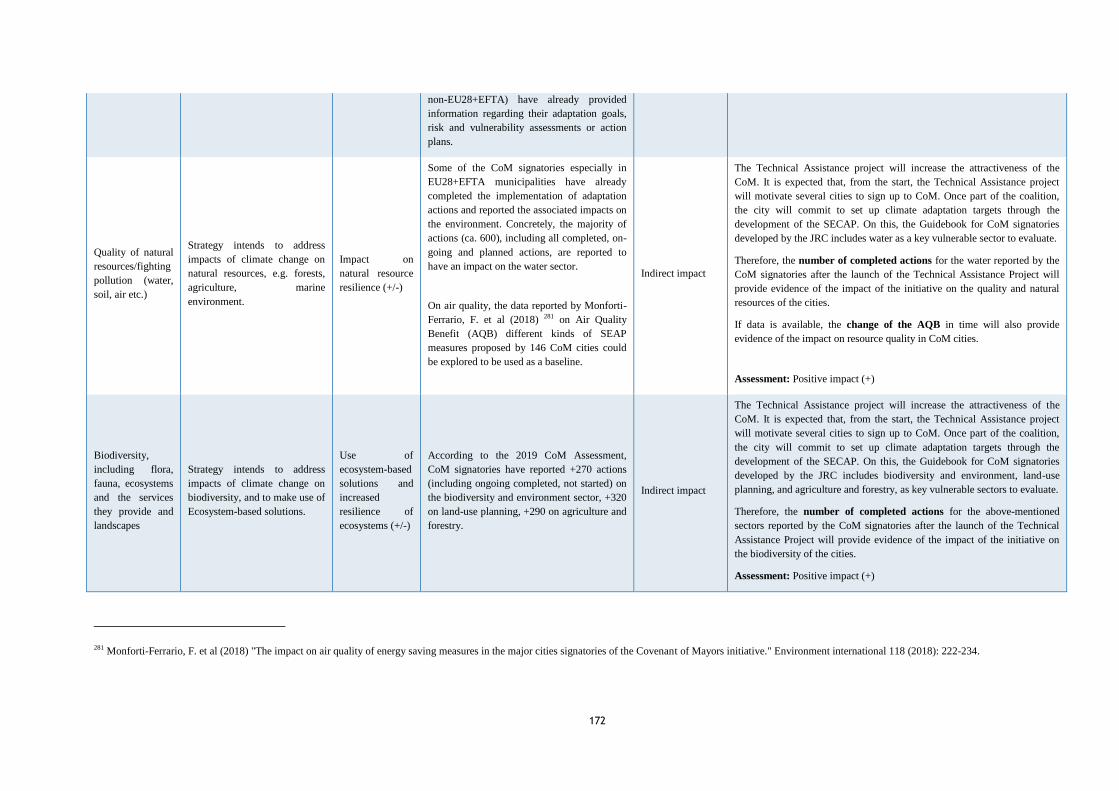
172
non-EU28+EFTA) have already provided
information regarding their adaptation goals,
risk and vulnerability assessments or action
plans.
Quality of natural
resources/fighting
pollution (water,
soil, air etc.)
Strategy intends to address
impacts of climate change on
natural resources, e.g. forests,
agriculture, marine
environment.
Impact on
natural resource
resilience (+/-)
Some of the CoM signatories especially in
EU28+EFTA municipalities have already
completed the implementation of adaptation
actions and reported the associated impacts on
the environment. Concretely, the majority of
actions (ca. 600), including all completed, on-
going and planned actions, are reported to
have an impact on the water sector.
On air quality, the data reported by Monforti-
Ferrario, F. et al (2018) 281 on Air Quality
Benefit (AQB) different kinds of SEAP
measures proposed by 146 CoM cities could
be explored to be used as a baseline.
Indirect impact
The Technical Assistance project will increase the attractiveness of the
CoM. It is expected that, from the start, the Technical Assistance project
will motivate several cities to sign up to CoM. Once part of the coalition,
the city will commit to set up climate adaptation targets through the
development of the SECAP. On this, the Guidebook for CoM signatories
developed by the JRC includes water as a key vulnerable sector to evaluate.
Therefore, the number of completed actions for the water reported by the
CoM signatories after the launch of the Technical Assistance Project will
provide evidence of the impact of the initiative on the quality and natural
resources of the cities.
If data is available, the change of the AQB in time will also provide
evidence of the impact on resource quality in CoM cities.
Assessment: Positive impact (+)
Biodiversity,
including flora,
fauna, ecosystems
and the services
they provide and
landscapes
Strategy intends to address
impacts of climate change on
biodiversity, and to make use of
Ecosystem-based solutions.
Use of
ecosystem-based
solutions and
increased
resilience of
ecosystems (+/-)
According to the 2019 CoM Assessment,
CoM signatories have reported +270 actions
(including ongoing completed, not started) on
the biodiversity and environment sector, +320
on land-use planning, +290 on agriculture and
forestry.
Indirect impact
The Technical Assistance project will increase the attractiveness of the
CoM. It is expected that, from the start, the Technical Assistance project
will motivate several cities to sign up to CoM. Once part of the coalition,
the city will commit to set up climate adaptation targets through the
development of the SECAP. On this, the Guidebook for CoM signatories
developed by the JRC includes biodiversity and environment, land-use
planning, and agriculture and forestry, as key vulnerable sectors to evaluate.
Therefore, the number of completed actions for the above-mentioned
sectors reported by the CoM signatories after the launch of the Technical
Assistance Project will provide evidence of the impact of the initiative on
the biodiversity of the cities.
Assessment: Positive impact (+)
281 Monforti-Ferrario, F. et al (2018) "The impact on air quality of energy saving measures in the major cities signatories of the Covenant of Mayors initiative." Environment international 118 (2018): 222-234.
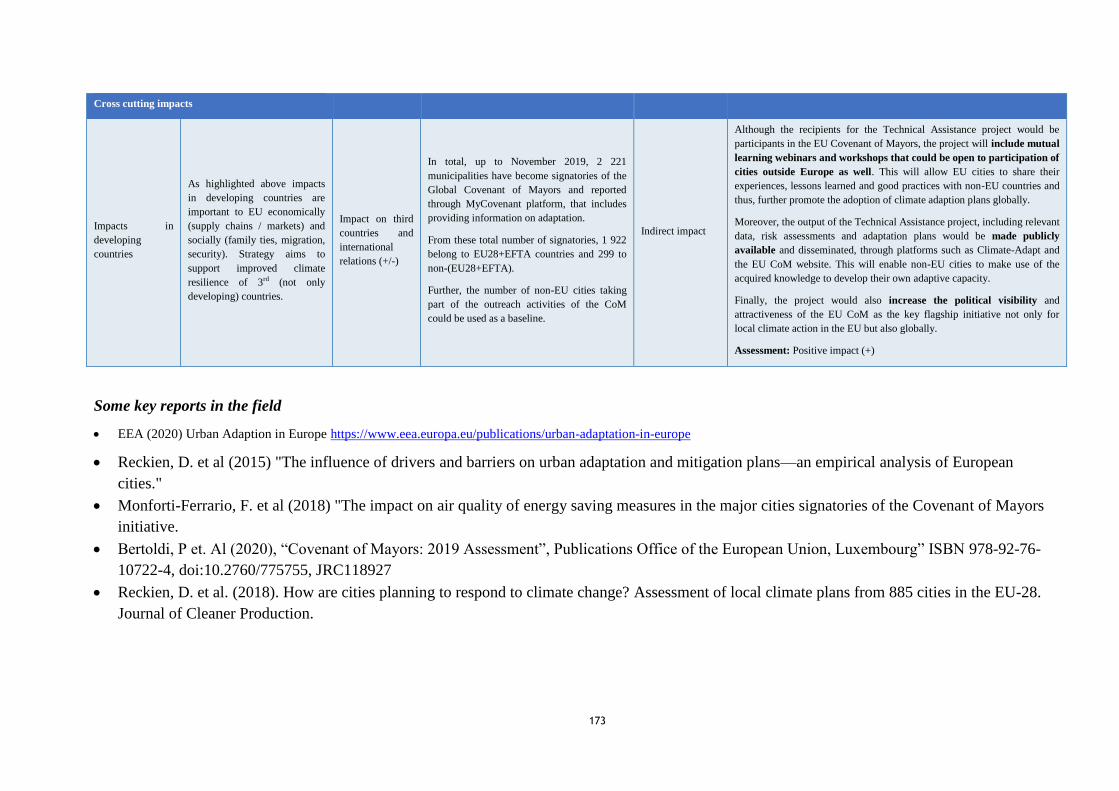
173
Cross cutting impacts
Impacts in
developing
countries
As highlighted above impacts
in developing countries are
important to EU economically
(supply chains / markets) and
socially (family ties, migration,
security). Strategy aims to
support improved climate
resilience of 3rd (not only
developing) countries.
Impact on third
countries and
international
relations (+/-)
In total, up to November 2019, 2 221
municipalities have become signatories of the
Global Covenant of Mayors and reported
through MyCovenant platform, that includes
providing information on adaptation.
From these total number of signatories, 1 922
belong to EU28+EFTA countries and 299 to
non-(EU28+EFTA).
Further, the number of non-EU cities taking
part of the outreach activities of the CoM
could be used as a baseline.
Indirect impact
Although the recipients for the Technical Assistance project would be
participants in the EU Covenant of Mayors, the project will include mutual
learning webinars and workshops that could be open to participation of
cities outside Europe as well. This will allow EU cities to share their
experiences, lessons learned and good practices with non-EU countries and
thus, further promote the adoption of climate adaption plans globally.
Moreover, the output of the Technical Assistance project, including relevant
data, risk assessments and adaptation plans would be made publicly
available and disseminated, through platforms such as Climate-Adapt and
the EU CoM website. This will enable non-EU cities to make use of the
acquired knowledge to develop their own adaptive capacity.
Finally, the project would also increase the political visibility and
attractiveness of the EU CoM as the key flagship initiative not only for
local climate action in the EU but also globally.
Assessment: Positive impact (+)
Some key reports in the field
EEA (2020) Urban Adaption in Europe https://www.eea.europa.eu/publications/urban-adaptation-in-europe
Reckien, D. et al (2015) "The influence of drivers and barriers on urban adaptation and mitigation plans—an empirical analysis of European
cities."
Monforti-Ferrario, F. et al (2018) "The impact on air quality of energy saving measures in the major cities signatories of the Covenant of Mayors
initiative.
Bertoldi, P et. Al (2020), “Covenant of Mayors: 2019 Assessment”, Publications Office of the European Union, Luxembourg” ISBN 978-92-76-
10722-4, doi:10.2760/775755, JRC118927
Reckien, D. et al. (2018). How are cities planning to respond to climate change? Assessment of local climate plans from 885 cities in the EU-28.
Journal of Cleaner Production.
174
MEASURE 5.6: Support vulnerable groups and enterprises through education and reskilling initiatives for green jobs and new business models,
including through the European Skills Agenda and European Social Fund Plus (ESF+), with a particular focus on adaptation and resilience.
Baseline, context and rationale
The Multiannual Financial Framework (MFF) serves as the basis for the implementation of the EU budget and allows the European Commission
and Member States to implement EU policies and deliver the objectives of the EU mission, such as those to support vulnerable groups and enterprises.
The MFF covers seven areas of funding, of which over half is channelled through the 5 European Structural and Investment Funds (ESIF)282
. The
European Social Fund (ESF) is one such channel, and aims at enhancing employment and fairer life opportunities for all. It is the EU’s main tool for
helping people find employment (or better employment), integrate disadvantaged people into society, and ensure fairer life opportunities for all. The
European Social Fund Plus (ESF+) is the successor of the ESF under the newest MFF budget period. The governance for the ESF+ and the other
ESIF funds is laid out in the Common Provisions Regulation (CPR). In the next budget period, these funds will be managed by a new CPR. The new
CPR builds off the current one and introduces a number of innovations, such as:
a smarter Europe, through innovation, digitisation, economic transformation and support for small and medium-sized businesses;
a greener, carbon free Europe, implementing the Paris Agreement and investing in energy transition, renewables and the fight against climate
change;
a more connected Europe, with strategic transport and digital networks;
a more Social Europe, delivering on the European Pillar of Social Rights and supporting quality employment, education, skills, social inclusion and
equal access to healthcare;
a Europe closer to citizens, by supporting locally led development strategies and sustainable urban development across the EU.
Of these, the ESF+ will contribute the Social Europe policy pillar. From the proposal for the ESF+ regulation, it is clear that the rules and guidelines
for climate action within the Fund are still under development283
. The regulation mentions that the contribution of the ESF+ to the 30% target of the
282 European Commission (2018). European structural and investment funds.
Retrieved from: https://ec.europa.eu/info/funding-tenders/funding-opportunities/funding-programmes/overview-fundingprogrammes/european-structural-and-investment-funds_en#thefunds 283 European Commission (2018). Proposal for a regulation of the European Parliament and of the Council on the European Social Fund Plus (ESF+), COM (2018) 382 final, 30.5.2018.

175
MFF will be tracked through an EU climate marker system at an appropriate level of disaggregation, including the use of more precise methodologies
where these are available. Climate change will affect labour markets through impacts from regulations affecting supply and demand side employment,
as well as direct impacts on natural and built environments284
. According to the most recent PESETA III report285
, the total EU welfare loss due to
climate change under a high warming scenario is estimated to be around 1.9% of GDP (EUR 240 billion) per year by the end of the century. This is
mostly associated to heat-related mortality, coastal and river flooding, decrease in labour productivity, and agriculture losses. Welfare losses are further
vulnerable to changes in trade flows associated with climate change which could increase losses by another 20%. A previous study by Trinomics286
estimated that potential job losses around 410,000 by 2050 if no adaptation measures are taken. On the other end of the spectrum, the study estimated
that adaptation measures could lead to the creation of 500,000 jobs by 2050. Three sectors, water management, energy supply, and transport
infrastructure, are likely to see the largest investments in Europe’s adaptation to climate change, and thus the largest net employment gains287
. Together
these sectors account for 90% of employment gains associated with adaptation investments.
The question of what constitutes green skills and jobs is difficult to answer. Primarily because each Member State approaches reskilling employees for
the green economy differently, with no common approach to data collection or definition for green jobs. This means that methods for categorising and
measuring the amount of green jobs varies among countries. Despite these differences in classifications and methods, changes in green employment are
largely contributed to two factors: 1) the general economic cycle, and trends in government policy and the availability of governmental incentives and
subsides. Permanent mechanisms dedicated to the green economy and green employment, including green skills anticipation, are needed but rather rare
in the EU. The European Skills Agenda, a five-year plan to assist skill building for individuals and businesses is one such foray. It enshrines social
fairness, such as access to education, training and lifelong learning, and seeks to strengthen sustainable competitiveness and build resilience to crises.
The European Skills Agenda also seeks to unlock investments (both public and private) in skills.
Interviews: In the interviews, social impact of the Strategy was mentioned by several interviewees. One interviewee felt that the biggest added value
for analysis on adaptation is with a focus on the economic case. Where the economic impact is being regarded as the enabler of environmental and
social action. They further specified that social impact, which is closely related to the economic impact, should focus on well-being, job security, and
284 Martinez-Fernandez, C., Hinojosa, C., & Miranda, G. (2010). Greening jobs and skills labor market implications of addressing climate change oecd. 285 Ciscar J.C., Feyen L., Ibarreta D., Soria A. (2018), Climate impacts in Europe, Final report of the JRC PESETA III project, https://ec.europa.eu/jrc/en/news/climate-change-human-and-economic-outlook-europeans 286 Trinomics (formerly: Triple E consulting) (2014), Assessing the implications of climate change adaptation on employment in the EU, available at: https://climate-adapt.eea.europa.eu/metadata/publications/assessing-the-
implications-of-climate-change-adataptation-on-employment-in-the-eu-1 287 Görlach, B., Thie, JE., Faber, R., Stenning, J., Lonsdale, J. (2020) Employment policies to support a low-carbon and climate resilient transition Draft Final Report - Adaptation component.
176
health. Another interviewee discussed the overall resistance to some of the big changes that need to happen for jobs, i.e. moving people from one sector
to another. They felt that the EU needs to focus on vulnerable sectors and people.
OPC: Question 12 of the OPC asked respondents how important it is for a new EU Adaptation to achieve improved health, social cohesion and
resilience. The majority of respondents felt it was very important (58%).
ACTION 6: Further mainstreaming and integrating adaptation in EU legislation and instruments
NO MEASURE selected on Action 6
ACTION 7: Climate Proofing of Infrastructure and beyond.
7.2: Ensure climate-proofing guidelines are applied as widely as possible for the climate resilience of new infrastructures in Europe and abroad.
Baseline, context, and rationale
The 2013 Strategy through Action 7 led to the development of guidelines and technical standards for climate proofing in the infrastructure sector288
.
The 2018 Evaluation concluded that there remains room for improvement in the awareness and actual use of these guidance documents for project
managers. The provision of guidance documentation on how to use methodologies or develop the required infrastructure project documentation relating
to climate adaptation is crucial for the effective implementation of adaptation measures.289
288 European Commission (2016). Non-paper Guidelines for Project Managers: Making vulnerable investments climate resilient. 289 European Commission (2018). Climate change adaptation of major infrastructure projects. A stock-taking of available resources to assist the development of climate resilient infrastructure. Retrieved from: https://ec.europa.eu/regional_policy/en/information/publications/studies/2018/climate-change-adaptation-of-major-infrastructure-projects
177
In the transport sector, for instance, incremental climate change effects (e.g., sea-level rise, heat waves) can result in transportation infrastructure
damages, operational disruptions, and pressures on supply chain capacity and efficiency290
. Nonetheless, as the 2018 evaluation concluded, there is still
a lack of awareness about the importance of climate proofing in the infrastructural sector and room for improvement in the usage of guidelines and
technical standards. This lack of awareness may be one of the causes of the uneven and weak understanding of vulnerabilities and the need to establish
climate resilient transport infrastructure across Europe. Therefore, as part of the new EU Adaptation Strategy, planning and climate risk management
will be reinforced by e.g. strengthening climate-proofing transport.
When asked in the OPC how respondents would rate a list of potential actions for a new EU Adaptation Strategy, half of the respondents found it very
important to increase infrastructure resilience through extended use of EU climate proofing guidance (50 %).In the context of the recovery from the
COVID-19 crisis, the importance of application of climate proofing guidelines for the planned Renovation Wave has been reinforced. Consequently,
the new Strategy will seek to set up the needed tools and guidance to support the investment in infrastructure that is coherent with the “build back
better” approach.
Description of measure
This measure will seek to ensure that the climate proofing guidelines are applied as widely as possible for the climate resilience of new infrastructures
in Europe and abroad. Building on the existing guidelines and technical standards developed as part of the 2013 Strategy through Action 7, it will
promote the application of the guidelines to address the climate resilience of existing infrastructure, in particular for critical infrastructures (i.e. those
essential for the maintenance of vital societal functions, health, safety, security, economic or social well-being of people), and networks (e.g. transport,
communication, and energy).
Objectives and actions:
Understand the reasons behind the low application of the climate proofing guidelines developed as part of the 2013 Strategy through Action 7 to
address the climate resilience of existing infrastructure, to ensure that these are improved in accordance to the gaps expressed by the users (e.g.
project managers, urban practitioners)
290 UNECE - United Nations Economic Commission for Europe (2020). Climate Change Impacts and Adaptation for Transport Networks and Nodes. Available at: https://www.unece.org/fileadmin/DAM/trans/doc/2020/wp5/ECE-TRANS-283e.pdf

178
Ensure that the climate proofing guidelines are applied as widely as possible for the climate resilience of new infrastructures in Europe and abroad,
taking into consideration the latest developments by the European Committee for Standardisation (CEN, Centre Européen de Normalisation) and
the International Standards Organisation (ISO), which are constantly reviewing existing standards to better address climate risk. This should be
done by e.g. exchanges with operators of critical infrastructures and relevant engineering companies, to assess how these guidelines could
complement the current engineering and design requirements, as well as the operation and maintenance practices.
Disseminate the use of other existing tools to support climate proofing of infrastructure, such as the ‘HARmonized grids of Critical Infrastructures
in Europe’ (HARCI-EU) dataset, which were produced by integrating geospatial and statistical data from multiple sources and provide a consistent
mapping of critical infrastructure in key sectors that can serve as exposure information for large-scale risk assessments in Europe; and incorporate
the outcome of other EU funded relevant projects such as IMPROVER (Improved risk evaluation and implementation of resilience concepts to
critical infrastructure), and EU Circle (a Pan-European framework Strengthening Critical Infrastructure Resilience to Climate Change)
Build capacity of partner countries to apply climate proofing guidance, e.g. through mechanisms to support climate proofing of investments
(similarly to how it is currently done for EU-funded investments in the EU through Structural Funds).
Impact pathways
In the table below impacts are assessed using a scale from (--/-/0/+/++) negative to positive. Impacts are assessed up to 2050 relative to the baseline. It
assumes the full uptake of the measure as the increasing severity of physical climate risks results in disruptive impacts across Europe, and consequently
the relevance of climate-proofed infrastructure is widely recognised.
Table 32: Mini-Assessment of Climate Proofing of Infrastructure and Disaster Risk Management
Impact indicator Relevance Indicator Baseline Impact
pathway Envisaged impact 2050 (relative to baseline)
Economic
Macroeconomic
environment Impacts on the economy are a
hugely significant driver for
action and reducing damages can
Economic
welfare (losses)
A study led by the EU JRC291 assessed the risks on the economy of
damages on critical infrastructure caused by climate change
extremes using a prognostic modelling framework. It was found that
Direct impact Included in modelling results for Option 1 in
chapter 6. This measure ensures climate-
proofing guidelines are applied as widely as
291 Forzieri, Giovanni, et al. "Escalating impacts of climate extremes on critical infrastructures in Europe." Global environmental change 48 (2018): 97-107.i
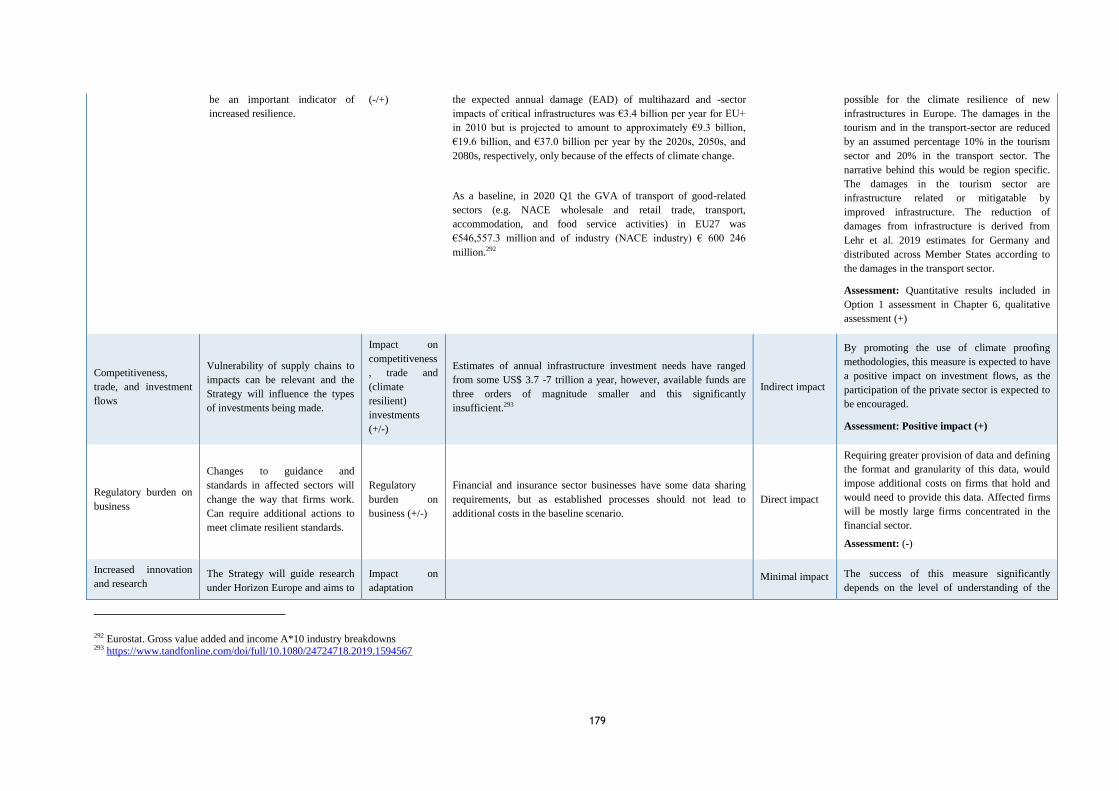
179
be an important indicator of
increased resilience. (-/+) the expected annual damage (EAD) of multihazard and -sector
impacts of critical infrastructures was €3.4 billion per year for EU+
in 2010 but is projected to amount to approximately €9.3 billion,
€19.6 billion, and €37.0 billion per year by the 2020s, 2050s, and
2080s, respectively, only because of the effects of climate change.
As a baseline, in 2020 Q1 the GVA of transport of good-related
sectors (e.g. NACE wholesale and retail trade, transport,
accommodation, and food service activities) in EU27 was
€546,557.3 million and of industry (NACE industry) € 600 246
million.292
possible for the climate resilience of new
infrastructures in Europe. The damages in the
tourism and in the transport-sector are reduced
by an assumed percentage 10% in the tourism
sector and 20% in the transport sector. The
narrative behind this would be region specific.
The damages in the tourism sector are
infrastructure related or mitigatable by
improved infrastructure. The reduction of
damages from infrastructure is derived from
Lehr et al. 2019 estimates for Germany and
distributed across Member States according to
the damages in the transport sector.
Assessment: Quantitative results included in
Option 1 assessment in Chapter 6, qualitative
assessment (+)
Competitiveness,
trade, and investment
flows
Vulnerability of supply chains to
impacts can be relevant and the
Strategy will influence the types
of investments being made.
Impact on
competitiveness
, trade and
(climate
resilient)
investments
(+/-)
Estimates of annual infrastructure investment needs have ranged
from some US$ 3.7 -7 trillion a year, however, available funds are
three orders of magnitude smaller and this significantly
insufficient.293
Indirect impact
By promoting the use of climate proofing
methodologies, this measure is expected to have
a positive impact on investment flows, as the
participation of the private sector is expected to
be encouraged.
Assessment: Positive impact (+)
Regulatory burden on
business
Changes to guidance and
standards in affected sectors will
change the way that firms work.
Can require additional actions to
meet climate resilient standards.
Regulatory
burden on
business (+/-)
Financial and insurance sector businesses have some data sharing
requirements, but as established processes should not lead to
additional costs in the baseline scenario.
Direct impact
Requiring greater provision of data and defining
the format and granularity of this data, would
impose additional costs on firms that hold and
would need to provide this data. Affected firms
will be mostly large firms concentrated in the
financial sector.
Assessment: (-)
Increased innovation
and research The Strategy will guide research
under Horizon Europe and aims to
Impact on
adaptation Minimal impact The success of this measure significantly
depends on the level of understanding of the
292 Eurostat. Gross value added and income A*10 industry breakdowns 293 https://www.tandfonline.com/doi/full/10.1080/24724718.2019.1594567
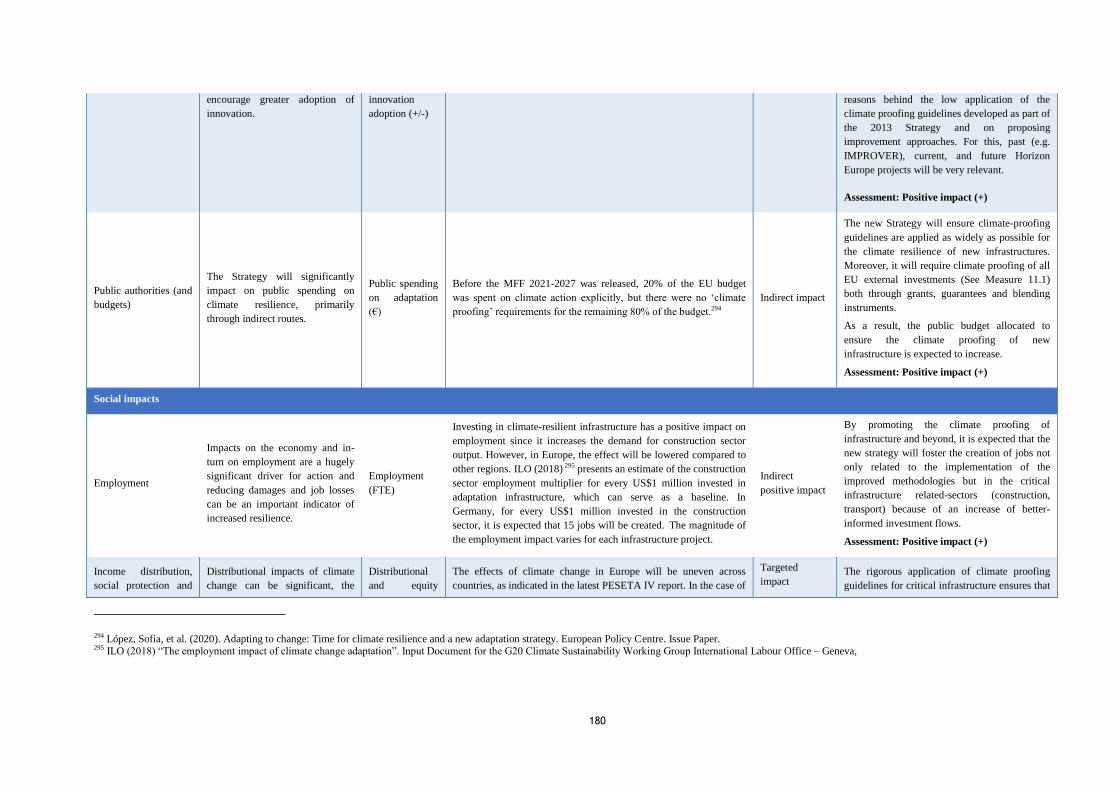
180
encourage greater adoption of
innovation. innovation
adoption (+/-) reasons behind the low application of the
climate proofing guidelines developed as part of
the 2013 Strategy and on proposing
improvement approaches. For this, past (e.g.
IMPROVER), current, and future Horizon
Europe projects will be very relevant.
Assessment: Positive impact (+)
Public authorities (and
budgets)
The Strategy will significantly
impact on public spending on
climate resilience, primarily
through indirect routes.
Public spending
on adaptation
(€)
Before the MFF 2021-2027 was released, 20% of the EU budget
was spent on climate action explicitly, but there were no ‘climate
proofing’ requirements for the remaining 80% of the budget.294 Indirect impact
The new Strategy will ensure climate-proofing
guidelines are applied as widely as possible for
the climate resilience of new infrastructures.
Moreover, it will require climate proofing of all
EU external investments (See Measure 11.1)
both through grants, guarantees and blending
instruments.
As a result, the public budget allocated to
ensure the climate proofing of new
infrastructure is expected to increase.
Assessment: Positive impact (+)
Social impacts
Employment
Impacts on the economy and in-
turn on employment are a hugely
significant driver for action and
reducing damages and job losses
can be an important indicator of
increased resilience.
Employment
(FTE)
Investing in climate-resilient infrastructure has a positive impact on
employment since it increases the demand for construction sector
output. However, in Europe, the effect will be lowered compared to
other regions. ILO (2018) 295 presents an estimate of the construction
sector employment multiplier for every US$1 million invested in
adaptation infrastructure, which can serve as a baseline. In
Germany, for every US$1 million invested in the construction
sector, it is expected that 15 jobs will be created. The magnitude of
the employment impact varies for each infrastructure project.
Indirect
positive impact
By promoting the climate proofing of
infrastructure and beyond, it is expected that the
new strategy will foster the creation of jobs not
only related to the implementation of the
improved methodologies but in the critical
infrastructure related-sectors (construction,
transport) because of an increase of better-
informed investment flows.
Assessment: Positive impact (+)
Income distribution,
social protection and
Distributional impacts of climate
change can be significant, the
Distributional
and equity
The effects of climate change in Europe will be uneven across
countries, as indicated in the latest PESETA IV report. In the case of
Targeted
impact The rigorous application of climate proofing
guidelines for critical infrastructure ensures that
294 López, Sofia, et al. (2020). Adapting to change: Time for climate resilience and a new adaptation strategy. European Policy Centre. Issue Paper. 295 ILO (2018) “The employment impact of climate change adaptation”. Input Document for the G20 Climate Sustainability Working Group International Labour Office – Geneva,
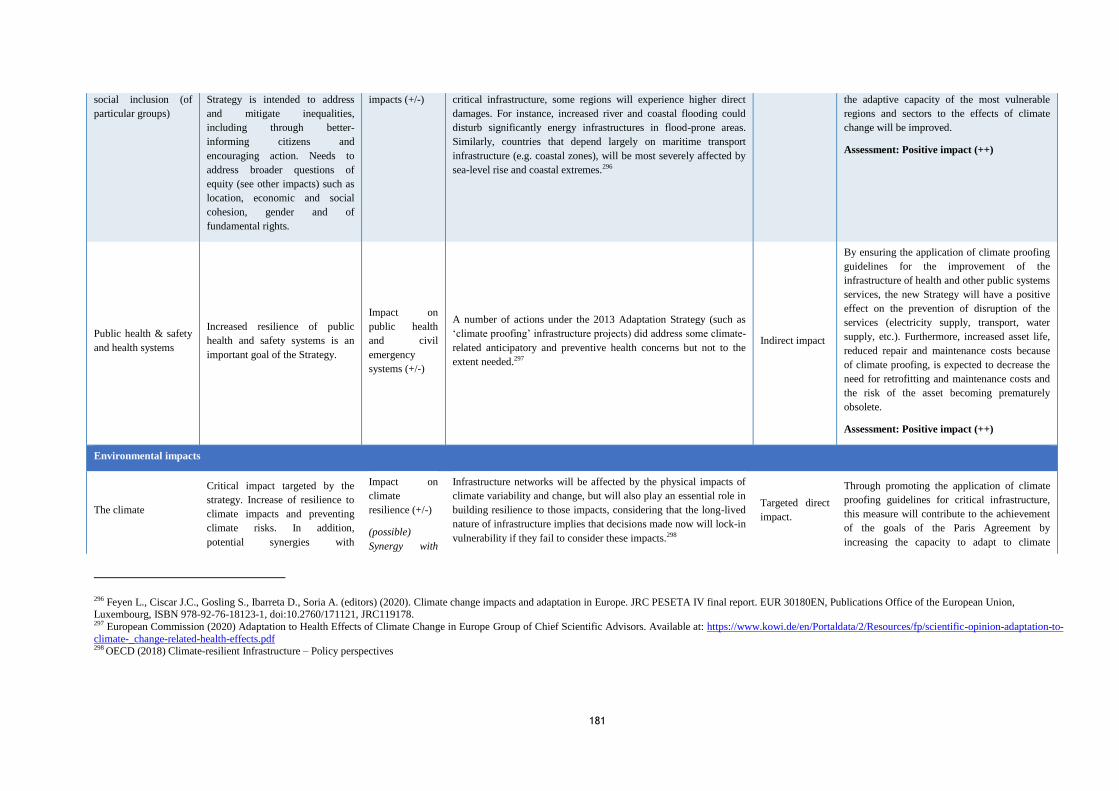
181
social inclusion (of
particular groups) Strategy is intended to address
and mitigate inequalities,
including through better-
informing citizens and
encouraging action. Needs to
address broader questions of
equity (see other impacts) such as
location, economic and social
cohesion, gender and of
fundamental rights.
impacts (+/-) critical infrastructure, some regions will experience higher direct
damages. For instance, increased river and coastal flooding could
disturb significantly energy infrastructures in flood-prone areas.
Similarly, countries that depend largely on maritime transport
infrastructure (e.g. coastal zones), will be most severely affected by
sea-level rise and coastal extremes.296
the adaptive capacity of the most vulnerable
regions and sectors to the effects of climate
change will be improved.
Assessment: Positive impact (++)
Public health & safety
and health systems
Increased resilience of public
health and safety systems is an
important goal of the Strategy.
Impact on
public health
and civil
emergency
systems (+/-)
A number of actions under the 2013 Adaptation Strategy (such as
‘climate proofing’ infrastructure projects) did address some climate-
related anticipatory and preventive health concerns but not to the
extent needed.297
Indirect impact
By ensuring the application of climate proofing
guidelines for the improvement of the
infrastructure of health and other public systems
services, the new Strategy will have a positive
effect on the prevention of disruption of the
services (electricity supply, transport, water
supply, etc.). Furthermore, increased asset life,
reduced repair and maintenance costs because
of climate proofing, is expected to decrease the
need for retrofitting and maintenance costs and
the risk of the asset becoming prematurely
obsolete.
Assessment: Positive impact (++)
Environmental impacts
The climate
Critical impact targeted by the
strategy. Increase of resilience to
climate impacts and preventing
climate risks. In addition,
potential synergies with
Impact on
climate
resilience (+/-)
(possible)
Synergy with
Infrastructure networks will be affected by the physical impacts of
climate variability and change, but will also play an essential role in
building resilience to those impacts, considering that the long-lived
nature of infrastructure implies that decisions made now will lock-in
vulnerability if they fail to consider these impacts.298
Targeted direct
impact.
Through promoting the application of climate
proofing guidelines for critical infrastructure,
this measure will contribute to the achievement
of the goals of the Paris Agreement by
increasing the capacity to adapt to climate
296 Feyen L., Ciscar J.C., Gosling S., Ibarreta D., Soria A. (editors) (2020). Climate change impacts and adaptation in Europe. JRC PESETA IV final report. EUR 30180EN, Publications Office of the European Union, Luxembourg, ISBN 978-92-76-18123-1, doi:10.2760/171121, JRC119178. 297 European Commission (2020) Adaptation to Health Effects of Climate Change in Europe Group of Chief Scientific Advisors. Available at: https://www.kowi.de/en/Portaldata/2/Resources/fp/scientific-opinion-adaptation-to-
climate-_change-related-health-effects.pdf 298 OECD (2018) Climate-resilient Infrastructure – Policy perspectives

182
mitigation may be worth
considering. climate
mitigation (+/-) Moreover, climate proofing has shown to be very relevant for
sectors with high climate mitigation potential, such as energy.299 change and confirming that investments are
consistent with a low-emissions and climate-
resilient development.
Assessment: Positive impact (++)
Quality of natural
resources/fighting
pollution (water, soil,
air, etc.)
Strategy intends to address
impacts of climate change on
natural resources, e.g. forests,
agriculture, marine environment.
Impact on
natural resource
resilience (+/-)
The quality and availability of natural resources can be improved by
climate proofing infrastructure dependent on these resources. For
instance, climate-proofed investments in the hydropower sector can
avoid unintended consequences on the availability and quality of
water resources.
Indirect impact
This measure aims to encourage climate-
proofed investments in some sectors that are
highly dependent on the use of natural resources
(e.g. energy generation). Therefore, it can be
expected that it will have a positive impact on
natural resources utilised.
Assessment: Positive impact (+)
Biodiversity, including
flora, fauna,
ecosystems and the
services they provide
and landscapes
Strategy intends to address
impacts of climate change on
biodiversity, and also to make use
of Ecosystem-based solutions.
Use of
ecosystem-
based solutions
and increased
resilience of
ecosystems (+/-
)
Some approaches to climate-resilient infrastructure, particularly the
use of natural infrastructure, can lead to biodiversity conservation,
such as NbS.300 Coastal resilience, for example, can be achieved for
substantially lower costs through restoration projects in mangroves
and salt marshes for wave reduction compared to traditional
alternatives such as breakwaters.301
Indirect impact
By raising awareness about the multiple
benefits of some approaches for climate-
resilient infrastructure such as NbS for coastal
critical infrastructure, this measure is expected
to have a positive impact on biodiversity
conservation in the areas where these
approaches are considered.
Assessment: Positive impact (+)
Some key reports in the field
European Commission (2018) Climate change adaptation of major infrastructure projects- A stock-taking of available resources to assist the
development of climate-resilient infrastructure
OECD (2018) Climate-resilient Infrastructure – Policy perspectives
OECD (2019) Good Governance for Critical Infrastructure Resilience
299 Feyen L., Ciscar J.C., Gosling S., Ibarreta D., Soria A. (editors) (2020). Climate change impacts and adaptation in Europe. JRC PESETA IV final report. EUR 30180EN, Publications Office of the European Union,
Luxembourg, ISBN 978-92-76-18123-1, doi:10.2760/171121, JRC119178. 300 OECD (2018) Climate-resilient Infrastructure – Policy perspectives 301 European Commission (2020) Nature-based solutions for flood mitigation and coastal resilience
183
CLARITY – Climate Resilience Project’s Documentation. https://clarity-h2020.eu/
EU-CIRCLE Project’s Documentation: (https://www.eu-circle.eu /)
RESISTO Project’s Documentation (http://www.resistoproject.eu/)
INFRASTRESS Project’s Documentation (https://www.infrastress.eu/)
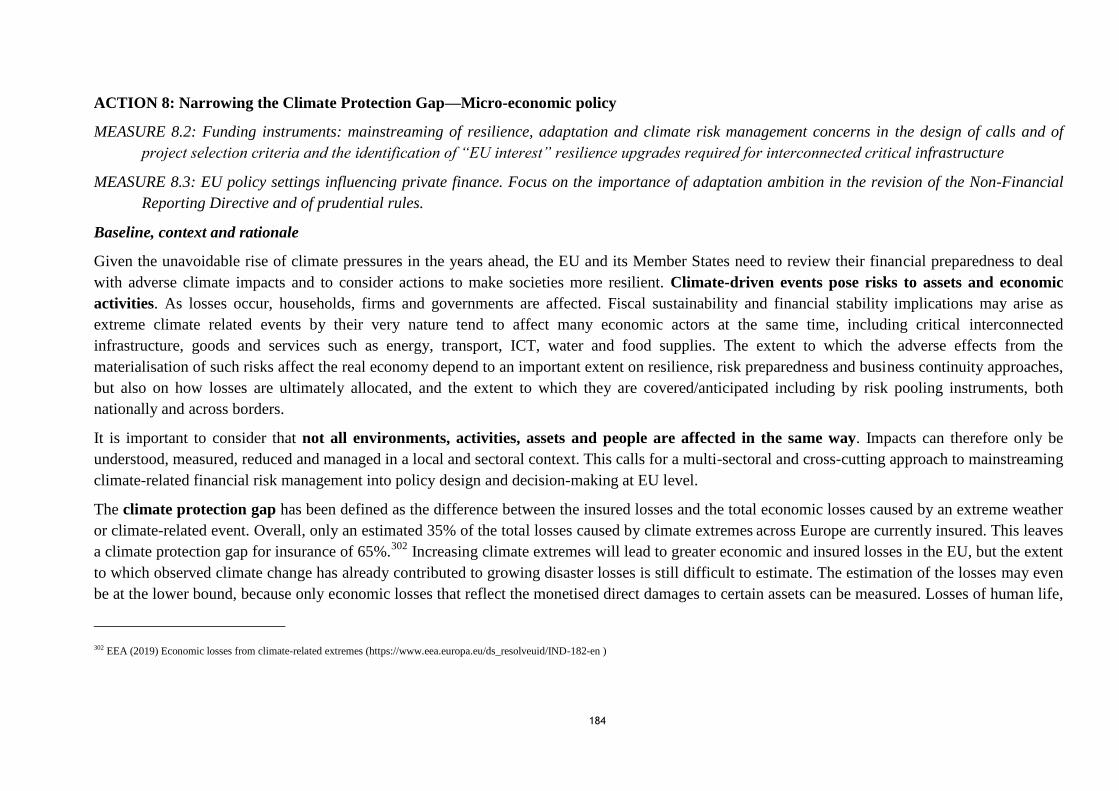
184
ACTION 8: Narrowing the Climate Protection Gap—Micro-economic policy
MEASURE 8.2: Funding instruments: mainstreaming of resilience, adaptation and climate risk management concerns in the design of calls and of
project selection criteria and the identification of “EU interest” resilience upgrades required for interconnected critical infrastructure
MEASURE 8.3: EU policy settings influencing private finance. Focus on the importance of adaptation ambition in the revision of the Non-Financial
Reporting Directive and of prudential rules.
Baseline, context and rationale
Given the unavoidable rise of climate pressures in the years ahead, the EU and its Member States need to review their financial preparedness to deal
with adverse climate impacts and to consider actions to make societies more resilient. Climate-driven events pose risks to assets and economic
activities. As losses occur, households, firms and governments are affected. Fiscal sustainability and financial stability implications may arise as
extreme climate related events by their very nature tend to affect many economic actors at the same time, including critical interconnected
infrastructure, goods and services such as energy, transport, ICT, water and food supplies. The extent to which the adverse effects from the
materialisation of such risks affect the real economy depend to an important extent on resilience, risk preparedness and business continuity approaches,
but also on how losses are ultimately allocated, and the extent to which they are covered/anticipated including by risk pooling instruments, both
nationally and across borders.
It is important to consider that not all environments, activities, assets and people are affected in the same way. Impacts can therefore only be
understood, measured, reduced and managed in a local and sectoral context. This calls for a multi-sectoral and cross-cutting approach to mainstreaming
climate-related financial risk management into policy design and decision-making at EU level.
The climate protection gap has been defined as the difference between the insured losses and the total economic losses caused by an extreme weather
or climate-related event. Overall, only an estimated 35% of the total losses caused by climate extremes across Europe are currently insured. This leaves
a climate protection gap for insurance of 65%.302
Increasing climate extremes will lead to greater economic and insured losses in the EU, but the extent
to which observed climate change has already contributed to growing disaster losses is still difficult to estimate. The estimation of the losses may even
be at the lower bound, because only economic losses that reflect the monetised direct damages to certain assets can be measured. Losses of human life,
302 EEA (2019) Economic losses from climate-related extremes (https://www.eea.europa.eu/ds_resolveuid/IND-182-en )
185
economic losses as a consequence of non-damage-related business interruption, cultural heritage or ecosystem services are not part of the estimations
that are currently available.303
This does not mean, however, that all losses should be insured.
Reliable data on insured and uninsured economic losses is necessary to inform the European and national macro-economic, microeconomic, climate
adaptation and climate-related disaster risk resilience policies and to support climate adaptation efforts of all parts of society from individual citizens to
the EU level. To allow comparability and aggregation of data from various sources, a set of common definitions and standards is needed.
In general, insurance markets are still influenced to a significant degree by national contract laws. Regarding data governance, currently no EU
mandate exists for climate-related loss data collection and sharing, open access to economic value of assets and replacement costs and to number of
natural disaster insurance policies held by Europeans. EU action to promote this will therefore mainly be indirect. Direct actions to narrow the climate
protection gap do exist through, for example, the uptake of conditions in the EU funding instruments, such as ‘build back better criteria’ that enhance
resilience and risk preparedness. In the 2013 Adaptation Strategy, no clear baseline was developed of how the market for insurance and other financial
products for resilient investment would develop as a result of the above activities. Still, the measures to narrow the climate protection gap can build on
existing EU tools and legislation, which is explained in the objectives and actions.
The importance for narrowing the climate protection gap has been articulated in the interviews and stakeholder workshops. Stakeholders mentioned
that measures go beyond insurance, as it also includes public policy solutions, such as the collection of disaster loss data as well as supporting and de-
risking the creation of public-private partnerships that could develop climate risk-transfer mechanisms for increasing climate risks.
The OPC results (Q13) show that, although respondents know where to find information about the climate-related risks they are exposed to (~20%),
they are less aware of where to find financial support to invest in resilience (~11%). From Q15-16 of the OPC it follows that respondents are of the
opinion that citizens at large and local authorities should have easier access to climate risk data for both historical and projected damages to people,
nature and assets (compare ~20% for citizens and local authorities to ~12.5% for prospective private and public buyers and commercial owners).
Description of measure
At a micro-economic level, the European Commission lacks a systematic approach to assess, reduce, and optimally transfer climate-related disaster risk
in its activities. Climate impacts are cross cutting across all sectors and consequently all EU policy areas. To adequately address mainstreaming of
303 EIOPA (2019). Discussion paper on the protection gap for natural catastrophes. Retrieved from: https://www.eiopa.europa.eu/content/discussion-paper-protection-gap-natural-catastrophes_en
186
resilience, adaptation, and risk management, the EU needs tools that go beyond a supportive and facilitative role, as is the case with the climate
adaptation, and disaster risk management policy frameworks. There needs to be particular consideration for the role of EU legislation to close the
climate protection gap, including:
The identification of economic losses and socio-economic vulnerability;
The identification of vulnerable infrastructure critical to the EU economy;
Systematically mainstreaming climate adaptation in investment decision processes;
Developing adaptation focused risk transfer and natural disaster insurance solutions across EU Member States.
In accordance with policy coherence principles (i.e. ensure that regulation and funding take into account disaster risk before creating new exposure;
reduce existing risk by building up resilience; manage residual financial risk), this will be implemented as follows:
Funding instruments: mainstreaming of resilience, adaptation and climate risk management concerns in the design of calls and of project selection
criteria and the identification of “EU interest” resilience upgrades required for interconnected critical infrastructure
EU policy settings influencing private finance. Already in planned Renewed Sustainable Finance Strategy but stress on the importance of
adaptation ambition in the revision of the Non-Financial Reporting Directive and of prudential rules.
Objectives and actions.
These two measures will specifically:
Update Better Regulation guidelines and in particular its risk management toolbox;
Rollout increased risk literacy training programme;
Broaden sustainability and climate proofing and the promote enhanced insurance penetration;
Identify vulnerability hotspots in interconnected critical infrastructure and enhance early warning systems, business continuity measures and
sectoral enhance insurance penetration;
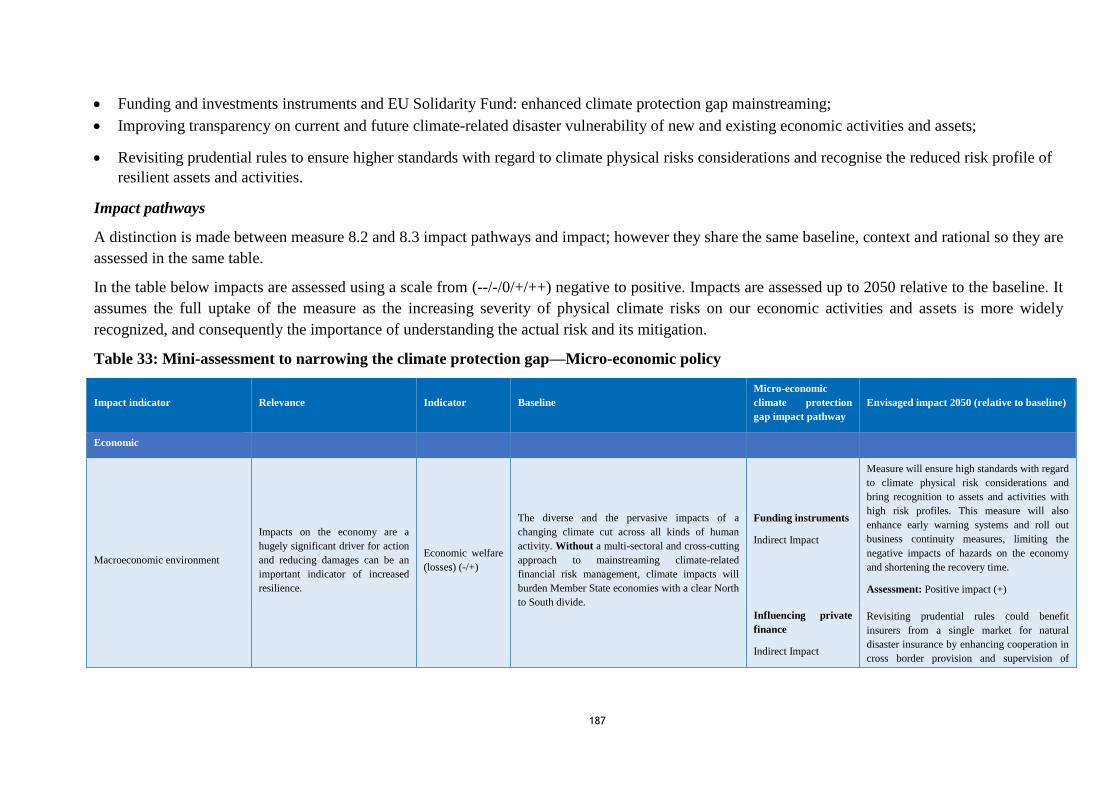
187
Funding and investments instruments and EU Solidarity Fund: enhanced climate protection gap mainstreaming;
Improving transparency on current and future climate-related disaster vulnerability of new and existing economic activities and assets;
Revisiting prudential rules to ensure higher standards with regard to climate physical risks considerations and recognise the reduced risk profile of
resilient assets and activities.
Impact pathways
A distinction is made between measure 8.2 and 8.3 impact pathways and impact; however they share the same baseline, context and rational so they are
assessed in the same table.
In the table below impacts are assessed using a scale from (--/-/0/+/++) negative to positive. Impacts are assessed up to 2050 relative to the baseline. It
assumes the full uptake of the measure as the increasing severity of physical climate risks on our economic activities and assets is more widely
recognized, and consequently the importance of understanding the actual risk and its mitigation.
Table 33: Mini-assessment to narrowing the climate protection gap—Micro-economic policy
Impact indicator Relevance Indicator Baseline Micro-economic
climate protection
gap impact pathway Envisaged impact 2050 (relative to baseline)
Economic
Macroeconomic environment
Impacts on the economy are a
hugely significant driver for action
and reducing damages can be an
important indicator of increased
resilience.
Economic welfare
(losses) (-/+)
The diverse and the pervasive impacts of a
changing climate cut across all kinds of human
activity. Without a multi-sectoral and cross-cutting
approach to mainstreaming climate-related
financial risk management, climate impacts will
burden Member State economies with a clear North
to South divide.
Funding instruments
Indirect Impact
Measure will ensure high standards with regard
to climate physical risk considerations and
bring recognition to assets and activities with
high risk profiles. This measure will also
enhance early warning systems and roll out
business continuity measures, limiting the
negative impacts of hazards on the economy
and shortening the recovery time.
Assessment: Positive impact (+)
Influencing private
finance
Indirect Impact
Revisiting prudential rules could benefit
insurers from a single market for natural
disaster insurance by enhancing cooperation in
cross border provision and supervision of
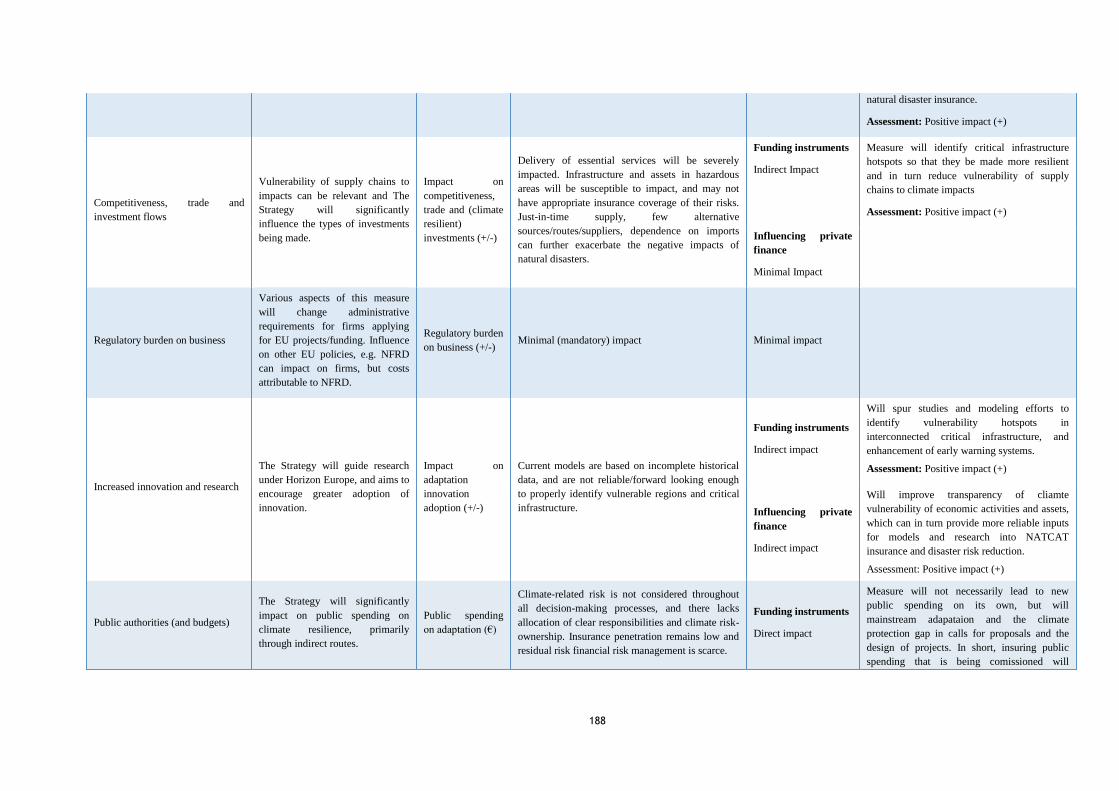
188
natural disaster insurance.
Assessment: Positive impact (+)
Competitiveness, trade and
investment flows
Vulnerability of supply chains to
impacts can be relevant and The
Strategy will significantly
influence the types of investments
being made.
Impact on
competitiveness,
trade and (climate
resilient)
investments (+/-)
Delivery of essential services will be severely
impacted. Infrastructure and assets in hazardous
areas will be susceptible to impact, and may not
have appropriate insurance coverage of their risks.
Just-in-time supply, few alternative
sources/routes/suppliers, dependence on imports
can further exacerbate the negative impacts of
natural disasters.
Funding instruments
Indirect Impact
Influencing private
finance
Minimal Impact
Measure will identify critical infrastructure
hotspots so that they be made more resilient
and in turn reduce vulnerability of supply
chains to climate impacts
Assessment: Positive impact (+)
Regulatory burden on business
Various aspects of this measure
will change administrative
requirements for firms applying
for EU projects/funding. Influence
on other EU policies, e.g. NFRD
can impact on firms, but costs
attributable to NFRD.
Regulatory burden
on business (+/-) Minimal (mandatory) impact Minimal impact
Increased innovation and research
The Strategy will guide research
under Horizon Europe, and aims to
encourage greater adoption of
innovation.
Impact on
adaptation
innovation
adoption (+/-)
Current models are based on incomplete historical
data, and are not reliable/forward looking enough
to properly identify vulnerable regions and critical
infrastructure.
Funding instruments
Indirect impact
Will spur studies and modeling efforts to
identify vulnerability hotspots in
interconnected critical infrastructure, and
enhancement of early warning systems.
Assessment: Positive impact (+)
Influencing private
finance
Indirect impact
Will improve transparency of cliamte
vulnerability of economic activities and assets,
which can in turn provide more reliable inputs
for models and research into NATCAT
insurance and disaster risk reduction.
Assessment: Positive impact (+)
Public authorities (and budgets)
The Strategy will significantly
impact on public spending on
climate resilience, primarily
through indirect routes.
Public spending
on adaptation (€)
Climate-related risk is not considered throughout
all decision-making processes, and there lacks
allocation of clear responsibilities and climate risk-
ownership. Insurance penetration remains low and
residual risk financial risk management is scarce.
Funding instruments
Direct impact
Measure will not necessarily lead to new
public spending on its own, but will
mainstream adapataion and the climate
protection gap in calls for proposals and the
design of projects. In short, insuring public
spending that is being comissioned will
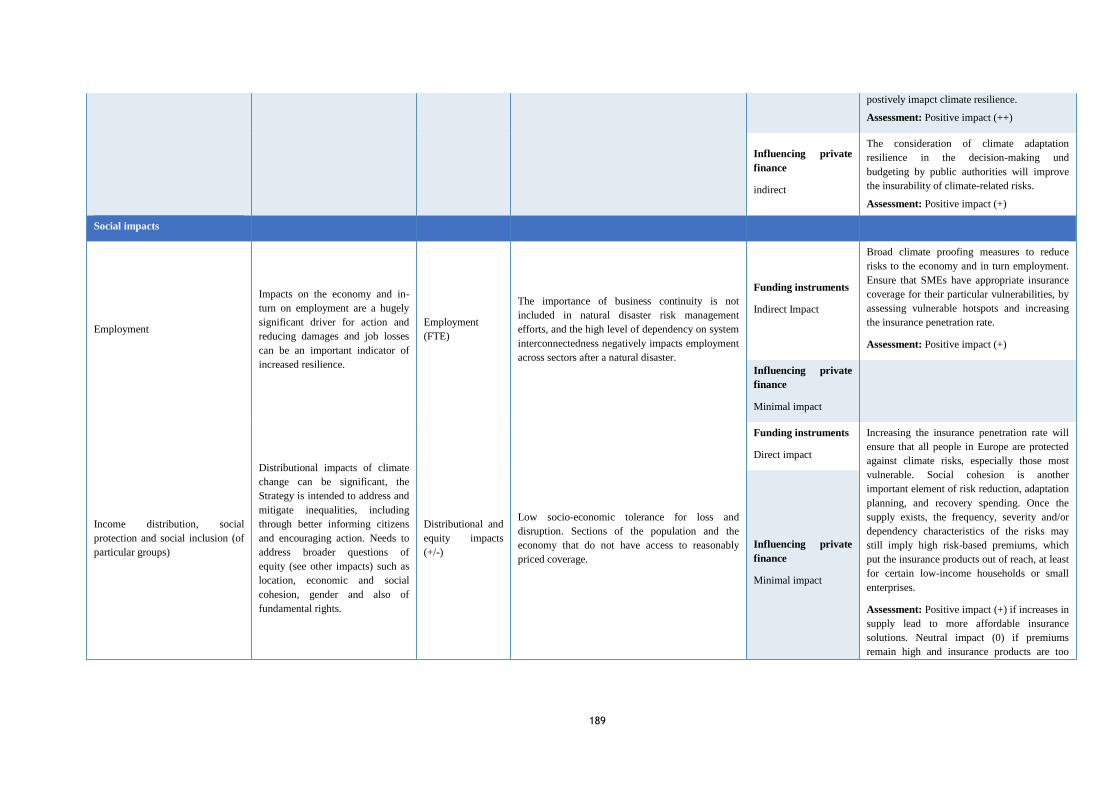
189
postively imapct climate resilience.
Assessment: Positive impact (++)
Influencing private
finance
indirect
The consideration of climate adaptation
resilience in the decision-making und
budgeting by public authorities will improve
the insurability of climate-related risks.
Assessment: Positive impact (+)
Social impacts
Employment
Impacts on the economy and in-
turn on employment are a hugely
significant driver for action and
reducing damages and job losses
can be an important indicator of
increased resilience.
Employment
(FTE)
The importance of business continuity is not
included in natural disaster risk management
efforts, and the high level of dependency on system
interconnectedness negatively impacts employment
across sectors after a natural disaster.
Funding instruments
Indirect Impact
Broad climate proofing measures to reduce
risks to the economy and in turn employment.
Ensure that SMEs have appropriate insurance
coverage for their particular vulnerabilities, by
assessing vulnerable hotspots and increasing
the insurance penetration rate.
Assessment: Positive impact (+)
Influencing private
finance
Minimal impact
Income distribution, social
protection and social inclusion (of
particular groups)
Distributional impacts of climate
change can be significant, the
Strategy is intended to address and
mitigate inequalities, including
through better informing citizens
and encouraging action. Needs to
address broader questions of
equity (see other impacts) such as
location, economic and social
cohesion, gender and also of
fundamental rights.
Distributional and
equity impacts
(+/-)
Low socio-economic tolerance for loss and
disruption. Sections of the population and the
economy that do not have access to reasonably
priced coverage.
Funding instruments
Direct impact
Increasing the insurance penetration rate will
ensure that all people in Europe are protected
against climate risks, especially those most
vulnerable. Social cohesion is another
important element of risk reduction, adaptation
planning, and recovery spending. Once the
supply exists, the frequency, severity and/or
dependency characteristics of the risks may
still imply high risk-based premiums, which
put the insurance products out of reach, at least
for certain low-income households or small
enterprises.
Assessment: Positive impact (+) if increases in
supply lead to more affordable insurance
solutions. Neutral impact (0) if premiums
remain high and insurance products are too
Influencing private
finance
Minimal impact
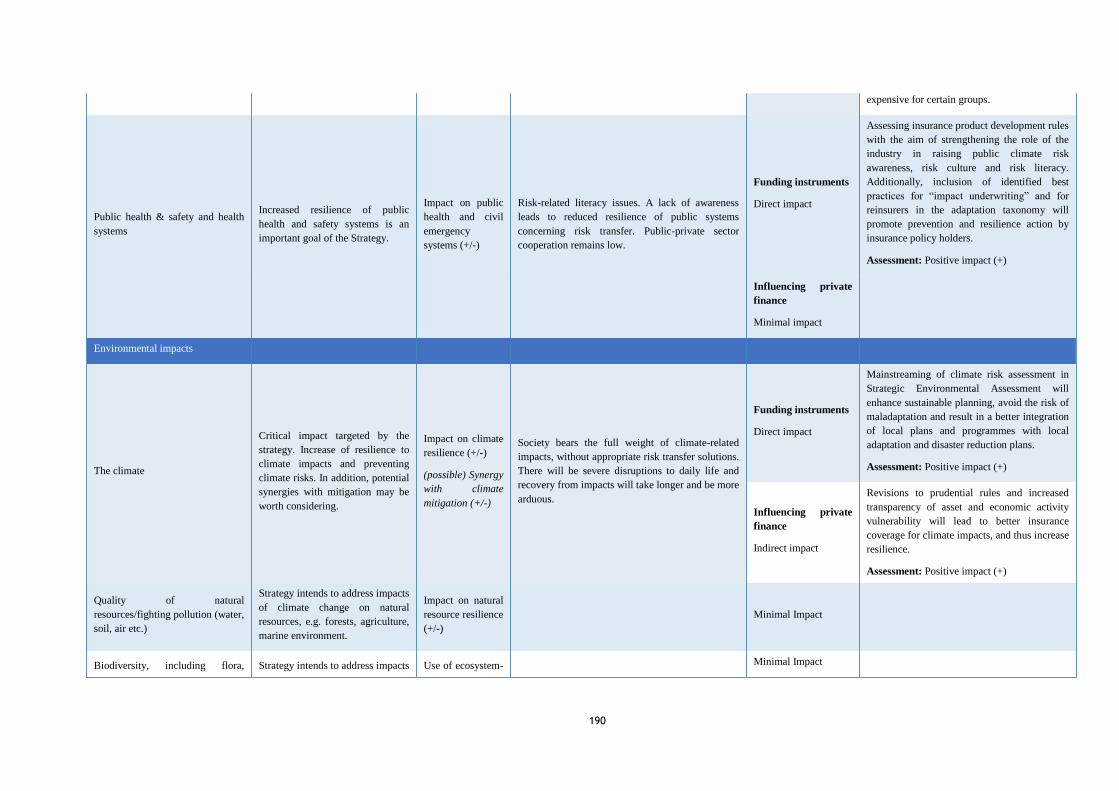
190
expensive for certain groups.
Public health & safety and health
systems
Increased resilience of public
health and safety systems is an
important goal of the Strategy.
Impact on public
health and civil
emergency
systems (+/-)
Risk-related literacy issues. A lack of awareness
leads to reduced resilience of public systems
concerning risk transfer. Public-private sector
cooperation remains low.
Funding instruments
Direct impact
Assessing insurance product development rules with the aim of strengthening the role of the
industry in raising public climate risk
awareness, risk culture and risk literacy.
Additionally, inclusion of identified best
practices for “impact underwriting” and for
reinsurers in the adaptation taxonomy will
promote prevention and resilience action by
insurance policy holders.
Assessment: Positive impact (+)
Influencing private
finance
Minimal impact
Environmental impacts
The climate
Critical impact targeted by the
strategy. Increase of resilience to
climate impacts and preventing
climate risks. In addition, potential
synergies with mitigation may be
worth considering.
Impact on climate
resilience (+/-)
(possible) Synergy
with climate
mitigation (+/-)
Society bears the full weight of climate-related
impacts, without appropriate risk transfer solutions.
There will be severe disruptions to daily life and
recovery from impacts will take longer and be more
arduous.
Funding instruments
Direct impact
Mainstreaming of climate risk assessment in
Strategic Environmental Assessment will
enhance sustainable planning, avoid the risk of
maladaptation and result in a better integration
of local plans and programmes with local
adaptation and disaster reduction plans.
Assessment: Positive impact (+)
Influencing private
finance
Indirect impact
Revisions to prudential rules and increased
transparency of asset and economic activity
vulnerability will lead to better insurance
coverage for climate impacts, and thus increase
resilience.
Assessment: Positive impact (+)
Quality of natural
resources/fighting pollution (water,
soil, air etc.)
Strategy intends to address impacts
of climate change on natural
resources, e.g. forests, agriculture,
marine environment.
Impact on natural
resource resilience
(+/-) Minimal Impact
Biodiversity, including flora, Strategy intends to address impacts Use of ecosystem- Minimal Impact
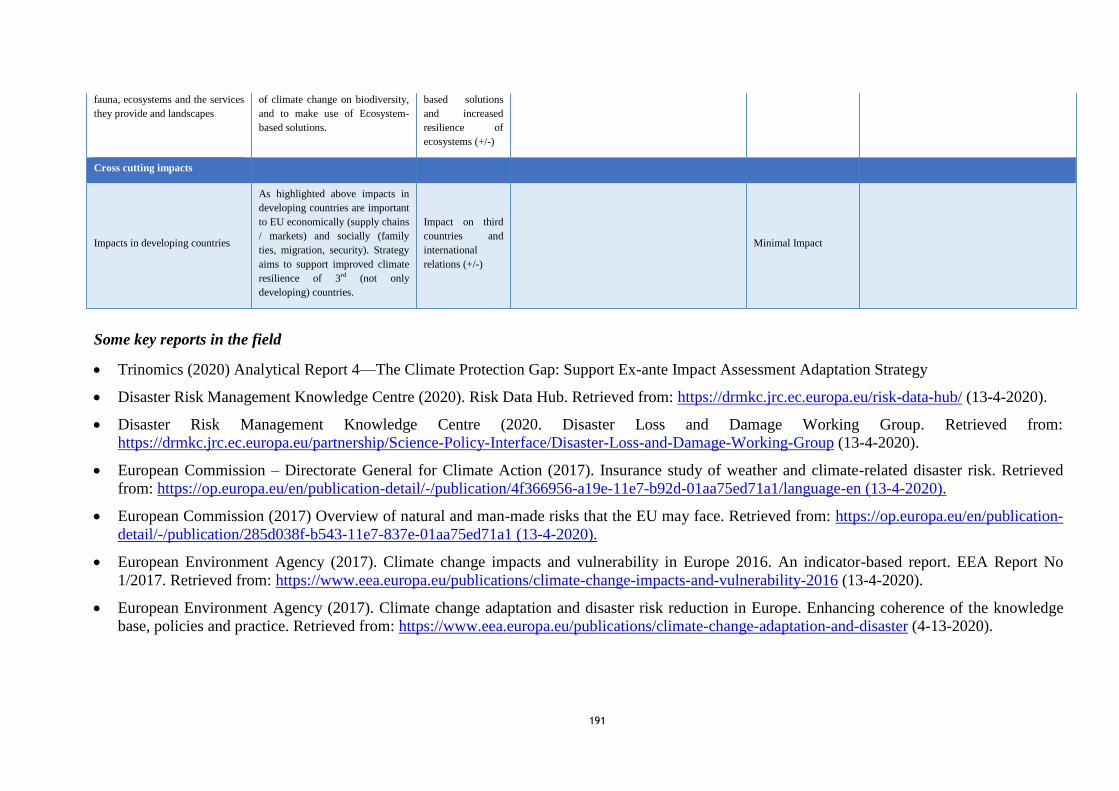
191
fauna, ecosystems and the services
they provide and landscapes of climate change on biodiversity,
and to make use of Ecosystem-
based solutions.
based solutions
and increased
resilience of
ecosystems (+/-)
Cross cutting impacts
Impacts in developing countries
As highlighted above impacts in
developing countries are important
to EU economically (supply chains
/ markets) and socially (family
ties, migration, security). Strategy
aims to support improved climate
resilience of 3rd (not only
developing) countries.
Impact on third
countries and
international
relations (+/-)
Minimal Impact
Some key reports in the field
Trinomics (2020) Analytical Report 4—The Climate Protection Gap: Support Ex-ante Impact Assessment Adaptation Strategy
Disaster Risk Management Knowledge Centre (2020). Risk Data Hub. Retrieved from: https://drmkc.jrc.ec.europa.eu/risk-data-hub/ (13-4-2020).
Disaster Risk Management Knowledge Centre (2020. Disaster Loss and Damage Working Group. Retrieved from:
https://drmkc.jrc.ec.europa.eu/partnership/Science-Policy-Interface/Disaster-Loss-and-Damage-Working-Group (13-4-2020).
European Commission – Directorate General for Climate Action (2017). Insurance study of weather and climate-related disaster risk. Retrieved
from: https://op.europa.eu/en/publication-detail/-/publication/4f366956-a19e-11e7-b92d-01aa75ed71a1/language-en (13-4-2020).
European Commission (2017) Overview of natural and man-made risks that the EU may face. Retrieved from: https://op.europa.eu/en/publication-
detail/-/publication/285d038f-b543-11e7-837e-01aa75ed71a1 (13-4-2020).
European Environment Agency (2017). Climate change impacts and vulnerability in Europe 2016. An indicator-based report. EEA Report No
1/2017. Retrieved from: https://www.eea.europa.eu/publications/climate-change-impacts-and-vulnerability-2016 (13-4-2020).
European Environment Agency (2017). Climate change adaptation and disaster risk reduction in Europe. Enhancing coherence of the knowledge
base, policies and practice. Retrieved from: https://www.eea.europa.eu/publications/climate-change-adaptation-and-disaster (4-13-2020).
192
European Insurance and Occupational Pension Authority (2019). Discussion paper on the protection gap for natural catastrophes. Retrieved from:
https://www.eiopa.europa.eu/content/discussion-paper-protection-gap-natural-catastrophes_en (13-4-2020).
European Insurance and Occupational Pension Authority (2019). Opinion on Sustainability within Solvency II. Retrieved from:
https://www.eiopa.europa.eu/content/opinion-sustainability-within-solvency-ii_en (13-4-2020).
European Technical Expert Group on Sustainable Finance (2020). Financing a sustainable European Economy. Taxonomy Report: Technical
Annex.
Geneva Association (2018). Climate Change and the Insurance Industry: Taking Action as Risk Managers and Investors. Perspectives from C-level
executives in the insurance industry. Retrieved from: https://www.genevaassociation.org/research-topics/extreme-events-and-climate-risk/climate-
change-and-insurance-industry-taking-action (13-4-2020).
Hudson et al. (2019). An assessment of best practices of extreme weather insurance and directions for a more resilient society. Retrieved from:
https://www.tandfonline.com/doi/full/10.1080/17477891.2019.1608148 (13-4-2020).
Insurance Europe (2019). Annual report 2017-2018. Retrieved from: https://insuranceeurope.eu/annual-report-2017-2018 (13-4-2020)
Insurance Europe (2015). National natcat insurance schemes. Retrieved from: https://www.insuranceeurope.eu/natural-catastrophes
IPCC (2012). Managing the Risks of Extreme Events and Disasters to Advance Climate
Change Adaptation. A Special Report of Working Groups I and II of the Intergovernmental Panel on Climate Change [Field, C.B., V. Barros, T.F.
Stocker, D. Qin, D.J. Dokken, K.L. Ebi, M.D. Mastrandrea, K.J. Mach, G.-K. Plattner, S.K. Allen, M. Tignor, and P.M. Midgley (eds.)].
Cambridge University Press, Cambridge, UK, and New York, NY, USA, 582 pp.
Jarzabkowski, P., K. Chalkias, D. Clarke, E. Iyahen, D. Stadtmueller & A. Zwick. (2019). Insurance for climate adaptation: Opportunities and
limitations.” Rotterdam and Washington, DC. Available online at www.gca.org.
Joint Research Centre (2018). Mapping of risk web-platforms and risk data: collection of good practices. Retrieved from:
https://doi.org/10.2760/93157 (13-4-2020).
OECD DAC Statistics (2020). Insurance indicators. Retrieved from: https://stats.oecd.org/Index.aspx?DatasetCode=INSIND (13-4-2020)
OECD DAC (2016). Financial Management of Flood Risk. Retrieved from: https://www.oecd.org/daf/fin/insurance/OECD-Financial-Management-
of-Flood-Risk.pdf (13-4-2020)
193
Munich Climate Insurance Initiative (2019). Closing the protection gap. Retrieved from: http://www.climate-insurance.org/about/who-we-are/ (13-
4-2020).
Surminski & Eldridge (2015). Flood insurance in England: an assessment of the current and newly proposed insurance scheme in the context of
rising flood risk. Journal of Flood Risk Management. Retrieved from: http://eprints.lse.ac.uk/66256/ (4-14-2020).
ACTION 9: Supporting partner countries in their efforts on climate change, disaster preparedness, and comprehensive risk management
approaches
MEASURE 9.1: Support upgrade and implementation of NDCs and NAPs , by providing technical and financial assistance dedicated to: building
capacity at national and sub-national level; assessing exposure and vulnerabilities; developing adaptation plans in line with national priorities
and vulnerabilities; promoting climate-proof structural governance reforms; implementing monitoring and evaluation schemes to assess
progress towards climate change resilience; enhancing coherence with national and local disaster risk reduction strategies and environmental
sustainability strategies; promoting nature-based solutions and ecosystem-based approaches, especially in coastal areas.
MEASURE 9.4: Work with leading institutions in Africa, the Caribbean and the Pacific to support regional climate change adaptation and disaster
risk management approaches building on ongoing initiatives such as the Africa Adaptation Initiative, and develop regional adaptation plans
and action.
Baseline, context and rationale
National climate and adaptation strategies often fail to consider all the impacts on climate change. For instance, a 2018 GWP analysis of 80 NDCs
(including most EU partner countries) revealed that even though water drives climate adaptation action (89 % plans) few countries include measures to
robust their water management approaches. 304
Moreover, it has been shown that National Adaptation Plans (NAPs) are typically failing to include a
broad range of stakeholders in the planning process, and greater attention needs to be given to increasing participation and coordination in the national
adaptation planning processes.305
304 GWP (2019) Addressing Water in National Adaptation Plans. Available at: https://www.gwp.org/en/About/more/news/2019/addressing-water-in-national-adaptation-plans/ 305 Woodruff, Sierra C., and Patrick Regan. "Quality of national adaptation plans and opportunities for improvement." Mitigation and Adaptation Strategies for Global Change 24.1 (2019): 53-71.

194
To solve these gaps, the EU can support partner countries to adapt to the effects of climate change impacts at all levels: not only in terms of providing
resources and prioritisation, but also in terms of improving effectiveness of action and support. 306
Accordingly, the European Green Deal contains four
actions under the objective of positioning the EU as a global leader, including continue to lead the international climate and biodiversity negotiations,
further strengthening the international policy framework, and undertaking bilateral efforts to induce partners to act and to ensure comparability of
action and policies.307
As, a according to the 2018 Evaluation, the 2013 Strategy failed to address broader international climate adaptation issues, the
new Strategy will increase the support to partner countries seeking to use potential for cooperation between the EU and other economies in this regard.
Description of measures
The following actions will be implemented to supporting partner countries in their efforts on climate change, disaster preparedness, and comprehensive
risk management approaches
Objectives and actions:
Support upgrade and implementation of NDCs and NAPs by providing technical and financial assistance dedicated to: building capacity at national and
sub-national level, developing adaptation plans in line with national priorities and vulnerabilities; supporting climate-proof structural governance
reforms; implementing monitoring and evaluation schemes to assess progress towards climate change resilience; enhancing coherence with national
and local disaster risk reduction strategies and environmental sustainability strategies; promoting nature-based solutions and ecosystem-based
approaches, especially in coastal areas. Work with leading institutions in Africa, the Caribbean, the Pacific and Asia sub-regions to promote and
support climate change adaptation and disaster risk management approaches, and develop regional adaptation plans and action: Propose regional
programmes in Africa (e.g. with AU or regional economic communities) to develop regional adaptation and DRR strategies.
Impact pathways
In the table below impacts are assessed using a scale from (--/-/0/+/++) negative to positive. Impacts are assessed up to 2050 relative to the baseline. It
assumes the full uptake of the measure as the increasing severity of physical climate risks is globally more widely recognized, and consequently the
relevance of support to countries beyond EU borders that are prone to the effects of climate change.
306 European Commission (2020) Adaptation to Climate Change Blueprint for a new, more ambitious EU strategy, available at - https://ec.europa.eu/clima/sites/clima/files/consultations/docs/0037/blueprint_en.pdf 307 European Commission (2019) The European Green Deal, section 3 ‘The EU as a Global Leader’.

195
Table 34: Mini-assessment on supporting partner countries
Impact indicator Relevance Indicator Baseline Supporting
partner countries Envisaged impact 2050 (relative to baseline)
Economic
Macroeconomic environment
Impacts on the economy are a hugely
significant driver for action and reducing
damages can be an important indicator of
increased resilience.
Economic welfare (losses) (-
/+)
The findings of PESETA IV
confirm a more comprehensive
analysis performed in PESETA
III, which showed that
international spill-over effects
could increase the internal EU
welfare loss by approximately
20%.
Indirect impact
The new Strategy will give support to partner
countries to develop coherent and effective climate
adaptation and disaster risk reduction strategies.
Therefore, it is expected that the impacts of
international spill-over effects on the EU’s macro-
economic environment, will be reduced to some
extent by this measure
Assessment: Positive impact (+)
Competitiveness, trade and
investment flows
Vulnerability of supply chains to impacts
can be relevant and The Strategy will
significantly influence the types of
investments being made.
Impact on competitiveness,
trade and (climate resilient)
investments (+/-) Minimal Impact Minimal impact (for EU)
Regulatory burden on business Measure will not significantly affect EU
firms costs.
Regulatory burden on
business (+/-) Minimal Impact Minimal Impact
Increased innovation and research The Strategy will guide research under
Horizon Europe and aims to encourage
greater adoption of innovation.
Impact on adaptation
innovation adoption (+/-) Minimal Impact Minimal impact (for EU)
Public authorities (and budgets) The Strategy will significantly impact on
public spending on climate resilience,
primarily through indirect routes.
Public spending on
adaptation (€) Minimal Impact Minimal impact (for EU)
Social impacts
Employment
Impacts on the economy and in-turn on
employment are a hugely significant
driver for action and reducing damages
and job losses can be an important
indicator of increased resilience.
Employment (FTE) Minimal impact Minimal impact (for EU)
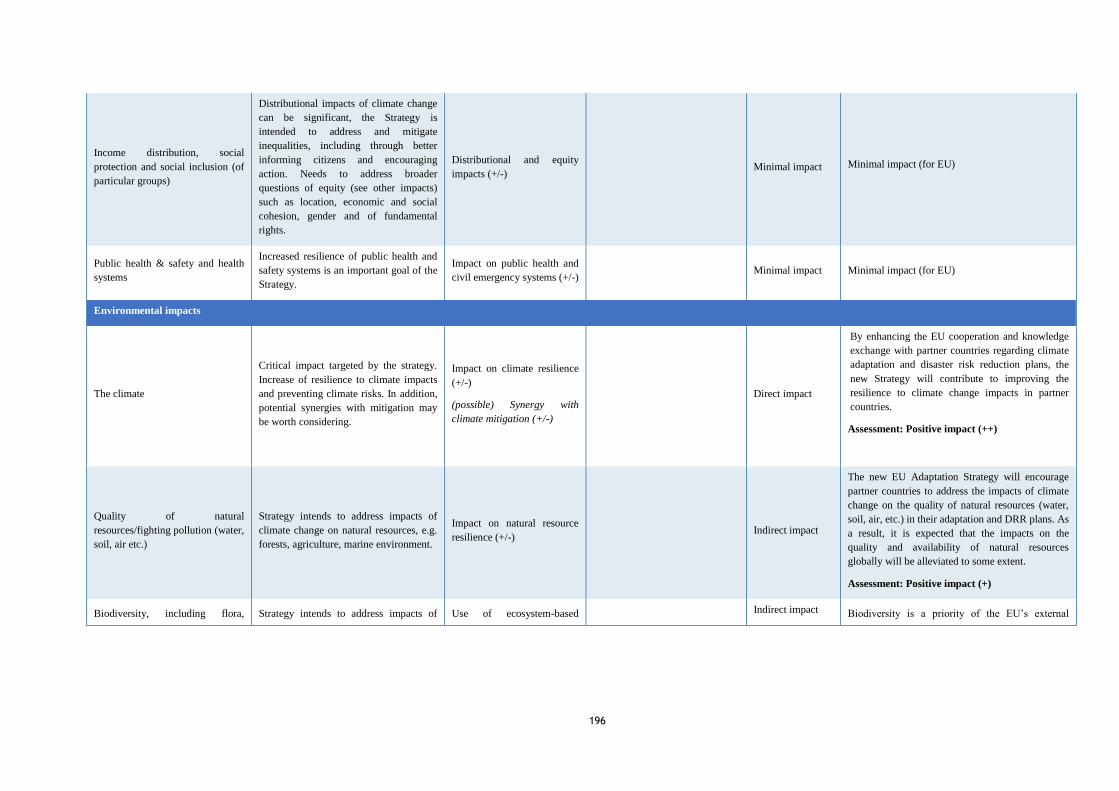
196
Income distribution, social
protection and social inclusion (of
particular groups)
Distributional impacts of climate change
can be significant, the Strategy is
intended to address and mitigate
inequalities, including through better
informing citizens and encouraging
action. Needs to address broader
questions of equity (see other impacts)
such as location, economic and social
cohesion, gender and of fundamental
rights.
Distributional and equity
impacts (+/-) Minimal impact Minimal impact (for EU)
Public health & safety and health
systems
Increased resilience of public health and
safety systems is an important goal of the
Strategy.
Impact on public health and
civil emergency systems (+/-) Minimal impact Minimal impact (for EU)
Environmental impacts
The climate
Critical impact targeted by the strategy.
Increase of resilience to climate impacts
and preventing climate risks. In addition,
potential synergies with mitigation may
be worth considering.
Impact on climate resilience
(+/-)
(possible) Synergy with
climate mitigation (+/-)
Direct impact
By enhancing the EU cooperation and knowledge
exchange with partner countries regarding climate
adaptation and disaster risk reduction plans, the
new Strategy will contribute to improving the
resilience to climate change impacts in partner
countries.
Assessment: Positive impact (++)
Quality of natural
resources/fighting pollution (water,
soil, air etc.)
Strategy intends to address impacts of
climate change on natural resources, e.g.
forests, agriculture, marine environment.
Impact on natural resource
resilience (+/-) Indirect impact
The new EU Adaptation Strategy will encourage
partner countries to address the impacts of climate
change on the quality of natural resources (water,
soil, air, etc.) in their adaptation and DRR plans. As
a result, it is expected that the impacts on the
quality and availability of natural resources
globally will be alleviated to some extent.
Assessment: Positive impact (+)
Biodiversity, including flora, Strategy intends to address impacts of Use of ecosystem-based Indirect impact Biodiversity is a priority of the EU’s external
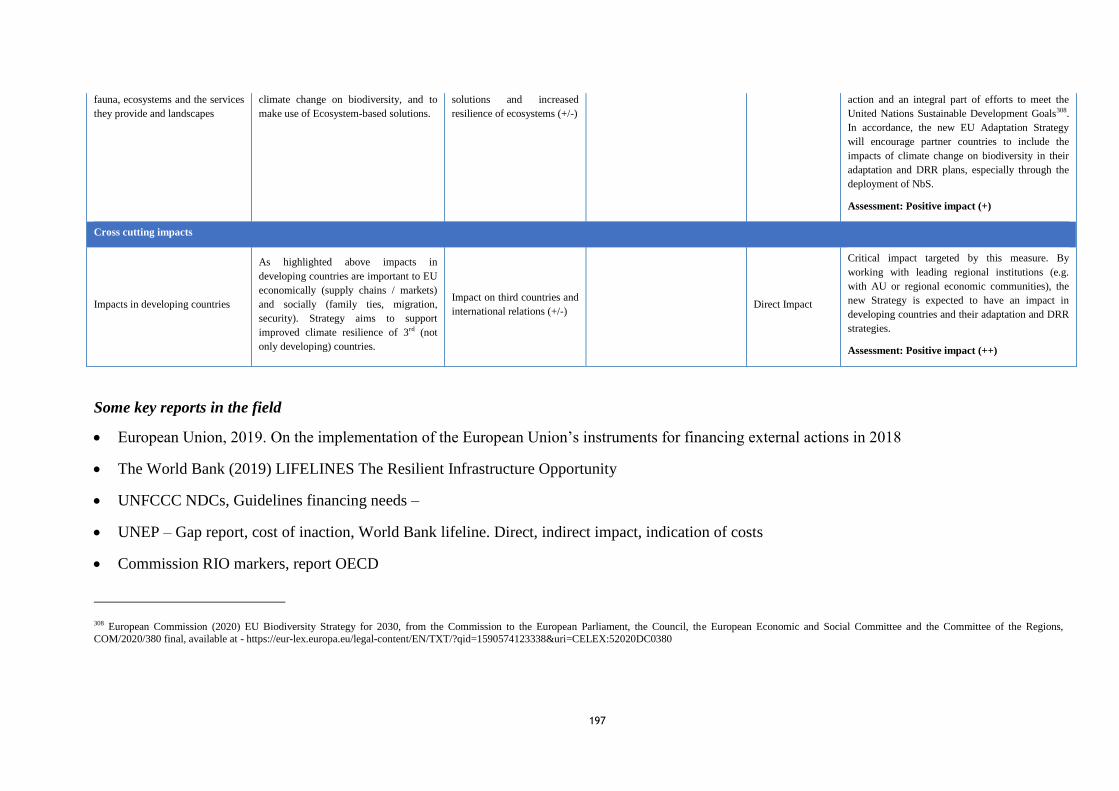
197
fauna, ecosystems and the services
they provide and landscapes climate change on biodiversity, and to
make use of Ecosystem-based solutions. solutions and increased
resilience of ecosystems (+/-) action and an integral part of efforts to meet the
United Nations Sustainable Development Goals308.
In accordance, the new EU Adaptation Strategy
will encourage partner countries to include the
impacts of climate change on biodiversity in their
adaptation and DRR plans, especially through the
deployment of NbS.
Assessment: Positive impact (+)
Cross cutting impacts
Impacts in developing countries
As highlighted above impacts in
developing countries are important to EU
economically (supply chains / markets)
and socially (family ties, migration,
security). Strategy aims to support
improved climate resilience of 3rd (not
only developing) countries.
Impact on third countries and
international relations (+/-) Direct Impact
Critical impact targeted by this measure. By
working with leading regional institutions (e.g.
with AU or regional economic communities), the
new Strategy is expected to have an impact in
developing countries and their adaptation and DRR
strategies.
Assessment: Positive impact (++)
Some key reports in the field
European Union, 2019. On the implementation of the European Union’s instruments for financing external actions in 2018
The World Bank (2019) LIFELINES The Resilient Infrastructure Opportunity
UNFCCC NDCs, Guidelines financing needs –
UNEP – Gap report, cost of inaction, World Bank lifeline. Direct, indirect impact, indication of costs
Commission RIO markers, report OECD
308 European Commission (2020) EU Biodiversity Strategy for 2030, from the Commission to the European Parliament, the Council, the European Economic and Social Committee and the Committee of the Regions,
COM/2020/380 final, available at - https://eur-lex.europa.eu/legal-content/EN/TXT/?qid=1590574123338&uri=CELEX:52020DC0380
198
ACTION 10: Scaling up international adaptation finance and disaster risk financing, including by unlocking innovative finance and
mobilising the private sector.
MEASURE 10.3: Use the External Investment Plan and the European Fund for Sustainable Development + amongst other innovative financial
instruments to leverage private sector finance for climate change adaptation, in line with the EU Sustainable Finance Taxonomy, and promote
the engagement of partner countries in the International Platform for Sustainable Finance.
MEASURE 10.5: Use the External Investment Plan and the European Fund for Sustainable Development + amongst other innovative financial
instruments to leverage private sector finance for climate change adaptation, in line with the EU Sustainable Finance Taxonomy, and promote
the engagement of partner countries in the International Platform for Sustainable Finance.
Baseline, context and rationale
On average, adaptation finance has accounted for about 5% of climate finance since 2015/2016 and, though it rose to US$30 billion in 2017/2018, still
falls far from the estimated US$230 billion annual requirement.309
310
In line with these needs, the External Investment Plan (EIP) is an EU initiative
designed to support investments into Africa and other countries by using public money to attract private investment, to foster sustainable and inclusive
economic and social development, while addressing specific socioeconomic root causes of migration. Pillar 3 of the EIP is based on key the following
building blocks:
deepening the investment climate analysis (including through technical assistance facilities such as the Structural Reform Facility for the
Eastern Partnership),
engaging in structured public-private dialogue (such as Sustainable Business for Africa – SB4A – Platform), in synergy with other tools such
as EU trade and investment policies and EU Economic Diplomacy to identify obstacles and reforms needed.
Finally, prioritised interventions to support adequate reforms, capacity building of public and private sector, value addition and
entrepreneurship, can address investors’ perceived risks.
309 EDPM 2019 Boosting EU Climate Finance: Mitigate More Without Neglecting Adaptation In Poorer Countries
310 CPI. 2019. Global landscape of climate finance 2019. Climate Policy Initiative
199
As a domestic reference, InvestEU (EUR 10.5 billion budget provision), will be the key EU instrument to crowd in private capital to support
investments in policy areas essential for achieving the European Green Deal objectives: including renewable energy, energy efficiency, decarbonised
energy infrastructure or research and innovation in green technologies. Today, in the context of the green recovery for the climate and environmental
proofing of infrastructure investments, Member States are encouraged to apply the guidance from the Commission established under the InvestEU
Regulation. For the climate and environmental proofing of other types of investment than infrastructure, Member States are encouraged to apply
climate proofing as laid down in the guidance from the Commission on sustainability proofing under the InvestEU Regulation.311
At the international level, the International Platform for Sustainable Finance (IPSF) is confirmed by 14 members that together represent 50% of global
GHG emissions, 50% of the world population and 45% of the global GDP.312
The ultimate objective of the IPSF is twofold: to scale up the mobilisation
of private capital towards environmentally sustainable finance to promote integrated markets for environmentally sustainable finance.
In the OPC conducted for this Assessment, 57% of respondents strongly agreed that financial support for adaptation to climate change is insufficient,
and 53% strongly agreed that businesses and the financial sector are not appropriately involved in adaptation efforts.
Objectives and actions:
Use the External Investment Plan (EIP) and the EFTA
(EFSD) to leverage private sector finance for climate change adaptation, in line with the EU Sustainable Finance Taxonomy
Promote the engagement of partner countries in the International Platform for Sustainable Finance (IPSF)
Require climate proofing of all EU external investments, including through grants, guarantees and blending instruments
Adapt/translate the guidance on sustainability proofing for InvestEU (including the three pillars on climate proofing, environmental proofing,
and social proofing) for all external investments.
311 European Commission (2020) Guidance to Member States – Recovery and Resilience Plans Staff working Document. Available at: https://ec.europa.eu/info/sites/info/files/3_en_document_travail_service_part1_v3_en.pdf 312 European Commission (2020) International platform on sustainable finance.
Available at: https://ec.europa.eu/info/sites/info/files/business_economy_euro/banking_and_finance/documents/international-platform-sustainable-finance-factsheet_en.pdf
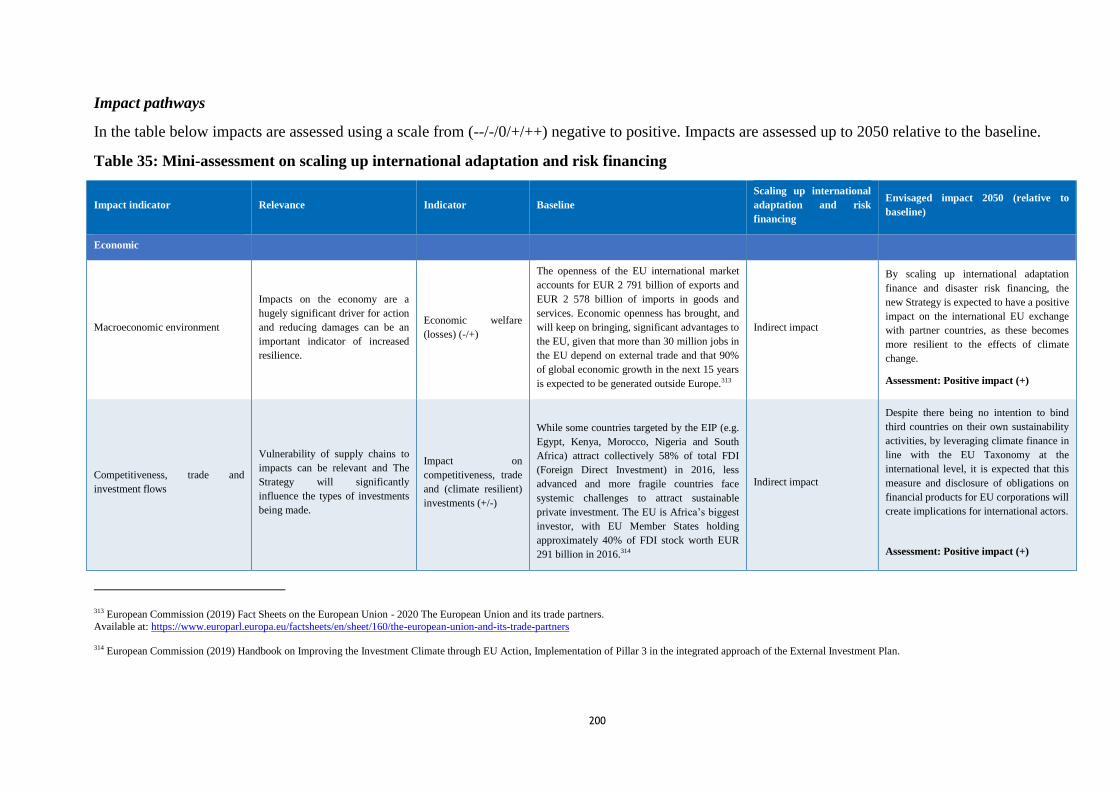
200
Impact pathways
In the table below impacts are assessed using a scale from (--/-/0/+/++) negative to positive. Impacts are assessed up to 2050 relative to the baseline.
Table 35: Mini-assessment on scaling up international adaptation and risk financing
Impact indicator Relevance Indicator Baseline Scaling up international
adaptation and risk
financing
Envisaged impact 2050 (relative to
baseline)
Economic
Macroeconomic environment
Impacts on the economy are a
hugely significant driver for action
and reducing damages can be an
important indicator of increased
resilience.
Economic welfare
(losses) (-/+)
The openness of the EU international market
accounts for EUR 2 791 billion of exports and
EUR 2 578 billion of imports in goods and
services. Economic openness has brought, and
will keep on bringing, significant advantages to
the EU, given that more than 30 million jobs in
the EU depend on external trade and that 90%
of global economic growth in the next 15 years
is expected to be generated outside Europe.313
Indirect impact
By scaling up international adaptation
finance and disaster risk financing, the
new Strategy is expected to have a positive
impact on the international EU exchange
with partner countries, as these becomes
more resilient to the effects of climate
change.
Assessment: Positive impact (+)
Competitiveness, trade and
investment flows
Vulnerability of supply chains to
impacts can be relevant and The
Strategy will significantly
influence the types of investments
being made.
Impact on
competitiveness, trade
and (climate resilient)
investments (+/-)
While some countries targeted by the EIP (e.g.
Egypt, Kenya, Morocco, Nigeria and South
Africa) attract collectively 58% of total FDI
(Foreign Direct Investment) in 2016, less
advanced and more fragile countries face
systemic challenges to attract sustainable
private investment. The EU is Africa’s biggest
investor, with EU Member States holding
approximately 40% of FDI stock worth EUR
291 billion in 2016.314
Indirect impact
Despite there being no intention to bind
third countries on their own sustainability
activities, by leveraging climate finance in
line with the EU Taxonomy at the
international level, it is expected that this
measure and disclosure of obligations on
financial products for EU corporations will
create implications for international actors.
Assessment: Positive impact (+)
313 European Commission (2019) Fact Sheets on the European Union - 2020 The European Union and its trade partners.
Available at: https://www.europarl.europa.eu/factsheets/en/sheet/160/the-european-union-and-its-trade-partners
314 European Commission (2019) Handbook on Improving the Investment Climate through EU Action, Implementation of Pillar 3 in the integrated approach of the External Investment Plan.
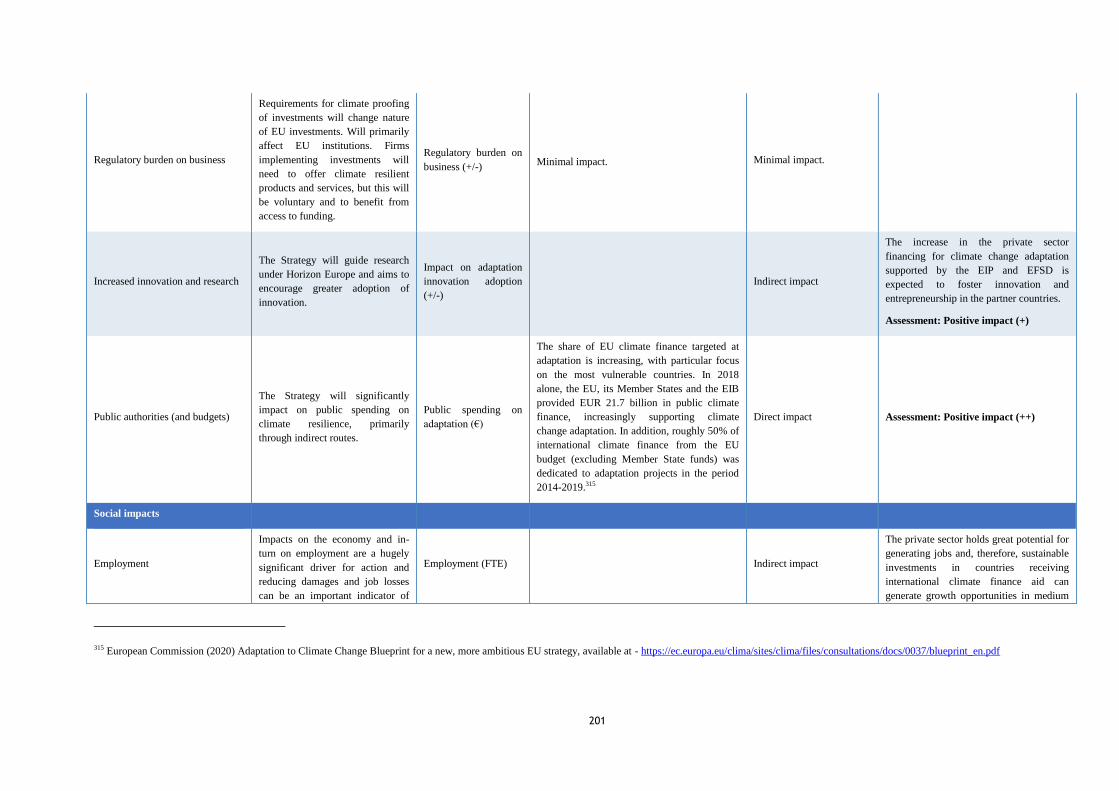
201
Regulatory burden on business
Requirements for climate proofing
of investments will change nature
of EU investments. Will primarily
affect EU institutions. Firms
implementing investments will
need to offer climate resilient
products and services, but this will
be voluntary and to benefit from
access to funding.
Regulatory burden on
business (+/-) Minimal impact. Minimal impact.
Increased innovation and research
The Strategy will guide research
under Horizon Europe and aims to
encourage greater adoption of
innovation.
Impact on adaptation
innovation adoption
(+/-) Indirect impact
The increase in the private sector
financing for climate change adaptation
supported by the EIP and EFSD is
expected to foster innovation and
entrepreneurship in the partner countries.
Assessment: Positive impact (+)
Public authorities (and budgets)
The Strategy will significantly
impact on public spending on
climate resilience, primarily
through indirect routes.
Public spending on
adaptation (€)
The share of EU climate finance targeted at
adaptation is increasing, with particular focus
on the most vulnerable countries. In 2018
alone, the EU, its Member States and the EIB
provided EUR 21.7 billion in public climate
finance, increasingly supporting climate
change adaptation. In addition, roughly 50% of
international climate finance from the EU
budget (excluding Member State funds) was
dedicated to adaptation projects in the period
2014-2019.315
Direct impact Assessment: Positive impact (++)
Social impacts
Employment
Impacts on the economy and in-
turn on employment are a hugely
significant driver for action and
reducing damages and job losses
can be an important indicator of
Employment (FTE) Indirect impact
The private sector holds great potential for
generating jobs and, therefore, sustainable
investments in countries receiving
international climate finance aid can
generate growth opportunities in medium
315 European Commission (2020) Adaptation to Climate Change Blueprint for a new, more ambitious EU strategy, available at - https://ec.europa.eu/clima/sites/clima/files/consultations/docs/0037/blueprint_en.pdf

202
increased resilience. and long-term.
Assessment: Positive impact (+)
Income distribution, social
protection and social inclusion (of
particular groups)
Distributional impacts of climate
change can be significant, the
Strategy is intended to address and
mitigate inequalities, including
through better informing citizens
and encouraging action. Needs to
address broader questions of
equity (see other impacts) such as
location, economic and social
cohesion, gender and of
fundamental rights.
Distributional and
equity impacts (+/-) Indirect impact Assessment: Positive impact (+)
Public health & safety and health
systems
Increased resilience of public
health and safety systems is an
important goal of the Strategy.
Impact on public
health and civil
emergency systems
(+/-)
Minimal impact
Environmental impacts
The climate
Critical impact targeted by the
strategy. Increase of resilience to
climate impacts and preventing
climate risks. In addition, potential
synergies with mitigation may be
worth considering.
Impact on climate
resilience (+/-)
(possible) Synergy
with climate
mitigation (+/-)
Currently, only few projects of the EFSD
incorporate sustainability policy reforms as an
explicit objective.316
In the MFF (2014-2020), climate proofing was
neither defined nor widely and consistently
applied across EU funds and programmes.
Direct impact
This measure will promote the
engagement of partner countries in the
IPSF. As a result, it is expected that more
countries will join the platform, leading to
the overall increase of climate adaptation
efforts. Moreover, by the use of the EIP
and the EFSD to leverage private sector
finance, it is expected that more funded
projects incorporate climate adaptation as
key specific objective. Finally, the climate
proofing requirement of all EU
investments will increase the climate
resilience of new infrastructure abroad.
316 https://ec.europa.eu/eu-external-investment-plan/about-plan/progress_en

203
Assessment: Positive impact (++)
Quality of natural
resources/fighting pollution (water,
soil, air etc.)
Strategy intends to address impacts
of climate change on natural
resources, e.g. forests, agriculture,
marine environment.
Impact on natural
resource resilience (+/-
) Minimal impact
Biodiversity, including flora,
fauna, ecosystems and the services
they provide and landscapes
Strategy intends to address impacts
of climate change on biodiversity,
and to make use of Ecosystem-
based solutions.
Use of ecosystem-
based solutions and
increased resilience of
ecosystems (+/-)
Minimal impact
Cross cutting impacts
Impacts in developing countries
As highlighted above impacts in
developing countries are important
to EU economically (supply chains
/ markets) and socially (family
ties, migration, security). Strategy
aims to support improved climate
resilience of 3rd (not only
developing) countries.
Impact on third
countries and
international relations
(+/-)
Direct impact
This measure will promote the
engagement of partner countries in the
IPSF. As a result, it is expected that more
developing countries will join the
platform, leading to an improved exchange
and dissemination of information to
promote best practices and lessons learnt
in environmentally sustainable finance.
Assessment: Positive impact (++)
Some key reports in the field
External Investment Plan
Implementation Report of the EFSD and the EFSD Guarantee Fund
European Commission (2019) Handbook on Improving the Investment Climate through EU Action, Implementation of Pillar 3
in the integrated approach of the External Investment Plan
European Commission (2019) Strengthening the EU’s partnership with Africa.
204
European Commission (2020) International platform on sustainable finance. Available at:
https://ec.europa.eu/info/sites/info/files/business_economy_euro/banking_and_finance/documents/international-platform-sustainable-finance-
factsheet_en.pdf
EU Technical Expert Group on Sustainable Finance (2020) Taxonomy: Final report of the Technical Expert
Group on Sustainable Finance. Available at: https://ec.europa.eu/info/files/200309-sustainable-finance-teg-final-report-taxonomy_en
Navigant/Guidehouse (2019) Aligning EU budget expenditures with the objectives of the Paris Agreement
ACTION 11: Strengthening EU engagement globally and learning from adaptation frontrunners.
MEASURE 11. 5: Strengthen the production and delivery of, and access to, user-friendly and timely climate data and information (climate services), in
particular through the promotion of space based application, the use of Copernicus Climate Change Services and Emergency Management
Services in partner countries, thus building on the existing European investments in climate research, data, information and services.
Baseline, context and rationale
Copernicus is the European Union’s Earth Observation Programme, consisting of a complex set of systems that collect data from multiple sources:
earth observation satellites and in situ sensors such as ground stations, airborne and sea-borne sensors.317
To respond to the user demands, the
Copernicus Service Component is organised into six thematic services: the Atmosphere Monitoring Service, Marine Environment Monitoring Service,
Land Monitoring Service, Climate Change Service, Emergency Management Service, and Security Service. In particular, the objective of the
Copernicus Climate Change Service (C3S) is to provide knowledge-based support to mitigation and adaptation policies, while the Copernicus
Emergency Management Service (EMS) seeks to provide on-demand detailed information for selected emergencies that arise from natural or man-
made disasters anywhere in the world.
Space infrastructure and data from international partner countries are beneficial for the Copernicus programme in a variety of areas (e.g. data
processing, integration of third-party data into the Copernicus data system, data assimilation into models, and products of the Copernicus services). In
317 Climate Adapt Copernicus Climate Change Service. Available at: https://climate-adapt.eea.europa.eu/knowledge/adaptation-information/climate-
services#:~:text=Copernicus%20is%20the%20European%20Union's%20Earth%20Observation%20Programme.&text=Copernicus%20Climate%20Change%20Service%20gives,multiple%20Essential%20Climate%20Variables %20(ECV)
205
turn, partner countries benefit from the multiple advantages of using data from the Copernicus programme, including improved civil protection
responses, improved risk and vulnerability assessments, and monitoring of environmental indicators and risks and, as a result, reduced areas burnt by
wildfires, better compliance monitoring of environmental policies, and reduced damages on ecosystems, among others. Until today, the Copernicus
programme has concluded cooperation agreements with countries such as the United States, Australia, Brazil, Colombia, Chile, India, Ukraine, Serbia,
and the African Union, while other countries have shown interest to conclude additional arrangements in the future.318
The 2020 Copernicus Work Program 2020319
outlines the strategy to increase the international visibility of Copernicus, through the participation in
various fora and conferences, supported by international partners, such as GEO, CEOS, WMO, FAO, UNEP, COP, etc. The prominent position of the
European Commission, as co-chair of the Group of Earth Observation (GEO) makes it the ideal forum to expose European know-how in earth
observation and liaise with the international community to exchange expertise to turn earth observation data into actionable knowledge. According to
the plan, specific contracts would be used in order to undertake sessions, workshops, seminars performed by international partners. Besides, ahead of
the Horizon Europe Strategic Plan, the Copernicus Research and Development programme expressed its priorities and needs for the future in the
framework of Horizon Europe in the document Copernicus programme: research & development recommendations for Horizon Europe320
. Therein,
cooperation with international partners is seen as key to promoting the uptake of Copernicus globally, exploiting possibilities for integrating in-situ,
space data, and information technologies. Further, it was outlined that following the Copernicus full, free and open data policy, the Commission seeks
to facilitate access to Copernicus data and information for interested international partners, with third countries being of special interest to using
Copernicus data to jointly develop processing methods, services and/or products which serve local user needs and/or enhance the Copernicus global
product quality.
Objectives and actions:
Strengthen the production and delivery of user-friendly and timely climate information and data (climate services) in partner countries.
318 Copernicus (n.d.) International cooperation on data exchange. Available at: https://www.copernicus.eu/en/international-cooperation-area-data-exchange 319 European Commission (2019) Annex to the Commission Implementing Decision on the financing of the Copernicus programme and on the adoption of the work programme for 2020. Available at:
https://www.copernicus.eu/en/documentation/work-programmes/work-programmes 320 Copernicus Research and Development (2019) Copernicus programme: research & development recommendations for Horizon Europe. https://www.copernicus.eu/sites/default/files/inline-images/R%26D%20recommendations%20for%20HE.pdf
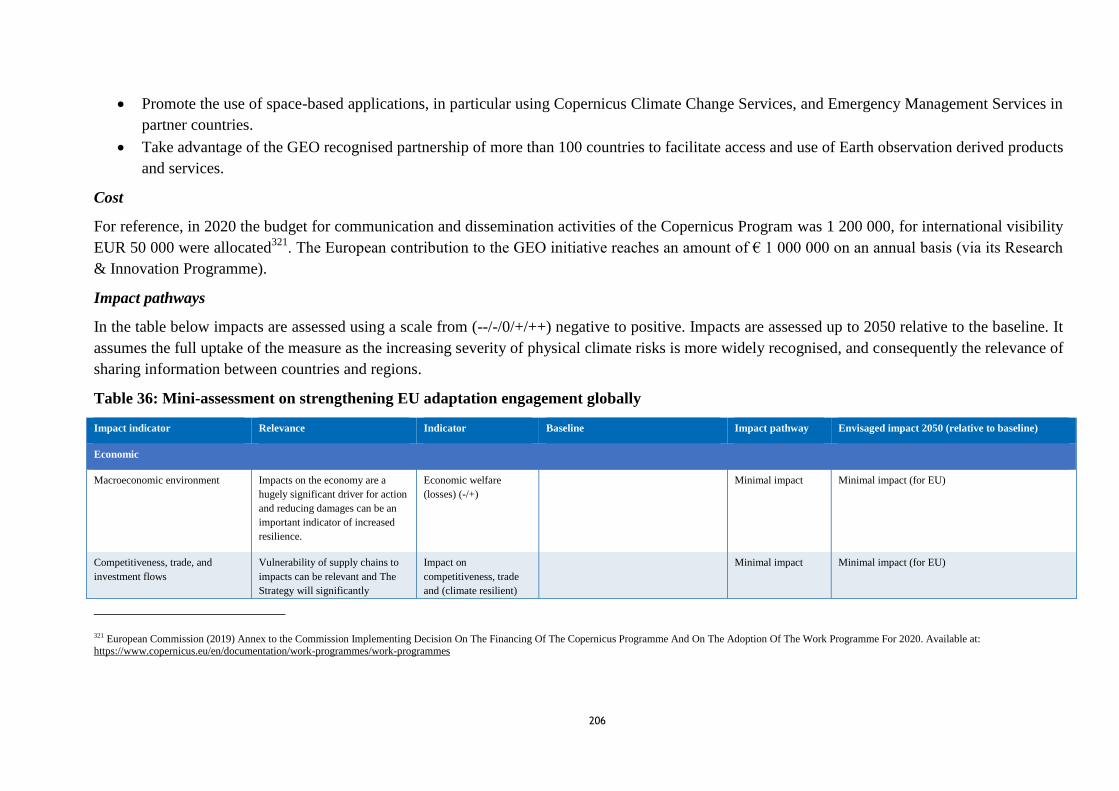
206
Promote the use of space-based applications, in particular using Copernicus Climate Change Services, and Emergency Management Services in
partner countries.
Take advantage of the GEO recognised partnership of more than 100 countries to facilitate access and use of Earth observation derived products
and services.
Cost
For reference, in 2020 the budget for communication and dissemination activities of the Copernicus Program was 1 200 000, for international visibility
EUR 50 000 were allocated321
. The European contribution to the GEO initiative reaches an amount of € 1 000 000 on an annual basis (via its Research
& Innovation Programme).
Impact pathways
In the table below impacts are assessed using a scale from (--/-/0/+/++) negative to positive. Impacts are assessed up to 2050 relative to the baseline. It
assumes the full uptake of the measure as the increasing severity of physical climate risks is more widely recognised, and consequently the relevance of
sharing information between countries and regions.
Table 36: Mini-assessment on strengthening EU adaptation engagement globally
Impact indicator Relevance Indicator Baseline Impact pathway Envisaged impact 2050 (relative to baseline)
Economic
Macroeconomic environment Impacts on the economy are a
hugely significant driver for action
and reducing damages can be an
important indicator of increased
resilience.
Economic welfare
(losses) (-/+) Minimal impact Minimal impact (for EU)
Competitiveness, trade, and
investment flows Vulnerability of supply chains to
impacts can be relevant and The
Strategy will significantly
Impact on
competitiveness, trade
and (climate resilient)
Minimal impact Minimal impact (for EU)
321 European Commission (2019) Annex to the Commission Implementing Decision On The Financing Of The Copernicus Programme And On The Adoption Of The Work Programme For 2020. Available at: https://www.copernicus.eu/en/documentation/work-programmes/work-programmes
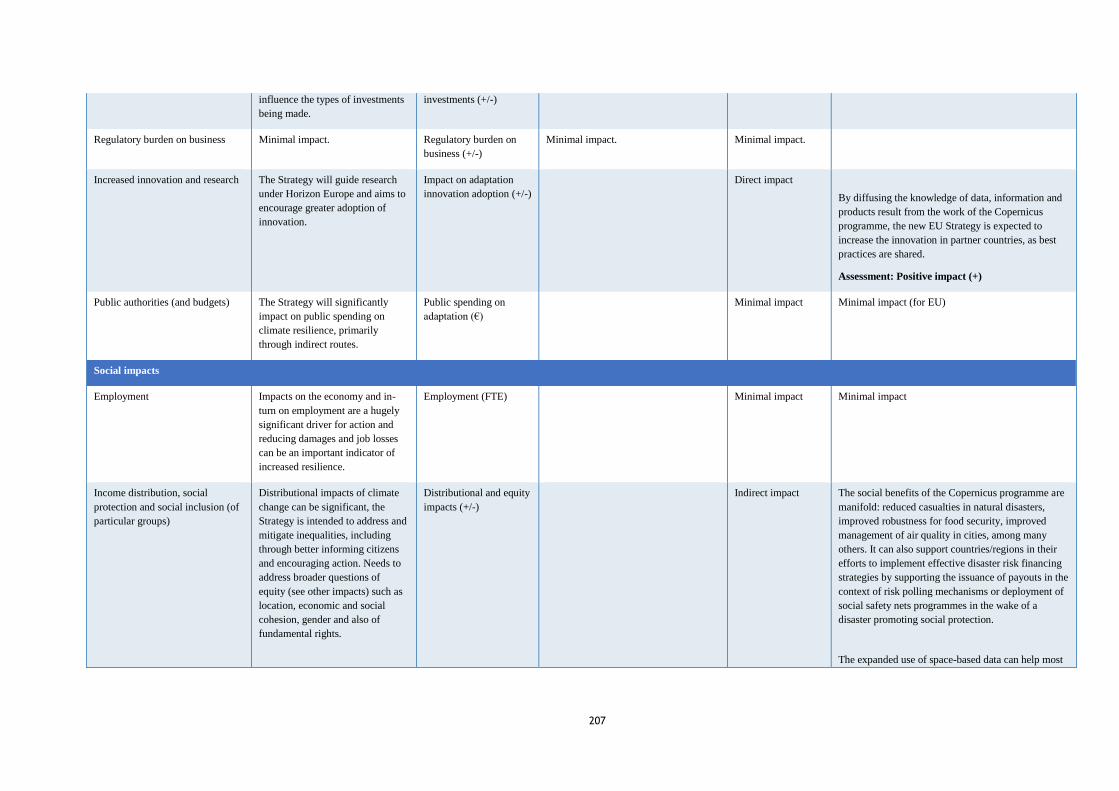
207
influence the types of investments
being made. investments (+/-)
Regulatory burden on business Minimal impact. Regulatory burden on
business (+/-)
Minimal impact. Minimal impact.
Increased innovation and research The Strategy will guide research
under Horizon Europe and aims to
encourage greater adoption of
innovation.
Impact on adaptation
innovation adoption (+/-) Direct impact
By diffusing the knowledge of data, information and
products result from the work of the Copernicus
programme, the new EU Strategy is expected to
increase the innovation in partner countries, as best
practices are shared.
Assessment: Positive impact (+)
Public authorities (and budgets) The Strategy will significantly
impact on public spending on
climate resilience, primarily
through indirect routes.
Public spending on
adaptation (€) Minimal impact Minimal impact (for EU)
Social impacts
Employment Impacts on the economy and in-
turn on employment are a hugely
significant driver for action and
reducing damages and job losses
can be an important indicator of
increased resilience.
Employment (FTE) Minimal impact Minimal impact
Income distribution, social
protection and social inclusion (of
particular groups)
Distributional impacts of climate
change can be significant, the
Strategy is intended to address and
mitigate inequalities, including
through better informing citizens
and encouraging action. Needs to
address broader questions of
equity (see other impacts) such as
location, economic and social
cohesion, gender and also of
fundamental rights.
Distributional and equity
impacts (+/-) Indirect impact The social benefits of the Copernicus programme are
manifold: reduced casualties in natural disasters,
improved robustness for food security, improved
management of air quality in cities, among many
others. It can also support countries/regions in their
efforts to implement effective disaster risk financing
strategies by supporting the issuance of payouts in the
context of risk polling mechanisms or deployment of
social safety nets programmes in the wake of a
disaster promoting social protection.
The expanded use of space-based data can help most

208
vulnerable countries and communities without
sufficient technical and financial resources to
improve their regular monitoring of urban
development (i.e. human settlements)
Assessment: Positive impact (+)
Public health & safety and health
systems Increased resilience of public
health and safety systems is an
important goal of the Strategy.
Impact on public health
and civil emergency
systems (+/-)
Copernicus provides the necessary
datasets to develop tools that can raise
awareness on environmental health (e.g.
on pollen dispersion or UV
index).
Indirect impact
By encouraging partner countries to use Copernicus
data, the new Strategy will help countries to increase
the resilience of the health systems by improving the
monitoring of air, noise pollution, and so-called
Urban Health Islands. Moreover, countries can
improve their civil protection responses and thus, the
services provided.
Assessment: Positive impact (+)
Environmental impacts
The climate Critical impact targeted by the
strategy. Increase of resilience to
climate impacts and preventing
climate risks. In addition, potential
synergies with mitigation may be
worth considering.
Impact on climate
resilience (+/-)
(possible) Synergy with
climate mitigation (+/-)
Direct impact Improved visibility and use of the Copernicus
programme internationally is expected to raise
awareness by the general public, by partner
organisations and partner organisations in and outside
Europe. By improving natural resources, management
(e.g. water efficiency for industrial production) EU
partner countries can improve their resilience to the
effects of climate change.
In the case of climate mitigation, this measure can
have a positive impact in sectors such as energy,
whereby the prediction of the availability of resources
for renewable energy production can decrease the
reliance on fossil fuels and, therefore, the reduction of
GHG,
Assessment: Positive impact (+)
Quality of natural
resources/fighting pollution (water,
soil, air etc.)
Strategy intends to address impacts
of climate change on natural
resources, e.g. forests, agriculture,
marine environment.
Impact on natural
resource resilience (+/-) Early warning and forecasts
have a great impact on the response to
natural disasters. One of Copernicus
applications is the Fire Risk Index at
short and long term, assessing the risk of
Indirect impact The increased use, production, and delivery of user-
friendly and timely climate data through space-based
applications in EU-partner countries is expected to
have multiple impacts on natural resources. Examples
include reduced areas burnt by wildfires due to
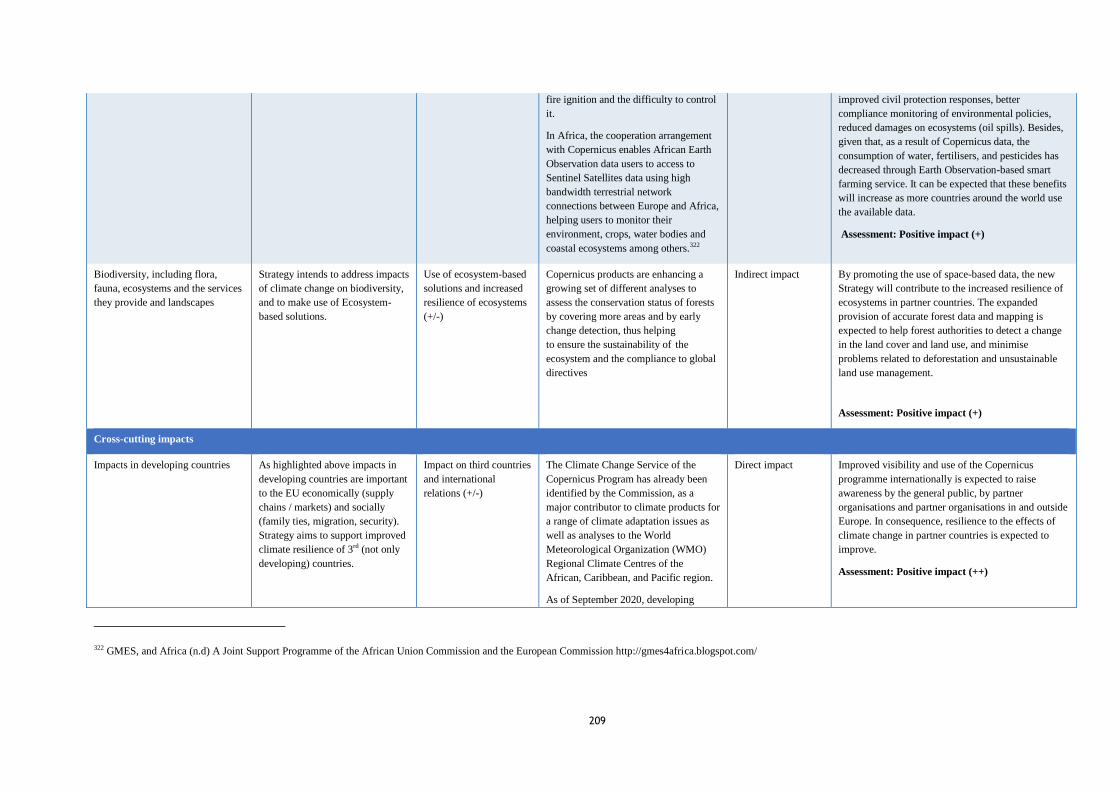
209
fire ignition and the difficulty to control
it.
In Africa, the cooperation arrangement
with Copernicus enables African Earth
Observation data users to access to
Sentinel Satellites data using high
bandwidth terrestrial network
connections between Europe and Africa,
helping users to monitor their
environment, crops, water bodies and
coastal ecosystems among others.322
improved civil protection responses, better
compliance monitoring of environmental policies,
reduced damages on ecosystems (oil spills). Besides,
given that, as a result of Copernicus data, the
consumption of water, fertilisers, and pesticides has
decreased through Earth Observation-based smart
farming service. It can be expected that these benefits
will increase as more countries around the world use
the available data.
Assessment: Positive impact (+)
Biodiversity, including flora,
fauna, ecosystems and the services
they provide and landscapes
Strategy intends to address impacts
of climate change on biodiversity,
and to make use of Ecosystem-
based solutions.
Use of ecosystem-based
solutions and increased
resilience of ecosystems
(+/-)
Copernicus products are enhancing a
growing set of different analyses to
assess the conservation status of forests
by covering more areas and by early
change detection, thus helping
to ensure the sustainability of the
ecosystem and the compliance to global
directives
Indirect impact By promoting the use of space-based data, the new
Strategy will contribute to the increased resilience of
ecosystems in partner countries. The expanded
provision of accurate forest data and mapping is
expected to help forest authorities to detect a change
in the land cover and land use, and minimise
problems related to deforestation and unsustainable
land use management.
Assessment: Positive impact (+)
Cross-cutting impacts
Impacts in developing countries As highlighted above impacts in
developing countries are important
to the EU economically (supply
chains / markets) and socially
(family ties, migration, security).
Strategy aims to support improved
climate resilience of 3rd (not only
developing) countries.
Impact on third countries
and international
relations (+/-)
The Climate Change Service of the
Copernicus Program has already been
identified by the Commission, as a
major contributor to climate products for
a range of climate adaptation issues as
well as analyses to the World
Meteorological Organization (WMO)
Regional Climate Centres of the
African, Caribbean, and Pacific region.
As of September 2020, developing
Direct impact Improved visibility and use of the Copernicus
programme internationally is expected to raise
awareness by the general public, by partner
organisations and partner organisations in and outside
Europe. In consequence, resilience to the effects of
climate change in partner countries is expected to
improve.
Assessment: Positive impact (++)
322 GMES, and Africa (n.d) A Joint Support Programme of the African Union Commission and the European Commission http://gmes4africa.blogspot.com/
210
countries that are part of the
international cooperation activities the
Copernicus Programme are United
States, Australia, Brazil, Colombia,
Chile, India, Ukraine, Serbia, and the
African Union. In February, the
Philippines announced that it would start
an Earth satellite data collaboration with
EU’s Copernicus monitor deforestation,
carbon sequestration, and coastal
changes in the Southeast Asian
nation.323
Some key reports in the field
European Commission (2019) Copernicus Market Report 2019. Prepared by PwC. Available at:
https://www.copernicus.eu/sites/default/files/2019-02/PwC_Copernicus_Market_Report_2019_PDF_version.pdf
Copernicus (2019) Copernicus Programme-Research & development. Recommendations for Horizon Europe – Working Document. Available
at: https://www.copernicus.eu/sites/default/files/inline-images/R%26D%20recommendations%20for%20HE.pdf
European Commission (2019) Annex to the Commission Implementing Decision On The Financing Of The Copernicus Programme And On
The Adoption Of The Work Programme For 2020. Available at: https://www.copernicus.eu/en/documentation/work-programmes/work-
programmes
Group on Earth Observation (2021) Highlights Report 2020. Available at: https://www.geohighlightsreport2020.org/
323 Mongabay (2020). Press release. Philippines turns to EU’s Copernicus in Earth satellite data collaboration. Available at: https://news.mongabay.com/2020/02/philippines-turns-to-eus-copernicus-in-earth-satellite-data- collaboration/
211
ACTION 12: Adaptation Solutions / Horizon Europe Mission on adaptation to Climate Change, including Societal Transformation
MEASURE 12.1: Implement the Horizon Europe Mission on Adaptation to Climate Change, including Societal Transformation with the objectives of
preparing Europe, accelerating the transition, and building deep resilience.
Baseline, context and rationale
Horizon Europe is the EU’s funding programme for research and innovation, which will run from 2021 to 2027 with a budget of ~€95 billion. As part
of Horizon Europe, the Mission on Adaptation to Climate Change will support adaptation by connecting citizens with science and public policy. It was
chosen to help maximise the impact of the EU’s support to research and innovation with a focus on solutions and preparedness for the impacts of
climate change. The mission seeks societal transformation through behavioural changes and addressing vulnerable communities. It has a mission board
of 15 experts tasked with identifying one or more specific missions for implementation under Horizon Europe. In September 2020, the Mission board
presented their proposals to the European Commission in the report A Climate Resilient Europe: Prepare Europe for climate disruptions and
accelerate the transformation to a climate-resilient and just Europe by 2030.
Description of measure
The outputs of the Horizon Europe Mission align with the Adaptation Strategy, and the Strategy in turn can be used to implement the targets set out in
the mission. There are three main objectives of the mission, with the ultimate goal to accelerate the transition to a climate prepared, more resilient, and
fair Europe.
Objectives and actions
The first objective of the mission aims by 2030 to prepare Europe to deal with climate disruptions. It seeks to do so by:
Fostering a better understanding of climate risk exposure by providing accesses to fast track climate risk assessments and strengthening existing
early warning systems;
Facilitating the adoption of climate risk management and community-based emergency plans;
Ensuring that community infrastructure is safe and essential services operable and assessable under critical conditions.

212
The mission also seeks to accelerate the transition to a climate resilient future. It has targeted support for 200 European communities and regions
accelerate such a transition, and will:
Design vision with objectives, and build consensus around transformative social change enshrined in a community resilience contract;
Co-create adaptation pathways, and define possible courses of policy and innovation actions to deliver on the vision, resulting in a portfolio
brief for action;
Create favourable conditions for societal transformations
Co-design and test actionable solutions, and share learning within and across the communities and regions.
A third objective of the mission is to build deep resilience, scaling up multiplicative actionable solutions to build resilience in a systemic approach.
This involves:
Creating impact at scale, building of resilience in single regions and communities focusing on key community systems;
Creating cross-border value, building of resilience and shared value creation across cross-border health systems and services, cross border
natural and cultural heritage, cross-border knowledge and innovation, and cross border business and value chains;
Fostering systemic and citizen-centred co-evaluation, measuring progress made assessing what has been accomplished and communicating the
progress and outcomes;
Cost
[Final Mission budget to be inserted when decision taken]
Impact pathways
In the table below impacts are assessed using a scale from (--/-/0/+/++) negative to positive. Impacts are assessed up to 2050 relative to the baseline. It
assumes the full uptake of the measure as the increasing severity of physical climate risks is more widely recognised, and consequently the relevance of
Europe being prepared and innovations required to build deep resilience.
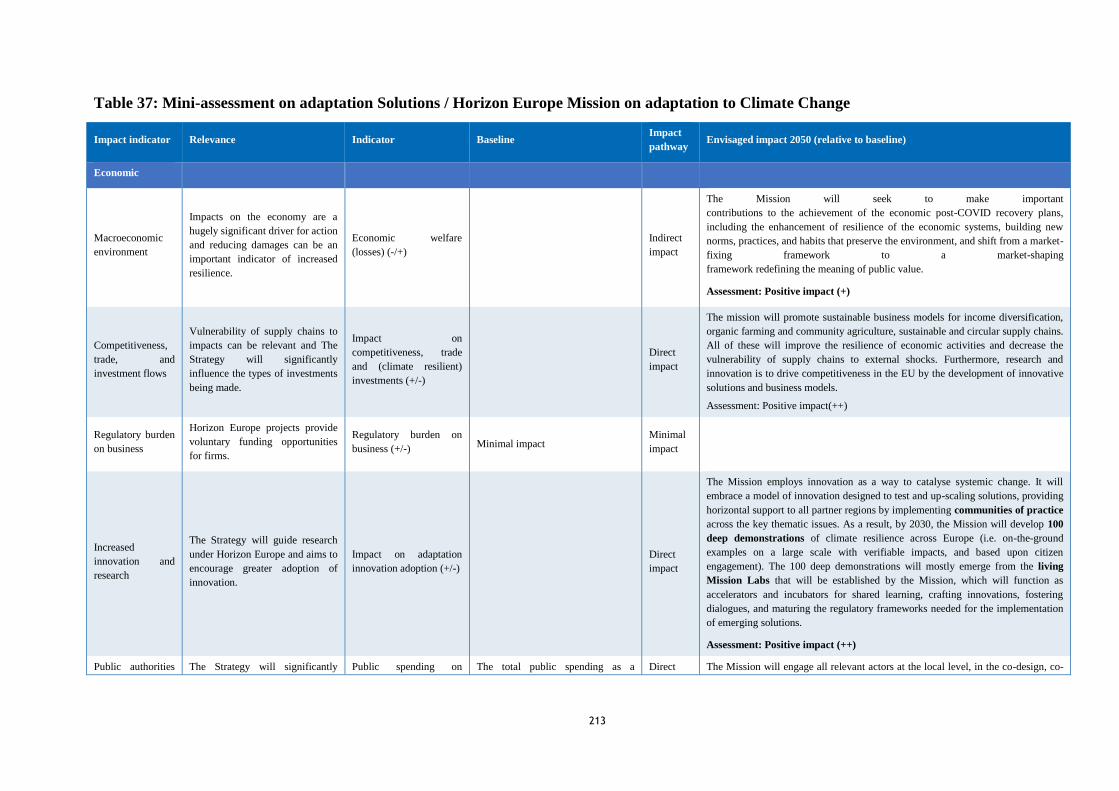
213
Table 37: Mini-assessment on adaptation Solutions / Horizon Europe Mission on adaptation to Climate Change
Impact indicator Relevance Indicator Baseline Impact
pathway Envisaged impact 2050 (relative to baseline)
Economic
Macroeconomic
environment
Impacts on the economy are a
hugely significant driver for action
and reducing damages can be an
important indicator of increased
resilience.
Economic welfare
(losses) (-/+) Indirect
impact
The Mission will seek to make important
contributions to the achievement of the economic post-COVID recovery plans,
including the enhancement of resilience of the economic systems, building new
norms, practices, and habits that preserve the environment, and shift from a market-
fixing framework to a market-shaping
framework redefining the meaning of public value.
Assessment: Positive impact (+)
Competitiveness,
trade, and
investment flows
Vulnerability of supply chains to
impacts can be relevant and The
Strategy will significantly
influence the types of investments
being made.
Impact on
competitiveness, trade
and (climate resilient)
investments (+/-)
Direct
impact
The mission will promote sustainable business models for income diversification,
organic farming and community agriculture, sustainable and circular supply chains.
All of these will improve the resilience of economic activities and decrease the
vulnerability of supply chains to external shocks. Furthermore, research and
innovation is to drive competitiveness in the EU by the development of innovative
solutions and business models.
Assessment: Positive impact(++)
Regulatory burden
on business
Horizon Europe projects provide
voluntary funding opportunities
for firms.
Regulatory burden on
business (+/-) Minimal impact
Minimal
impact
Increased
innovation and
research
The Strategy will guide research
under Horizon Europe and aims to
encourage greater adoption of
innovation.
Impact on adaptation
innovation adoption (+/-) Direct
impact
The Mission employs innovation as a way to catalyse systemic change. It will
embrace a model of innovation designed to test and up-scaling solutions, providing
horizontal support to all partner regions by implementing communities of practice
across the key thematic issues. As a result, by 2030, the Mission will develop 100
deep demonstrations of climate resilience across Europe (i.e. on-the-ground
examples on a large scale with verifiable impacts, and based upon citizen
engagement). The 100 deep demonstrations will mostly emerge from the living
Mission Labs that will be established by the Mission, which will function as
accelerators and incubators for shared learning, crafting innovations, fostering
dialogues, and maturing the regulatory frameworks needed for the implementation
of emerging solutions.
Assessment: Positive impact (++)
Public authorities The Strategy will significantly Public spending on The total public spending as a Direct The Mission will engage all relevant actors at the local level, in the co-design, co-

214
(and budgets) impact on public spending on
climate resilience, primarily
through indirect routes.
adaptation (€) percentage of public spending on
climate adaptation and resilience as
a percentage of the city’s GDP
(GDPc).
(Goergeson L. et al, 2016) can help
provide baseline: Between 0.14 and
0.33% GDPc was allocated by cities
globally in climate adaptation.
0.22% GDPc was spent by the city
of Paris on adaptation and resilience
in 2014/2015. growth of the
spending between 2008-2015 was
4.03% 324
Moreover, according to the 2019
CoM assessment325, 700 million
EUR have been allocated to
adaptation by CoM signatories.
impact implementation, and co-evaluation of the Mission. This is expected to lead to an
increase in societal ownership and have an impact on public spending on climate
resilience.
Besides, the Mission will support the partner regions in crowding-in and mobilising
multiple forms and sources of funding and finance. To achieve this, it will assist
communities in accessing the EU funds and programmes, loans from the EIB and
the EBRD, as well as other national and regional funds. Therefore, it is expected
that the actions by the Mission will motivate the complementary commitment for
climate resilience of funds such as the European Structural and Investment Fund,
the European Regional Development Fund, and the Cohesion Fund, among others.
Assessment: Positive impact (++)
Social impacts
Employment
Impacts on the economy and in-
turn on employment are a hugely
significant driver for action and
reducing damages and job losses
can be an important indicator of
increased resilience.
Employment (FTE) Direct
impact
the Mission will support research and innovation on skills forecasting to provide
information on upskilling and reskilling needs, notably through designing curricula
to train on green skills, and developing community learning centres for adults.
While these activities focus on education and capacity building, they ensure the
work force is prepared for upcoming job opportunities in green industries
Assessment: Positive impact (+)
Income
distribution, social
protection and
social inclusion
(of particular
groups)
Distributional impacts of climate
change can be significant, the
Strategy is intended to address and
mitigate inequalities, including
through better informing citizens
and encouraging action. Needs to
address broader questions of
Distributional and equity
impacts (+/-)
Based on the 2019 CoM
assessment326, public participation in
adaptation planning is it makes
urban adaptation more equitable and
ensures the inclusion of the views of
the most vulnerable communities.
Nonetheless, today only 43-44% of
Two of three fundamental principles that guide the Mission are related to this
impact indicator: i) the resilience of social and economic systems with a
commitment to equity, social, and gender justice, and ii) the resilience of political
systems, with a commitment to inclusiveness, deliberation, shared values,
solidarity, and respect for diversity. By supporting the implementation of the
Mission, the new Strategy will encourage the creation of enabling conditions for
societal transformation, fostering community engagement, and mitigating
324 Georgeson, L. et al (2016) "Adaptation responses to climate change differ between global megacities" Nature Climate Change 6.6 (2016): 584-588. 325 Bertoldi, P et. Al (2020), “Covenant of Mayors: 2019 Assessment”, Publications Office of the European Union, Luxembourg” ISBN 978-92-76-10722-4, doi:10.2760/775755, JRC118927 326 Bertoldi, P et. Al (2020), “Covenant of Mayors: 2019 Assessment”, Publications Office of the European Union, Luxembourg” ISBN 978-92-76-10722-4, doi:10.2760/775755, JRC118927

215
equity (see other impacts) such as
location, economic and social
cohesion, gender and also of
fundamental rights.
the signatories of the CoM report to
have involved stakeholders and
citizens in climate adaptation
planning.
inequalities through better-informing citizens and encouraging action.
Assessment: Positive impact (++)
Public health &
safety and health
systems
Increased resilience of public
health and safety systems is an
important goal of the Strategy.
Impact on public health
and civil emergency
systems (+/-)
According to the 2019 CoM
Assessment, CoM signatories have
reported +310 actions (including
ongoing completed, not started) on
the health sector, and +320 on civil
protection and emergency in their
climate adaptation strategies.
Direct
impact
The Mission will aim to help communities to increase the resilience of their public
health & safety systems by assisting with the planning and implementation of
early-warning and surveillance systems. In particular, the Mission will help define
and assess the resilience goals proposed under the Union Civil Protection
Mechanism (UCPM) and contribute to improving the understanding of and societal
preparedness for health risks. In addition, it will contribute to the EU4Health 2021-
2017 programme.
Assessment: Positive impact (++)
Environmental impacts
The climate
Critical impact targeted by the
strategy. Increase of resilience to
climate impacts and preventing
climate risks. In addition, potential
synergies with mitigation may be
worth considering.
Impact on climate
resilience (+/-)
(possible) Synergy with
climate mitigation (+/-)
According to the 2019 CoM 429
signatories out of 2221 (370 from
EU28+EFTA and 59 non-
EU28+EFTA) have already
provided information regarding their
adaptation goals, risk and
vulnerability assessments or action
plans. This can be used as a baseline
to indicate the percentage of
European cities and communities
implementing actions to increase
climate adaptation resilience.
Direct
impact
The three objectives of the Mission are expected to have a significant positive
impact on improving the resilience to climate change in Europe. First, it will help
citizens, communities and regions to better prepare for climate change effects by
providing access to all local administrative units (LAU) and regions (NUTS) to
climate risk profiles and reliable early warning systems, and support the adoption
of climate risk plans, and safe social infrastructure and services. Second, it will
help 200 regions and communities to articulate their visions of social change and
climate-resilient pathways. Finally, it will provide deep demonstrations of climate
resilience on a large scale.
Assessment: Positive impact (++)
Quality of natural
resources/fighting
pollution (water,
soil, air, etc.)
Strategy intends to address
impacts of climate change on
natural resources, e.g. forests,
agriculture, marine environment.
Impact on natural
resource resilience (+/-)
Some of the CoM signatories
especially in EU28+EFTA
municipalities have already
completed the implementation of
adaptation actions and reported the
associated impacts on the
environment. Concretely, the
majority of actions (ca. 600),
including all completed, on-going
and planned actions, are reported to
have an impact on the water sector.
Direct
impact
Rethinking water management is one of the areas of research and innovation of the
Mission. The aim is to foster innovations towards smart, reliable, and efficient
access to water and reduced vulnerability to water-related risks.
Assessment: Positive impact (+)
Biodiversity, Strategy intends to address Use of ecosystem-based According to the 2019 CoM Direct Following the EU Biodiversity Strategy 2030, the Mission will boost nature-based
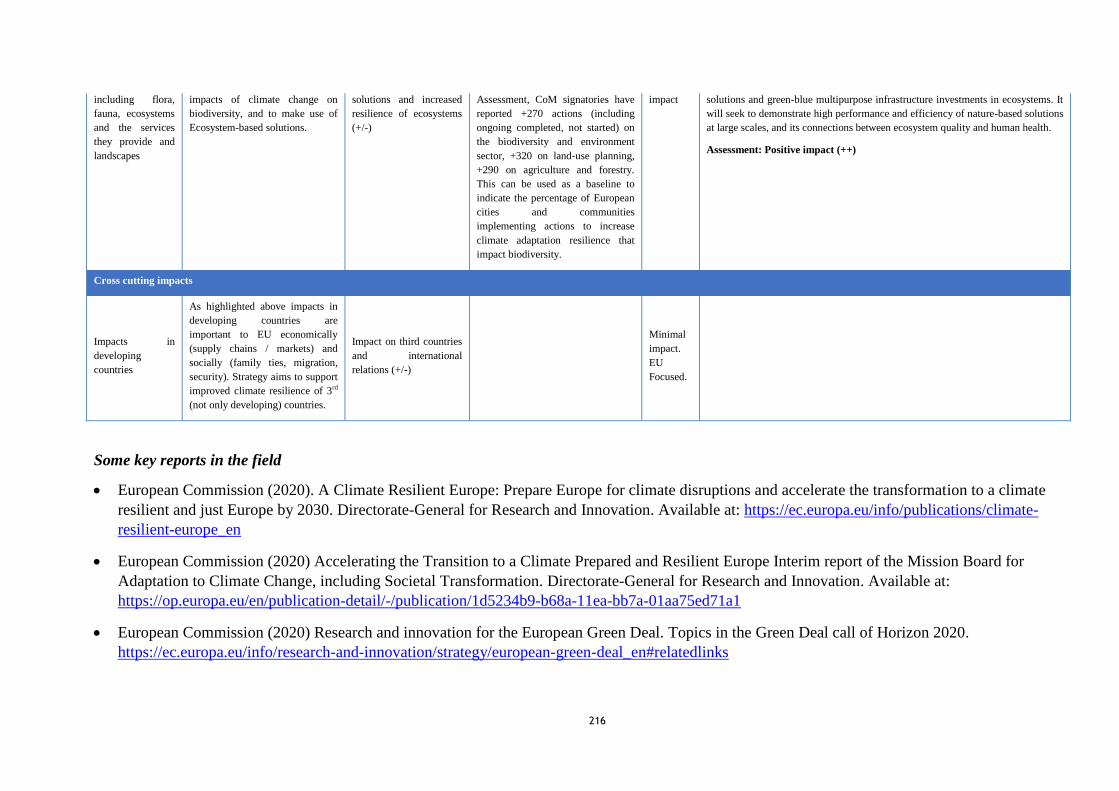
216
including flora,
fauna, ecosystems
and the services
they provide and
landscapes
impacts of climate change on
biodiversity, and to make use of
Ecosystem-based solutions.
solutions and increased
resilience of ecosystems
(+/-)
Assessment, CoM signatories have
reported +270 actions (including
ongoing completed, not started) on
the biodiversity and environment
sector, +320 on land-use planning,
+290 on agriculture and forestry.
This can be used as a baseline to
indicate the percentage of European
cities and communities
implementing actions to increase
climate adaptation resilience that
impact biodiversity.
impact solutions and green-blue multipurpose infrastructure investments in ecosystems. It
will seek to demonstrate high performance and efficiency of nature-based solutions
at large scales, and its connections between ecosystem quality and human health.
Assessment: Positive impact (++)
Cross cutting impacts
Impacts in
developing
countries
As highlighted above impacts in
developing countries are
important to EU economically
(supply chains / markets) and
socially (family ties, migration,
security). Strategy aims to support
improved climate resilience of 3rd
(not only developing) countries.
Impact on third countries
and international
relations (+/-)
Minimal
impact.
EU
Focused.
Some key reports in the field
European Commission (2020). A Climate Resilient Europe: Prepare Europe for climate disruptions and accelerate the transformation to a climate
resilient and just Europe by 2030. Directorate-General for Research and Innovation. Available at: https://ec.europa.eu/info/publications/climate-
resilient-europe_en
European Commission (2020) Accelerating the Transition to a Climate Prepared and Resilient Europe Interim report of the Mission Board for
Adaptation to Climate Change, including Societal Transformation. Directorate-General for Research and Innovation. Available at:
https://op.europa.eu/en/publication-detail/-/publication/1d5234b9-b68a-11ea-bb7a-01aa75ed71a1
European Commission (2020) Research and innovation for the European Green Deal. Topics in the Green Deal call of Horizon 2020.
https://ec.europa.eu/info/research-and-innovation/strategy/european-green-deal_en#relatedlinks

217
European Commission (2018) A new horizon for Europe. Impact Assessment of the 9th EU Framework Programme for Research and Innovation
Dechezlepretre,Antoine; Fankhauser,Sam; Glachant,Matthieu Michel Marcel; Stoever,Jana; Touboul,Simon.2020. Invention and Global Diffusion
of Technologies for Climate Change Adaptation : A Patent Analysis (English). Washington, D.C. : World Bank Group.
https://documents.worldbank.org/en/publication/documents-reports/documentdetail/648341591630145546/invention-and-global-diffusion-of-
technologies-for-climate-change-adaptation-a-patent-analysis
MEASURE 12.2: Develop forestry, ecosystems and agriculture decision support tools, including trees and crop suitability, weather and climate
forecasts and disturbance risks.
Baseline, context and rationale
The negative impacts that climate change will have in European land ecosystems, agriculture, and forests in the coming years have been described in
different reports.327,328
Even though progress has been made, the adaptive capacity of these sectors still requires that more information will be available,
including vegetation change, crop water needs, and risks of loss and extreme events, all of which will allow stakeholders to make climate-proof
decisions.
In the case of forests, according to the Analytical Report on forestry329
, few databases are available addressing forest’s climate vulnerability. Although
some sources exist that cover multiple species at the European level, limited information is available at Member State, being current data the least
available. Moreover, data about drought affecting forests, pest damage, climate related-economic damage, and vegetation change is also limited and
often varies between the Member States.
Regarding agriculture, most farm managers in the EU only have practical experience (68.3 %), only less than one in ten (9.1 %) farm managers had full
agricultural training, and the rest (22.6 %) had basic agricultural training.330
In spite of this, farm owners and managers are on the frontline of adapting
to climate change, and, as research has suggested, their decisions are affected by their own knowledge and beliefs.331
327 Feyen L., Ciscar J.C., Gosling S., Ibarreta D., Soria A. (editors) (2020). Climate change impacts and adaptation in Europe. JRC PESETA IV final report. EUR 30180EN, Publications Office of the European Union,
Luxembourg, ISBN 978-92-76-18123-1, doi:10.2760/171121, JRC119178. 328 FAO and UNEP (2020). The State of the World’s Forests 2020. Forests, biodiversity and people. Rome. https://doi.org/10.4060/ca8642en 329 Forthcoming, 2021 330 European Union (2019) Agriculture, forestry, and fishery statistics. 2019 Edition. Available at: https://ec.europa.eu/eurostat/documents/3217494/10317767/KS-FK-19-001-EN-N.pdf/742d3fd2-961e-68c1-47d0-11cf30b11489 331 Yousefpour, R et al (2017). A framework for modeling adaptive forest management and decision making under climate change. Ecology and Society 22(4):40. https://doi.org/10.5751/ES-09614-220440

218
OPC: Respondents to the OPC reported that the main actions to support resilience-building in agriculture and forests are information/guidance about
management practices and nature-based solutions that enhance climate resilience, information/guidance to better use existent plant/forest genetic
diversity (varieties, species) to build resilience, and climate resilient land use planning. In accordance, OPC respondents also indicated that the main
elements for climate resilient agriculture/forests are diversified systems (e.g. mixed farming, agro-forestry, different forest systems and management,
age structure), and nature-based solutions.
Description of measure
By supporting forest owners and managers to consider climate change in their management approaches (from the choice of the species and their origin
to the use of silvicultural practices and forest structure that mix species and age classes), this measure will seek to ensure that forest management
practices (afforestation, reforestation, restoration) are undertaken with a view to enhance the resilience of forest ecosystems to climate impacts.
Objectives and actions:
Strengthen ecosystems resilience by providing the farming and forestry community with ready to use information combining information on plants
and tree species and varieties and their suitability in a changing climate.
Raise awareness and accelerate action on adapting forests to climate change, by providing decision-makers with actionable information on the
evolution of climate and forests.
Some of the specific proposed actions are:
Monitor climate impacts on natural ecosystems, agriculture and forestry, ensuring EU-wide, consistent monitoring of disturbances and losses
due to extreme events, capitalising on existing initiatives such as Forest Information System for Europe (FISE), European Forest Fire Information
System (EFFIS), Copernicus land monitoring services (CLMS), Copernicus Climate Change Services (C3S).
Mapping projected natural vegetation changes and information about crops/trees suited to the projected climate in a particular area,
providing geographically explicit information about expected vegetation changes and suitable plants and tree species/varieties building on JRC
ongoing work in this area (e.g. EcoAdapt on vulnerability and adaptation of ecosystems, Forest@risk, FORGENIUS); and integrating information
about current and projected bioclimatic zones suitable for plant/tree species and varieties catalogue (with searchable options).
Support on-the-ground dissemination and implementation (support to value chain’s actors and practitioners networks) by helping tree
nurseries to ensure that they have the right material in the right quantities to support climate-proof forest management; supporting knowledge

219
dissemination, piloting and implementation in the farming and forestry community; and giving visibility and facilitating information dissemination
and contact matchmaking
Impact pathways
In the table below impacts are assessed using a scale from (--/-/0/+/++) negative to positive. Impacts are assessed up to 2050 relative to the baseline. It
assumes the full uptake of the measure as the increasing severity of physical climate risks on Europe’s natural capital is more widely recognised, and
consequently the relevance of taking action on generating more data, protection, and successively making use of the adaptive capacity of ecosystems.
Table 38: Mini-assessment Measures for Land ecosystems, agriculture and forests
332 Eurostat. Gross value added and income by A*10 industry breakdowns (Agriculture, Forestry and Fishing) 333 NACE Rev. 2 Statistical classification of economic activities in the European Community https://ec.europa.eu/eurostat/documents/3859598/5902521/KS-RA-07-015-EN.PDF 334 Eurostat. Gross value added of the forestry industry, at basic prices. https://data.europa.eu/euodp/en/data/dataset/WmwTGWdwfhwPyEUUQNiCg 335 Klauss, K. (2020) The forest sector in the Baltic States: A united, growth-oriented economic ecosystem. The forest industry around the Baltic Sea region: Future challenges and opportunities. Centrum Balticum Foundation https://eustafor.eu/uploads/BSR_Policy_Briefing_2020.pdf#page=36
Impact indicator Relevance Indicator Baseline Land ecosystems,
agriculture and forests Envisaged impact 2050 (relative to baseline)
Economic
Macroeconomic environment
Impacts on the economy are a
hugely significant driver for
action and reducing damages
can be an important indicator of
increased resilience.
Economic welfare
(losses) (-/+)
Climate change affects land, agriculture, and
forest-related industries such as wood processing
and manufacturing. This will pose great
challenges in their economic growth. In 2017, the
GVA of the agriculture, forestry and fishing was
EUR 220 533 million for the EU27countries332.
For the same year, based on Division 02 of
NACE Rev. 2333 the forest industry’s GVA for
EU27 was EUR 26 220 million in 2017.334 The
inclusion of other activities (NACE 16; 31) by
other studies estimating GVA of the forest sector,
suggest that the impact on the economy of
changes in land, ecosystems, agriculture, and
forests could be much larger.335
Indirect impact
By raising awareness and accelerate action on
adapting forests to climate change, this measure
will help to provide decision-makers with
actionable information on the evolution of
climate and forests.
More accurate, robust, granular, and comparable
data leads to better understanding and better -
informed decision making actionable information
on the evolution of climate and forests.. The
identification of forests that are on critical risk
areas will decrease the negative macroeconomic
impact of climate change by reducing the loss of
these ecosystems.

220
336 Stockholm Environment Institute SEI (2020). Atlas of Development Finance. Accessed 04.09.2020 337 European Union (2019) Agriculture, forestry, and fishery statistics. 2019 Edition. Available at: https://ec.europa.eu/eurostat/documents/3217494/10317767/KS-FK-19-001-EN-N.pdf/742d3fd2-961e-68c1-47d0-11cf30b11489 338 EIT-Climate KIC (2018) EIT Climate-KIC and the future of the forestry sector. Available at: https://www.climate-kic.org/wp-content/uploads/2018/03/Climate-KICForestryWP_FINAL-210318.pdf 339 European Commission (2020) Agriculture in Horizon Europe. Alexia Rouby. Research and Innovation Unit European Commission DG Agriculture and Rural Development.
https://bioeast.eu/wp-content/uploads/2020/03/Alexia_AgricultureInHorEU.pdf
Assessment: (++)
Competitiveness, trade and
investment flows
Vulnerability of supply chains to
impacts can be relevant and The
Strategy will significantly
influence the types of
investments being made.
Impact on
competitiveness,
trade and (climate
resilient)
investments (+/-)
In 2018, EU Institutions committed
USD$137 million in development finance to EU
countries for agriculture, forestry, fishing. The
EIB committed USD$127 million for the same
objective in 2018. In total, USD$477 million was
committed to European development finance for
agriculture, forestry, and fishing.336
In addition, the EU’s trade in agricultural goods
was EUR 275 billion in 2018.During the same
year, the value of trade in agricultural goods
accounted for 7.0 % of total EU international
trade in goods in 2018.337
Indirect impact
The lack of available capital for investing in
improved forest management is primarily caused
by the perceived high risk of forest-based
investments partly due to insufficient data and
suitable tools.338
With this measure, the new Strategy will map,
among others, current and projected vegetation
changes and provide information about the
geographic suitability of trees species,
identifying areas of risks, and informing better
decision-making.
The actions included will not only allow us to
have more precise information but also provide
investors with quantitative information.
Assessment: (+)
Regulatory burden on business
Publically provided information,
data and support services will
have minimal negative impacts
on businesses.
Regulatory burden
on business (+/-) Minimal impact Minimal impact
Increased innovation and research
The Strategy will guide research
under Horizon Europe and aims
to encourage greater adoption of
innovation.
Impact on
adaptation
innovation
adoption (+/-)
One of the intervention areas (IAs) included in
the new structure of Horizon Europe is
Agriculture, Forestry and Rural Areas. This IA
covers, among others, innovation and research in
sustainable forest management, sustainable land
use, rural development and territorial linkages,
and sustainable management and efficient use of
natural resources.339
Direct Impact
This measure aims to strengthen ecosystems
resilience by providing ready to use the
information to farmers and forest managers. The
development of this information will require the
refinement of monitoring tools, mapping
systems, and significant advances in the research
of species adaptability and projected vegetation
changes. The required data and knowledge
acquisition will be guided by the combined
efforts of the private sector and research projects
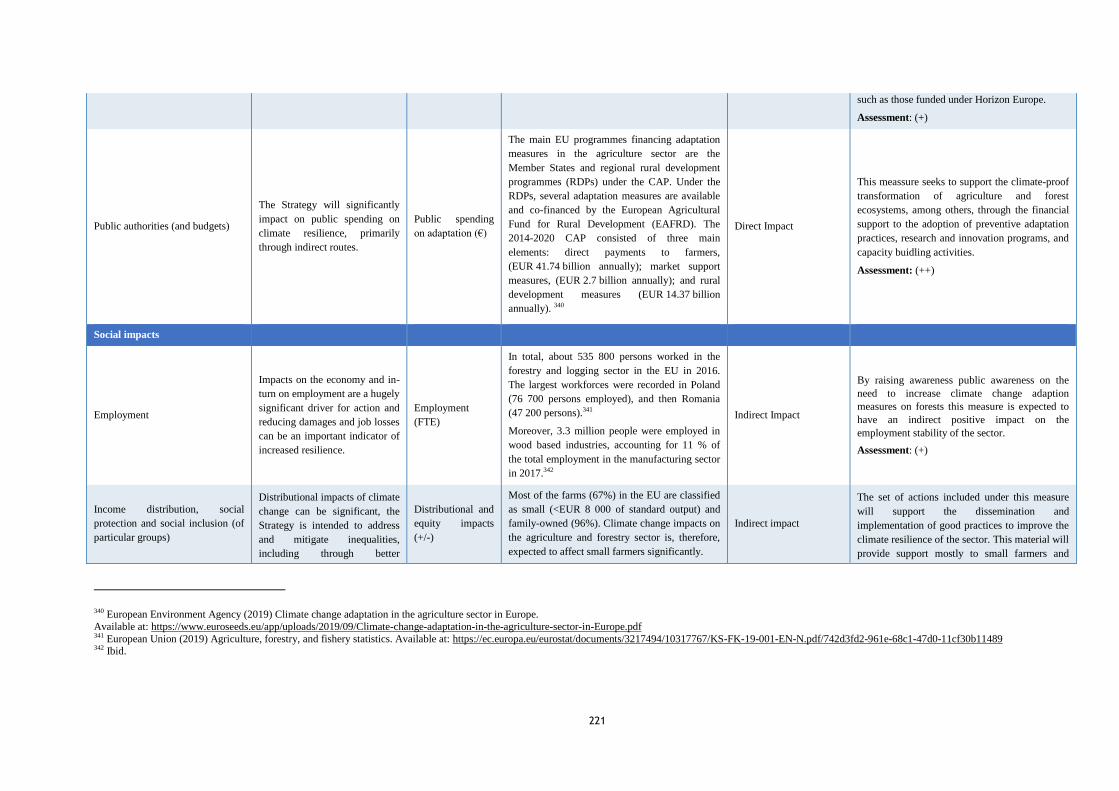
221
340 European Environment Agency (2019) Climate change adaptation in the agriculture sector in Europe.
Available at: https://www.euroseeds.eu/app/uploads/2019/09/Climate-change-adaptation-in-the-agriculture-sector-in-Europe.pdf 341 European Union (2019) Agriculture, forestry, and fishery statistics. Available at: https://ec.europa.eu/eurostat/documents/3217494/10317767/KS-FK-19-001-EN-N.pdf/742d3fd2-961e-68c1-47d0-11cf30b11489 342 Ibid.
such as those funded under Horizon Europe.
Assessment: (+)
Public authorities (and budgets)
The Strategy will significantly
impact on public spending on
climate resilience, primarily
through indirect routes.
Public spending
on adaptation (€)
The main EU programmes financing adaptation
measures in the agriculture sector are the
Member States and regional rural development
programmes (RDPs) under the CAP. Under the
RDPs, several adaptation measures are available
and co-financed by the European Agricultural
Fund for Rural Development (EAFRD). The
2014-2020 CAP consisted of three main
elements: direct payments to farmers,
(EUR 41.74 billion annually); market support
measures, (EUR 2.7 billion annually); and rural
development measures (EUR 14.37 billion
annually). 340
Direct Impact
This meassure seeks to support the climate-proof
transformation of agriculture and forest
ecosystems, among others, through the financial
support to the adoption of preventive adaptation
practices, research and innovation programs, and
capacity buidling activities.
Assessment: (++)
Social impacts
Employment
Impacts on the economy and in-
turn on employment are a hugely
significant driver for action and
reducing damages and job losses
can be an important indicator of
increased resilience.
Employment
(FTE)
In total, about 535 800 persons worked in the
forestry and logging sector in the EU in 2016.
The largest workforces were recorded in Poland
(76 700 persons employed), and then Romania
(47 200 persons).341
Moreover, 3.3 million people were employed in
wood based industries, accounting for 11 % of
the total employment in the manufacturing sector
in 2017.342
Indirect Impact
By raising awareness public awareness on the
need to increase climate change adaption
measures on forests this measure is expected to
have an indirect positive impact on the
employment stability of the sector.
Assessment: (+)
Income distribution, social
protection and social inclusion (of
particular groups)
Distributional impacts of climate
change can be significant, the
Strategy is intended to address
and mitigate inequalities,
including through better
Distributional and
equity impacts
(+/-)
Most of the farms (67%) in the EU are classified
as small (<EUR 8 000 of standard output) and
family-owned (96%). Climate change impacts on
the agriculture and forestry sector is, therefore,
expected to affect small farmers significantly.
Indirect impact
The set of actions included under this measure
will support the dissemination and
implementation of good practices to improve the
climate resilience of the sector. This material will
provide support mostly to small farmers and
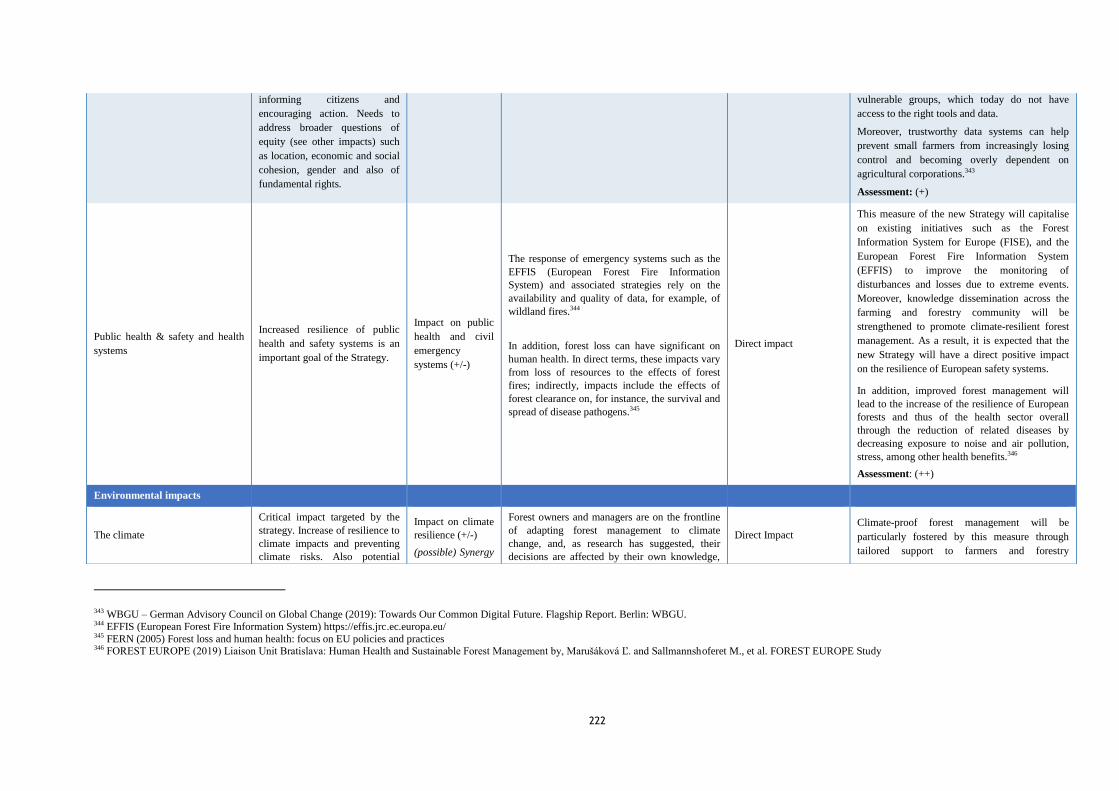
222
343 WBGU – German Advisory Council on Global Change (2019): Towards Our Common Digital Future. Flagship Report. Berlin: WBGU. 344 EFFIS (European Forest Fire Information System) https://effis.jrc.ec.europa.eu/ 345 FERN (2005) Forest loss and human health: focus on EU policies and practices 346 FOREST EUROPE (2019) Liaison Unit Bratislava: Human Health and Sustainable Forest Management by, Marušáková Ľ. and Sallmannshoferet M., et al. FOREST EUROPE Study
informing citizens and
encouraging action. Needs to
address broader questions of
equity (see other impacts) such
as location, economic and social
cohesion, gender and also of
fundamental rights.
vulnerable groups, which today do not have
access to the right tools and data.
Moreover, trustworthy data systems can help
prevent small farmers from increasingly losing
control and becoming overly dependent on
agricultural corporations.343
Assessment: (+)
Public health & safety and health
systems
Increased resilience of public
health and safety systems is an
important goal of the Strategy.
Impact on public
health and civil
emergency
systems (+/-)
The response of emergency systems such as the
EFFIS (European Forest Fire Information
System) and associated strategies rely on the
availability and quality of data, for example, of
wildland fires.344
In addition, forest loss can have significant on
human health. In direct terms, these impacts vary
from loss of resources to the effects of forest
fires; indirectly, impacts include the effects of
forest clearance on, for instance, the survival and
spread of disease pathogens.345
Direct impact
This measure of the new Strategy will capitalise
on existing initiatives such as the Forest
Information System for Europe (FISE), and the
European Forest Fire Information System
(EFFIS) to improve the monitoring of
disturbances and losses due to extreme events.
Moreover, knowledge dissemination across the
farming and forestry community will be
strengthened to promote climate-resilient forest
management. As a result, it is expected that the
new Strategy will have a direct positive impact
on the resilience of European safety systems.
In addition, improved forest management will
lead to the increase of the resilience of European
forests and thus of the health sector overall
through the reduction of related diseases by
decreasing exposure to noise and air pollution,
stress, among other health benefits.346
Assessment: (++)
Environmental impacts
The climate
Critical impact targeted by the
strategy. Increase of resilience to
climate impacts and preventing
climate risks. Also potential
Impact on climate
resilience (+/-)
(possible) Synergy
Forest owners and managers are on the frontline
of adapting forest management to climate
change, and, as research has suggested, their
decisions are affected by their own knowledge,
Direct Impact
Climate-proof forest management will be
particularly fostered by this measure through
tailored support to farmers and forestry
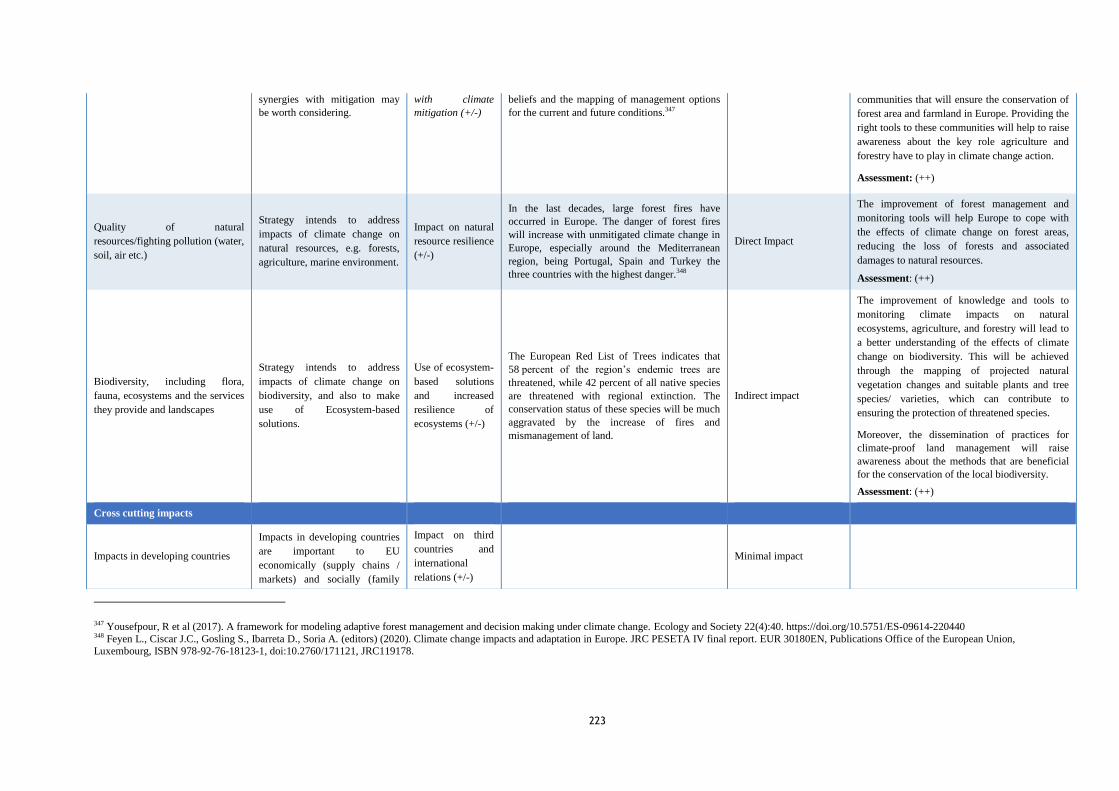
223
347 Yousefpour, R et al (2017). A framework for modeling adaptive forest management and decision making under climate change. Ecology and Society 22(4):40. https://doi.org/10.5751/ES-09614-220440 348 Feyen L., Ciscar J.C., Gosling S., Ibarreta D., Soria A. (editors) (2020). Climate change impacts and adaptation in Europe. JRC PESETA IV final report. EUR 30180EN, Publications Office of the European Union, Luxembourg, ISBN 978-92-76-18123-1, doi:10.2760/171121, JRC119178.
synergies with mitigation may
be worth considering.
with climate
mitigation (+/-)
beliefs and the mapping of management options
for the current and future conditions.347
communities that will ensure the conservation of
forest area and farmland in Europe. Providing the
right tools to these communities will help to raise
awareness about the key role agriculture and
forestry have to play in climate change action.
Assessment: (++)
Quality of natural
resources/fighting pollution (water,
soil, air etc.)
Strategy intends to address
impacts of climate change on
natural resources, e.g. forests,
agriculture, marine environment.
Impact on natural
resource resilience
(+/-)
In the last decades, large forest fires have
occurred in Europe. The danger of forest fires
will increase with unmitigated climate change in
Europe, especially around the Mediterranean
region, being Portugal, Spain and Turkey the
three countries with the highest danger.348
Direct Impact
The improvement of forest management and
monitoring tools will help Europe to cope with
the effects of climate change on forest areas,
reducing the loss of forests and associated
damages to natural resources.
Assessment: (++)
Biodiversity, including flora,
fauna, ecosystems and the services
they provide and landscapes
Strategy intends to address
impacts of climate change on
biodiversity, and also to make
use of Ecosystem-based
solutions.
Use of ecosystem-
based solutions
and increased
resilience of
ecosystems (+/-)
The European Red List of Trees indicates that
58 percent of the region’s endemic trees are
threatened, while 42 percent of all native species
are threatened with regional extinction. The
conservation status of these species will be much
aggravated by the increase of fires and
mismanagement of land.
Indirect impact
The improvement of knowledge and tools to
monitoring climate impacts on natural
ecosystems, agriculture, and forestry will lead to
a better understanding of the effects of climate
change on biodiversity. This will be achieved
through the mapping of projected natural
vegetation changes and suitable plants and tree
species/ varieties, which can contribute to
ensuring the protection of threatened species.
Moreover, the dissemination of practices for
climate-proof land management will raise
awareness about the methods that are beneficial
for the conservation of the local biodiversity.
Assessment: (++)
Cross cutting impacts
Impacts in developing countries
Impacts in developing countries
are important to EU
economically (supply chains /
markets) and socially (family
Impact on third
countries and
international
relations (+/-)
Minimal impact
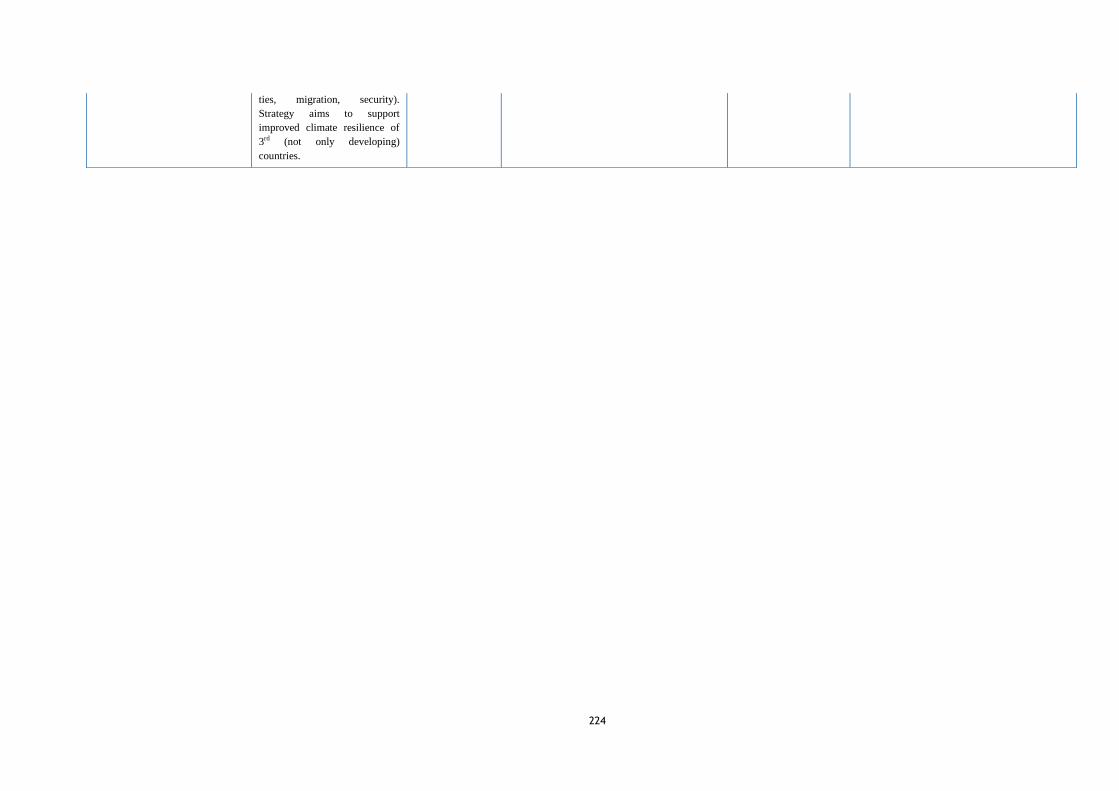
224
ties, migration, security).
Strategy aims to support
improved climate resilience of
3rd (not only developing)
countries.

225
Action 13: Closing the Climate Protection Gap - Macroeconomic aspects of adaptation to climate change.
MEASURE 13.1: For public finance/macro financial stability risk: introduce a step-wise approach whereby the commission engages a discussion on
national disaster risk management frameworks with finance ministers’ fora, underpinned by best practices and evidence from EU Member
States, and further assesses impact on sustainability of public finance based on EU level scenario analysis and stress testing. This would lay the
ground for mainstreaming climate change in the national fiscal processes.
Baseline, context and Rationale
The measure would help inform the fiscal surveillance frameworks (EU and national). Expected economic losses related to climate change have
the potential to have increasingly large implications on fiscal stability and sustainability of the EU Member States. In the absence of financial
protection tools for coping with disasters, the incidence of major disasters in several EU Member States may exacerbate economic imbalances and
deteriorate credit ratings.
Description of Measure
Break national level silos between climate policy, disaster risk management and fiscal and budgetary processes; Incentivize Member States to consider
and develop risk-sharing solutions; trigger climate protection gap discussion with Member States and consider inclusion of the fiscal aspects of disaster
risk management in national budgetary framework
Objectives and Actions
Research: Development of a model to estimate the loss distribution for the EU insurance sector, by country, in relation to the occurrence of
extreme natural events and quantify the funding cost to cope with the estimated catastrophic risk.
Support Member States to strengthen the national risk assessments under the Union Civil Protection Mechanism, notably by including quantitative
and qualitative assessments of all physical risks and complex compound risks for various scenarios (including climate change), that contribute to
robust Disaster Risk Management (DRM) planning and better meet the needs for public sector financial risk management. This action starts with a
thorough evaluation of current risk assessment methods and practices, legal reporting requirements and practices. Assess the potential impact on
public debt sustainability due to the improvement in resilience to climate risks through adaptation through scenario analysis;
Articulate the DRM and disaster risk financing (DRF) strategy with the national budgetary process to include ;
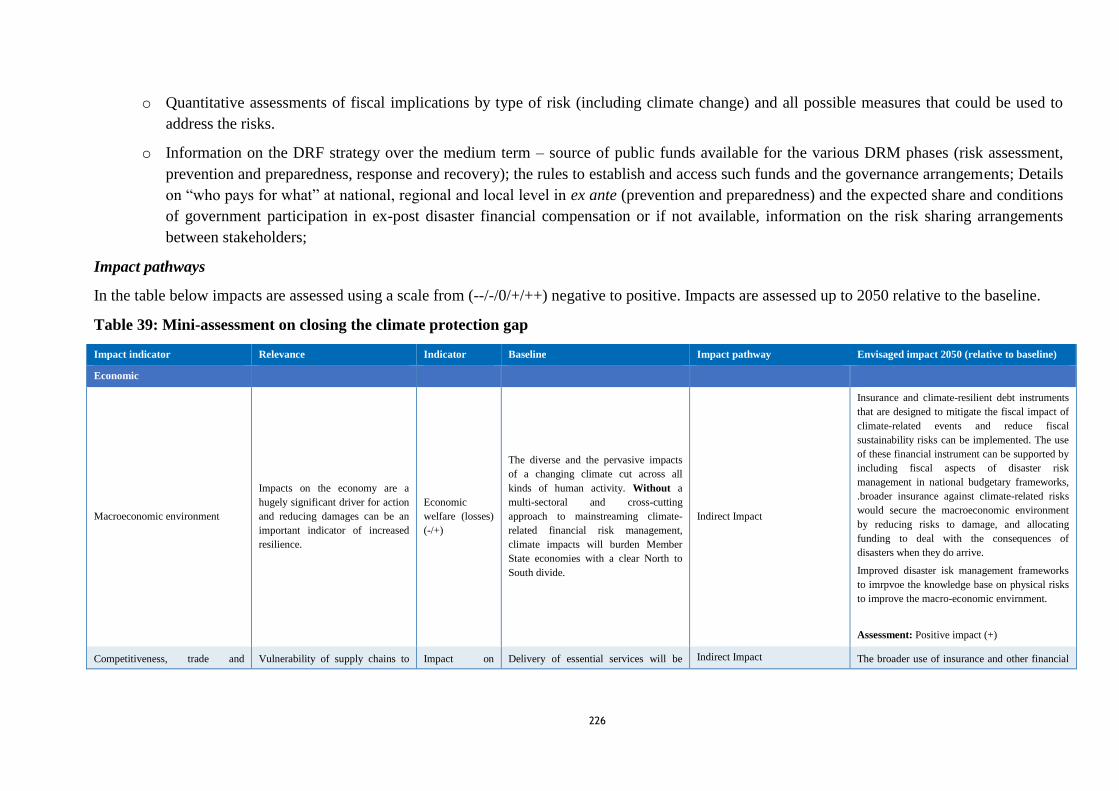
226
o Quantitative assessments of fiscal implications by type of risk (including climate change) and all possible measures that could be used to
address the risks.
o Information on the DRF strategy over the medium term – source of public funds available for the various DRM phases (risk assessment,
prevention and preparedness, response and recovery); the rules to establish and access such funds and the governance arrangements; Details
on “who pays for what” at national, regional and local level in ex ante (prevention and preparedness) and the expected share and conditions
of government participation in ex-post disaster financial compensation or if not available, information on the risk sharing arrangements
between stakeholders;
Impact pathways
In the table below impacts are assessed using a scale from (--/-/0/+/++) negative to positive. Impacts are assessed up to 2050 relative to the baseline.
Table 39: Mini-assessment on closing the climate protection gap
Impact indicator Relevance Indicator Baseline Impact pathway Envisaged impact 2050 (relative to baseline)
Economic
Macroeconomic environment
Impacts on the economy are a
hugely significant driver for action
and reducing damages can be an
important indicator of increased
resilience.
Economic
welfare (losses)
(-/+)
The diverse and the pervasive impacts
of a changing climate cut across all
kinds of human activity. Without a
multi-sectoral and cross-cutting
approach to mainstreaming climate-
related financial risk management,
climate impacts will burden Member
State economies with a clear North to
South divide.
Indirect Impact
Insurance and climate-resilient debt instruments
that are designed to mitigate the fiscal impact of
climate-related events and reduce fiscal
sustainability risks can be implemented. The use
of these financial instrument can be supported by
including fiscal aspects of disaster risk
management in national budgetary frameworks,
.broader insurance against climate-related risks
would secure the macroeconomic environment
by reducing risks to damage, and allocating
funding to deal with the consequences of
disasters when they do arrive.
Improved disaster isk management frameworks
to imrpvoe the knowledge base on physical risks
to improve the macro-economic envirnment.
Assessment: Positive impact (+)
Competitiveness, trade and Vulnerability of supply chains to Impact on Delivery of essential services will be Indirect Impact The broader use of insurance and other financial

227
investment flows impacts can be relevant and The
Strategy will significantly
influence the types of investments
being made.
competitiveness
, trade and
(climate
resilient)
investments (+/-
)
severely impacted. Infrastructure and
assets in hazardous areas will be
susceptible to impact, and may not have
appropriate insurance coverage of their
risks. Just-in-time supply, few
alternative sources/routes/suppliers,
dependence on imports can further
exacerbate the negative impacts of
natural disasters.
risk mitigation techniques will incentivise
making supply chains more resilient and reduce
vulnerability to economic hardship after climate
events.Assessment: Positive impact (+)
Regulatory burden on business
Measure targets actions by EU
institutions and national
authorities, minimal impact for
business.
Regulatory
burden on
business (+/-)
Minimal impact Minimal impact
Increased innovation and research
The Strategy will guide research
under Horizon Europe, and aims to
encourage greater adoption of
innovation.
Impact on
adaptation
innovation
adoption (+/-)
Current models are based on incomplete
historical data, and are not
reliable/forward looking enough to
properly identify vulnerable regions and
critical infrastructure.
Direct impact
Development of a model to estimate the loss
distribution for the EU insurance sector, by
country, in relation to the occurrence of extreme
natural events and to quantify the funding needs
necessary to cope with the estimated catastrophic
risk. Gathering qualitiative and quantitative
information comparable across Member States
will also improve existing and future models.
Assessment: Positive impact (+)
Public authorities (and budgets)
The Strategy will significantly
impact on public spending on
climate resilience, primarily
through indirect routes.
Public spending
on adaptation
(€)
Climate-related risk is not considered
throughout all decision-making
processes, and there lacks allocation of
clear responsibilities and climate risk-
ownership. Insurance penetration
remains low in several Member States,
and residual risk financial risk
management is scarce.
Direct Impact
Measure the potential impact on public budgets
and public debt sustainability due to the
improvement in resilience to climate risks
through adaptation. Incentives to Member States
to develop risk-sharing solutions will mitigate the
impacts of disasters on public spending on
disasters. Dedicating upfront resources to
prevention and preparedness and to deal with the
immediate consequences of climate-related
events reduces the burden on States in the
recovery phase. Using financial instruments
rather than grants for productive investments
could crowd-in private finance and would reduce
the burden on the state during prevention and
recovery.
Improved disaster isk management frameworks
to imrpvoe the knowledge base on physical risks
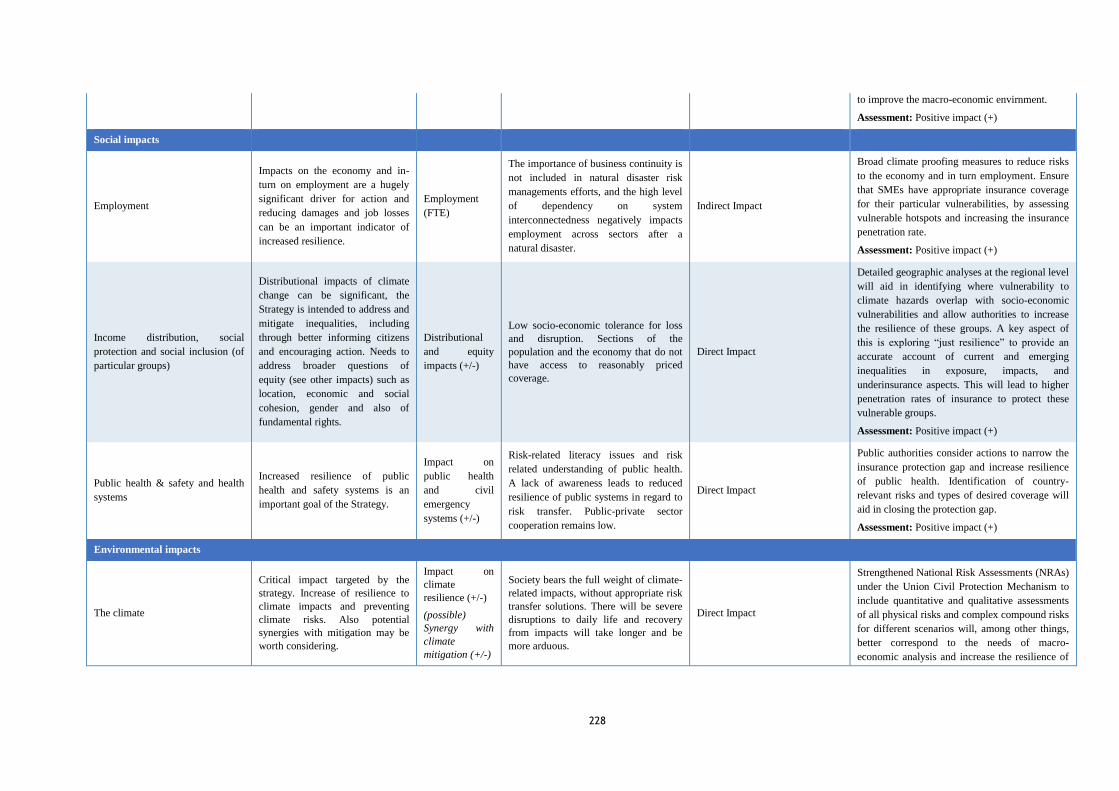
228
to improve the macro-economic envirnment.
Assessment: Positive impact (+)
Social impacts
Employment
Impacts on the economy and in-
turn on employment are a hugely
significant driver for action and
reducing damages and job losses
can be an important indicator of
increased resilience.
Employment
(FTE)
The importance of business continuity is
not included in natural disaster risk
managements efforts, and the high level
of dependency on system
interconnectedness negatively impacts
employment across sectors after a
natural disaster.
Indirect Impact
Broad climate proofing measures to reduce risks
to the economy and in turn employment. Ensure
that SMEs have appropriate insurance coverage
for their particular vulnerabilities, by assessing
vulnerable hotspots and increasing the insurance
penetration rate.
Assessment: Positive impact (+)
Income distribution, social
protection and social inclusion (of
particular groups)
Distributional impacts of climate
change can be significant, the
Strategy is intended to address and
mitigate inequalities, including
through better informing citizens
and encouraging action. Needs to
address broader questions of
equity (see other impacts) such as
location, economic and social
cohesion, gender and also of
fundamental rights.
Distributional
and equity
impacts (+/-)
Low socio-economic tolerance for loss
and disruption. Sections of the
population and the economy that do not
have access to reasonably priced
coverage.
Direct Impact
Detailed geographic analyses at the regional level
will aid in identifying where vulnerability to
climate hazards overlap with socio-economic
vulnerabilities and allow authorities to increase
the resilience of these groups. A key aspect of
this is exploring “just resilience” to provide an
accurate account of current and emerging
inequalities in exposure, impacts, and
underinsurance aspects. This will lead to higher
penetration rates of insurance to protect these
vulnerable groups.
Assessment: Positive impact (+)
Public health & safety and health
systems
Increased resilience of public
health and safety systems is an
important goal of the Strategy.
Impact on
public health
and civil
emergency
systems (+/-)
Risk-related literacy issues and risk
related understanding of public health.
A lack of awareness leads to reduced
resilience of public systems in regard to
risk transfer. Public-private sector
cooperation remains low.
Direct Impact
Public authorities consider actions to narrow the
insurance protection gap and increase resilience
of public health. Identification of country-
relevant risks and types of desired coverage will
aid in closing the protection gap.
Assessment: Positive impact (+)
Environmental impacts
The climate
Critical impact targeted by the
strategy. Increase of resilience to
climate impacts and preventing
climate risks. Also potential
synergies with mitigation may be
worth considering.
Impact on
climate
resilience (+/-)
(possible)
Synergy with
climate
mitigation (+/-)
Society bears the full weight of climate-
related impacts, without appropriate risk
transfer solutions. There will be severe
disruptions to daily life and recovery
from impacts will take longer and be
more arduous.
Direct Impact
Strengthened National Risk Assessments (NRAs)
under the Union Civil Protection Mechanism to
include quantitative and qualitative assessments
of all physical risks and complex compound risks
for different scenarios will, among other things,
better correspond to the needs of macro-
economic analysis and increase the resilience of

229
socieites to the impact of climate change.
Assessment: Positive impact (+)
Quality of natural
resources/fighting pollution (water,
soil, air etc.)
Strategy intends to address impacts
of climate change on natural
resources, e.g. forests, agriculture,
marine environment.
Impact on
natural resource
resilience (+/-)
Minimal Impact
Biodiversity, including flora,
fauna, ecosystems and the services
they provide and landscapes
Strategy intends to address impacts
of climate change on biodiversity,
and also to make use of
Ecosystem-based solutions.
Use of NbS and
increased
resilience of
ecosystems (+/-
)
Minimal Impact
Cross cutting impacts
Impacts in developing countries
As highlighted above impacts in
developing countries are important
to EU economically (supply chains
/ markets) and socially (family
ties, migration, security). Strategy
aims to support improved climate
resilience of 3rd (not only
developing) countries.
Impact on third
countries and
international
relations (+/-)
Minimal Impact
ACTION 14: Ensuring the availability of fresh water.
MEASURE 14.1: Continue to use the Common Implementation Strategy to improve policy implementation for securing sustainable water use across
sectors, through improvements to and intensification of among others: water resource allocation, water-permitting systems, cost recovery
through water pricing incorporating externalities, or cost recovery rate calculations.
Baseline, context and rationale
To achieve sustainable protection and use of water resources, which will become even more important due to climate change, it is particularly relevant
to ensure the security of supply for citizens, and a balanced and coherent approach to the sometimes competing uses of water by different sectors.
Energy and agriculture are particularly pertinent in this respect and may clash with environmental protection. For example, wasteful/excessive water
use in agriculture is a challenge for both water (and its alternative uses) and food security. Water reuse and efficient and sustainable irrigation can help
reduce the agricultural water footprint and bring environmental and societal benefits only provided they are implemented in a sustainable system,
230
where environmental water flows are ensured. It will also be necessary to consider how further integration of water legislation with other policy areas
can best be advanced in a mutually supportive way; this is especially important in view of the emerging challenges for water management caused by
climate change and pollutants of emerging concern.
Interviews: One expert interviewed for this study thought that binding targets in the EU Adaptation Strategy should be linked to other policies (e.g.
Water Framework Directive). Several experts expressed that water scarcity problems are not just problems in the South, but in all of Europe, and that
Southern Member States have relevant knowledge on managing water scarcity that can be shared with Northern Member States.
OPC: Over half of respondents to the OPC reported experiencing restrictions on water availability due to prolonged drought in their place of residence
due to climate change (54%), even more reported experiencing river and coastal floods (65%). Furthermore, the majority of respondents strongly
agreed that further action for sustainable adaptation to climate change is needed within the new Strategy for the water sector (75%).
Objectives and actions:
Further support implementation of the relevant existing CIS Guidance documents (e.g. CIS Guidance on water balances, environmental flows, etc.),
revise or develop new guidelines and share good practice under CIS for sustainable use of water resources across sectors (including ensuring
environmental flows) based on Commission’s own analysis and other existing studies (including OECD work), explore the best policy mix of
improvements to and intensification of, among others:
Water resource allocation. (in particular, water should not be monopolised by particular sectors, e.g. through the use of grey infrastructure like
water reservoirs, which can be observed in some regions).
Water permitting systems
Cost recovery through water pricing, incorporating externalities
Cost recovery rate calculations according to Art 9 of the WFD349
.
Impact pathways
349 A CIS Ad hoc Task Group on economics has recently been set up in the area of financing of measures under the WFD and the FD; in addition, two ongoing studies are relevant (1) on a mapping of economic data (including how cost recovery is applied in Member States), this will also serve as a building block for (2) a study with the OECD on investment needs (specifically for the WFD and the FD), which will start 2nd half of 2020.
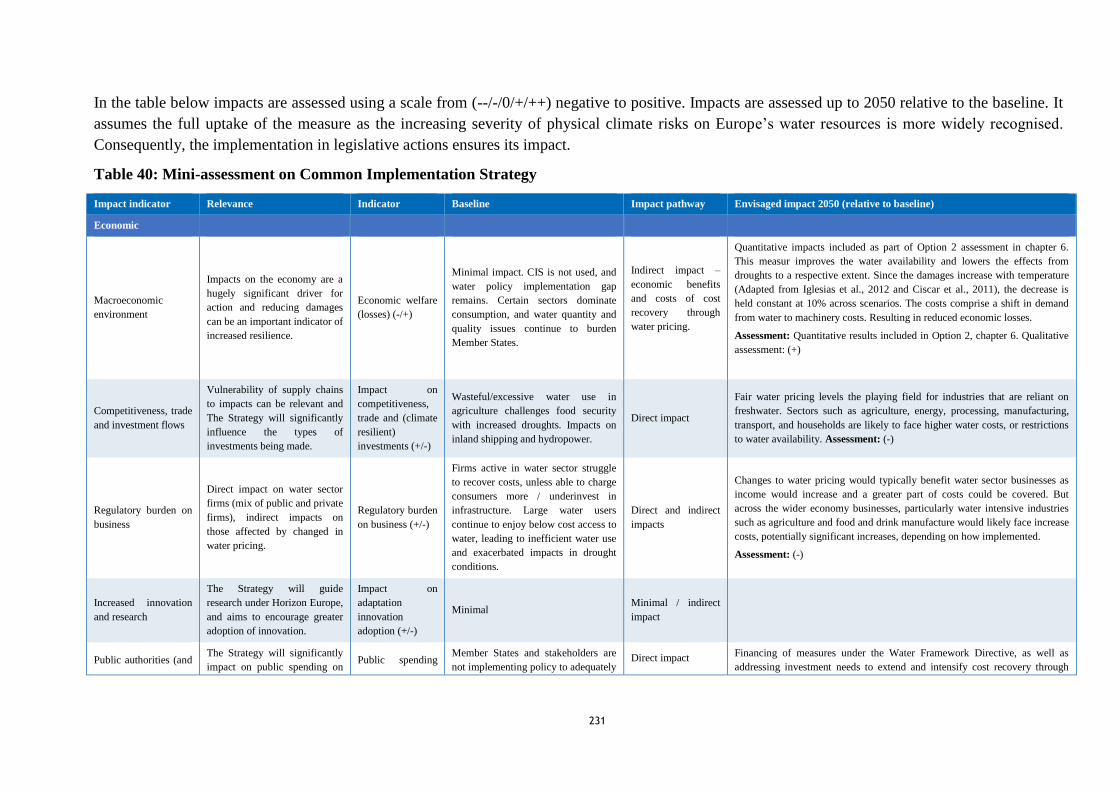
231
In the table below impacts are assessed using a scale from (--/-/0/+/++) negative to positive. Impacts are assessed up to 2050 relative to the baseline. It
assumes the full uptake of the measure as the increasing severity of physical climate risks on Europe’s water resources is more widely recognised.
Consequently, the implementation in legislative actions ensures its impact.
Table 40: Mini-assessment on Common Implementation Strategy
Impact indicator Relevance Indicator Baseline Impact pathway Envisaged impact 2050 (relative to baseline)
Economic
Macroeconomic
environment
Impacts on the economy are a
hugely significant driver for
action and reducing damages
can be an important indicator of
increased resilience.
Economic welfare
(losses) (-/+)
Minimal impact. CIS is not used, and
water policy implementation gap
remains. Certain sectors dominate
consumption, and water quantity and
quality issues continue to burden
Member States.
Indirect impact –
economic benefits
and costs of cost
recovery through
water pricing.
Quantitative impacts included as part of Option 2 assessment in chapter 6.
This measur improves the water availability and lowers the effects from
droughts to a respective extent. Since the damages increase with temperature
(Adapted from Iglesias et al., 2012 and Ciscar et al., 2011), the decrease is
held constant at 10% across scenarios. The costs comprise a shift in demand
from water to machinery costs. Resulting in reduced economic losses.
Assessment: Quantitative results included in Option 2, chapter 6. Qualitative
assessment: (+)
Competitiveness, trade
and investment flows
Vulnerability of supply chains
to impacts can be relevant and
The Strategy will significantly
influence the types of
investments being made.
Impact on
competitiveness,
trade and (climate
resilient)
investments (+/-)
Wasteful/excessive water use in
agriculture challenges food security
with increased droughts. Impacts on
inland shipping and hydropower.
Direct impact
Fair water pricing levels the playing field for industries that are reliant on
freshwater. Sectors such as agriculture, energy, processing, manufacturing,
transport, and households are likely to face higher water costs, or restrictions
to water availability. Assessment: (-)
Regulatory burden on
business
Direct impact on water sector
firms (mix of public and private
firms), indirect impacts on
those affected by changed in
water pricing.
Regulatory burden
on business (+/-)
Firms active in water sector struggle
to recover costs, unless able to charge
consumers more / underinvest in
infrastructure. Large water users
continue to enjoy below cost access to
water, leading to inefficient water use
and exacerbated impacts in drought
conditions.
Direct and indirect
impacts
Changes to water pricing would typically benefit water sector businesses as
income would increase and a greater part of costs could be covered. But
across the wider economy businesses, particularly water intensive industries
such as agriculture and food and drink manufacture would likely face increase
costs, potentially significant increases, depending on how implemented.
Assessment: (-)
Increased innovation
and research
The Strategy will guide
research under Horizon Europe,
and aims to encourage greater
adoption of innovation.
Impact on
adaptation
innovation
adoption (+/-)
Minimal Minimal / indirect
impact
Public authorities (and The Strategy will significantly
impact on public spending on Public spending
Member States and stakeholders are
not implementing policy to adequately Direct impact
Financing of measures under the Water Framework Directive, as well as
addressing investment needs to extend and intensify cost recovery through

232
budgets) climate resilience, primarily
through indirect routes.
on adaptation (€) address water security issues. There is
not enough support for water resource
allocation and management plans.
Cost recovery incorporating
environmental and resource costs is
not widely done across Member
States, and what actions is being taken
isn’t transparent or using a
harmonised methodology.
water pricing.
Assessment: (+)
Social impacts
Employment
Impacts on the economy and
in-turn on employment are a
hugely significant driver for
action and reducing damages
and job losses can be an
important indicator of increased
resilience.
Employment
(FTE) Minimal impact Included in modelling results for Option 2 in chapter 6
Income distribution,
social protection and
social inclusion (of
particular groups)
Distributional impacts of
climate change can be
significant, the Strategy is
intended to address and
mitigate inequalities, including
through better informing
citizens and encouraging
action. Needs to address
broader questions of equity (see
other impacts) such as location,
economic and social cohesion,
gender and also of fundamental
rights.
Distributional and
equity impacts
(+/-)
Water flows affect food security, and
scarcity could lead to increased food
prices as well as less water available
to marginalized groups. Less water
available for human use.
Indirect impact
Water is a basic need, and securing water across sectors ensures the continued
access to freshwater for all EU Citizens, especially those most vulnerable to
the water related impacts of climate change.
Assessment: (+)
Public health & safety
and health systems
Increased resilience of public
health and safety systems is an
important goal of the Strategy.
Impact on public
health and civil
emergency
systems (+/-)
Water quality and quantity is not
ensured for public use in future
scenarios.
Targeted direct
impact.
Climate change is projected to exacerbate droughts, intensify flooding,
overflow urban drainage systems, increase saltwater intrusion and sea level
rise, and change water quality conditions by increasing temperatures in
sources and pipelines. Additionally, urbanisation likely to augment water
demand issues with stress in urbanised areas and overcapacity in rural
regions. Future water supplies reliant on surface and ground water will be
impacted. Improving policy implementation supports water supply managers
in critical regions, ensuring access to water for human use.

233
Assessment: (+)
Environmental impacts
The climate
Critical impact targeted by the
strategy. Increase of resilience
to climate impacts and
preventing climate risks. Also
potential synergies with
mitigation may be worth
considering.
Impact on climate
resilience (+/-)
(possible) Synergy
with climate
mitigation (+/-)
The latest projections suggest that the
current level of implementation may
not be sufficient to prevent and
manage the ongoing impacts of the
climate crisis.
Direct Impact
Increase resilience of Member States to climate impacts on water quantity, by
adapting sectors to increasing supply pressures.
Assessment: (++)
Quality of natural
resources/fighting
pollution (water, soil,
air etc.)
Strategy intends to address
impacts of climate change on
natural resources, e.g. forests,
agriculture, marine
environment.
Impact on natural
resource resilience
(+/-)
EU faces water scarcity and water
quality issues, as sectors reliant on
heavy water use (agriculture, energy)
continue to use water at an excessive
rate, there will be less water available
for non-human use. Competition for
water as a natural resource.
Direct Impact
Reduces the competition for water between industry and environmental
protection. Wasteful and excessive water use is challenged, and sectors adapt
to become use water more efficiently.
Assessment: (+)
Biodiversity, including
flora, fauna,
ecosystems and the
services they provide
and landscapes
Strategy intends to address
impacts of climate change on
biodiversity, and also to make
use of Ecosystem-based
solutions.
Use of ecosystem-
based solutions
and increased
resilience of
ecosystems (+/-)
Less water available to ecosystems. Direct Impact
Environmental water flows are ensured, and externalities are incorporated into
water pricing.
Assessment: (+)
Cross cutting impacts
Impacts in developing
countries
As highlighted above impacts
in developing countries are
important to EU economically
(supply chains / markets) and
socially (family ties, migration,
security). Strategy aims to
support improved climate
resilience of 3rd (not only
developing) countries.
Impact on third
countries and
international
relations (+/-)
No impact, is EU focused No impact, is EU
focused

234
MEASURE 14.3: Reduce exposure to contaminated or acutely polluted water due to climate impacts such as low flows, higher water temperature or
flooding, and also to ensure availability of adequate quantities of tap water
Baseline, context and rationale
Climate change leads to a higher frequency and intensity of water quantity-related extreme events, namely floods and droughts. Preparation for such
events requires other types of actions than preparing for gradual changes, starting from better predicting their occurrence through planning
preparedness measures all the way to upgrading relevant infrastructure, such as inland navigation.
There are also significant health concerns over predicted changes in both water quantity and quality as climate change is projected to shrink water
resources, reduce self-purification capacity of freshwater basins (warmer water has less dissolved oxygen and decreased flows fewer dilution capacity),
increase risks of water pollution and pathogen contamination in many parts of Europe (floods, sewer overflows, more pesticide use, higher
concentration of pollutants during periods of drought - e.g. the rise of Vibriosis infections in the Baltic Sea area). Thus, there are important water safety
vulnerabilities, which translate into growing human health risks. For these reasons, the WHO ‘Health in Climate’ working group considers water safety
a matter of high priority. The notion of water safety could be extended to quantitative issues with drinking water, as not all Member States have clear
strategies in place to secure that their water suppliers take actions to prevent disruptions in water supply. Under the revised Drinking Water Directive,
however, Member States are required to carry out hazard and risk assessments on water quality (which can be impacted by water quantity as explained
above) also with a view on climate change impacts.
Interviews: One expert interviewed for this study thought that binding targets in the EU Adaptation Strategy should be linked to other policies (e.g.
Water Framework Directive). Several experts expressed that water scarcity problems are not just problems in the South, but in all of Europe, and that
Southern Member States have relevant knowledge on managing water scarcity that can be shared with Northern Member States.
OPC: Over half of respondents to the OPC reported experiencing restrictions on water availability due to prolonged drought in their place of residence
due to climate change (54%), even more reported experiencing river and coastal floods (65%). Furthermore, the majority of respondents strongly
agreed that further action for sustainable adaptation to climate change is needed within the new Strategy for the water sector (75%).
Description of measure
Objectives and actions

235
o Ensure that short term acute water pollution and contamination issues for situations that could arise from climate change impacts are taken
into account under the new risk based approach under Article 7 of the revised Drinking Water Directive.
o Consider the exploration of further integrating climate change impacts into already established framework plans, as well as WHO’s Water
Safety Plans and Sanitation Safety Plans, including quantitative aspects, especially once first implementation results from the new Drinking
Water Directive are available and as part of the revision of the Urban Waste Water Treatment Directive.
Impact pathways
In the table below impacts are assessed using a scale from (--/-/0/+/++) negative to positive. Impacts are assessed up to 2050 relative to the baseline.
The table below highlights the main impact pathways targeted or expected. It is primarily an information tool that hopes to address weaknesses in
understanding and knowledge of vulnerabilities, risks and solutions and in doing so lead to better-informed decision making by actors across sectors.
This is also aimed to (indirectly) spur action by Member States, specific economic sectors in order to increase resilience and reduce impacts for
vulnerable groups.
Table 41:Mini-assessment on Promoting the inclusion of climate aspects in already established framework plans, including in Water Safety
Plans
Impact indicator Relevance Indicator Baseline Water impact
pathway
Envisaged impact 2050 (relative to
baseline)
Economic
Macroeconomic
environment
Impacts on the economy are a hugely
significant driver for action and reducing
damages can be an important indicator of
increased resilience.
Economic welfare (losses) (-/+)
The economy faces risks to water
quality and quantity and a secure
supply of potable water.
Indirect impact
Water Safety plans covering also
quantitative issues and other water quality
guidance ensure the safety of a drinking
water supply and benefit SMEs and industry.
Assessment: (+)
Competitiveness,
trade and investment
flows
Vulnerability of supply chains to impacts
can be relevant and The Strategy will
significantly influence the types of
investments being made.
Impact on competitiveness, trade and
(climate resilient) investments (+/-)
Impact on industries reliant on
safe drinking water. Indirect impact
Cleaner water and higher availability and
resilience will benefit sectors, but may come
at risk of higher costs.
Assessment: (0)
Regulatory burden
on business
Improvements to water cleanliness and
availability will benefit firms. The costs
for implementing plans are likely to
Regulatory burden on business (+/-) Minimal impact. Indirect impact Improvements to plans may lead to
additional health and safety requirements for
firms in the water sector and major water
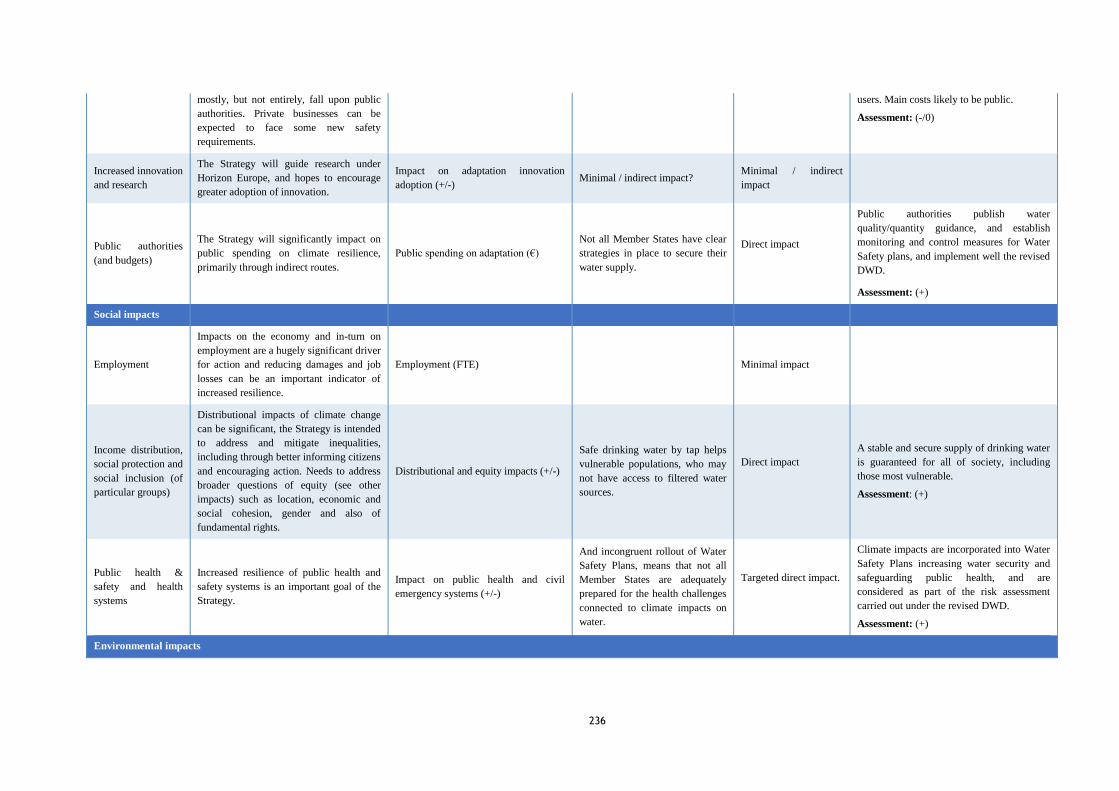
236
mostly, but not entirely, fall upon public
authorities. Private businesses can be
expected to face some new safety
requirements.
users. Main costs likely to be public.
Assessment: (-/0)
Increased innovation
and research
The Strategy will guide research under
Horizon Europe, and hopes to encourage
greater adoption of innovation.
Impact on adaptation innovation
adoption (+/-) Minimal / indirect impact?
Minimal / indirect
impact
Public authorities
(and budgets)
The Strategy will significantly impact on
public spending on climate resilience,
primarily through indirect routes.
Public spending on adaptation (€)
Not all Member States have clear
strategies in place to secure their
water supply.
Direct impact
Public authorities publish water
quality/quantity guidance, and establish
monitoring and control measures for Water
Safety plans, and implement well the revised
DWD.
Assessment: (+)
Social impacts
Employment
Impacts on the economy and in-turn on
employment are a hugely significant driver
for action and reducing damages and job
losses can be an important indicator of
increased resilience.
Employment (FTE) Minimal impact
Income distribution,
social protection and
social inclusion (of
particular groups)
Distributional impacts of climate change
can be significant, the Strategy is intended
to address and mitigate inequalities,
including through better informing citizens
and encouraging action. Needs to address
broader questions of equity (see other
impacts) such as location, economic and
social cohesion, gender and also of
fundamental rights.
Distributional and equity impacts (+/-)
Safe drinking water by tap helps
vulnerable populations, who may
not have access to filtered water
sources.
Direct impact
A stable and secure supply of drinking water
is guaranteed for all of society, including
those most vulnerable.
Assessment: (+)
Public health &
safety and health
systems
Increased resilience of public health and
safety systems is an important goal of the
Strategy.
Impact on public health and civil
emergency systems (+/-)
And incongruent rollout of Water
Safety Plans, means that not all
Member States are adequately
prepared for the health challenges
connected to climate impacts on
water.
Targeted direct impact.
Climate impacts are incorporated into Water
Safety Plans increasing water security and
safeguarding public health, and are
considered as part of the risk assessment
carried out under the revised DWD.
Assessment: (+)
Environmental impacts

237
The climate
Critical impact targeted by the strategy.
Increase of resilience to climate impacts
and preventing climate risks. Also
potential synergies with mitigation may be
worth considering.
Impact on climate resilience (+/-)
(possible) Synergy with climate
mitigation (+/-)
Climate change will require rapid
response to events that cause an
immediate threat to water
quality350 and quantity.
Targeted indirect
impact.
Increased resilience to impacts of climate
change by reducing exposure through
implementation of clear water supply
strategies.
Assessment: (+)
Quality of natural
resources/fighting
pollution (water,
soil, air etc.)
Strategy intends to address impacts of
climate change on natural resources, e.g.
forests, agriculture, marine environment.
Impact on natural resource resilience
(+/-)
Water quality continues to
degrade under increased
temperatures, infrastructure
leakages, flooding, and exposure
to contaminants.
Targeted indirect
impact.
Water quality is protected by reducing
exposure to contaminated/polluted water due
to climate impacts.
Assessment: (+)
Biodiversity,
including flora,
fauna, ecosystems
and the services they
provide and
landscapes
Strategy intends to address impacts of
climate change on biodiversity, and also to
make use of Ecosystem-based solutions.
Use of ecosystem-based solutions and
increased resilience of ecosystems (+/-)
Ecosystems will face drought,
flooding, and pollution,
negatively impacting the
biodiversity they contain.
Targeted indirect
impact.
Climate impacts are incorporated into water
quality and quantity governance, improving
ecosystem health which is also dependent on
clean and continuous water flows.
Additionally, ecosystem service can be
explored to increase water quality, and
prevent evaporation/desertification.
Assessment: (+)
Cross cutting impacts
Impacts in
developing countries
As highlighted above impacts in
developing countries are important to EU
economically (supply chains / markets)
and socially (family ties, migration,
security). Strategy hopes to support
improved climate resilience of 3rd (not
only developing) countries.
Impact on third countries and
international relations (+/-) No impact, is EU focused
No impact, is EU
focused
Some key reports in the field
350 Mesquita, E., João, M. R., Menaia, J., Kardinaal, E., Eikebrokk, B., & Smeets, P. (2013). Adapted operation of drinking water systems to cope with climate change. 103.
http://www.prepared-fp7.eu/viewer/file.aspx?FileInfoID=369

238
CIS Guidance document No. 24 (2009). River basin management in a changing climate. https://circabc.europa.eu/sd/a/a88369ef-df4d-43b1-8c8c-
306ac7c2d6e1/Guidance%20document%20n%2024%20-%20River%20Basin%20Management%20in%20a%20Changing%20Climate_FINAL.pdf
European Environment Agency (2020). Use of freshwater resources in Europe (incl. Water exploitation index plus (WEI+) for river basin districts)
https://www.eea.europa.eu/ds_resolveuid/IND-11-en
Mesquita, E., João, M. R., Menaia, J., Kardinaal, E., Eikebrokk, B., & Smeets, P. (2013). Adapted operation of drinking water systems to cope with
climate change. 103. http://www.prepared-fp7.eu/viewer/file.aspx?FileInfoID=369
Rosén, L., Hokstad, P., Lindhe, A., & Sklet, S. (2007). Generic Framework and Methods for Integrated Risk Management in Water Safety Plans.
Techneau, June, 107.
Rustler, M., Grützmacher, G., Meseguer, J., Cembrano, G., & Escaler, I. (2012). Decision Support Systems for water resource planning under
climate change conditions Conceptual framework.

239
Annex 8: Legal basis for EU action in climate change adaptation
Table 42: Legal instruments in suport of EU action in climate change adaptation
Legal basis Legal
instruments Mandate for the EU
to act Commentary
EU
leg
al in
stru
ments
Treaty on the
Functioning of
the European
Union (TFEU)351
Articles 191 and
192(1) TFEU In accordance with Articles 191 and 192(1) TFEU, the European Union
shall contribute to the pursuit, inter alia, of the following objectives:
preserving, protecting and improving the quality of the environment,
promoting measures at international level to deal with regional or
worldwide environmental problems, and in particular combating
climate change.
Article 212 on
Economic, Financial
and Technical
Cooperation with
Third Countries.
Giving legal basis for more ambitious international cooperation
objective under the new strategy. Spillover effects of climate change
and trade relationships with third countries makes international
action in climate change adaptation “consistent with the
development policy of the Union” as stipulated in the article.
Inte
rnatio
nal le
gal in
stru
ments
Paris Agreement
Article 7.1 Parties hereby establish the global goal on adaptation of enhancing
adaptive capacity, strengthening resilience and reducing vulnerability
to climate change, with a view to contributing to sustainable
development and ensuring an adequate adaptation response in the
context of the temperature goal referred to in Article 2.
Article 7.7 Parties should strengthen their cooperation on enhancing action on
adaptation, taking into account the Cancun Adaptation Framework.
Article 7.9
Each Party shall, as appropriate, engage in adaptation planning
processes and the implementation of actions, including the
development or enhancement of relevant plans, policies and/or
contributions.
Article 7.10 and 7.11 Each Party should submit and update periodically an adaptation
communication, which may include information on its priorities,
implementation and support needs, plans and actions.
Article 13.7 and 13.14 According to the transparency framework, all parties should provide
information related to climate change impacts and adaptation under
Article 7, as appropriate. Support shall be provided to developing
countries for the implementation of this Article.
United Nations
Framework
Convention on
Climate Change
Decision 9/CMA.1 of
the Conference of
the Parties352
The Conference of the Parties serving as the meeting of the Parties
to the Paris Agreement, recalling relevant provisions of the
Convention and the Paris Agreement, in particular Article 7, notes
that the purpose of the adaptation communication is to: (a) Increase
the visibility and profile of adaptation and its balance with mitigation;
(b) Strengthen adaptation action and support for developing
countries; (c) Provide input to the global stocktake; (d) Enhance
learning and understanding of adaptation needs and actions
351 European Council (2012) Consolidated version of the Treaty on the Functioning of the European Union, 2012/C 326/01, available at - https://eur-lex.europa.eu/legal-content/EN/TXT/?uri=celex%3A12012E%2FTXT 352 UNFCC (2019) Report of the Conference of the Parties serving as the meeting of the Parties to the Paris Agreement on the
Third part of its first session, held in Katowice, FCCC/PA/CMA/2018/3/Add.1, available at – https://unfccc.int/sites/default/files/resource/cma2018_03a01E.pdf.
Further details on adaptation communication and its elements are available:
https://unfccc.int/sites/default/files/resource/cma2018_03a01E.pdf

Annex 9: Climate change and its impacts
Climate change is already occurring and its impacts felt across the world. Europe has warmed
faster than any other continent over recent decades with European temperature almost 2°C
above temperatures of the latter half of the 19th century353
, with impacts and adaptation needs
that we are feeling already now and that are expected to grow.
The past five years were the warmest on record354
, with global average temperature reaching
1.1°C above pre-industrial levels in 2019. Human-induced global warming is presently
increasing at a rate of 0.2°C per decade355
. However, temperature increase is not the same
everywhere. Regions for example the Arctic regions are warming faster and if current trends
continue, there is a risk for cascading tipping points.
The effects of rising temperatures and greenhouse gas emissions are being felt in Europe and
around the world. Heatwaves were the deadliest meteorological hazard in the 2015–2019
period356
and are becoming more intense in Europe. In summer 2019 they led to more deaths
than the seasonal average in parts of Europe as temperatures broke records in several
countries, including a new record of over 34°C above the Arctic Circle. In Europe almost all
years since 2000 show above-average fire danger, with a number of associated disastrous
events in the recent past, such as Pedrógão Grande wildfires (Portugal) in 2017, wildfires in
Attica (Greece) in 2018 with 102 lost human lives, and the Scandinavian fire season in 2018.
There is a strong possibility that global warming will reach and overshoot 1.5°C, at least
temporarily, before temperatures can be reduced again, raising the question of what it means
for warming to cross the global 1.5°C threshold, and how impacts and the adaptation
challenge in Europe will evolve. In examining these issues, this section builds upon section
5.9 of the in-depth analysis in support of the Commission Communication on the EU long
term strategy357
and updates findings since 2018.
1. Global impacts due to climate change
The recent reports of the IPCC358
find that robust differences in climate characteristics are
projected between the present-day and global warming of 1.5°C, and between 1.5°C and 2°C.
The main differences in impacts between these warming levels are examined systematically in
SR1.5. Further detail is provided in the subsequent IPCC reports on climate change and land
(SRCCL) and on ocean and cryosphere in a changing climate (SROCC). SRCCL finds that
risks associated with permafrost degradation, wildfire, coastal degradation and stability of
353 Copernicus Climate Change Service (2019). European State of the Climate, 2019.
https://climate.copernicus.eu/ESOTC/2019/surface-temperature
Note that land has warmed more rapidly than the ocean. Therefore, most populated regions of the world have experienced warming above the global average. However, Europe has warmed more than other regions. 354 WMO Statement on the State of the Climate in 2019 355 IPCC Special Report on Global Warming of 1.5°C (2018). Section 1.1 356 United in Science (2019), High-level synthesis report of latest climate science information convened by the Science Advisory Group of
the UN Climate Action Summit 2019. https://public.wmo.int/en/resources/united_in_science 357 https://ec.europa.eu/clima/sites/clima/files/docs/pages/com_2018_733_analysis_in_support_en_0.pdf 358 Special Report on Global Warming of 1.5°C – SR15 (2018), Special Report on Climate Change and Land – SRCCL (2019) and Special
Report on Ocean and Cryosphere in a Changing Climate – SROCC (2019)
241
food systems are high at 1.5°C, while risks associated with soil erosion, vegetation loss, and
change in nutrition become high at higher temperature thresholds due to increased possibility
for adaptation. SROCC focuses largely on differences in impacts between a below 2°C
scenario and a high emissions scenario359
and shows that keeping warming below 2°C will
lead to multi-metre differences in sea-level rise beyond 2100. Limiting warming will also
slow ice loss and reduce impacts on the ocean (such as marine heatwaves and acidification
due to the ocean’s absorption of CO2) which in turn harm marine life and fisheries. Limiting
warming to 1.5°C therefore increases the chances of ecosystem-based adaptation measures
(such as wetland preservation and restoration) proving effective.
On the issue of Earth system tipping points, such as slowdown of the Atlantic Meridional
Overturning Circulation (Gulf Stream) or instability of the Greenland and West Antarctic ice
sheets, SR1.5 finds greater risks at lower temperatures compared to the previous (fifth)
assessment report of IPCC, with moderate risk at 1°C of warming and high risk at 2.5°C of
warming. While the IPCC does not explicitly label global warming of 1.5°C as an Earth
system tipping point, there is abundant evidence that impacts and risks are greater at higher
temperatures (every tenth of a degree matters). For example, articles such as Lenton et al.
(2019)360
make a precautionary case for keeping global warming as low as possible on the
basis that while low probability, high impact events are little understood, science has
progressively assessed them as being more likely at lower temperatures as knowledge has
improved.
The Council conclusions on Climate Diplomacy361
underline that climate change multiplies
threats to international stability and security in particular affecting those in most fragile and
vulnerable situations, reinforcing environmental pressures and disaster risk, contributing to
the loss of livelihoods and forcing the displacement of people.
359 These are scenarios RCP2.6 and RCP8.5 respectively. Warming under RCP8.5 is widely considered to be greater than current business-as-
usual scenarios. 360 Lenton, M., et al. (2019). Climate tipping points — too risky to bet against. Nature | Vol 575 | 28 November 2019. 361 Council conclusions on Climate Diplomacy, ST-5033-2020 of 20 January 2020,
https://data.consilium.europa.eu/doc/document/ST-5033-2020-INIT/en/pdf

242
Table 43: Selected Climate Change Impacts to Natural Systems at 1.5°C & 2°C warming
At 2°C At 1.5°C
Extreme hot days 4°C hotter 3°C hotter
Sea level rise by 2100 around 0.1m more than at 1.5°C
(less time to adapt) 0.26-0.77m
Ecosystems
13% of global land area changes
from one ecosystem type to
another
area at risk ~50% lower than at
2°C
Habitat Loss
18% of insects, 16% of plants and
8% of vertebrates lose over half
their climatically determined
geographic range
6% of insects, 8% of plants and
4% of vertebrates lose over half
their climatically determined
geographic range
Permafrost thawing 1.5 – 2.5 million km
2 greater than
at 1.5°C
Woody shrubs encroaching into
the tundra already at 1°C
Arctic Ocean At least one sea ice-free summer
per decade
One sea ice-free summer per
century
Coral reefs largely disappear (>99% loss) decline by 70-90%
Fisheries
Global annual marine catch
(one model)
over 3 million tonnes lower 1.5 million tonnes lower
Greater risk at 2°C than 1.5°C is specified but not quantified362
Droughts and precipitation deficits;
Heavy precipitation events;
Heavy precipitation associated with tropical cyclones;
Larger area affected by flood hazards due to precipitation;
Spread of invasive species
Forest fires
Marine ice sheet instability in Antarctica and/or irreversible loss of the Greenland ice sheet could be
triggered around 1.5°C to 2°C of global warming
Oceans (greater risk at 2°C spanning several impacts including species range shift and impacts of
ocean acidification on marine species)
Note: Impacts above are attributed a confidence level of at least medium in the IPCC report’s Summary for
Policymakers
Source: IPCC Special Report on global warming of 1.5°C
362 Some of these impacts are regional rather than global, though regions in this context are large. E.g. heavy precipitation events are projected to be higher in northern hemisphere high latitude/high elevation regions, eastern Asia and eastern North America. More specific
phenomena within these categories may be quantified in the underlying IPCC report.
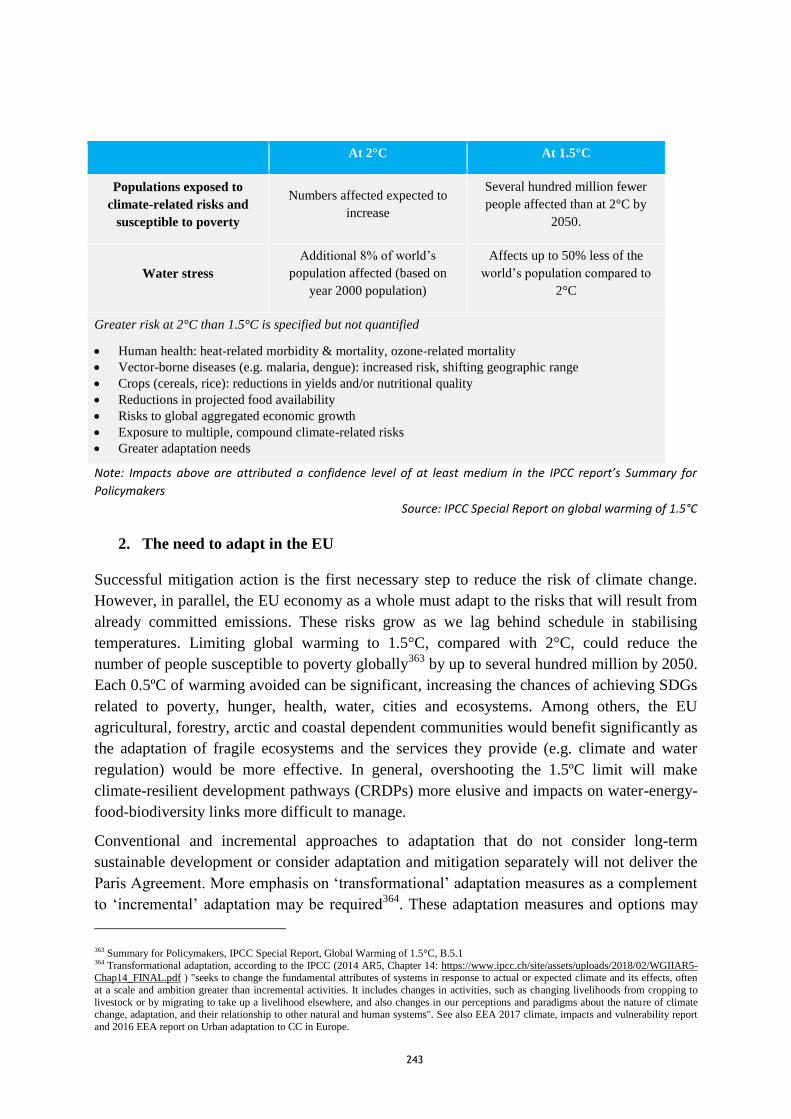
243
At 2°C At 1.5°C
Populations exposed to
climate-related risks and
susceptible to poverty
Numbers affected expected to
increase
Several hundred million fewer
people affected than at 2°C by
2050.
Water stress
Additional 8% of world’s
population affected (based on
year 2000 population)
Affects up to 50% less of the
world’s population compared to
2°C
Greater risk at 2°C than 1.5°C is specified but not quantified
Human health: heat-related morbidity & mortality, ozone-related mortality
Vector-borne diseases (e.g. malaria, dengue): increased risk, shifting geographic range
Crops (cereals, rice): reductions in yields and/or nutritional quality
Reductions in projected food availability
Risks to global aggregated economic growth
Exposure to multiple, compound climate-related risks
Greater adaptation needs
Note: Impacts above are attributed a confidence level of at least medium in the IPCC report’s Summary for
Policymakers
Source: IPCC Special Report on global warming of 1.5°C
2. The need to adapt in the EU
Successful mitigation action is the first necessary step to reduce the risk of climate change.
However, in parallel, the EU economy as a whole must adapt to the risks that will result from
already committed emissions. These risks grow as we lag behind schedule in stabilising
temperatures. Limiting global warming to 1.5°C, compared with 2°C, could reduce the
number of people susceptible to poverty globally363
by up to several hundred million by 2050.
Each 0.5ºC of warming avoided can be significant, increasing the chances of achieving SDGs
related to poverty, hunger, health, water, cities and ecosystems. Among others, the EU
agricultural, forestry, arctic and coastal dependent communities would benefit significantly as
the adaptation of fragile ecosystems and the services they provide (e.g. climate and water
regulation) would be more effective. In general, overshooting the 1.5ºC limit will make
climate-resilient development pathways (CRDPs) more elusive and impacts on water-energy-
food-biodiversity links more difficult to manage.
Conventional and incremental approaches to adaptation that do not consider long-term
sustainable development or consider adaptation and mitigation separately will not deliver the
Paris Agreement. More emphasis on ‘transformational’ adaptation measures as a complement
to ‘incremental’ adaptation may be required364
. These adaptation measures and options may
363 Summary for Policymakers, IPCC Special Report, Global Warming of 1.5°C, B.5.1 364 Transformational adaptation, according to the IPCC (2014 AR5, Chapter 14: https://www.ipcc.ch/site/assets/uploads/2018/02/WGIIAR5-
Chap14_FINAL.pdf ) "seeks to change the fundamental attributes of systems in response to actual or expected climate and its effects, often
at a scale and ambition greater than incremental activities. It includes changes in activities, such as changing livelihoods from cropping to
livestock or by migrating to take up a livelihood elsewhere, and also changes in our perceptions and paradigms about the nature of climate change, adaptation, and their relationship to other natural and human systems". See also EEA 2017 climate, impacts and vulnerability report
and 2016 EEA report on Urban adaptation to CC in Europe.
244
include not only “hard” structural and physical measures (e.g. coastal protection,
infrastructure) but also “soft” social policies (e.g. awareness, health services) and governance
improvements (e.g. implementation, cross-sector coordination, mainstreaming). A
combination of both “hard” and “soft” adaptation may produce best results365
, and joining
efforts from several EU Member States may also improve protection, e.g. monitoring and
mapping jointly coastal and terrestrial areas for a more reliable early warning of extreme
weather366
.
It is necessary to better integrate long-term planning of emissions reduction and adaptation:
a) Adaptation provides opportunities and economic and social stability – climate
change will interact with other socio-economic developments367
. It can be expected
that climate change adaptation projects or the impact of climate extremes will involve
a higher level of public intervention than today368
, which calls for effective and
efficient adaptation strategies, particularly at local scale. Public resources may be
severely drained if the climate reaches certain tipping points369
. On the other hand,
both public and private investments in adaptation provide opportunities and risk
management opportunities that can spur the creation of market niches: e.g. for climate
services or green infrastructure. In addition, supporting adaptation in developing
countries may also bring stability and security within the EU's borders. The New EU
Strategy on Adaptation to Climate Change will have a prominent international
dimension.
b) There are co-benefits and, if done incorrectly, trade-offs between mitigation and
adaptation – so both policies must be developed together as components of any
credible long-term climate action. Early integration of both adaptation and mitigation
in coherent climate-resilient development pathways entails that specific vulnerabilities
are factored in when a given economic sectors starts implementing a decarbonisation
strategy. For instance, adaptation must ensure that low-emission agricultural
techniques withstand higher temperatures, it must lead to renewable electricity
networks that are climate-resilient and protect forests so that they keep functioning as
carbon sinks. Transformative climate action in cities, in particular, depends on the
right mix of mitigation and adaptation actions to both protect citizens against climate
impacts and enable emissions reduction within stringent legal and budgetary
boundaries.
(c) Adaptation improves the functionality and resilience of human and natural systems.
Effective adaptation action reduces both the vulnerability and exposure of natural ecosystems
and communities to the risks associated with climate extreme events (floods, wildfires,
365 OECD (2015), Climate Change Risk and Adaptation - Linking Policy and Economics, http://dx.doi.org/10.1787/9789264234611-en 366 For example, a new European seabed map stitched together from surveys originally made for navigation has improved storm surge
forecasts in the North Sea. See: http://www.emodnet.eu/improving-storm-surge-modelling-north-sea 367 EEA (2017), Climate change, impacts and vulnerabilities in Europe 2016,
https://www.eea.europa.eu/publications/climate-change-impacts-and-vulnerability-2016 368 Daniel Bailey (2015), The Environmental Paradox of the Welfare State: The Dynamics of Sustainability, New Political Economy, 20:6,
793-811, DOI: 10.1080/13563467.2015.1079169 369 Steffen et al. (2018), Trajectories of the Earth System in the Anthropocene, Proceedings of the National Academy of Sciences Aug 2018,
115 (33) 8252-8259; DOI: 10.1073/pnas.1810141115

245
hurricanes, etc.), and improves their capacity to recover and re-establish after a climate-
related perturbation. These aspects ensure that the functionality of ecosystems (e.g. absorption
of CO2, provision of services) is maintained over the long-term, or at least that such
functionality is recovered shortly after an extreme event. In 2013, the European Commission
adopted an EU Adaptation Strategy to tackle climate change risks to the EU economy and
society. The 2013 Adaptation Strategy – which will be updated with the New EU Strategy on
Adaptation to Climate Change in Q1 2021 – focuses on developing better knowledge and
understanding of climate impacts, climate proofing of specific sectoral policies and the
promotion of action by Member States and cities through non-legislative means. The recent
evaluation of the Strategy highlighted the urgency for action because of the important risks
facing the EU in certain economic areas370
. For instance:
By the end of the century, under a high emissions scenario371
and without specific
adaptation measures undertaken, the EU could experience a welfare loss of around 2% of
GDP per year by 2100, i.e. EUR 240 billion per year from only six impact sectors
assessed372
:
o Weather-related disasters could affect about two-thirds of the European population
annually (351 million people per year)373
, compared with 5% of the population
between 1981-2010. This would increase the related fatalities per year by fifty
times by the year 2100 (from 3 000 deaths per year presently, to 152 000 deaths
per year by 2100)374
;
o Flooding alone may cost EU countries up to EUR 1 trillion per year in damages by
the end of the century. Most of this would be due to coastal flooding (up to EUR
961 billion). Damages from river flooding could also rise to up to EUR 112 billion
compared to EUR 5 billion today, and there is considerable increase in river flood
risk for Europe even under a 1.5º C warming scenario375
. This could also affect
transport infrastructure. By the end of the century, under a high warming scenario,
about 200 airports and 850 seaports of different size across the EU could face the
risk of inundation due to higher sea levels and extreme weather events.
Climate change is already affecting agriculture production both in direct and indirect
ways: through temperature and precipitation changes, increasing variability, and extremes.
It is also affecting the long-term perspective of agriculture through slow on-setting events
such as soil salinization, soil erosion, land degradation and desertification, and sea-level
rise. This has a direct impact on production and yields, income and livelihoods, as well as
370 Report from the Commission to the European Parliament and the Council on the implementation of the EU Strategy on adaptation to
climate change. 371 In this section, the term "high emissions scenario", unless specified otherwise, refers to the IPCC's Representative Concentration Pathway (RCP) 8.5. In the RCP 8.5 scenario, greenhouse gas emissions continue to rise throughout the 21st century. 372 JRC (2018), Climate Impacts in Europe, Final report of the JRC PESETA III project. doi:10.2760/93257.
https://ec.europa.eu/jrc/en/publication/eur-scientific-and-technical-research-reports/climate-impacts-europe 373 Forzieri et al. (2017), Increasing risk over time of weather-related hazards to the European population: a data-driven prognostic study,
https://doi.org/10.1016/S2542-5196(17)30082-7 374 High emissions scenario, in this particular case, means scenario SRES A1B. 375 Alfieri et al. (2018). Multi-Model Projections of River Flood Risk in Europe under Global Warming. Climate, 2018 6, 16;
doi:10.3390/cli6010016: https://www.mdpi.com/2225-1154/6/1/6/pdf
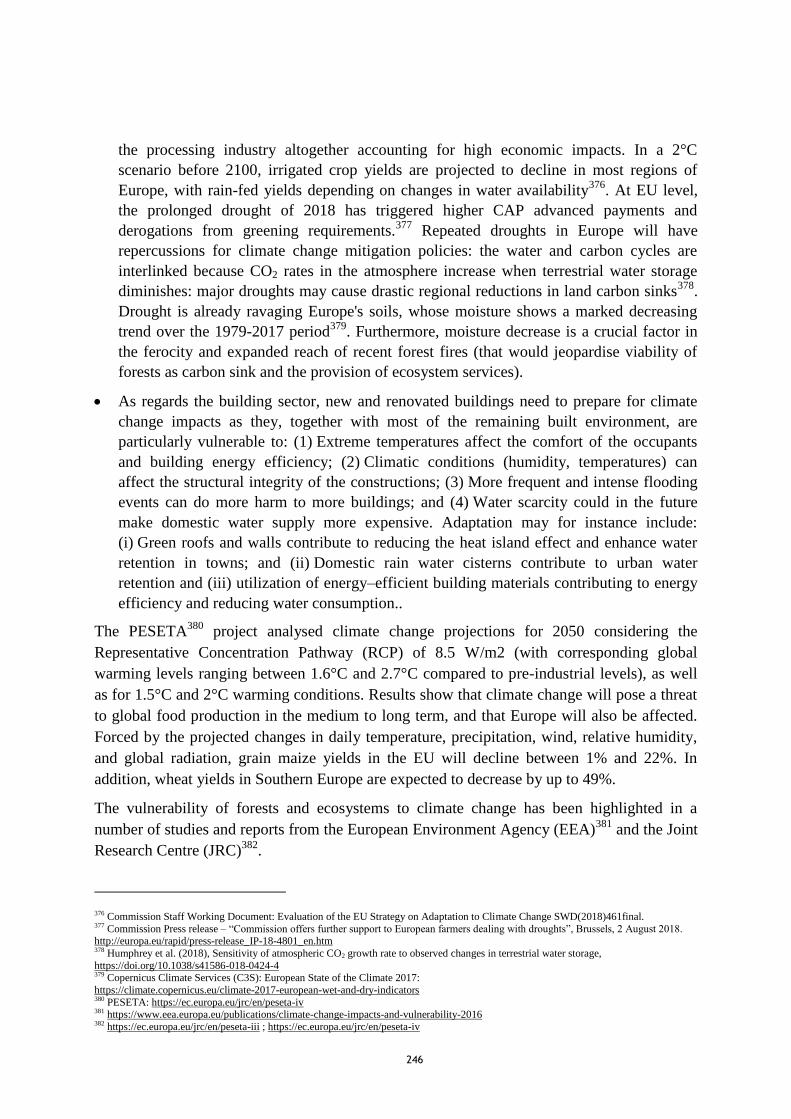
246
the processing industry altogether accounting for high economic impacts. In a 2°C
scenario before 2100, irrigated crop yields are projected to decline in most regions of
Europe, with rain-fed yields depending on changes in water availability376
. At EU level,
the prolonged drought of 2018 has triggered higher CAP advanced payments and
derogations from greening requirements.377
Repeated droughts in Europe will have
repercussions for climate change mitigation policies: the water and carbon cycles are
interlinked because CO2 rates in the atmosphere increase when terrestrial water storage
diminishes: major droughts may cause drastic regional reductions in land carbon sinks378
.
Drought is already ravaging Europe's soils, whose moisture shows a marked decreasing
trend over the 1979-2017 period379
. Furthermore, moisture decrease is a crucial factor in
the ferocity and expanded reach of recent forest fires (that would jeopardise viability of
forests as carbon sink and the provision of ecosystem services).
As regards the building sector, new and renovated buildings need to prepare for climate
change impacts as they, together with most of the remaining built environment, are
particularly vulnerable to: (1) Extreme temperatures affect the comfort of the occupants
and building energy efficiency; (2) Climatic conditions (humidity, temperatures) can
affect the structural integrity of the constructions; (3) More frequent and intense flooding
events can do more harm to more buildings; and (4) Water scarcity could in the future
make domestic water supply more expensive. Adaptation may for instance include:
(i) Green roofs and walls contribute to reducing the heat island effect and enhance water
retention in towns; and (ii) Domestic rain water cisterns contribute to urban water
retention and (iii) utilization of energy–efficient building materials contributing to energy
efficiency and reducing water consumption..
The PESETA380
project analysed climate change projections for 2050 considering the
Representative Concentration Pathway (RCP) of 8.5 W/m2 (with corresponding global
warming levels ranging between 1.6°C and 2.7°C compared to pre-industrial levels), as well
as for 1.5°C and 2°C warming conditions. Results show that climate change will pose a threat
to global food production in the medium to long term, and that Europe will also be affected.
Forced by the projected changes in daily temperature, precipitation, wind, relative humidity,
and global radiation, grain maize yields in the EU will decline between 1% and 22%. In
addition, wheat yields in Southern Europe are expected to decrease by up to 49%.
The vulnerability of forests and ecosystems to climate change has been highlighted in a
number of studies and reports from the European Environment Agency (EEA)381
and the Joint
Research Centre (JRC)382
.
376 Commission Staff Working Document: Evaluation of the EU Strategy on Adaptation to Climate Change SWD(2018)461final. 377 Commission Press release – “Commission offers further support to European farmers dealing with droughts”, Brussels, 2 August 2018. http://europa.eu/rapid/press-release_IP-18-4801_en.htm 378 Humphrey et al. (2018), Sensitivity of atmospheric CO2 growth rate to observed changes in terrestrial water storage,
https://doi.org/10.1038/s41586-018-0424-4 379 Copernicus Climate Services (C3S): European State of the Climate 2017:
https://climate.copernicus.eu/climate-2017-european-wet-and-dry-indicators 380 PESETA: https://ec.europa.eu/jrc/en/peseta-iv 381 https://www.eea.europa.eu/publications/climate-change-impacts-and-vulnerability-2016 382 https://ec.europa.eu/jrc/en/peseta-iii ; https://ec.europa.eu/jrc/en/peseta-iv
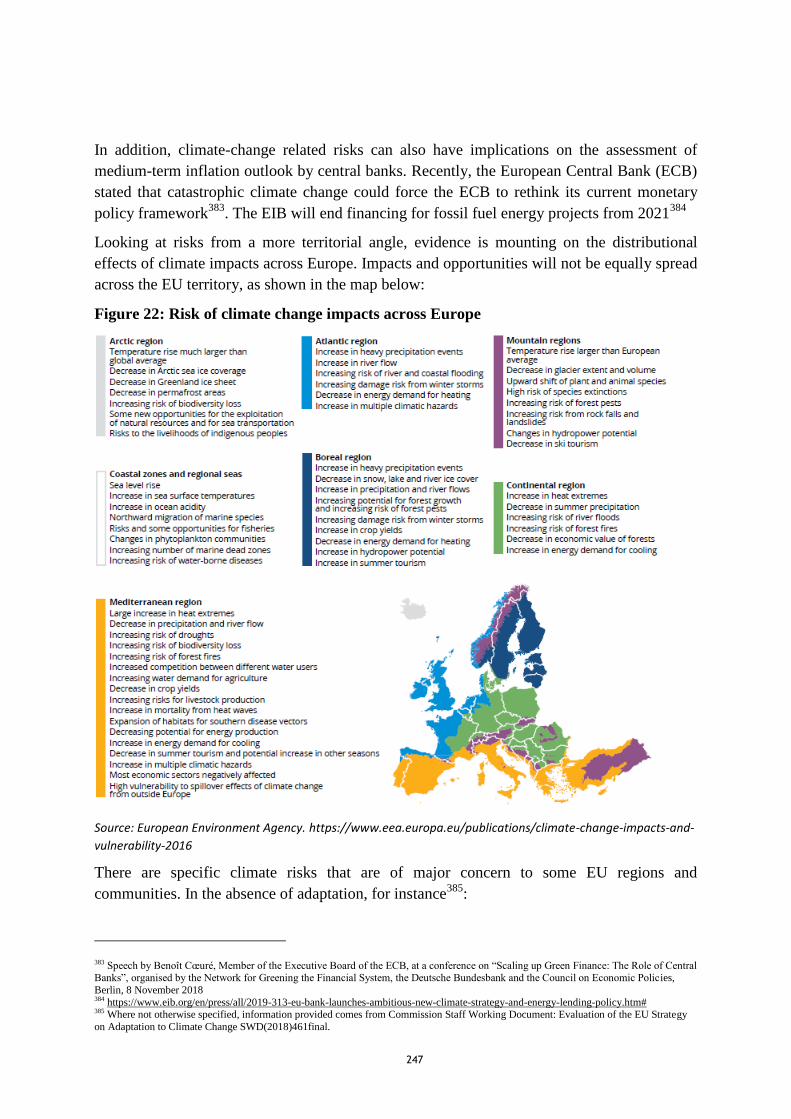
247
In addition, climate-change related risks can also have implications on the assessment of
medium-term inflation outlook by central banks. Recently, the European Central Bank (ECB)
stated that catastrophic climate change could force the ECB to rethink its current monetary
policy framework383
. The EIB will end financing for fossil fuel energy projects from 2021384
Looking at risks from a more territorial angle, evidence is mounting on the distributional
effects of climate impacts across Europe. Impacts and opportunities will not be equally spread
across the EU territory, as shown in the map below:
Figure 22: Risk of climate change impacts across Europe
Source: European Environment Agency. https://www.eea.europa.eu/publications/climate-change-impacts-and-
vulnerability-2016
There are specific climate risks that are of major concern to some EU regions and
communities. In the absence of adaptation, for instance385
:
383 Speech by Benoît Cœuré, Member of the Executive Board of the ECB, at a conference on “Scaling up Green Finance: The Role of Central
Banks”, organised by the Network for Greening the Financial System, the Deutsche Bundesbank and the Council on Economic Policies,
Berlin, 8 November 2018 384 https://www.eib.org/en/press/all/2019-313-eu-bank-launches-ambitious-new-climate-strategy-and-energy-lending-policy.htm# 385 Where not otherwise specified, information provided comes from Commission Staff Working Document: Evaluation of the EU Strategy
on Adaptation to Climate Change SWD(2018)461final.

248
While Europe as a whole will be more prone to flood risk (with mean annual river flow set
to increase), water stress will be more pronounced in Southern European regions534
, and
may well cause tensions between different users of dwindling reservoirs and aquifers.
With 2°C warming, river flows in Mediterranean regions are expected to fall in all
seasons.
Higher temperatures by the end of the century are expected to have various impacts such
as a 10-15% loss in outdoor labour productivity in several Southern European countries as
well as increases in heat-related mortality.
Habitat loss and forest fires are also serious risks. 16% of the present Mediterranean
climate zone (an area half the size of Italy) could become arid by the end of the century.
Drier soils in the Mediterranean also increase the area prone to forest fires.
Loss of Alpine tundra, even at 2°C could have important impacts on water regulation
(including for human consumption), as well as economic impacts including in the tourism
sector.
Specific risks (e.g. hurricanes, sea level rise, extreme heat) threaten to unravel EU efforts
to support its nine Outermost Regions, most of them small and isolated islands. The
impacts of hurricanes Irma and Maria on the Caribbean in 2017, and notably on St-Martin,
Guadeloupe and Martinique (three of the EU's outermost regions) came as a stark warning
of the potential impacts such regions face.
Transport: From road and rail networks to ports, airports and inland waterways, critical
transport resources are facing unprecedented threats from a climate, which is already
changing. Spain, for example, has just suffered the most powerful storms experienced in
decades, destroying bridges, cutting off roads and railway lines and submerging entire
towns in coastal areas. Flooding from high precipitation and extreme storms, in possible
association with related impacts including landslides and slope failures, will bring major
risks across the region for all modes of transport (road - and airport - infrastructure,
railway and inland waterways). Rising sea levels and greater wave activity causing
erosion put vital coastal transport infrastructure (i.e. coastal roads, railways, seaports and
airports) at risk. Over 60% of EU seaports386
may be under high inundation risk by 2100,
causing disruptions to operations and damages to port infrastructure and vessels,
especially along the North Sea coast, where the traffic of over 500 ports accounts for up to
15% of the world’s cargo transport. Rising temperatures linked to increased heat waves
and drier and hotter summers will affect roads, where pavement damages, damages to
bridges and increased landslides in mountainous areas are among key risks. Areas
considered particularly worthy of more detailed analysis include E-Roads in Southern
Europe (South-Eastern France, Italy, Western Balkans, Portugal, Spain, Greece, and
Turkey) as well as in Nordic countries (Norway, Sweden and Finland). Climate proofing
not only individual infrastructure investment projects, but also existing transport corridors,
386 UNECE: https://www.unece.org/info/media/presscurrent-press-h/transport/2020/unece-study-maps-transport-infrastructure-at-high-risk-
due-to-climate-change-in-pan-european-region-and-canada/doc.html
249
networks and systems will be increasingly relevant, as the majority of the existing
infrastructure is built for the past climatic conditions.
On major rail networks – where potential impacts include buckling of tracks, slope
failures and speed restrictions – infrastructure in the Mediterranean (Spain, Italy, France),
northern Europe, and Croatia are among those that could warrant more in-depth review.
Warming is also associated with increased navigational risks on inland waterways, with
significant implications for the transport of goods and people, which is already
problematic in parts of central Europe.
Cities as well as rural areas are directly and indirectly impacted by the impacts of climate
change. As the level of governance closest to citizens, they are often at the forefront of
responding to natural disasters and taking action on mitigate emissions and adapt to
climate change. Through their concentration of people and assets, cities are the major
consumers of energy and emitters of greenhouse gas emissions, but have also pioneered
actions to reduce emissions and adapt to climate. Including through initiatives such as the
EU and Global Covenant of Mayors, committing to reduce emissions by at least 40% by
2030, and taking action to adapt to climate change".
The EU Taxonomy on sustainable finance will also address climate related risks.
3. Mitigation and adaptation: co-benefits and trade-offs
Measures to cut emissions can undermine resilience to climate change in certain contexts, and
viceversa. On the other hand, there are adaptation measures that are also beneficial for
decarbonisation (e.g. protection of certain coastal ecosystems that both tackle sea level rise
and remove CO2). A recent OECD report387
highlights that climate investments and projects
must consider the links between adaptation and mitigation to minimise climate risk: the
greater the perceived risks of a project, the higher the returns investors will demand, and the
higher the costs passed onto end users and government sources of funding. The report
provides a summary of potential synergies and trade-offs between adaptation and mitigation
measures:
387 OECD (2017), Investing in Climate, Investing in Growth, OECD Publishing, Paris.
http://dx.doi.org/10.1787/9789264273528-en
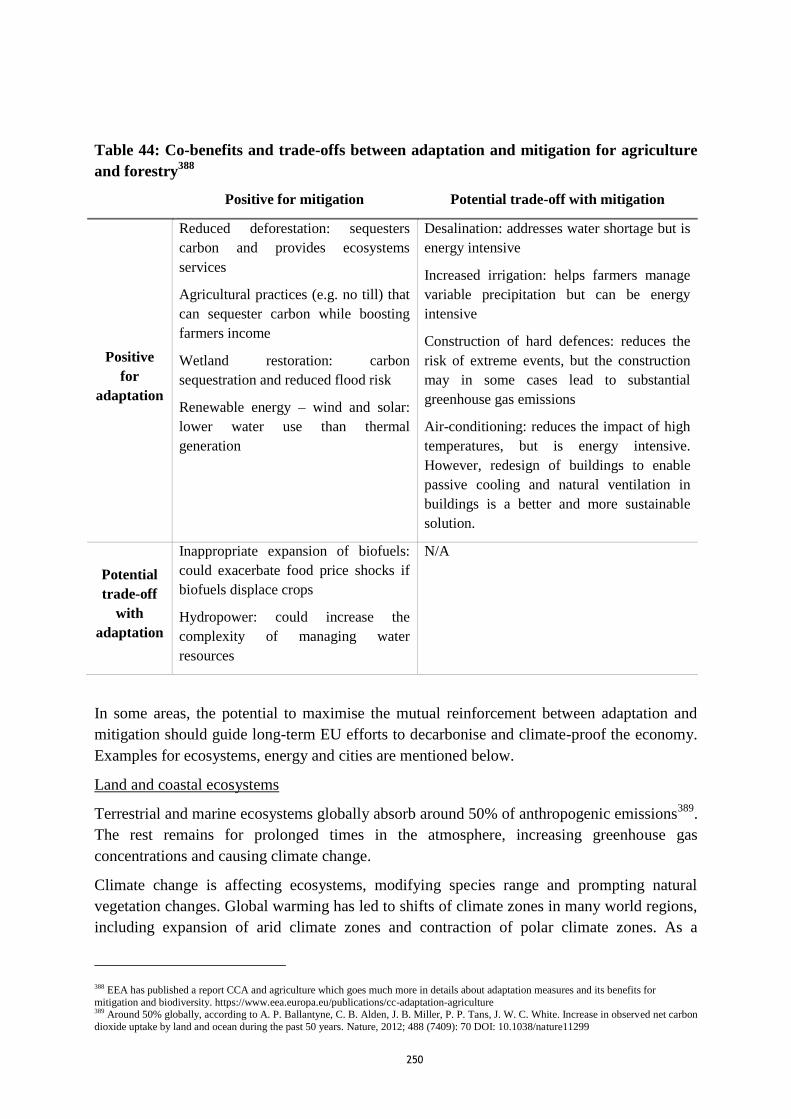
250
Table 44: Co-benefits and trade-offs between adaptation and mitigation for agriculture
and forestry388
Positive for mitigation Potential trade-off with mitigation
Positive
for
adaptation
Reduced deforestation: sequesters
carbon and provides ecosystems
services
Agricultural practices (e.g. no till) that
can sequester carbon while boosting
farmers income
Wetland restoration: carbon
sequestration and reduced flood risk
Renewable energy – wind and solar:
lower water use than thermal
generation
Desalination: addresses water shortage but is
energy intensive
Increased irrigation: helps farmers manage
variable precipitation but can be energy
intensive
Construction of hard defences: reduces the
risk of extreme events, but the construction
may in some cases lead to substantial
greenhouse gas emissions
Air-conditioning: reduces the impact of high
temperatures, but is energy intensive.
However, redesign of buildings to enable
passive cooling and natural ventilation in
buildings is a better and more sustainable
solution.
Potential
trade-off
with
adaptation
Inappropriate expansion of biofuels:
could exacerbate food price shocks if
biofuels displace crops
Hydropower: could increase the
complexity of managing water
resources
N/A
In some areas, the potential to maximise the mutual reinforcement between adaptation and
mitigation should guide long-term EU efforts to decarbonise and climate-proof the economy.
Examples for ecosystems, energy and cities are mentioned below.
Land and coastal ecosystems
Terrestrial and marine ecosystems globally absorb around 50% of anthropogenic emissions389
.
The rest remains for prolonged times in the atmosphere, increasing greenhouse gas
concentrations and causing climate change.
Climate change is affecting ecosystems, modifying species range and prompting natural
vegetation changes. Global warming has led to shifts of climate zones in many world regions,
including expansion of arid climate zones and contraction of polar climate zones. As a
388 EEA has published a report CCA and agriculture which goes much more in details about adaptation measures and its benefits for
mitigation and biodiversity. https://www.eea.europa.eu/publications/cc-adaptation-agriculture 389 Around 50% globally, according to A. P. Ballantyne, C. B. Alden, J. B. Miller, P. P. Tans, J. W. C. White. Increase in observed net carbon
dioxide uptake by land and ocean during the past 50 years. Nature, 2012; 488 (7409): 70 DOI: 10.1038/nature11299

251
consequence, many plant and animal species have experienced changes in their ranges,
abundances, and shifts in their seasonal activities. 7.5% of global land area will change from
one ecosystem type to another at 1.5°C, and 13% at 2°C.
This absorption capacity has its own limits. In case of oceans, this uptake is associated with
increased acidification, having negative impacts on marine biodiversity. In case of terrestrial
ecosystems, ecosystem degradation and deforestation actually result in significant greenhouse
gas emissions, while being detrimental for biodiversity. Preserving and restoring terrestrial
and marine ecosystems contribute both to mitigation and adaptation (for example, they
contribute to water retention, control floods and protect against soil erosion or air pollution).
In general, the joint implementation of adaptation and mitigation strategies contribute to the
health, functionality and resilience of ecosystems, and therefore improve the availability and
delivering of goods and services to EU citizens. Many environmental, welfare and climate
objectives may be reached simultaneously through ecosystem-based initiatives390
. For
example, marine vegetated habitats (seagrasses, salt-marshes, mangroves and others)
contribute 50% of carbon storage in marine sediments despite occupying only 0.2% of the
ocean surface globally. They reduce wave energy and raise the seafloor, and as such moderate
the impacts of sea level rise and contribute to safeguard people, infrastructure, and property
along coastlines391
.
Land restoration, reforestation, afforestation and reduced and avoided degradation in forests,
as well as rehabilitation of wetlands, contributes to and increased land use sink. Forests offer a
good example of the co-benefits that can arise from coordinated adaptation and mitigation.
Indeed, EU forests absorb the equivalent of just over 400 MtCO2, or almost 10% of total EU
greenhouse gas emissions each year. At the same time, they lower temperatures, act as a
buffer for hydrological extremes and purify water, which means they are also crucial in
adapting to climate change. Recent case-studies in Ireland, Spain and the Czech Republic
have shown that adaptation measures and good forestry practices enhance the role of forests
as carbon sinks392
. It is important to act with a long-term perspective because aging and
degraded forests, agro-forestry systems and more recent forest plantations all require
adaptation planning today in order to withstand a changing climate.
Energy393
Due to climate change alone, and in the absence of adaptation, annual damage to Europe’s
critical infrastructure could increase ten-fold by the end of the century under business-and-
usual scenarios394
, from the current EUR 3.4 billion to EUR 34 billion. Losses would be
highest for the industry, transport, and energy. One of the greatest challenges is how to assess
390 Faivre et al. 2018; https://doi.org/10.1016/j.ijdrr.2017.12.015 391 Duarte, C.M., Losada, I.J., Hendriks, I.E., Mazarrasa, I., Marbà, N. The role of coastal plant communities for climate change mitigation
and adaptation. Nature Climate Change, 3 (11), pp. 961-968 (2013). 392 European Forest Institute – 2018
https://www.efi.int/publications-bank/climate-smart-forestry-mitigation-impacts-three-european-regions 393 https://www.eea.europa.eu/publications/adaptation-in-energy-system 394 Forzieri et al. (2018), Escalating impacts of climate extremes on critical infrastructures in Europe, Global Environmental Change 48, 97–
107,
252
impacts on energy production which may occur as a consequence of the projected increase in
the intensity of extreme weather events, as research gaps include economic modelling of
extreme events and vulnerabilities of transmission infrastructure395
.
Impacts on renewable energy sources are of specific concern, given their critical contribution
to emissions reduction. There is some evidence on impacts on hydropower production due to
water scarcity, but also on wind, solar, biomass396
. As regards hydropower in particular, the
main mechanisms through which climate change can affect hydropower production are
changes in river flow, evaporation, and dam safety397
. For Europe, most studies show a
positive effect of climate change impacts on hydropower for Northern Europe and a negative
effect for South and Eastern Europe557
398
399
400
401
. The extent to which climate change
affects hydropower in Europe as a whole differs among the studies from almost no effect558
to
decreases of 5-10% by the end of the century or even before559
402
. Adaptation measures in
hydropower production could offset these impacts in Europe on a yearly average (not for all
months of the year): e.g. by increasing efficiency560
or water storage403
. As regards solar and
wind energy, there are studies that indicate that production might be negatively affected on
some regions in the EU404 405 406
.
Thermoelectric generation will be under more pressure in Southern European regions where
their water cooling needs may no longer be met: they may generate up to 20% less under a
3ºC scenario; 15% less in a 2ºC world. 555
Thermal electricity generation may suffer most from
water stress in the near term in the Mediterranean, France, Germany and Poland407
.
While the magnitude of these impacts is not expected to jeopardise Europe's long-term
decarbonisation path, it may entail higher costs and different regional energy mixes, unless
adaptive measures are deployed such as increased plant efficiencies, replacement of cooling
systems and fuel switches560
. Private stakeholders in the energy system and EU and national
policies should reinforce the right market framework to ensure that the climate impacts do not
jeopardise the EU’s stability and security of energy supply. Transitions in the electricity
395 Chandramowli et Felder (2014), Impact of climate change on electricity systems and markets – A review of models and forecasts,
https://doi.org/10.1016/j.seta.2013.11.003 396 See COACCH 1st synthesis report. 397 Mideksa and Kalbekken (2010), The impact of climate change on the electricity market: A review,
https://doi.org/10.1016/j.enpol.2010.02.035 398 Hamududu and Killingtveit (2012), Assessing Climate Change Impacts on Global Hydropower, doi:10.3390/en5020305 399 Lehner et al.,(2005), The impact of global change on the hydropower potential of Europe: a model-based analysis,
https://doi.org/10.1016/j.enpol.2003.10.018 400 Van Vliet et al,(2016), Power-generation system vulnerability and adaptation to changes in climate and water resources, https://doi.org/10.1038/nclimate2903 401 Teotónio et al.(2017), Assessing the impacts of climate change on hydropower generation and the power sector in Portugal: A partial
equilibrium approach, https://doi.org/10.1016/j.rser.2017.03.002 402 Chandramowli et Felder (2014), Impact of climate change on electricity systems and markets – A review of models and forecasts,
https://doi.org/10.1016/j.seta.2013.11.003 403 Berga (2016), The Role of Hydropower in Climate Change Mitigation and Adaptation: A Review, https://doi.org/10.1016/J.ENG.2016.03.004 404 Karnauskaset al. (2018), Southward shift of the global wind energy resource under high carbon dioxide emissions,
https://doi.org/10.1038/s41561-017-0029-9 405 Tobin et al. (2018), Vulnerabilities and resilience of European power generation to 1.5 °C, 2 °C and 3 °C warming,
https://doi.org/10.1088/1748-9326/aab211 406 Jerez et al. (2015), The impact of climate change on photovoltaic power generation in Europe, https://doi.org/10.1038/ncomms10014 407 Behrens et al. (2017): Climate change and the vulnerability of electricity generation to water stress in the European Union,
https://doi.org/10.1038/nenergy.2017.114

253
sector should encompass both mitigation and adaptation planning, if they are to sustain and
secure a sustainable water–energy nexus in the next few decades.
The 2019 JRC report408
provides further reading on the water-energy nexus. Water
availability is among the key constraints affecting the European energy sector, which
currently requires 74 billion m3/year of freshwater, similar to the water needs of agriculture.
The decarbonisation of the energy system could reduce its water needs by 38% by 2050, yet
water availability will play an essential role on the way to climate neutrality by 2050. At the
same time, projections indicate that water resources are expected to be under major stress,
primarily due to climate change. Higher water stress is expected in Mediterranean regions and
extreme weather variability is also expected in north-west Europe. That may lead to increased
strain in regions where freshwater is key for cooling thermal power plants or where
hydropower capacity plays a significant role in the power system.
Cities
The need to integrate adaptation and mitigation pathways is most apparent in the
transformation of European cities. They are home to 360 million people, i.e. 73% of Europe’s
population, and account for 80% of the continent’s energy consumption and for 85% of
Europe’s GDP409
. Yet, only around 40% of EU cities with more than 150.000 inhabitants
have adopted adaptation plans to protect citizens from climate impacts. Globally, a 2015
OECD report recognises that, in spite of the important role local authorities have to deliver
climate resilience through regulatory frameworks and incentives, “support for urban
adaptation remains uneven”527
.
Trade-offs between mitigation and adaptation goals must be avoided in cities. In general, for
example, densification may benefit emissions reduction (e.g. less transport needs), but can
also increase vulnerability to regional climate impacts (e.g. more people and assets in less
space when a flood occurs). Cities also suffer from higher temperatures than the surrounding
areas, due to the concentration of built environment (“heat island effect”).
There are opportunities to optimise climate action when developing joint mitigation and
adaptation in urban planning. For example, urban green spaces, corridors and green and blue
infrastructure can deliver adaptation benefits and absorb emissions and pollution, and
permeable surfaces to address floods in urban areas. Cities will also be major clients for
climate services and emerging businesses may provide solutions to city planners that combine
optimal mitigation and adaptation ideas. Cities that prioritise resilient and low-emission urban
development at once will enjoy a competitive advantage and attract investments410
.
408 https://ec.europa.eu/jrc/en/publication/eur-scientific-and-technical-research-reports/water-energy-nexus-europe 409 HELIX - https://www.helixclimate.eu/ 410 E3G (2014), “Underfunded, underprepared, underwater? Cities at risk”.
254
Annex 10: Glossary, Indices, Abbreviations
Glossary
The majority of the following definitions are derived from the IPCC Glossary411
or otherwise
indicated:
Adaptation: In human systems, the process of adjustment to actual or expected climate and
its effects, in order to moderate harm or exploit beneficial opportunities. In natural systems,
the process of adjustment to actual climate and its effects; human intervention may facilitate
adjustment to expected climate and its effects.
Adaptation options: The array of strategies and measures that are available and appropriate
for addressing adaptation. They include a wide range of actions that can be categorized as
structural, institutional, ecological or behavioural.
Carbon dioxide (CO2): A naturally occurring gas, CO2 is also a by-product of burning fossil
fuels (such as oil, gas and coal), of burning biomass, of land use changes (LUC), and of
industrial processes (e.g. cement production). It is the principal anthropogenic greenhouse gas
(GHG) that affects the Earth's radiative balance. It is the reference gas against which other
GHGs are measured and therefore has a Global Warming Potential (GWP) of 1.
Climate: Climate in a narrow sense is usually defined as the average weather, or more
rigorously, as the statistical description in terms of the mean and variability of relevant
quantities over a period of time ranging from months to thousands or millions of years. The
classical period for averaging these variables is 30 years, as defined by the World
Meteorological Organization. The relevant quantities are most often surface variables such as
temperature, precipitation and wind. Climate in a wider sense is the state, including a
statistical description, of the climate system.
Climate change: Climate change refers to a change in the state of the climate that can be
identified (e.g. by using statistical tests) by changes in the mean and/or the variability of its
properties and that persists for an extended period, typically decades or longer. Climate
change may be due to natural internal processes or external forcing such as modulations of the
solar cycles, volcanic eruptions and persistent anthropogenic changes in the composition of
the atmosphere or in land use. Note that the Framework Convention on Climate Change
(UNFCCC), in its Article 1, defines climate change as: 'a change of climate which is
attributed directly or indirectly to human activity that alters the composition of the global
atmosphere and which is in addition to natural climate variability observed over comparable
time periods'. The UNFCCC thus makes a distinction between climate change attributable to
human activities altering the atmospheric composition and climate variability attributable to
natural causes.
411 IPCC Glossary accompanying the special report on global warming of 1.5℃: https://www.ipcc.ch/report/sr15/glossary/

255
Climate extreme (extreme weather or climate event): The occurrence of a value of a
weather or climate variable above (or below) a threshold value near the upper (or lower) ends
of the range of observed values of the variable. For simplicity, both extreme weather events
and extreme climate events are referred to collectively as ‘climate extremes.’
Climate neutrality: Concept of a state in which human activities result in no net effect on the
climate system. Achieving such a state would require balancing of residual emissions with
emission (carbon dioxide) removal as well as accounting for regional or local biogeophysical
effects of human activities that, for example, affect surface albedo or local climate.
Climate projection: A climate projection is the simulated response of the climate system to a
scenario of future emission or concentration of GHG and aerosols, generally derived using
climate models. Climate projections are distinguished from climate predictions by their
dependence on the emission/concentration/radiative forcing scenario used, which is in turn
based on assumptions concerning, for example, future socioeconomic and technological
developments that may or may not be realized.
CO2 equivalent (CO2-eq) emission: The amount of carbon dioxide (CO2) emission that
would cause the same integrated radiative forcing or temperature change, over a given time
horizon, as an emitted amount of a greenhouse gas (GHG) or a mixture of GHGs. There are a
number of ways to compute such equivalent emissions and choose appropriate time horizons.
Most typically, the CO2-equivalent emission is obtained by multiplying the emission of a
GHG by its Global Warming Potential (GWP) for a 100 year time horizon. For a mix of
GHGs it is obtained by summing the CO2-equivalent emissions of each gas. CO2-equivalent
emission is a common scale for comparing emissions of different GHGs but does not imply
equivalence of the corresponding climate change responses. There is generally no connection
between CO2-equivalent emissions and resulting CO2-equivalent concentrations.
Cost-benefit analysis: Monetary assessment of all negative and positive impacts associated
with a given action. Cost-benefit analysis enables comparison of different interventions,
investments or strategies and reveal how a given investment or policy effort pays off for a
particular person, company or country. Cost-benefit analyses representing society's point of
view are important for climate change decision making, but there are difficulties in
aggregating costs and benefits across different actors and across timescales.
Disaster412
: Severe alterations in the normal functioning of a community or a society due to
hazardous physical events interacting with vulnerable social conditions, leading to widespread
adverse human, material, economic, or environmental effects that require immediate
emergency response to satisfy critical human needs and that may require external support for
recovery.
Environmental Impact Assessment (EIA): the process of carrying out an EIA as required
by Directive 2011/92/EU, as amended by Directive 2014/52/EU on assessment of the effects
412 IPCC SREX Glossary: https://archive.ipcc.ch/pdf/special-reports/srex/SREX-Annex_Glossary.pdf
256
of certain public and private Projects on the environment. The main steps of the EIA process
are: preparation of the EIA Report, publicity and consultation, and decision-making.
Exposure412
: The presence of people; livelihoods; environmental services and resources;
infrastructure; or economic, social, or cultural assets in places that could be adversely
affected.
Extreme weather event: An extreme weather event is an event that is rare at a particular
place and time of year. Definitions of rare vary, but an extreme weather event would normally
be as rare as or rarer than the 10th
or 90th
percentile of a probability density function estimated
from observations. By definition, the characteristics of what is called extreme weather may
vary from place to place in an absolute sense. When a pattern of extreme weather persists for
some time, such as a season, it may be classed as an extreme climate event, especially if it
yields an average or total that is itself extreme (e.g. drought or heavy rainfall over a season).
Global Warming Potential (GWP): An index, based on radiative properties of GHG,
measuring the radiative forcing following a pulse emission of a unit mass of a given
greenhouse gas in the present day atmosphere integrated over a chosen time horizon, relative
to that of carbon dioxide. The GWP represents the combined effect of the differing times
these gases remain in the atmosphere and their relative effectiveness in causing radiative
forcing. The Kyoto Protocol is based on GWPs from pulse emissions over a 100-year time
frame.
Greenhouse gas (GHG): Greenhouse gases are those gaseous constituents of the atmosphere,
both natural and anthropogenic, that absorb and emit radiation at specific wavelengths within
the spectrum of terrestrial radiation emitted by the earth's surface, the atmosphere itself, and
by clouds. This property causes the greenhouse effect. Water vapour (H2O), carbon dioxide
(CO2), nitrous oxide (N2O), methane (CH4) and ozone (O3) are the primary GHGs in the
earth's atmosphere. Moreover, there are a number of entirely human-made GHGs in the
atmosphere, such as the halocarbons and other chlorine- and bromine-containing substances,
dealt with under the Montreal Protocol. Beside CO2, N2O and CH4, the Kyoto Protocol deals
with the GHGs sulphur hexafluoride (SF6), hydrofluorocarbons (HFCs) and perfluorocarbons
(PFCs).
Hazard: The potential occurrence of a natural or human-induced physical event or trend that
may cause loss of life, injury, or other health impacts, as well as damage and loss to property,
infrastructure, livelihoods, service provision, ecosystems and environmental resources.
Infrastructure: See the definition in chapter Error! Reference source not found. of this
guidance.
Impacts (consequences, outcomes): The consequences of realized risks on natural and
human systems, where risks result from the interactions of climate-related hazards (including
extreme weather and climate events), exposure, and vulnerability. Impacts generally refer to
effects on lives, livelihoods, health and wellbeing, ecosystems and species, economic, social
and cultural assets, services (including ecosystem services), and infrastructure. Impacts may
be referred to as consequences or outcomes, and can be adverse or beneficial.

257
Representative concentration pathways (RCPs): Scenarios that include time series of
emissions and concentrations of the full suite of greenhouse gases (GHGs) and aerosols and
chemically active gases, as well as land use/land cover (Moss et al., 2008). The word
representative signifies that each RCP provides only one of many possible scenarios that
would lead to the specific radiative forcing characteristics. The term pathway emphasizes the
fact that not only the long-term concentration levels, but also the trajectory taken over time to
reach that outcome are of interest (Moss et al., 2010). RCPs were used to develop climate
projections in CMIP5.
RCP2.6: One pathway where radiative forcing peaks at approximately 3 W/m² and then
declines to be limited at 2.6 W/m² in 2100 (the corresponding Extended Concentration
Pathway, or ECP, has constant emissions after 2100).
RCP4.5 and RCP6.0: Two intermediate stabilisation pathways in which radiative forcing is
limited at approximately 4.5 W/m² and 6.0 W/m² in 2100 (the corresponding ECPs have
constant concentrations after 2150).
RCP8.5: One high pathway which leads to > 8.5 W/m² in 2100 (the corresponding ECP has
constant emissions after 2100 until 2150 and constant concentrations after 2250).
Risk: The potential for adverse consequences where something of value is at stake and where
the occurrence and degree of an outcome is uncertain. In the context of the assessment of
climate impacts, the term risk is often used to refer to the potential for adverse consequences
of a climate-related hazard, or of adaptation or mitigation responses to such a hazard, on lives,
livelihoods, health and wellbeing, ecosystems and species, economic, social and cultural
assets, services (including ecosystem services), and infrastructure. Risk results from the
interaction of vulnerability (of the affected system), its exposure over time (to the hazard), as
well as the (climate-related) hazard and the likelihood of its occurrence.
Risk assessment: The qualitative and/or quantitative scientific estimation of risks.
Risk management: Plans, actions, strategies or policies to reduce the likelihood and/or
consequences of risks or to respond to consequences.
Sensitivity413
: Sensitivity is the degree to which a system is affected, either adversely or
beneficially, by climate variability or change. The effect may be direct (e.g. a change in crop
yield in response to a change in the mean, range or variability of temperature) or indirect (e.g.
damages caused by an increase in the frequency of coastal flooding due to sea-level rise).
Slow onset events: Slow onset events include e.g. temperature increase, sea-level rise,
desertification, glacial retreat and related impacts, ocean acidification, land and forest
degradation, average precipitation, salinization, and loss of biodiversity. As regards the
statistical distribution of a climate variable (and how it may shift in a changing climate), slow
onset events will often reflect how the mean value is changing (whereas extreme events are
related to the tail ends of the distribution).
413 IPCC AR4 Glossary WG2: https://archive.ipcc.ch/pdf/glossary/ar4-wg2.pdf
258
Strategic Environmental Assessment (SEA): the process of carrying out an environmental
assessment as required by Directive 2001/42/EC on the assessment of the effects of certain
plans and programmes on the environment. The main steps of the SEA process are
preparation of the SEA Report, publicity and consultation, and decision-making.
Urban resilience: The measurable ability of any urban system, with its inhabitants, to
maintain continuity through all shocks and stresses, while positively adapting and
transforming towards sustainability.
Vulnerability [IPCC AR4414
]: Vulnerability is the degree to which a system is susceptible to,
and unable to cope with, adverse effects of climate change, including climate variability and
extremes. Vulnerability is a function of the character, magnitude, and rate of climate change
and variation to which a system is exposed, its sensitivity, and its adaptive capacity.
Vulnerability [IPCC AR5415
]: The propensity or predisposition to be adversely affected.
Vulnerability encompasses a variety of concepts and elements including sensitivity or
susceptibility to harm and lack of capacity to cope and adapt.
Index of Tables and Boxes
Box 1: Stakeholder views on the main problems for the EU Adaptation strategy ................................................ 14
Box 2: Foresight to 2100 on projected climate impacts – cost of non-action in Europe ....................................... 16
Box 3: Stakeholder views on problems drivers hindering the new EU Adaptation Strategy ................................ 23
Box 4: Stakeholder views on objective setting for the new EU Adaptation Strategy ........................................... 29
Table 5: Baseline option – Actions ....................................................................................................................... 32
Table 6: Deepening of existing actions and their connectivity to the Drivers (D), Problems (P) and
Objectives (O) ......................................................................................................................................... 32
Table 7: Novel actions and their connectivity connectivity to the Drivers (D), Problems (P) and Objectives
(O) ........................................................................................................................................................... 34
Box 8: Disaster Risk Management, financing strategies, and National Fiscal Frameworks ................................. 35
Table 9: Summary of impact assessment relative to the baseline ......................................................................... 38
Table 10 Annual welfare loss ............................................................................................................................... 40
Table 11: Annual welfare loss – change in option 1 compared to baseline........................................................... 42
Table 12: Annual welfare loss – change in option 2 compared to baseline........................................................... 44
Table 13: change in Employment ......................................................................................................................... 47
Table 14: Summary of impact of heat and cold wave impacts .............................................................................. 48
Table 15: Change in Employment in option 1 compared to baseline .................................................................... 49
Table 16: Change in Employment in option 2 compared to baseline .................................................................... 50
Table 17: Summary of option comparison assessment ......................................................................................... 55
Table 18: Monitoring and evaluation indicators ................................................................................................... 62
Box 19: List of labels representing most frequently mentioned areas of action .................................................... 71
Box 20: The international dimension of the new EU Adaptation Strategy ........................................................... 79
Box 21: Feedback from National Authorities ....................................................................................................... 83
Table 22: Results of cosine similarity analysis detecting co-ordinated responses ................................................ 87
Table 23: Overview of Benefits (total for all provisions) – Prefered Option ........................................................ 91
Table 24: Overview of costs – Preferred option ................................................................................................... 93
Table 25: Industry classification of OECD Input-Output Tables (GINFORS-E)................................................ 101
Table 26: Impact screening of key impact indicators.......................................................................................... 112
Table 27: Non-exhaustive list of measures to be developed under the new EU Adaptation Strategy up to
2050 ....................................................................................................................................................... 116
Table 28: Mini-assessment on Closing further gaps in adaptation-relevant knowledge ..................................... 131
Table 29: Mini-Assessment of Health Observatory ............................................................................................ 139
Table 30: Mini-Assessment of stimulating the deployment of Nature-based solutions ...................................... 146
414 IPCC AR4 Climate Change 2007: Impacts, Adaptation, and Vulnerability, Appendix I: Glossary,
https://www.ipcc.ch/site/assets/uploads/2018/02/ar4-wg2-app-1.pdf 415 IPCC AR5 SYR, Synthesis Report, Annex II: Glossary, https://www.ipcc.ch/site/assets/uploads/2019/01/SYRAR5-
Glossary_en.pdf

259
Table 31: Mini-assessment of Policy Support Facility / Technical Assistance project ....................................... 163
Table 32: Mini-Assessment of Climate Proofing of Infrastructure and Disaster Risk Management .................. 173
Table 33: Mini-assessment to narrowing the climate protection gap—Micro-economic policy ......................... 181
Table 34: Mini-assessment on supporting partner countries ............................................................................... 188
Table 35: Mini-assessment on scaling up international adaptation and risk financing ....................................... 194
Table 36: Mini-assessment on strengthening EU adaptation engagement globally ............................................ 200
Table 37: Mini-assessment on adaptation Solutions / Horizon Europe Mission on adaptation to Climate
Change ................................................................................................................................................... 207
Table 38: Mini-assessment Measures for Land ecosystems, agriculture and forests .......................................... 213
Table 39: Mini-assessment on closing the climate protection gap ...................................................................... 219
Table 40: Mini-assessment on Common Implementation Strategy ..................................................................... 224
Table 41: Mini-assessment on Promoting the inclusion of climate aspects in already established framework
plans, including in Water Safety Plans .................................................................................................. 228
Table 42: Legal instruments in suport of EU action in climate change adaptation ............................................. 232
Table 43: Selected Climate Change Impacts to Natural Systems at 1.5°C & 2°C warming ............................... 235
Table 44: Co-benefits and trade-offs between adaptation and mitigation for agriculture and forestry ............... 243
Index of Figures
Figure 1: Problem definition for the new EU Adaptation Strategy ........................................................................ 9
Figure 2: Example of projected change in meteorological forest fire danger by the late 21st century
compared with the period 1981-2010. ..................................................................................................... 18
Figure 3: Objective tree for EU Adaptation Strategy ............................................................................................ 26
Figure 4 Intervention logic for the new EU Adaptation Strategy.......................................................................... 60
Figure 5: Number of participants by consultation activity .................................................................................... 68
Figure 6: Participants by stakeholder type for the consultation activities (except OPC) ...................................... 69
Figure 7: Participants by stakeholder type for the consultation activities (OPC only) .......................................... 69
Figure 8: Participants by Member State for the consultation activities ................................................................. 69
Figure 9: Overview of ad-hoc contributions’ content provided over email by stakeholder type (a contribution
can tackle one or more than one topic) .................................................................................................... 88
Figure 10: Overview of ad-hoc contributions’ content provided by interviewees by stakeholder type (a
contribution can tackle one or more than one topic) ................................................................................ 89
Figure 11: Country coverage of GINFORS-E ...................................................................................................... 99
Figure 12: Country model of GINFORS-E ......................................................................................................... 100
Figure 13: Structural detail of IO country model of GINFORS-E ...................................................................... 101
Figure 14: Economic welfare in climate change scenarios by macro region - relative difference from baseline
[% of real GDP] ..................................................................................................................................... 103
Figure 15: Employment in climate change scenarios - relative difference from baseline of employment by
macro region .......................................................................................................................................... 104
Figure 16: Adaptation scenario (Option 1)- relative difference from baseline of real GDP by macro region
[as % of real GDP]................................................................................................................................. 105
Figure 17: Adaptation scenario (Option 2) - relative difference of economic welfare compared to baseline by
macro region [as % of real GDP] ........................................................................................................... 106
Figure 18: Adaptation scenarios (Option 2) - relative difference of employment by macro region compared
to baseline [as % of total employment] .................................................................................................. 107
Figure 19: 1.5°C scenario (RCP 2.6) Relative differences in economic welfare compared to baseline by 2050
[as % of real annual GDP] ..................................................................................................................... 108
Figure 20: 2.0°C scenario (RCP 4.5) Relative differences in economic welfare by 2050 compared to baseline
[as % of real annual GDP] ..................................................................................................................... 108
Figure 21: 4°C scenario (RCP 8.5) Relative differences in economic welfare by 2050 compared to baseline
[as % of real GDP]................................................................................................................................. 109
Figure 22: Risk of climate change impacts across Europe .................................................................................. 240
Abbreviations
BBNJ Biological Diversity of Areas Beyond National Jurisdiction BRG Better Regulation Guidelines
CAP Common Agricultural Policy
CBA Cost Benefit Analysis CBD Convention on Biological Diversity
CEF Connecting Europe Facility
CEN European Committee for Standardization CEOS Committee on Earth Observation
CES Central Southern Europe
CGE Computable General Equilibrium CIS Common Implementation Strategy
CLMS Copernicus Land Monitoring Services
260
CMA Meeting of the Parties to the Paris Agreement
COP Conference of The Parties CPR Common Provisions Regulation
CSR Corporate Social Responsibility
CWP Commission Work Program DAC Development Assistance Committee
DG CLIMA Directorate-General for Climate Action
DRF Disaster Risk Financing DRM Disaster Risk Management
DRR Disaster Risk Reduction
DWD Drinking Water Directive EAD Expected Annual Damage
EAFRD European Agricultural Fund for Rural Development
EASAC European Academies' Science Advisory Council EBRD European Bank for Reconstruction and Development
EC European Commission
ECA European Court of Auditors ECB European Central Bank
EEA European Environmental Agency
EFFIS European Forest Fire Information System EFSA European Food Safety Authority
EFSD European Fund for Sustainable Development
EFTA European Free Trade Association EIB European Investment Bank
EIOPA European Insurance and Occupational Pensions Authority
EIP European Innovation Partnership EMFF European Maritime And Fisheries Fund
EMS Emergency Management Service ENER Directorate-General for Energy
ENV Directorate-General for Environment
ERDF European Regional Development Fund ESF European Social Fund
ESIF European Structural and Investment Funds
ESPON European Spatial Planning Observation Network ESTAT Eurostat
ETR Environmental Tax Reform
ETS Energy Trading System EU European Union
FAO Food and Agriculture Organization
FDI Foreign Direct Investment FISE Forest Information System for Europe
GAR Global Assessment Report on Disaster Risk Reduction
GCCA Global Climate Change Alliance GDP Gross Domestic Product
GHG Greenhouse Gases
GI Green Infrastructure GIS Geospatial Information System
GVA Gross Value Added
GWP Global Warming Potential HARCI Harmonized Grids of Critical Infrastructures In Europe
IA Impact Assessment
IEA International Energy Agency IIA Inception Impact Assessment
ILO International Labour Organization
IMF International Monetary Fund IOT Internet of Things
IPCC Intergovernmental Panel on Climate Change
IPSF International Platform for Sustainable Finance IRDR Integrated Research on Disaster Risk
ISO International Standardisation Organisation
ISPRS International Archives of the Photogrammetry, Remote Sensing and Spatial Information Sciences ISSG Inter-Service Steering Group
IUCN International Union for Conservation of Nature
JRC Joint Research Centre KIC Knowledge and Innovation Community
LAU Local Administrative Units
MFF Multiannual Financial Framework MMR Monitoring Mechanism Regulation
MRE Monitoring, Reporting and Evaluation
MS Member States NACE Nomenclature Statistique des Activités Économiques dans la Communauté Européenne
NAIAD Nature Insurance Value: Assessment and Demonstration
NAP National Adaptation Plan NAS National Adaptation Strategy
261
NATCAT Natural Catastrophes
NBS Nature Based Solution NFD Non-Financial Disclosure
NFRD Non-Financial Reporting Directive
NGO Non-Governmental Organization NWRM Natural Water Retention Measures
OECD Organisation For Economic Co-Operation And Development
OLS Ordinary Least Squares (OLS) Technique Is The Most Popular Method Of Performing Regression Analysis And Estimating Econometrics
OPC Open Public Consultation
RCP Representative Concentration Pathways RDI Research, Development And Innovation
RFMO Regional Fisheries Management Organisations And Agreements
RSB Regulatory Scrutiny Board SDG Sustainable Development Goal
SEAP Sustainable Energy Action Plan
SECAP Sustainable Energy And Climate Action Plan SIDS Small Island Developing States
SME Small Medium Enterprises
TEN-E Trans-European Networks For Energy TEN-T Trans-European Transport Network
TFEU Treaty On The Functioning Of The European Union
UCPM Union Civil Protection Mechanism UHI Urban Heat Effect
UN United Nations
UNDRR United Nations Office For Disaster Risk Reduction UNEP United Nations Environment Programme
UNFCCC United Nations Framework Convention On Climate Change WEF World Economic Forum
WEI Water Exploitation Index
WEO World Energy Outlook, WFD Water Framework Directive
WHO World Health Organization
WMO World Meteorologic Organization