parking study - oneida cityoneidacity.com/.../uploads/parking-study-final-report_r.pdf · 1 parking...
TRANSCRIPT

1
Parking Study
This parking study was initiated to help understand parking supply and parking demand within Oneida City Center. The parking study was performed and analyzed by the Madison County Planning Department. With parking, especially downtown parking, there is often a mismatch between reality and perception. Thus, quantifying actual usage through a parking study is extremely valuable in understanding the true parking demand of an area. This study will also serve as a baseline to monitor changes over time because demand for parking is one indicator of economic and social activity in downtown Oneida.
Study Area/Parking Supply
Five parking areas within Oneida City Center were considered during this study. In total there are 207 spaces within the parking study area.
Parking Lot 1: Main St (across from City Hall) consists of 35 parking spaces. Parking Lot 2: Oneida St (west) parking lot consists of 45 angled parking spaces (23 on
the south side of Oneida St and 22 on the north side). Parking Lot 3: Oneida St (east) consist of 39 angled parking spaces. Parking Lot 4: Freighthouse Alley parking lot consists of 36 angled parking spaces. Parking Lot 5: City Hall parking lot consists of 52 parking spaces.
Study Area
MAIN
ST

2
Assessing Parking Demand
According to How to do a Parking Study by the Metropolitan Area Planning Council: Knowing occupancy allows you to determine whether or not you have enough parking. Occupancies of
85-90% or just below are ideal - the demand is being met without waste. High occupancies
in one area combined with lower occupancies nearby indicate a parking management
problem and a need to figure out how to get some of the excess demand to use the nearby available supply (lack of knowledge of nearby spaces or restrictions on who can park there are two examples).
Evaluation Period
The study for these five lots took place for one week, January 9-15, 2016. For each day duringthat week, counts were taken at three different times: 9:00 am, 12:00 (noon), and 7:00 pm. Any vehicle observed parked within one of the five study area parking lots during this evaluation period was counted (Attachment A).
Using aerial photos (made available through Pictometry), counts are also included for the dates of April 19, 2015; April 7, 2012; April 19, 2010; May 5, 2008; and April 9, 2006. These aerial photos were taken between 11-2 pm. While these historic images are consistent with the current findings, the counts observed in these aerials were not included in this data analysis and are provided as a historic reference only and demonstration of an overall trend (Attachment B).
Findings
Ample parking opportunity was observed within these five lots serving City Center; in fact, the majority of the time excess parking is available. Overall, the most underutilized lots are Oneida St (East) and Freighthouse Alley while the most used lots are Oneida Street (West) and theMain Street lot. However, even the most used lots were observed to provide abundant parking opportunity within City Center.
Each lot was also analyzed for peak and non-peak time, weekday vs weekend parking and day vs evening parking. The results for each lot are listed in order from the highest to lowest demand.

3
1. Oneida Street (West) (Lot 2)
Overall: The parking lot with the highest demand is Oneida Street (West), but eventhis parking lot is less than half full on average. On average only 18 of the 45 spotsare occupied (or 39.6%). Table 1
Peak and Non-Peak Time: The only time the lot was ever more than ¾ full was on Friday at 9 am where the lot was 91% full (41 of the 45 spots). This peak demand time can be explained by a specific event: Friday morning is the time the City holds traffic court. By noon on that same day only 29 of the 45 spots were taken (64%) and at 7:00 pm only one vehicle was parked in this lot (2.2%), which was also the lot’s least busy time. Table 2
Weekday vs. Weekend: This lot is more popular during the week vs the weekend. On average the lot was only 14.8% full during the weekend while 49.5% full during the week. Table 3
Day vs. Evening: Most parking occurs in this lot during the day vs the evening. In the morning 51.7% (or 23 of the 45) spots were observed to be taken. For lunch (noon) it was 47.3%. The evening has significantly less demand with an average of 9 cars parked in this lot around 7 pm. Table 3
Photo: Oneida Street (West) lot on Tuesday, January 12th at noon.

4
2. Main St (Lot 1):
Overall: The second most popular parking lot is along Main Street, but on average thisparking lot is only about 1/3 full at any one time. On average only 13 of the 35 spots areoccupied (or 36.8%). Table 1
Peak and Non-Peak Time: The only time the lot was ever more than ¾ full was again on Friday at 9 am where the lot was 88.6% full (31of the 35 spots). Again, this peak demand can be explained by a specific event: Friday morning is the time the City holds traffic court. As the day progressed the number of spaces taken declined: by noon 25 of the 35 spots were taken (71.4%) and at 7:00 pm 21 of the 35 spots were taken (60%). The least busy time observed was Wednesday evening where at 7:00 pm the lot was empty with zero vehicles parked in this lot. Table 2
Weekday vs. Weekend: This lot is more popular during the week vs the weekend. On average the lot was only 23.8% full during the weekend while 48.6% full during the week. The busiest time on the weekend was Saturday morning (9:00 am) with 20 of the 35 spots parked in. Table 3
Day vs. Evening: Most parking occurs in this lot during the day vs the evening. In the morning 53.5% (or 19 of the 35) spots were observed to be taken. For lunch (noon) it was 48.2%. The evening has significantly less demand: around 7:00 pm, only 22.9% (or 8 of 35) of the spots are parked in. Table 3
Photo: Main St Parking lot on Saturday at 9 am. This was the lot’s busiest time on the weekend with other weekend counts much lower (for example, only 2 cars were observed in this lot at the same time on Sunday morning).
5
3. City Hall (Lot 5)
Overall: On average, this parking lot is only about 1/3 full at any one time. On averageonly 18 of the 52 spots are occupied (or 35%). It is worth noting approximately 10-12vehicles in this lot seem to have permanent parking spaces here (for example, anAmerican Red Cross van and older police cars). This parking lot was dubbed the ‘CityHall’ lot because many of the City’s employees park here. This is also reflected in thatthe numbers observed fluctuated less than in other lots, presumably because the sameemployees are parking here each day for work. Table 1
Peak and Non-Peak Time: On only three occasions was the lot above half full. The busiest time was Thursday at 9 am where the lot was 61.5% full (32 of the 52 spots). The least busy time observed was Saturday at noon with only 17.3% (9 of 52) spots taken. Table 2
Weekday vs. Weekend: This lot is more popular during the week vs the weekend. On average the lot was only 24% full during the weekend while 39.4% full during the week. Again, the fluctuation between the weekend and weekday is less than in other lots likely due to some municipal-owned vehicles that have permanent parking spots here. Table 3
Day vs. Evening: Most parking occurs in this lot during the day vs the evening. During the day, the lot is a little under 1/2 full dropping to about 1/5 full in the evening. Table 3
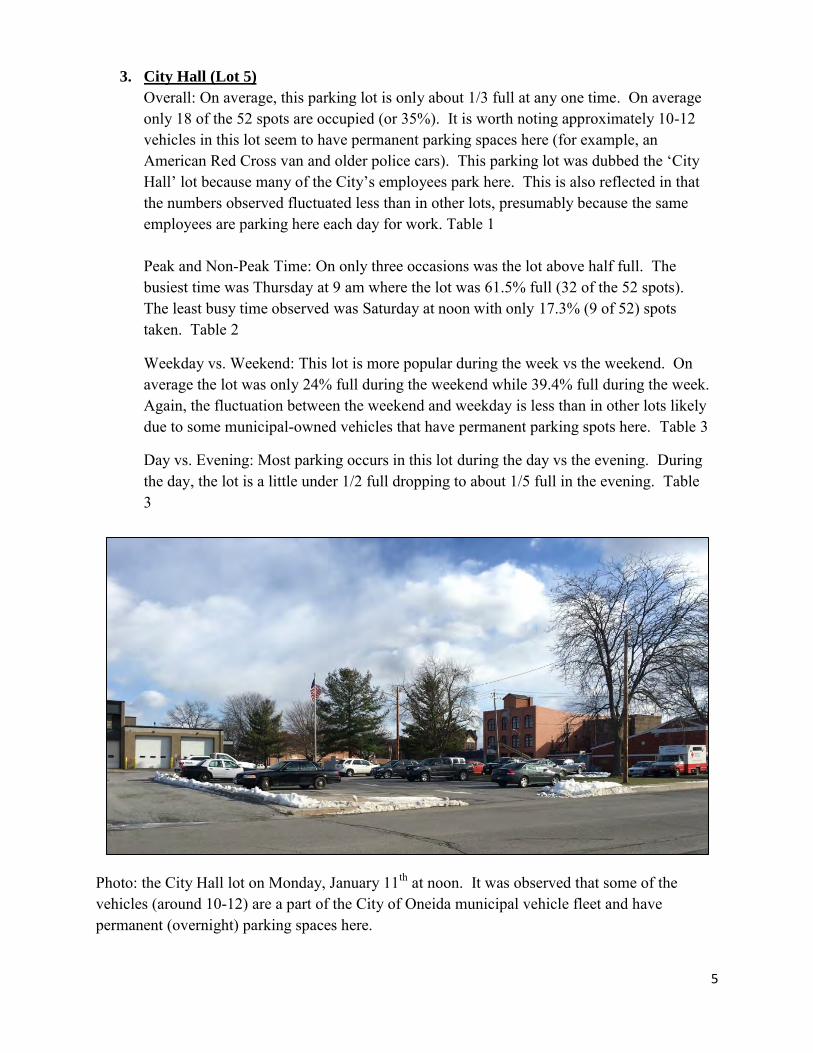
Photo: the City Hall lot on Monday, January 11th at noon. It was observed that some of thevehicles (around 10-12) are a part of the City of Oneida municipal vehicle fleet and have permanent (overnight) parking spaces here.
6
4. Freighthouse Alley (Lot 4)
Overall: On average, this parking lot is only about 14.8% full at any one time (or about 5of 36 spaces taken at any time). Table 1
Peak and Non-Peak Time: This lot is hardly ever more than ¼ full. The busiest time was Tuesday evening where the lot was 38.9% full (14 of the 36 spots). The least busy timeobserved was Sunday evening where at 7:00 pm the lot was empty with zero vehicles parked in this lot. Table 2
Weekday vs. Weekend: This lot is more popular during the week vs the weekend. On average the lot was only 7.9% full during the weekend while 17.6% full during the week. Table 3
Day vs. Evening: This is the only parking lot in the study where on an average the evening parking demand was higher than a point during the day. In the evening (7 pm) the lot had an average occupancy of 13.5% while in the morning (9 am) only 10.3% of the lot’s spaces were taken. The most popular time overall was lunch when on average the lot was 20.6% full. Table 3
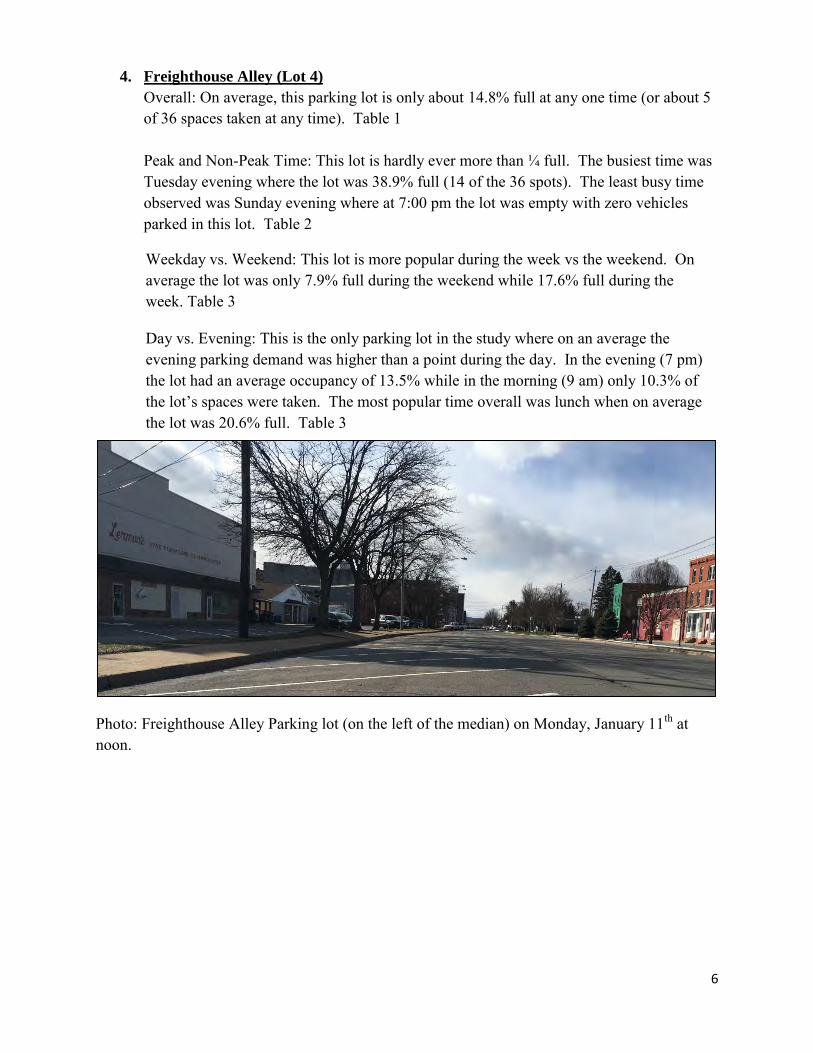
Photo: Freighthouse Alley Parking lot (on the left of the median) on Monday, January 11th atnoon.

7
5. Oneida Street (East) (Lot 3)
Overall: The parking lot with the least demand is Oneida Street (East) with an averageuse of only 9.3% at any one time or in other words only 4 vehicles on average wereparked in this lot at a time (out of 39 spaces). Table 1
Peak and Non-Peak Time: The overwhelming amount of time there were only 1-3 cars observed and on one occasion zero cars were observed in this lot. The only exception to this lot being empty or nearly empty is on Sunday at noon where 24 of the 39 spots (61.5%) were taken. We assume that this was due to a church service being held at the nearby Church of the Rock. The remainder of the time, the lot never had more than 6 cars parked in it. The least busy time was Monday morning (9 am) where zero cars were parked in the lot. Table 2
Weekday vs. Weekend: This is the only lot where there was (slightly) higher demand on the weekend than the weekday. On average 6 cars were parked in this lot on the weekend while during the week only about 3 out of the 39 spaces were taken. Table 3
Day vs. Evening: Slightly more parking occurs in this lot during the day vs the evening. In the morning (9am) the average was 3 spaces taken while at noon the average was 6 and in the evening (7 pm) the average was 2 spaces taken. Table 3
Photo: Oneida Street (East) lot on Saturday, January 9th at 12:00 (noon)

8
Conclusion
Ample parking opportunity was observed within these five lots serving City Center; in fact,
the majority of the time excess parking is available. Overall, the most underutilized lots
are Oneida St (East) and Freighthouse Alley while the most used lots are Oneida Street
West and the Main Street lot. However, even the most used lots were observed to provide
abundant parking opportunity within City Center.
Within this study area, the parking supply exceeds parking demand with average occupancies of the lots ranging from 9.3% to 39.6%. This means that out of the 207 parking spaces in this
area there are on average 149 spaces empty and available. It is important to provide parking to employees, residents and patrons, but excess parking is not only unnecessary but takes up valuable space especially within in a City Center.
Parking Lot Average Occupancy Main St 36.8% Oneida St (west) 39.6% Oneida St (east) 9.3% Frieghthouse Alley 14.8% City Hall 35.0%
Parking supply and demand is most efficient with occupancies of 85-90%. At this amount
the demand is being met without waste. Occupancies of 85-90% were only observed twice
in this area. Once in the Oneida St (West) parking lot where on Friday, 9 a.m. the lot was91.1% full and once on Main St where again on Friday, 9 a.m. that lot was 88.6% full (this due to traffic court held at this time). At all other times these and the other lots were always less
than ¾ full and at no time was any lot observed to be 100% full. It should be noted that parking size should never be planned around peak events (for example, planning parking size around the demand on Black Friday shopping day). Occupancy rates in this area demonstrate a high fluctuation between peak and non-peak times.
Parking Lot Peak Occupancy Non Peak Occupancy Occupancy Time Occupancy Time
Main St 88.6% Friday a.m. 0% Weds p.m. Oneida St (west) 91.1% Friday a.m. 2.2% Fri p.m.Oneida St (east) 61.5% Sunday noon 0% Mon a.m. Frieghthouse Alley 38.9% Tues p.m. 0% Sunday p.m. City Hall 61.5% Thurs a.m. 17.3% Sat noon Note: in this study, a.m. = 9 am and p.m. = 7pm
Table 1
Table 2

9
Another trend that was observed within these lots was that even when one lot reached a
higher occupancy it was surrounded by lots that were significantly less full. This reflects a
parking mismatch which can be mitigated by taking fuller advantage of other parking in the area. For example, on Friday mornings when the Oneida Street west parking lot was at 91.1% occupancy, Oneida Street east (the parking lot across the street) was virtually empty with only 6 of 39 spaces taken (or 15.4% occupied).
Other trends observed during this parking study is that overall, there is a higher parking
demand during the day vs the evening and during the weekday vs the weekend.
Avg Parking Spaces Used During…
Main St Oneida St (west)
Oneida St (east)
Frieghthouse Alley
City Hall Total % of 207 Spaces
Weekend 8 23.8% 7 14.8% 6 15.0% 3 7.9% 13 24.0% 36 17.5% 8 23.8%
Weekday 17 48.6% 22 49.5% 3 7.0% 6 17.6% 20 39.4% 69 33.2% 17 48.6%
Morning 19 53.5% 23 51.7% 3 6.6% 4 10.3% 24 45.6% 72 34.8% 19 53.5%
Lunch 17 48.2% 21 47.3% 6 15.8% 7 20.6% 19 37.4% 71 34.4% 17 48.2%
Evening 8 22.9% 9 19.7% 2 5.5% 5 13.5% 11 22.0% 35 17.0% 8 22.9%
Table 3

Date Day of Week Time Weather1/9/2016 Saturday 9:00 AM 20 57.1% 5 11.1% 3 7.7% 1 2.8% 21 40.4% 35 degrees, overcast1/9/2016 Saturday 12:00 PM 15 42.9% 17 37.8% 2 5.1% 4 11.1% 9 17.3% 40 degrees, overcast1/9/2016 Saturday 7:00 PM 4 11.4% 10 22.2% 1 2.6% 2 5.6% 10 19.2% 38 degrees, overcast10‐Jan‐16 Sunday 9:00 AM 2 5.7% 2 4.4% 3 7.7% 3 8.3% 11 21.2% 40 degrees, raining10‐Jan‐16 Sunday 12:00 PM 4 11.4% 3 6.7% 24 61.5% 7 19.4% 11 21.2% 47 degrees, overcast10‐Jan‐16 Sunday 7:00PM 5 14.3% 3 6.7% 2 5.1% 0 0.0% 13 25.0% 41 degrees, light rain11‐Jan‐16 Monday 9:00 AM 7 20.0% 25 55.6% 0 0.0% 3 8.3% 27 51.9% 20 degrees, sunny
11‐Jan‐16 Monday 12:00 PM 10 28.6% 22 48.9% 2 5.1% 6 16.7% 25 48.1% 25 degrees, sunny+windy
11‐Jan‐16 Monday 7:00 PM 8 22.9% 13 28.9% 1 2.6% 3 8.3% 12 23.1% 20 degrees, windy
12‐Jan‐16 Tuesday 9:00 AM 23 65.7% 31 68.9% 3 7.7% 3 8.3% 24 46.2% 25 degrees, overcast
12‐Jan‐16 Tuesday 12:00 PM 25 71.4% 25 55.6% 3 7.7% 6 16.7% 24 46.2% 31 degrees, overcast
12‐Jan‐16 Tuesday 6:00 PM 11 31.4% 9 20.0% 3 7.7% 14 38.9% 12 23.1% 28 degrees, snowing
13‐Jan‐16 Wednesday 9:00 AM 24 68.6% 28 62.2% 1 2.6% 9 25.0% 24 46.2% 19 degrees, heavy snow
13‐Jan‐16 Wednesday 12:00 PM 16 45.7% 26 57.8% 4 10.3% 9 25.0% 22 42.3% 20 degrees, sunny13‐Jan‐16 Wednesday 7:00 PM 0 0.0% 17 37.8% 2 5.1% 2 5.6% 10 19.2% 14 degrees, clear
14‐Jan‐16 Thursday 9:00 AM 24 68.6% 31 68.9% 2 5.1% 6 16.7% 32 61.5% 23 degrees, sunny
14‐Jan‐16 Thursday 12:00 PM 23 65.7% 27 60.0% 2 5.1% 10 27.8% 23 44.2% 28 degrees, sunny14‐Jan‐16 Thursday 6:00 PM 7 20.0% 9 20.0% 2 5.1% 5 13.9% 12 23.1% 22 degrees, overcast
15‐Jan‐16 Friday 9:00 AM 31 88.6% 41 91.1% 6 15.4% 1 2.8% 27 51.9% 35 degrees, cloudy
15‐Jan‐16 Friday 12:00 PM 25 71.4% 29 64.4% 6 15.4% 10 27.8% 22 42.3% 37 degrees, cloudy15‐Jan‐16 Friday 7:00 PM 21 60.0% 1 2.2% 4 10.3% 8 22.2% 11 21.2% 34 degrees, clear
13 36.8% 18 39.6% 4 9.3% 5 14.8% 18 35.0%Overall Averages of Parking Spaces Used:
Total Spaces Available: 35 45 39 36 52
ORT Downtown Oneida Parking Study Observed Occupied Spaces
1. Main St (35) 2. Oneida St (west) (45) 3. Oneida St (east) (39) 4. Freighthouse Alley (36) 5. City Hall (52)
Attachment A
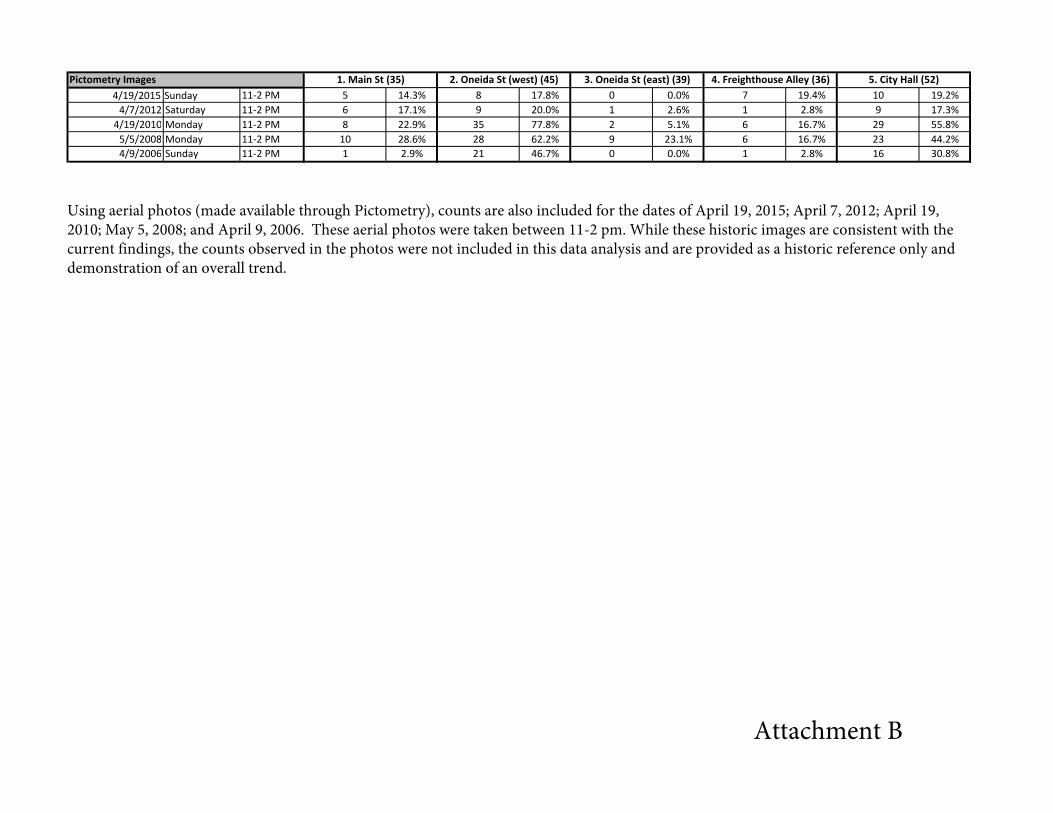
Pictometry Images4/19/2015 Sunday 11‐2 PM 5 14.3% 8 17.8% 0 0.0% 7 19.4% 10 19.2%4/7/2012 Saturday 11‐2 PM 6 17.1% 9 20.0% 1 2.6% 1 2.8% 9 17.3%4/19/2010 Monday 11‐2 PM 8 22.9% 35 77.8% 2 5.1% 6 16.7% 29 55.8%5/5/2008 Monday 11‐2 PM 10 28.6% 28 62.2% 9 23.1% 6 16.7% 23 44.2%4/9/2006 Sunday 11‐2 PM 1 2.9% 21 46.7% 0 0.0% 1 2.8% 16 30.8%
1. Main St (35) 2. Oneida St (west) (45) 3. Oneida St (east) (39) 4. Freighthouse Alley (36) 5. City Hall (52)
Attachment B
Using aerial photos (made available through Pictometry), counts are also included for the dates of April 19, 2015; April 7, 2012; April 19, 2010; May 5, 2008; and April 9, 2006. These aerial photos were taken between 11-2 pm. While these historic images are consistent with the current findings, the counts observed in the photos were not included in this data analysis and are provided as a historic reference only and demonstration of an overall trend.

1
2
3 4
Sunday April 19, 2015 (11AM – 2PM)
5

1
2
3 4
Saturday April 7, 2012 (11AM – 2PM)
5

1
2
3 4
Monday April 19, 2010 (11AM – 2PM)
5

1
2
3 4
Monday May 5, 2008 (11AM – 2PM)
5

1
2
3 4
Sunday April 9, 2006 (11AM – 2PM)
5