park district of oak park -...
TRANSCRIPT
PARK DISTRICT OF OAK PARK 2014 Performance Measurement Report
218 Madison St Oak Park, IL 60302 (708) 725-2000 www.pdop.org

2
218 Madison St Oak Park, IL 60302 (708) 725-2000 www.pdop.org
Project Team Bobbi Nance, Project Manager
Michael Papa, IT Manager
Management Review Team Jan Arnold, Execu ve Director
Paula Bickel, Director of HR & Risk Management Kyle Cra y, Director of Finance
Mike Grandy, Superintendent of Buildings & Grounds Bill Hamilton, Superintendent of Revenue Facili es Maureen McCarthy, Superintendent of Recrea on
Diane Stanke, Director of Marke ng & Customer Service Mitch Bowlin, Finance Manager Chad Dru e, Program Manager
Karen Gruszka, Execu ve Assistant Amanda Heiman, Program Manager
Jamie Lapke, Program & Opera ons Manager Chris Lindgren, Assistant Superintendent of Buildings & Grounds
Mike Lushniak, Program & Opera ons Manager Bobbi Nance, Project Manager
Michael Papa, IT Manager Gabe Romanucci, HR Safety Risk Manager Sco Sekulich, Customer Service Manager
Travis Stephen, Sports Field Manager Poppy Vogel, Cheney Mansion Supervisor
Board of Commissioners Jessica Bullock, President
Paul Aeschleman, Vice-President Victor Guarino, Treasurer
Sandy Lentz, Secretary David Wick, Commissioner
3
WHY MEASURE OUR PERFORMANCE? Performance measurement provides an objec ve and quan fiable way in which to see successes and areas in need of improvement. The Park District’s progress is measured against data from previous years, targets set in planning documents, and benchmarks with other communi es and organiza ons. The Park District of Oak Park’s performance measurement program allows us to:
• communicate priori es internally among employees, as well as externally to the Board of Commissioners, ci zen commi ees, and the public,
• learn how the Park District’s present state relates to past performance and future plans • demonstrate progress towards mee ng its mission, goals, and objec ves, • determine which policies, programs, facili es, and services most effec vely serve the community’s
needs, • provide direc on for alloca on of funds, staff, and other resources, and • offer transparency and accountability to the public.
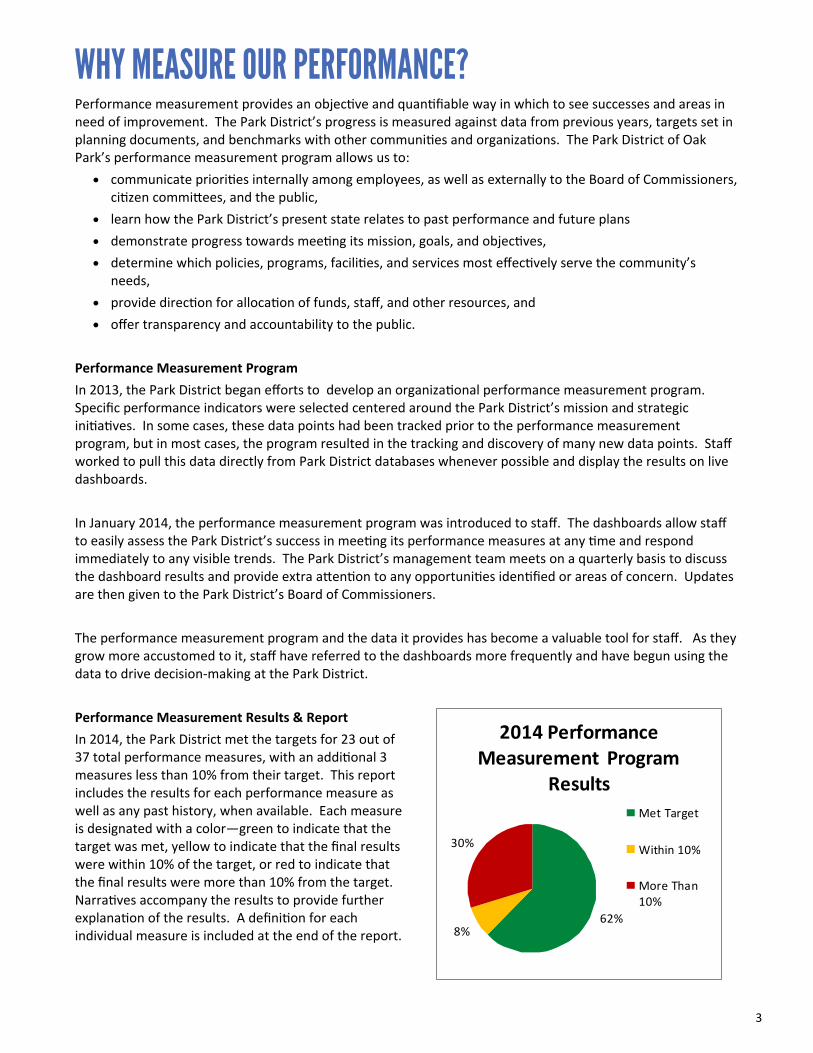
Performance Measurement Program In 2013, the Park District began efforts to develop an organiza onal performance measurement program. Specific performance indicators were selected centered around the Park District’s mission and strategic ini a ves. In some cases, these data points had been tracked prior to the performance measurement program, but in most cases, the program resulted in the tracking and discovery of many new data points. Staff worked to pull this data directly from Park District databases whenever possible and display the results on live dashboards. In January 2014, the performance measurement program was introduced to staff. The dashboards allow staff to easily assess the Park District’s success in mee ng its performance measures at any me and respond immediately to any visible trends. The Park District’s management team meets on a quarterly basis to discuss the dashboard results and provide extra a en on to any opportuni es iden fied or areas of concern. Updates are then given to the Park District’s Board of Commissioners. The performance measurement program and the data it provides has become a valuable tool for staff. As they grow more accustomed to it, staff have referred to the dashboards more frequently and have begun using the data to drive decision-making at the Park District. Performance Measurement Results & Report In 2014, the Park District met the targets for 23 out of 37 total performance measures, with an addi onal 3 measures less than 10% from their target. This report includes the results for each performance measure as well as any past history, when available. Each measure is designated with a color—green to indicate that the target was met, yellow to indicate that the final results were within 10% of the target, or red to indicate that the final results were more than 10% from the target. Narra ves accompany the results to provide further explana on of the results. A defini on for each individual measure is included at the end of the report.
62%8%
30%
2014 Performance Measurement Program
Results Met Target
Within 10%
More Than10%
4
MEETING OUR MISSION
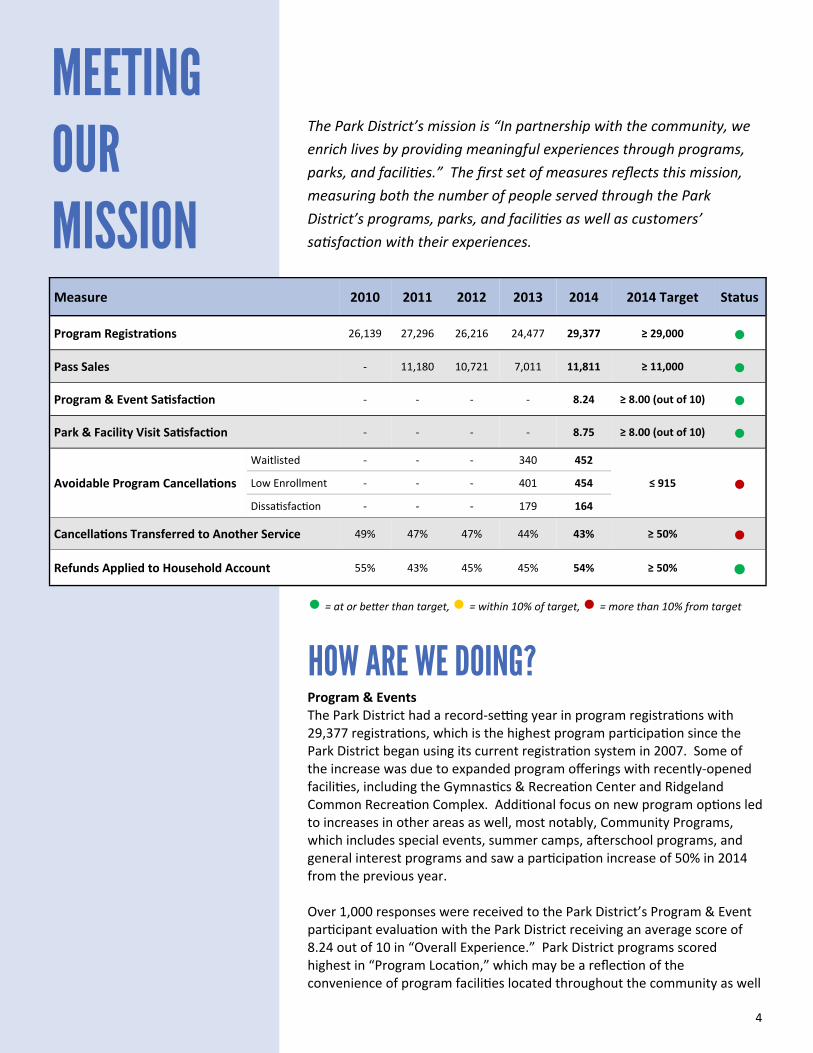
The Park District’s mission is “In partnership with the community, we enrich lives by providing meaningful experiences through programs, parks, and facili es.” The first set of measures reflects this mission, measuring both the number of people served through the Park District’s programs, parks, and facili es as well as customers’ sa sfac on with their experiences.
Measure 2010 2011 2012 2013 2014 2014 Target Status
Program Registra ons 26,139 27,296 26,216 24,477 29,377 ≥ 29,000 ● Pass Sales - 11,180 10,721 7,011 11,811 ≥ 11,000 ● Program & Event Sa sfac on - - - - 8.24 ≥ 8.00 (out of 10) ● Park & Facility Visit Sa sfac on - - - - 8.75 ≥ 8.00 (out of 10) ●
Avoidable Program Cancella ons
Waitlisted - - - 340 452
≤ 915 Low Enrollment - - - 401 454
Dissa sfac on - - - 179 164
Cancella ons Transferred to Another Service 49% 47% 47% 44% 43% ≥ 50% ● Refunds Applied to Household Account 55% 43% 45% 45% 54% ≥ 50% ●
●
● = at or be er than target, ● = within 10% of target, ● = more than 10% from target
Program & Events The Park District had a record-se ng year in program registra ons with 29,377 registra ons, which is the highest program par cipa on since the Park District began using its current registra on system in 2007. Some of the increase was due to expanded program offerings with recently-opened facili es, including the Gymnas cs & Recrea on Center and Ridgeland Common Recrea on Complex. Addi onal focus on new program op ons led to increases in other areas as well, most notably, Community Programs, which includes special events, summer camps, a erschool programs, and general interest programs and saw a par cipa on increase of 50% in 2014 from the previous year. Over 1,000 responses were received to the Park District’s Program & Event par cipant evalua on with the Park District receiving an average score of 8.24 out of 10 in “Overall Experience.” Park District programs scored highest in “Program Loca on,” which may be a reflec on of the convenience of program facili es located throughout the community as well
HOW ARE WE DOING?
5
as recent upgrades to Park District parks and facili es. The lowest score came in the area of “Price,” although the majority of programs were s ll rated as being a good value. Park District fitness and nature programs were rated the highest among all program areas. Parks & Facili es A er a significant dip in pass sales in 2013, the Park District rebounded in 2014 when its only indoor ice rink and second pool and dog park re-opened at the Ridgeland Common Recrea on Complex. Overall pass sales were at their highest level in the four years since the current pass system was enacted with 11,811 sold. Despite lower than average pool pass sales (thought to be due to a cooler, we er summer), they s ll made up 66% of all passes sold in 2014. Rink passes helped make up the difference with over 1,000 promo passes sold in associa on with the RCRC re-opening. Over 400 responses were collected to the Park District’s Park & Facility Visit evalua on with the Park District receiving an average score of 8.75 out of 10 in “Overall Experience.” The Park District scored highest in the area of “Staff Friendliness & Exper se” and lowest in “Parking,” which con nues to be a challenge throughout Oak Park. Not surprisingly, the highest rated parks and facili es were the Gymnas cs & Recrea on Center, Ridgeland Common Recrea on Complex, and Scoville Park, which are the Park District’s three most recently redeveloped/constructed facili es. Cancella ons & Refunds When refunds were requested in 2014, 43% of customers transferred their refund to another program or service, below the target of 50%. However, more customers chose to apply those refunds to their household account to be used for Park District programs and passes than in 2013. The Park District tracked more refund requests due to dissa sfac on, being waitlisted, and programs cancelled due to low enrollment, but this is a ributed to be er tracking of this data than in previous years. Regardless,
efforts need to be made to monitor and minimize the need for these types of refunds in future years.
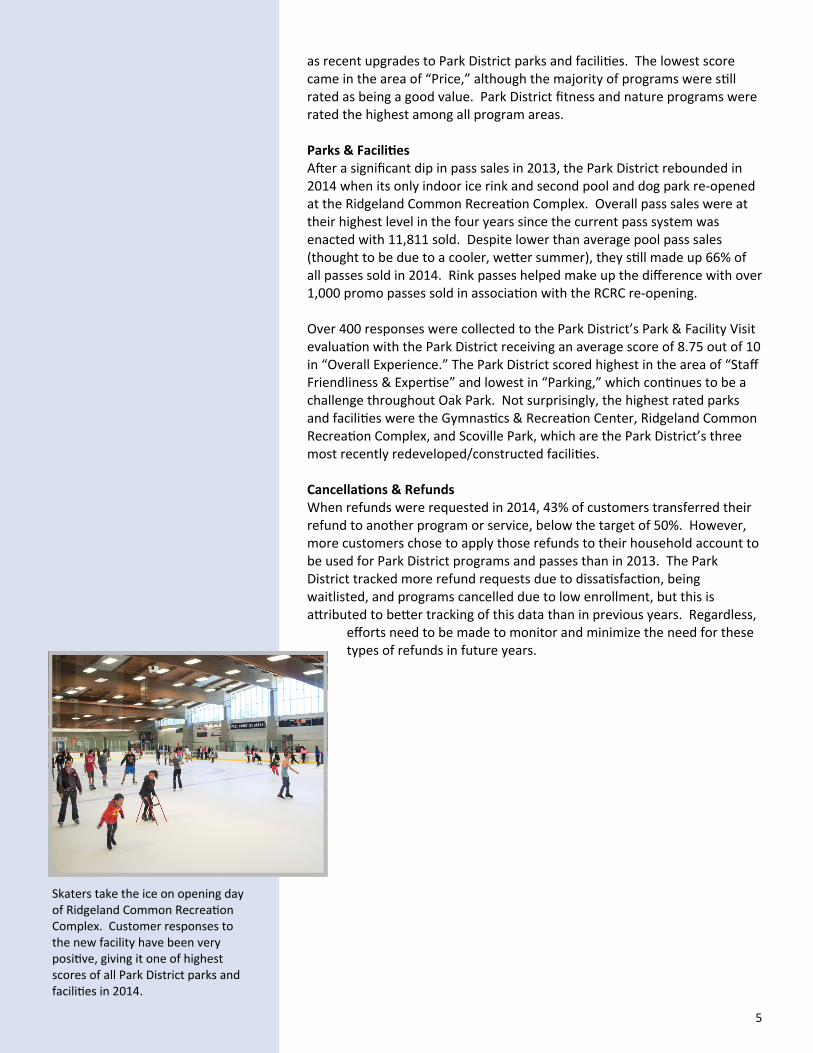
Skaters take the ice on opening day of Ridgeland Common Recrea on Complex. Customer responses to the new facility have been very posi ve, giving it one of highest scores of all Park District parks and facili es in 2014.
6
CUSTOMER FOCUSED
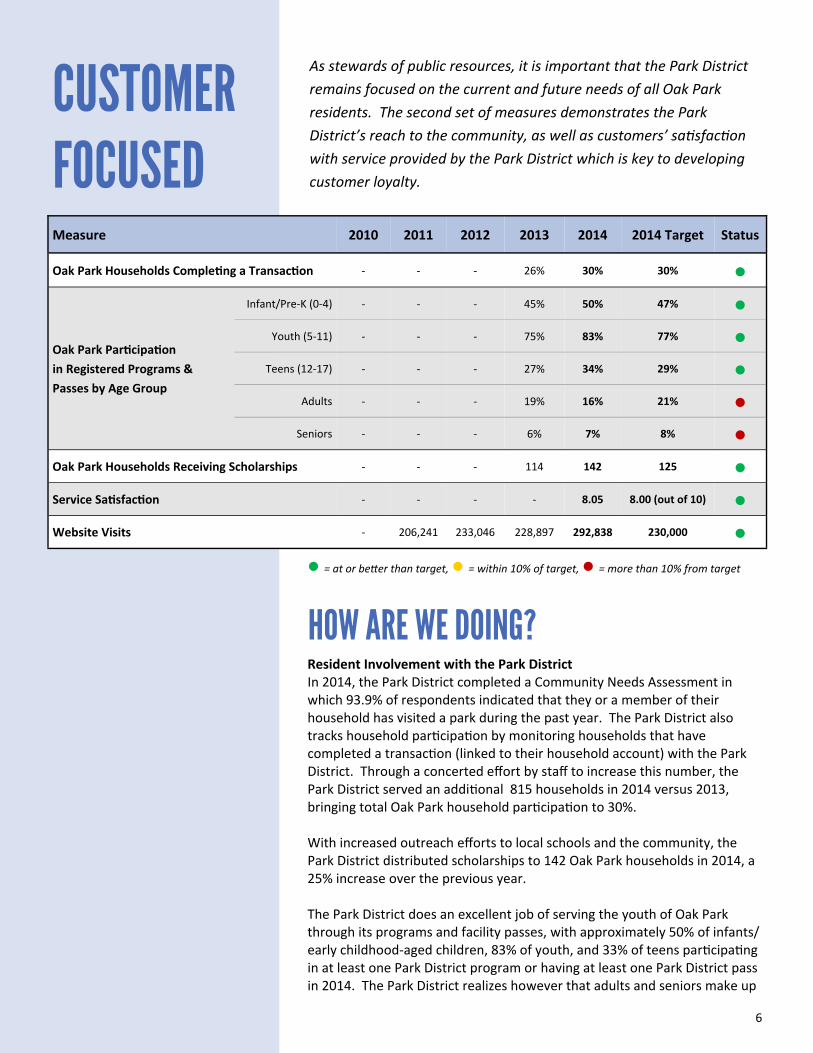
As stewards of public resources, it is important that the Park District remains focused on the current and future needs of all Oak Park residents. The second set of measures demonstrates the Park District’s reach to the community, as well as customers’ sa sfac on with service provided by the Park District which is key to developing customer loyalty.
● = at or be er than target, ● = within 10% of target, ● = more than 10% from target
Measure 2010 2011 2012 2013 2014 2014 Target Status
Oak Park Households Comple ng a Transac on - - - 26% 30% 30% ●
Oak Park Par cipa on in Registered Programs & Passes by Age Group
Infant/Pre-K (0-4) - - - 45% 50% 47% ● Youth (5-11) - - - 75% 83% 77% ●
Teens (12-17) - - - 27% 34% 29% ● Adults - - - 19% 16% 21% ●
Seniors - - - 6% 7% 8% ● Oak Park Households Receiving Scholarships - - - 114 142 125 ●
- - - - 8.05 8.00 (out of 10) ● Website Visits - 206,241 233,046 228,897 292,838 230,000 ●
Service Sa sfac on
Resident Involvement with the Park District In 2014, the Park District completed a Community Needs Assessment in which 93.9% of respondents indicated that they or a member of their household has visited a park during the past year. The Park District also tracks household par cipa on by monitoring households that have completed a transac on (linked to their household account) with the Park District. Through a concerted effort by staff to increase this number, the Park District served an addi onal 815 households in 2014 versus 2013, bringing total Oak Park household par cipa on to 30%. With increased outreach efforts to local schools and the community, the Park District distributed scholarships to 142 Oak Park households in 2014, a 25% increase over the previous year. The Park District does an excellent job of serving the youth of Oak Park through its programs and facility passes, with approximately 50% of infants/early childhood-aged children, 83% of youth, and 33% of teens par cipa ng in at least one Park District program or having at least one Park District pass in 2014. The Park District realizes however that adults and seniors make up
HOW ARE WE DOING?
7
approximately 75% of the popula on in Oak Park. In 2014, adult par cipa on in Park District programs and passes actually dropped by 3% to 16%. Addi onal effort is needed to curb this decline, especially as a theme from the Park District’s recent branding study indicated that the Park District may appear too “kid-focused.” In order to combat the low par cipa on levels from seniors, the Park District hired a part- me employee dedicated to serving that popula on in 2014. Par cipa on in senior programs and Ac ve Adult membership passes increased slightly in 2014, resul ng in the Park District reaching an addi onal 1% of Oak Park seniors from the previous year, but did not reach the target for the year. Customer Service In 2014, customers gave the Park District an average score of 8.05 out of 10 in five service areas. The Park District rated highest in the area of “Customer Care” and indicated that the Park District had their best interest at heart. The Park District rated lowest in “Facili es and Tangibles,” especially in the area of easy to follow and appealing signs, forms, and brochures. Website The Park District website saw a tremendous increase in visits in 2014, far exceeding expecta ons from the prior year a er finishing a complete redesign. Half of the visits came from mobile devices, demonstra ng the need for the Park District to pay special a en on to the mobile version of its website. The highest visited interior pages were for swimming, ice, and Frank Lloyd Wright races. Visits to the website were highest in the summer, and saw peak visits on the dates of two of the Park District’s largest events in 2014—with nearly 4,000 website visits on the weekend of the Ridgeland Common Recrea on Complex opening and over 6,000 on Frank Lloyd Wright Races weekend.
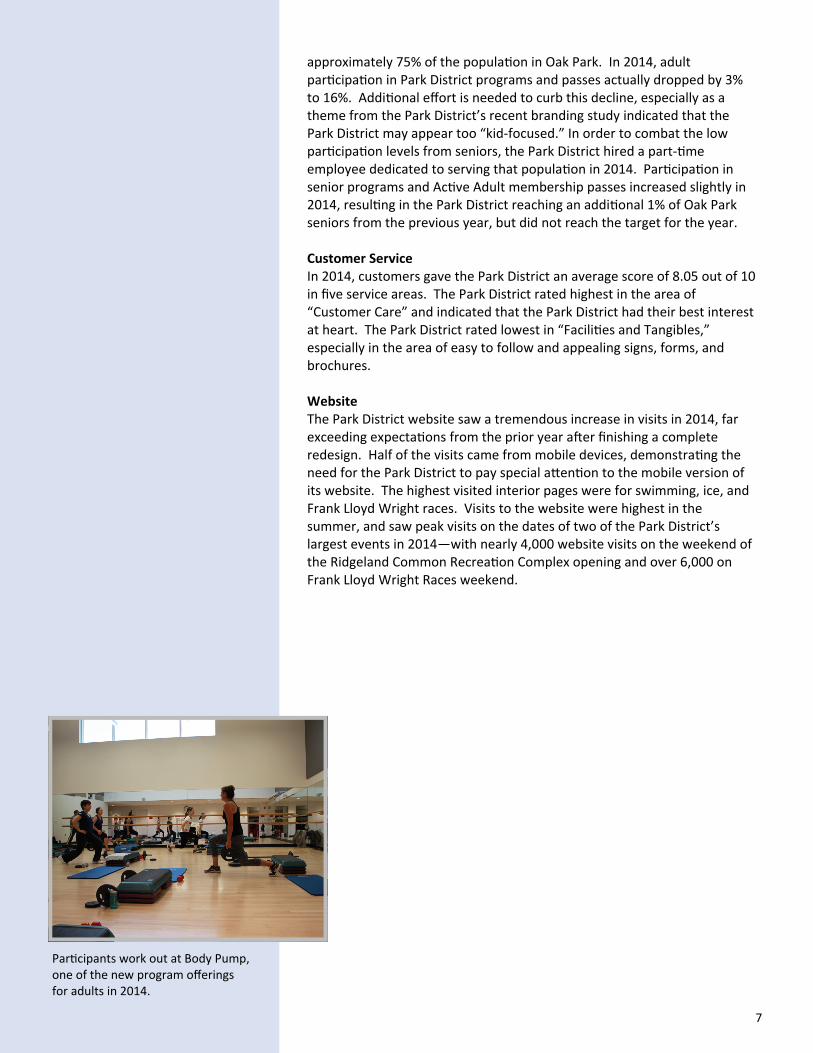
Par cipants work out at Body Pump, one of the new program offerings for adults in 2014.
8
FINANCIALLY STRONG
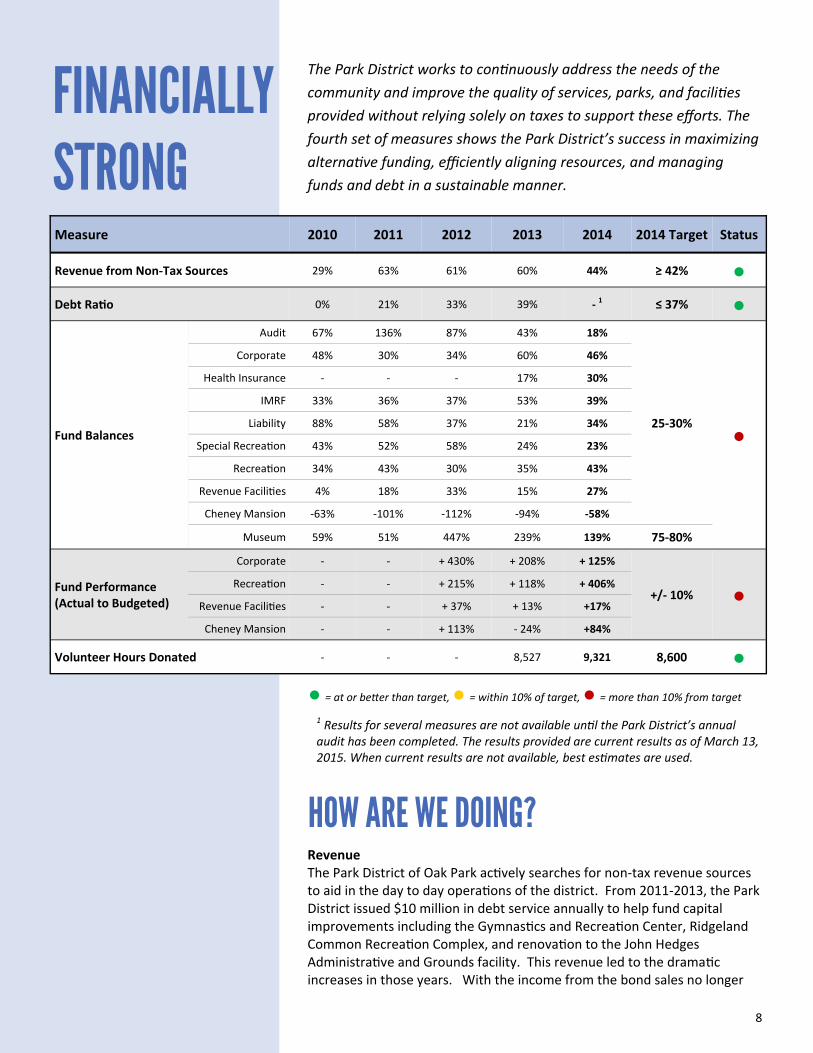
The Park District works to con nuously address the needs of the community and improve the quality of services, parks, and facili es provided without relying solely on taxes to support these efforts. The fourth set of measures shows the Park District’s success in maximizing alterna ve funding, efficiently aligning resources, and managing funds and debt in a sustainable manner.
● = at or be er than target, ● = within 10% of target, ● = more than 10% from target
Measure 2010 2011 2012 2013 2014 2014 Target Status
Revenue from Non-Tax Sources 29% 63% 61% 60% 44% ≥ 42% ● Debt Ra o 0% 21% 33% 39% - 1 ≤ 37% ●
Fund Balances
Audit 67% 136% 87% 43% 18%
●
Corporate 48% 30% 34% 60% 46%
Health Insurance - - - 17% 30%
IMRF 33% 36% 37% 53% 39%
Liability 88% 58% 37% 21% 34%
Special Recrea on 43% 52% 58% 24% 23%
Recrea on 34% 43% 30% 35% 43%
Revenue Facili es 4% 18% 33% 15% 27%
Cheney Mansion -63% -101% -112% -94% -58%
Museum 59% 51% 447% 239% 139% 75-80%
Fund Performance (Actual to Budgeted)
Corporate - - + 430% + 208% + 125%
+/- 10% ● Recrea on - - + 215% + 118% + 406%
Revenue Facili es - - + 37% + 13% +17%
Cheney Mansion - - + 113% - 24% +84%
Volunteer Hours Donated - - - 8,527 9,321 8,600 ●
25-30%
1 Results for several measures are not available un l the Park District’s annual audit has been completed. The results provided are current results as of March 13, 2015. When current results are not available, best es mates are used.
Revenue The Park District of Oak Park ac vely searches for non-tax revenue sources to aid in the day to day opera ons of the district. From 2011-2013, the Park District issued $10 million in debt service annually to help fund capital improvements including the Gymnas cs and Recrea on Center, Ridgeland Common Recrea on Complex, and renova on to the John Hedges Administra ve and Grounds facility. This revenue led to the drama c increases in those years. With the income from the bond sales no longer
HOW ARE WE DOING?
9
included in 2014, the Park District showed a decline from the prior year. However, in comparison to the most recent year with no debt service included, the Park District shows progress in this area with an overall es mated increase of 13% from 2010. The Park District’s overall goal is to reach 50% in this area by 2020.
A posi ve step towards mee ng that goal occurred in 2014 where, for the first me, the Park District department reached $1 million dollars in revenue. This was possible by an expansion in programming that was driven by the larger capacity of the newly constructed Gymnas cs and Recrea on Center.
Debt The Park District issued $30 million in debt from 2011-2013, leading to an overall 39% increase in the debt ra o. The 2014 debt ra o is unknown as of the publishing of this report, but should slowly decrease as the debt service con nues to be paid off. Fund Performances The fund balances of most of the Park District’s 10 funds con nues to be strong. Only three funds (Audit, Health Insurance, and Cheney Mansion) are below the minimum fund balances. However, five of the remaining seven funds have balances that are outside of the target range. Due to this, the 2015 budget includes larger capital transfers to expedite many needed capital improvements through the parks.
All major funds performed be er than budgeted in 2014. Park District staff, especially at Cheney Mansion and in the area of Community Programs (within the Recrea on Fund), kept expenditures in check and served more customers than budgeted which led to a posi ve budget variance. However, staff should con nue to refine the annual budget process to bring the fund performance closer to budget.
Volunteers The number of volunteer hours donated to the Park District in 2014 remained fairly close to the prior year. Approximately 500 people provided 9,321 hours of volunteer service to the Park District. If that work was instead completed by staff working at minimum wage, it would have cost the Park District over $76,000. Sixty-five percent of the hours were at the Oak Park Conservatory with another 21% coming from youth sports volunteers.
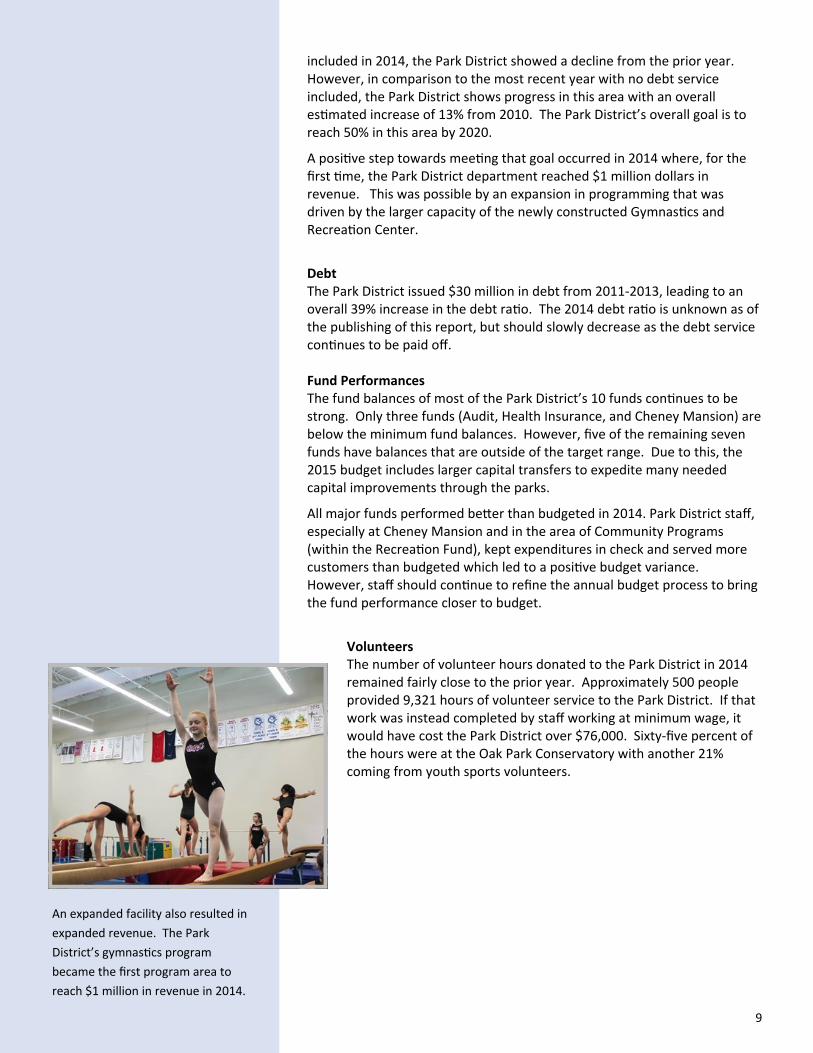
An expanded facility also resulted in expanded revenue. The Park District’s gymnas cs program became the first program area to reach $1 million in revenue in 2014.
10
INFRASTRUCTURE PRESERVATION & DEVELOPMENT
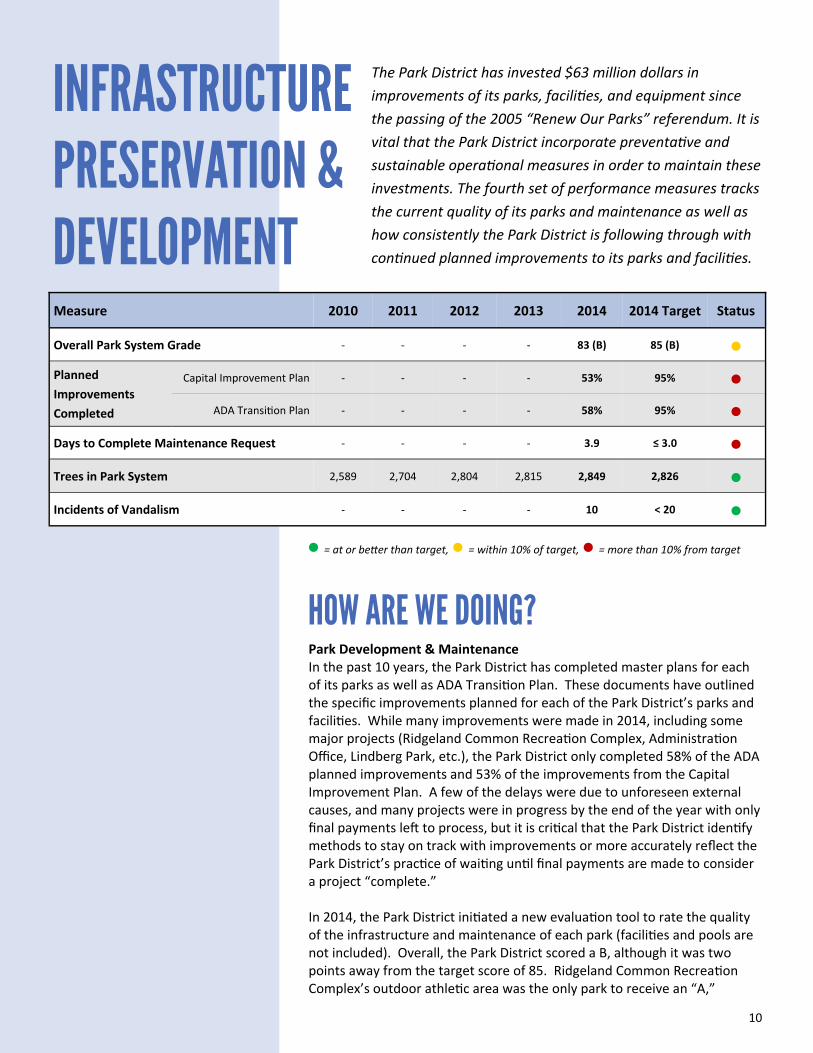
The Park District has invested $63 million dollars in improvements of its parks, facili es, and equipment since the passing of the 2005 “Renew Our Parks” referendum. It is vital that the Park District incorporate preventa ve and sustainable opera onal measures in order to maintain these investments. The fourth set of performance measures tracks the current quality of its parks and maintenance as well as how consistently the Park District is following through with con nued planned improvements to its parks and facili es.
● = at or be er than target, ● = within 10% of target, ● = more than 10% from target
Measure 2010 2011 2012 2013 2014 2014 Target
Overall Park System Grade - - - - 83 (B) 85 (B)
Planned Improvements Completed
Capital Improvement Plan - - - - 53% 95%
ADA Transi on Plan - - - - 58% 95%
Days to Complete Maintenance Request - - - - 3.9 ≤ 3.0
Trees in Park System 2,589 2,704 2,804 2,815 2,849 2,826
Incidents of Vandalism - - - - 10 < 20
Status
● ● ● ● ● ●
Park Development & Maintenance In the past 10 years, the Park District has completed master plans for each of its parks as well as ADA Transi on Plan. These documents have outlined the specific improvements planned for each of the Park District’s parks and facili es. While many improvements were made in 2014, including some major projects (Ridgeland Common Recrea on Complex, Administra on Office, Lindberg Park, etc.), the Park District only completed 58% of the ADA planned improvements and 53% of the improvements from the Capital Improvement Plan. A few of the delays were due to unforeseen external causes, and many projects were in progress by the end of the year with only final payments le to process, but it is cri cal that the Park District iden fy methods to stay on track with improvements or more accurately reflect the Park District’s prac ce of wai ng un l final payments are made to consider a project “complete.” In 2014, the Park District ini ated a new evalua on tool to rate the quality of the infrastructure and maintenance of each park (facili es and pools are not included). Overall, the Park District scored a B, although it was two points away from the target score of 85. Ridgeland Common Recrea on Complex’s outdoor athle c area was the only park to receive an “A,”
HOW ARE WE DOING?
11
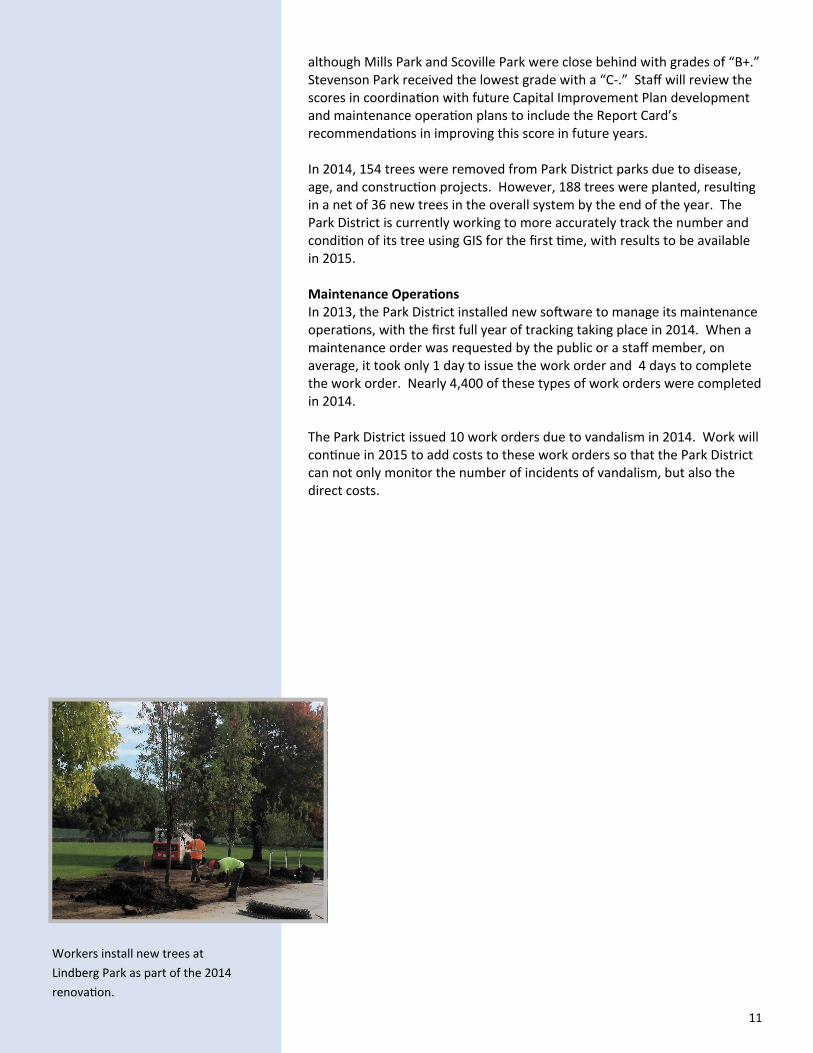
although Mills Park and Scoville Park were close behind with grades of “B+.” Stevenson Park received the lowest grade with a “C-.” Staff will review the scores in coordina on with future Capital Improvement Plan development and maintenance opera on plans to include the Report Card’s recommenda ons in improving this score in future years. In 2014, 154 trees were removed from Park District parks due to disease, age, and construc on projects. However, 188 trees were planted, resul ng in a net of 36 new trees in the overall system by the end of the year. The Park District is currently working to more accurately track the number and condi on of its tree using GIS for the first me, with results to be available in 2015. Maintenance Opera ons In 2013, the Park District installed new so ware to manage its maintenance opera ons, with the first full year of tracking taking place in 2014. When a maintenance order was requested by the public or a staff member, on average, it took only 1 day to issue the work order and 4 days to complete the work order. Nearly 4,400 of these types of work orders were completed in 2014. The Park District issued 10 work orders due to vandalism in 2014. Work will con nue in 2015 to add costs to these work orders so that the Park District can not only monitor the number of incidents of vandalism, but also the direct costs.
Workers install new trees at Lindberg Park as part of the 2014 renova on.
12
ORGANIZATIONAL EXCELLENCE
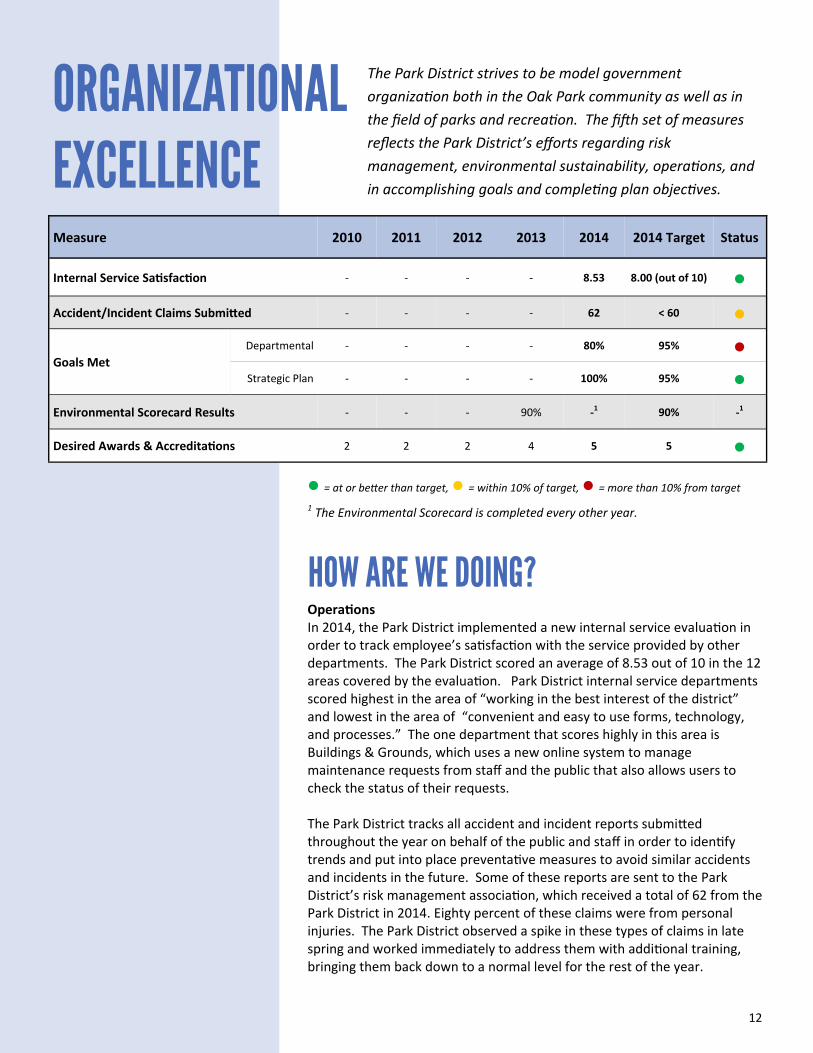
The Park District strives to be model government organiza on both in the Oak Park community as well as in the field of parks and recrea on. The fi h set of measures reflects the Park District’s efforts regarding risk management, environmental sustainability, opera ons, and in accomplishing goals and comple ng plan objec ves.
Opera ons In 2014, the Park District implemented a new internal service evalua on in order to track employee’s sa sfac on with the service provided by other departments. The Park District scored an average of 8.53 out of 10 in the 12 areas covered by the evalua on. Park District internal service departments scored highest in the area of “working in the best interest of the district” and lowest in the area of “convenient and easy to use forms, technology, and processes.” The one department that scores highly in this area is Buildings & Grounds, which uses a new online system to manage maintenance requests from staff and the public that also allows users to check the status of their requests. The Park District tracks all accident and incident reports submi ed throughout the year on behalf of the public and staff in order to iden fy trends and put into place preventa ve measures to avoid similar accidents and incidents in the future. Some of these reports are sent to the Park District’s risk management associa on, which received a total of 62 from the Park District in 2014. Eighty percent of these claims were from personal injuries. The Park District observed a spike in these types of claims in late spring and worked immediately to address them with addi onal training, bringing them back down to a normal level for the rest of the year.
HOW ARE WE DOING?
● = at or be er than target, ● = within 10% of target, ● = more than 10% from target
Measure 2010 2011 2012 2013 2014 2014 Target Status
Internal Service Sa sfac on - - - - 8.53 8.00 (out of 10) ● Accident/Incident Claims Submi ed - - - - 62 < 60 ●
Goals Met Departmental - - - - 80% 95% ● Strategic Plan - - - - 100% 95% ●
Environmental Scorecard Results - - - 90% -1 90% -1
Desired Awards & Accredita ons 2 2 2 4 5 5 ●
1 The Environmental Scorecard is completed every other year.

13
The Park District of Oak Park received their first Illinois Dis nguished Accredited Agency Award at the IAPD/IPRA Annual Conference luncheon in January.
Goals & Objec ves The Park District has several sets of goals and objec ves that staff work to meet each year through a variety of sources. The Park District met each of its objec ves outlined for 2014 in the Park District’s 2013-2015 Strategic Plan. This included many new ini a ves, such as the development of:
• opera ons plans for all of its parks and facili es, • an internal staff “hub” that allow staff to easily access Park District
policies, procedures, and important documents, • new agency-wide customer service standards, and • a staff Innova on Commi ee
Individual departments also create their own goals each year as part of the budget development process. Staff were successful in accomplishing 75% of these goals by the end of the year. Accredita ons & Awards In 2014, the Park District was awarded the Cer ficate of Achievement for Excellence in Financial Repor ng from the Government Finance Officers Associa on (GFOA) for the 2013 Fiscal Year Financial Report for the first me. This award is given to state and local governments that succeed in going beyond the minimum requirements of generally accepted accoun ng principles to prepare comprehensive annual financial reports that evidence the spirit of transparency and full disclosure. The Park District also received GFOA’s Dis nguished Budget Presenta on Award for the fi h year in a row.
14
STAFF EXCELLENCE
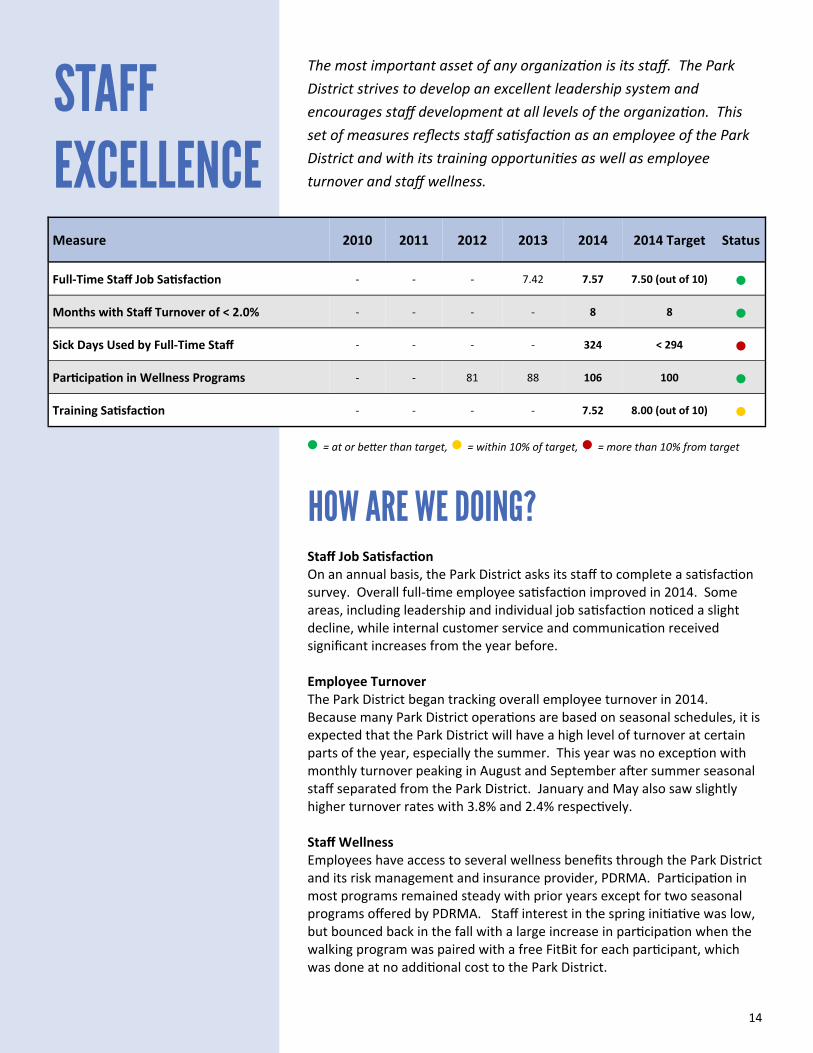
The most important asset of any organiza on is its staff. The Park District strives to develop an excellent leadership system and encourages staff development at all levels of the organiza on. This set of measures reflects staff sa sfac on as an employee of the Park District and with its training opportuni es as well as employee turnover and staff wellness.
● = at or be er than target, ● = within 10% of target, ● = more than 10% from target
Measure 2010 2011 2012 2013 2014 2014 Target Status
- - - 7.42 7.57 7.50 (out of 10) ● Months with Staff Turnover of < 2.0% - - - - 8 8 ● Sick Days Used by Full-Time Staff - - - - 324 < 294 ● Par cipa on in Wellness Programs - - 81 88 106 100 ● Training Sa sfac on - - - - 7.52 8.00 (out of 10) ●
Full-Time Staff Job Sa sfac on
Staff Job Sa sfac on On an annual basis, the Park District asks its staff to complete a sa sfac on survey. Overall full- me employee sa sfac on improved in 2014. Some areas, including leadership and individual job sa sfac on no ced a slight decline, while internal customer service and communica on received significant increases from the year before. Employee Turnover The Park District began tracking overall employee turnover in 2014. Because many Park District opera ons are based on seasonal schedules, it is expected that the Park District will have a high level of turnover at certain parts of the year, especially the summer. This year was no excep on with monthly turnover peaking in August and September a er summer seasonal staff separated from the Park District. January and May also saw slightly higher turnover rates with 3.8% and 2.4% respec vely. Staff Wellness Employees have access to several wellness benefits through the Park District and its risk management and insurance provider, PDRMA. Par cipa on in most programs remained steady with prior years except for two seasonal programs offered by PDRMA. Staff interest in the spring ini a ve was low, but bounced back in the fall with a large increase in par cipa on when the walking program was paired with a free FitBit for each par cipant, which was done at no addi onal cost to the Park District.
HOW ARE WE DOING?
15
For the first me, the Park District tracked the number of “sick days” used by full- me staff. Sick me includes me taken off by an employee for personal illness as well as to care for a qualified family member or for absences qualified under the Family & Medical Leave Act. The amount of sick days used by staff in 2014 was higher than the ini al target set, par ally due to a larger number of FMLA qualified-leaves than in years past. Staff Training A new standardized training evalua on was implemented in 2014 to gauge staff sa sfac on with internal and external training opportuni es. On average, staff rated the overall quality of their trainings at a 7.52 out of 10, which was slightly lower than the desired target of 8. Staff are currently examining the results to learn which loca ons and presenters received the highest scores in developing a more comprehensive training program for staff to roll out in 2015.

16
Program Registra ons: The total number of program and event registra ons sold in the current year through the Park District’s RecTrac so ware, a er any cancella ons or refunds have been processed. This measure does not include par cipa on in drop-in programs not requiring registra on, including special events. Addi onally, registra on for adult sports leagues counts as one registra on per team.
Pass Sales: The total number of passes and punch cards sold in the current year through the Park District’s RecTrac so ware. This measure does not include replacement passes sold for a lost ID card.
Program & Event Sa sfac on: The average “Overall Experience” score, on a scale of 0-10, given by respondents to the Park District’s Program & Event Evalua on from the current year.
Park & Facility Sa sfac on: The average “Overall Experience” score, on a scale of 0-10, given by respondents to the Park District’s Park & Facility Evalua on from the current year.
Avoidable Program Cancella ons: The total number of refunds processed through the Park District’s RecTrac so ware with the reason designated as one of the following: a customer being placed on a waitlist, a class being cancelled due to low enrollment, or customer dissa sfac on with an aspect of a Park District service.
Cancella ons Transferred to Another Service: The percent of refunds processed through the Park District’s RecTrac so ware where the customer chose to apply a por on or the full amount of the refund to another Park District program, pass, or service.
Refunds Applied to Household Account: The percent of refunds processed through the Park District’s RecTrac so ware where the customer chose to apply the refund to their household account instead of returning the funds to the customer by credit or check.
Oak Park Households Comple ng a Transac on: The percent of unique resident household accounts that have completed a transac on of any kind processed through the Park District’s RecTrac so ware system in the current year divided by the total number of households in Oak Park as indicated by the most recent Census data. This measure does not include undocumented household ac vity (visi ng a park or a ending an event that does not require registra on such as a summer concert).
Oak Park Par cipa on in Registered Programs & Passes by Age Group: The number of unique resident customers that have been registered for any program or league, or who have purchased a pass to any of the Park District’s facili es or programs processed through the Park District’s RecTrac so ware system in the current year divided by the number of residents in Oak Park in that age group as indicated by the most recent Census data. This measure does not include undocumented household ac vity (a ending an event that does not require registra on such as a summer concert) or other types of ac vity such as ren ng a facility.
Households Receiving Program/Pass Scholarships: The number of unique resident household accounts that have received and have used scholarship funds to register for a program or pass in the current year.
Service Sa sfac on: The average score, on a scale of 0-10, from the current year, from the Park District’s Service Sa sfac on Survey indica ng customer sa sfac on with the service provided by the Park District in the areas of Facili es & Tangibles, Reliability, Responsiveness, Customer Confidence, and Customer Care.
Website Visits: The total number of visits to the Park District in the current year.
Revenue from Non-Tax Sources: The percent of revenue collected in the current year by the Park District that does not come from the local tax levy, such as program revenue, fees and charges, sponsorships and dona on, intergovernmental revenue, rental income, and other miscellaneous revenue (including non-resident fees, vending machine revenue, rebates, etc.) and other financing sources (including debt service proceeds and transfers).
Debt Ra o: The ra o of total Park District debt to total Park District assets for the current year.
Fund Balances: The ra o of total fund assets to total fund expenditures.
Fund Performance (Actual to Budgeted): The difference between the actual total fund expenses and revenues to fund budget for the current year.
Volunteer Hours Donated: The number of volunteer hours reported by Park District supervisors at facili es, special events, ci zen commi ees, and other efforts.
PERFORMANCE MEASURE DEFINITIONS

17
Overall Park System Grade: The average score of all parks, on a scale of 0 to 100, from the Park District’s Park Report Card from the current year indica ng quality and maintenance of park system. This measure does not include Park District buildings or pools.
Planned Improvements Completed: The percentage of projects that were completed as scheduled in the current year as outlined in the Park District’s Capital Improvement Plan and ADA Transi on Plan.
Days to Complete a Maintenance Request: The average number of days between issuing and comple ng a “Demand” work order by staff in the Park District’s MicroMain so ware in the current year.
Trees in System: The total number of trees at the end of the current year in the Park District system as reported by staff.
Incidents of Vandalism: The total number of work orders issued in the current year in the Park District’s MicroMain so ware with the reason for failure designated as “Inten onal Outside Influence.”
Internal Service Sa sfac on: The average score, on a scale of 0-10, given by staff in the current year in the areas of Communica on, Skills & Knowledge, Approachable & Available, Courteous & Helpful, Reliable Responsive, Understanding, Professional & Discrete, Forms, Technology, & Processes, Working in the Best Interest of the District, and Enables Me to Be More Effec ve.
Accident/Incident Claims Submi ed: The number of accident and/or incident reports of a serious nature submi ed to the Park District’s risk management associa on in the current year as reported by Park District staff.
Goals Met: The percent of Park District goals met and/or objec ves completed as scheduled in the current year as outlined in the Park District Budget and Strategic Plan.
Environmental Scorecard Results: The score received on the IPRA Environmental Scorecard self-assessment, completed on a bi-annual basis.
Desired Awards & Accredita ons: The number of desired awards and accredita ons the Park District held in the current year.
Full-Time Staff Job Sa sfac on: The average score, on a scale of 0-10, given by full-staff in the current year in the areas of Vision, Leadership, Communica on, Customer Service, Team Values, and My Job.
Months with Staff Turnover of Less Than 2.0%: The number of months in the current year where overall staff turnover is less than 2.0%. Turnover includes separa on for any reason and staff at all levels (full- me, part- me, and seasonal).
Sick Days Used by Full-Time Staff: The total number sick days used by full- me staff in the current year. This measure includes me off taken by full- me staff for personal illnesses, to care for a family member’s illness, and FMLA leave.
Par cipa on in Wellness Programs: The total number of par cipants in Park District employee wellness programs.
Training Sa sfac on: The average “Overall Impression” score, on a scale of 0-10, given by staff through the Park District’s Training Evalua on from the current year.