parity or disparity the state of mental health in …dhss.alaska.gov/dbh/documents/parity or...
TRANSCRIPT

Parity or Disparity: The State of Mental Health in America2015

2
AcknowledgementsMental Health America (MHA), formerly the National Mental Health Association, was founded in 1909 and is the nation’s leading community-based network dedicated to helping all Americans achieve wellness by living mentally healthier lives. Our work is driven by our commitment to promote mental health as a critical part of overall wellness, including prevention services for all, early identification and intervention for those at risk, integrated care and treatment for those who need it, and recovery as the goal.
MHA dedicates this report to all mental health advocates who fight tirelessly to help create parity and reduce disparity for people with mental health concerns. To our affiliates, thank you for your incredible state level advocacy and dedication to promoting recovery and protecting consumers’ rights!
This report was prepared by Theresa Nguyen, Strategic Policy Analyst, and the issue spotlight was prepared by Theresa Nguyen and Nathaniel Counts, Policy Associate.
Finally, a special thanks to all of the following individuals and organizations who provided guidance, data and research:
Paul GionfriddoClarke RossDavid ShernDebbie Plotnick Substance Abuse and Mental Health Services Administration (SAMHSA) Center for Behavioral Health Statistics and Quality (CBHSQ)Paolo DelvecchioArt Hughes Kevin HennessyNASMHPD Research Institute Ted Lutterman
The Child and Adolescent Health Measurement Initiative (CAHMI) Rosa AvilaNarangerel GombojavEva HawesThe Centers for Disease Control and Prevention (CDC)William Thomson Brian Armour Stephen Blumberg Jennifer Madans Ruth Perou
This publication was made possible by the generous support of Eli Lilly and Company, Genentech, Otsuka America Pharmaceutical Inc., Takeda Pharmaceuticals U.S.A., Inc.. and Lundbeck U.S.

3
Table of Contents
Message from MHA’s President & CEO
Parity or Disparity
Rankings
Adult Prevalence of Mental Illness
Child/Youth Prevalence of Mental Illness
Adult Insurance and Access to Care
Child/Youth Insurance and Access to Care
Access Quality and Network Adequacy
Insuring Individuals with Mental Illness
Glossary
4
5
10
15
19
25
30
35
43
51

4
November, 2014
I am so pleased to share Mental Health America’s Parity or Disparity: The State of Mental Health in America 2015 first annual report with you.
For many years, Mental Health America has wanted to identify a common set of data indicators for mental health that would give us a more complete picture of mental health status in America. And as both the Mental Health Parity and Addiction Equity Act and the Patient Protection and Affordable Care Act were implemented, we also saw a need to establish a baseline from which we could document the successes and failures of both federal and state initiatives aimed at improving mental health status.
This report is the result.
For the first time, Mental Health America has pulled together a number of indicators available across all fifty states and the District of Columbia. We have organized them into general categories relating to mental health status and access to mental health services. Some indicators are specific to children; others to adults.
Together, they do something that hasn’t been done before – they paint a picture across the entire nation of both our mental health and how well we’re caring for it.
As you’ll see, disparity – more than parity – is the rule.
Some states fare better in the overall ranking and within each indicator, and some states fare worse. But I know from personal experience that policymakers and others want to know how their own state compares to others, and so they want to see these rankings. And keep in mind – who’s on top and who’s on the bottom can change dramatically depending on what indicators are most important to you.
Here’s what’s important to me. Taken as a whole, these indicators – and this report – encourage us to put a premium on earlier identification and earlier intervention on behalf of anyone with mental health concerns.
I wish that my own son Tim, who has battled schizophrenia for years, had been the beneficiary of what we at Mental Health America refer to as B4Stage4 thinking. We have to stop waiting until mental illnesses reach Stage 4 to treat them. By Stage 4, problems are so far advanced that even with the best treatments available, recovery is often compromised. We have to treat mental illnesses just as we do other chronic conditions—aggressively and effectively before they reach Stage 4. This report shows us there is still much work to do.
And as much as stories like those told in Losing Tim put a face on these numbers, the numbers themselves help quantify just how many people like Tim are out there. Too many are heading for bad outcomes unless we change the way we think and act.
So, let’s get the word out. Let’s use this report as a starting point to change the conversation. Let’s tell our stories, share these data, and help to advance our common cause of promoting mental health before Stage 4!
Paul GionfriddoPresident and CEO
Message from MHA’s President & CEO
5
Our Report is a Collection of Data Showing:
• How many people have a mental health need across all 50 states and the District of Columbia.
• How many people have access to insurance and access to mental health care in each state.
• How many people continue to face difficulty accessing care in each state.
Our Goals:
• To provide a snapshot of mental health status among children and adults for policy and program planning, analysis, and evaluation.
• To provide a baseline to track outcomes of state and federal legislation, including the Mental Health Parity and Addiction Equity Act (MHPAEA) and the Affordable Care Act (ACA).
• To increase dialogue and improve outcomes for individuals and families with mental health needs.
This Report:
• Includes national survey data that allow measurement of a community’s needs, access to care, and outcomes regardless of the differences between the states and their varied mental health policies.
• Includes rankings that explore which states are more effective at addressing issues related to mental health.
• Shows similarities and differences among states in order to begin assessing how federal and state mental health policies result in more or less access to care.
Parity or Disparity: The State of Mental Health in America

6
Mental Health America is committed to promoting mental health as a critical part of overall wellness. We advocate for prevention services for all, early identification and intervention for those at risk,
integrated services, care and treatment for those who need it, and recovery as the goal.
As part of this report, MHA identified the following policy priorities related to insurance and access to care:
• Enrollment. All people should have insurance coverage. Insurance is especially important for people with mental health needs, who have historically been cut out of receiving insurance benefits for mental health and substance use treatment. In 2012, 8.1 million American adults had a mental illness and were uninsured. In 2014, following the first ACA enrollment period, just over 8 million adults selected insurance through the marketplace. It is unclear how many individuals with mental illness accessed insurance through the marketplace.
• Medicaid Expansion. All states should expand Medicaid if they are serious about meeting the needs of people with serious mental health concerns. The Medicaid coverage gap (the “Medicaid Gap”) continues to leave a large number of people with behavioral health needs uninsured and untreated. States should expand Medicaid in a manner that results in access to care for people with behavioral health needs. Due to the failure of many states to expand Medicaid, an estimated 3.5 million adults with mental illness or substance use remain uninsured and are currently part of the “Medicaid Gap.”
• Access to Care. All people should have access to the care they need, including the full range of medications and other therapeutic options (including but not limited to talk therapy, peer supports, work therapy, housing, and educational supports). MHA believes that long term services and supports are best provided in the community where people can maintain relationships that help them thrive. Hospital beds are important when needs are acute. Jails are never a good – or the right – place for recovery. One out of five adults reports he/she did not receive needed mental health services. Additionally, two out of five children did not receive needed mental health services.
• Early Intervention. Youth should get the treatment they need. Through screening and early intervention, we can significantly reduce the negative impact of mental illness on individuals and their families. This is particularly important in the school setting, as 10 times as many students need access to special education than receive it.
• Network Adequacy. The mental health community depends on a strong workforce. To create a strong mental health workforce we need more clinical providers of all types, and we need to grow and train a vast network of peer support specialists. We believe that all insurance providers should include sufficiently broad networks of mental health professionals and we oppose “narrowing” networks as a cost savings measure. In states with the smallest number of mental health providers per population, there are approximately 1,600 individuals for every one provider.
• Transparency in Insurance Coverage. Consumers should know what services, limitations and costs they will face before they purchase their insurance plan. The data shows that one out of three adults with a disability reports he/she cannot see a health care provider due to cost.
• Focus on Recovery. What is determined to be “medically necessary” in coverage should be based on what is best for an individual in recovery. Focusing on recovery, community treatment, and early intervention will reduce utilization of expensive services and allow insurance companies to help more people. The national 180-day state hospital readmission rate is 19.6 percent. The median length of stay in a state hospital is two months (63 days).
• Parity Compliance. Insurance policies should be provided to consumers prior to purchasing a plan, especially for plans included on the health insurance marketplaces. Only fair and full disclosure of actual coverage will best promote meaningful consumer choice in health care. MHA’s analysis found fair and full disclosure of coverage outlines for Medicare Supplement Plans, but not for other commercial plans.
• More Mental Health Data. There needs to be more collection of behavioral health data. Data should be specific to individuals with mental illness. Data should be open for public access. The best data are also clear and uniform across the states.

7
Parity or Disparity: The State of Mental Health in America
Following the first enrollment period of the ACA, administrative data collected included the number of individuals who chose a qualified health plan and how many individuals enrolled in Medicaid, but information on disability status was not collected. The lack of data on disability status during ACA enrollment means that for the mental health community, there is no way to know exactly how many people with mental illness gained access to insurance. This lack of data, coupled with the complexity of the mental health system as whole, results in more questions than answers. These challenges led MHA to investigate national survey data to answer questions about the impact of the ACA on individuals with mental health problems. A primer on the ACA and the complexity of mental health insurance can be found on page 43 in our section entitled “Insuring Individuals with Mental Illness.”
Using national survey data, MHA wanted to answer the following questions:
• How many people with mental health needs will actually gain access to insurance under the ACA?• Even after getting insurance, can people with mental health needs get access to care? • Would barriers such as copays, coinsurances, denials of coverage, or lack of providers (both in insurance networks and in the community as a whole)
reduce access to care? • How will federal and state mental health policies affect access to mental health care?
Over time, MHA would like to explore additional questions, including:
• Do the national surveys and rankings reveal differences in how states are implementing and regulating federal legislation such as the ACA and MHPAEA?
• Will increased access to insurance result in increased access to behavioral health treatment?• Will increased access to treatment result in better mental health outcomes?
This chart book presents a collection of data that provides a baseline for answering some questions about the ACA and MHPAEA. At this point, however, any analysis of why states have a particular ranking is beyond the scope of this report. Even so, MHA hopes that the state rankings reveal patterns that will lead to additional questions and future research that can further explain the “parity or disparity” MHA sees between the states.
Searching for Mental Health DataFinding good mental health data is surprisingly difficult. This is especially true for youth data. While searching for mental health data, MHA found that national surveys define “mental health” differently. Some national surveys had definitions of disability that were relatively simple. The American Community Survey, for example, defines “Mental Disability” as: “Because of a physical, mental, or emotional condition lasting 6 months or more, the person has difficulty learning, remembering or concentrating.” Other surveys took a broader approach. Among measures presented in the report, are indicators from SAMHSA’s National Survey of Drug Use and Health (NSDUH). NSDUH’s definition of mental illness is “having a diagnosable mental, behavioral, or emotional disorder, other than a developmental or substance use disorder.” The NSDUH measures of mental illness are collected and analyzed from a series of approximately thirty questions using the Mental Health Surveillance Study Structured Clinical Interview for the Diagnostic and Statistical Manual of Mental Disorders. Also included in the report, the National Survey of Children’s Health (NSCH) measures mental health among children as “emotional, behavioral or developmental issues” (EBD). Specifically, the NSCH defines a child with a mental health condition “as any child (age 0-17) with any kind of emotional, developmental, or behavioral problem that requires treatment or counseling.”
The same complexities occur when exploring insurance access. For example, in the NSDUH, individuals are asked if they are insured by, e.g., private insurance, Medicare, Medicaid, CHIP, or TRICARE. Individuals are identified as “uninsured” if they are not covered by any private insurance or public insurance. The NSCH, similarly, asks if a child has any kind of health insurance coverage. In America, 94.5 percent of children had access to insurance at the time of the survey. The NSCH also explores “consistency of coverage”, which identified any period in the past 12 months where a child was uninsured.

8
MHA Guidelines
Given the variability described above, MHA developed guidelines to identify measures that were most appropriate for inclusion in our ranking. Indicators were chosen that met the following guidelines:
• Data that were publicly available and as new as possible to provide up-to-date results.• Data with definitions for mental illness that best represented individuals who have a mental health concern. • Data that are available for all 50 states plus the District of Columbia. • Data for both adults and youth. • Data that captured information regardless of varying utilization of the private and public mental health system. For example, data from the Uniform
Reporting System, which measures the public mental health system only, were assessed, but were not included in the ranking. • Data that could be collected over time to allow for analysis of future changes and trends.
Our Final Measures 1. Adults with Any Mental Illness (AMI)2. Adults with Dependence or Abuse of Illicit Drugs or Alcohol 3. Adults with Serious Thoughts of Suicide 4. Children with Emotional Behavioral Developmental Issues (EBD)5. Youth Dependence or Abuse of Illicit Drugs or Alcohol6. Youth with At Least One Major Depressive Episode 7. Youth Attempted Suicide (not included in the overall ranking)8. Adults with AMI and Uninsured 9. Adults with AMI Who Received Treatment10. Adults with AMI Reporting Unmet Need
11. Children with EBD Who Were Consistently Insured12. Children Who Needed but Did Not Get Mental Health Services 13. Students Identified with Seriously Emotional Disturbance for an
Individualized Education Plan14. Children with Ongoing EBD Reporting Inadequate Insurance 15. Adults with Disability Who Could Not See a Doctor Due to Costs 16. Mental Health Workforce Availability17. State Hospital 180-day Readmission Rate (not included in the overall
ranking)18. Improved Social Connectedness (not included in the overall ranking)
Survey Limitations
Each survey has its own strengths and limitations. Both the NSDUH and the NSCH have large sample sizes and utilized statistical modeling to provide weighted estimates of each state population. Of particular importance to the mental health community, the NSDUH does not collect information from persons who are homeless and who do not stay at shelters, are active duty military personnel, or are institutionalized (i.e., in jails or hospitals). This limitation means that those individuals who have a mental illness who are also homeless or incarcerated are not represented in the data presented by the NSDUH. If the data did include individuals who were homeless and/or incarcerated, we would possibly see prevalence of behavioral health issues increase and access to treatment rates worsen. It is MHA’s goal to continue to search for the best possible data in future reports. Additional information on the methodology and limitations of the surveys can be found online as outlined in the glossary.
A Complete Picture
While the above eighteen measures are not a comprehensive picture of the mental health system, they do provide a strong foundation for understanding the prevalence of mental health concerns, as well as issues of access to insurance and treatment, particularly as that access varies among the states. MHA will continue to explore new measures that allow us to more accurately and comprehensively capture the needs of those with mental illness and their access to care.
Labels
The labels used in this report are provided as they appear in the original survey, which is why adult mental illness is labeled as “Any Mental Illness,” while mental illness among children is labeled as “Emotional, Behavioral or Developmental Issues.” The glossary provides both the full definition of the measure as well as the source of each measure.

9
RankingMHA calculated the report’s rankings by giving a standardized score (Z score) for each measure and ranking the sum of the standardized scores. For measures where high scores are better outcomes, we calculated the standardized score by multiplying it by (-1), then used that figure in the sum. Measures that utilized reverse Z scores included: Adults with AMI Who Received Treatment, Children with EBD Who Were Consistently Insured, and Percent of Students Identified with Serious Emotional Disturbance for IEP. The ranking is based on the percentage or rate. All measures are important to us. MHA did not weight any measure in the rankings.
The Overall Ranking includes 15 measures. Youth Attempted Suicide, State Hospital 180 day Readmission Rate and Improved Social Connectedness were not included in any ranking. These measures were included in the report because we believe they highlight an important area of advocacy that MHA wants to track. Youth Attempted Suicide was not included in the overall ranking because it is missing data from a significant number of states. State Hospital Readmission and Improved Social Connectedness were not included in the overall ranking because they are outcome measures from only the public mental health system.
The Adult Ranking includes seven adult measures: Adult with Any Mental Illness (AMI), Adult Dependence or Abuse of Illicit Drugs or Alcohol, Adults with Serious Thoughts of Suicide, Adults with AMI and Uninsured, Adults with AMI who Received Treatment, Adults with AMI Reporting Unmet Need, and Adults with Disability who Could Not See a Doctor Due to Costs. The Youth Ranking includes seven youth measures: Children with Emotional Behavioral Developmental Issues (EBD), Youth Dependence or Abuse of Illicit Drugs or Alcohol, Youth with At Least One Major Depressive Episode, Children with EBD who were Consistently Insured, Children Who Needed but Did Not Get Mental Health Services, Students Identified with Serious Emotional Disturbance for IEP, and Children with Ongoing EBD Reporting Inadequate Insurance.
The Need Ranking includes six prevalence of mental illness measures: Adult with Any Mental Illness (AMI), Adult Dependence or Abuse of Illicit Drugs or Alcohol, Adults with Serious Thoughts of Suicide, Children with Emotional Behavioral Developmental Issues (EBD), Youth Dependence or Abuse of Illicit Drugs or Alcohol, and Youth with At Least One Major Depressive Episode.
The Access Ranking includes nine measures of access and access quality: Adults with AMI and Uninsured, Adults with AMI who Received Treatment, Adults with AMI Reporting Unmet Need, Children with EBD who were Consistently Insured, Children who Needed but Did Not Get Mental Health Services, Students Identified with Serious Emotional Disturbance for IEP, Children with Ongoing EBD Reporting Inadequate Insurance, Adults with Disability who Could Not See a Doctor Due to Costs, and Mental Health Workforce Availability.
Individual Ranking includes each measure ranked individually with an accompanying chart. The chart provides the percentage and estimated population for each ranking. The estimated population number is weighted and calculated by the agency conducting the applicable federal survey. The ranking is based on the percentage or rate. Data are presented with 2 decimal places when available. The individual rankings were grouped into categories listed in the table of contents.
Mental Health America in Action
While the national and state data provide an overall picture of the mental health of a region, it is important to note these qualifications:
1. A higher ranking does not necessarily indicate that a state is “doing well” in an objective sense. Rather, a high ranking only means that the particular state is doing better on that measure than those states that rank lower on that specific measure. Fundamentally, the data and MHA’s analysis reflect an immense amount of unmet need among all the states, even for the states that are, for the most part, doing “better” than other states.
2. Many of MHA affiliates advocate on a state level and see barriers experienced by individuals who have a mental illness. MHA included information from our affiliates throughout the report to highlight the complexity and ongoing unmet needs of the mental health community in specific states.

10
Ranking
Overall RankingThe combined scores for 15 of our measures make up the overall ranking.
A high overall ranking indicates lower prevalence of mental illness and higher rates of access to care. A low overall ranking indicates higher prevalence of mental illness and lower rates of access to care.
Based on MHA’s rankings, it appears that:
States with the lowest prevalence of mental illness and highest rates of access to care include:
• Massachusetts, Vermont, Maine, North Dakota, and Delaware.
States with the highest prevalence of mental illness and lowest rates of access to care include:
• Arizona, Mississippi, Nevada, Washington, and Louisiana.
States that rank in the top ten are in the Northeast and Midwest, while states that rank in the bottom ten are in the South and the West.
Rank State1 Massachusetts2 Vermont3 Maine4 North Dakota5 Delaware6 Minnesota7 Maryland8 New Jersey9 South Dakota
10 Nebraska11 Connecticut12 Iowa13 Hawaii
Rank State14 Pennsylvania15 Wisconsin16 Illinois17 New York18 North Carolina19 Kansas20 Virginia21 Ohio22 Missouri23 New Hampshire24 Rhode Island25 Tennessee26 Florida
Rank State27 Kentucky28 Colorado29 California30 District of Columbia31 Alaska32 Georgia33 South Carolina34 Indiana35 West Virginia36 Texas37 Utah38 Wyoming39 Alabama
Rank State40 Oregon41 Michigan42 Idaho43 Arkansas44 Montana45 Oklahoma46 New Mexico47 Louisiana48 Washington49 Nevada50 Mississippi51 Arizona

11
Adult vs. Youth The scores for the seven adult and seven youth measures make up the Adult and Youth Ranking.
States with high rankings have lower prevalence of mental illness and higher rates of access to care for adults and youth. Lower rankings indicate that adults and youth have higher prevalence of mental illness and lower rates of access to care. Based on MHA’s rankings, it appears that:
States with the lowest prevalence of mental illness and highest rates of access to care:
For adults include:
• Massachusetts, New Jersey, Hawaii, Maryland, and Connecticut.
For youth include:
• Vermont, North Dakota, Wisconsin, Iowa and Maine.
States with the highest prevalence of mental illness and lowest rates of access to care:
For adults include:
• Mississippi, Arizona, Oklahoma, Arkansas, and Washington.
For youth include:
• Nevada, New Mexico, Montana, Louisiana, and Washington.
Adult Ranking
Youth Ranking
Adult Ranking1 Massachusetts2 New Jersey3 Hawaii4 Maryland5 Connecticut6 Minnesota7 Delaware8 Illinois9 North Dakota
10 Nebraska11 North Carolina12 Maine13 Pennsylvania14 Virginia15 South Dakota16 Vermont17 Iowa18 New York19 New Hampshire20 California21 Wisconsin22 Tennessee23 Kansas24 Texas25 Florida26 Ohio27 Missouri28 Kentucky29 Georgia30 Alabama31 South Carolina32 Colorado33 Rhode Island34 Montana35 Louisiana36 Michigan37 Nevada38 Idaho39 Wyoming40 New Mexico41 Alaska42 District of Columbia43 West Virginia44 Indiana45 Utah46 Oregon47 Washington48 Arkansas49 Oklahoma50 Arizona51 Mississippi
Youth Ranking1 Vermont2 North Dakota3 Wisconsin4 Iowa5 Maine6 Massachusetts7 South Dakota8 Kansas9 West Virginia
10 Ohio11 Pennsylvania12 Minnesota13 District of Columbia14 Indiana15 Nebraska16 Delaware17 Missouri18 New York19 Illinois20 Maryland21 Alaska22 New Jersey23 Utah24 Rhode Island25 Connecticut26 Virginia27 Georgia28 Alabama29 Florida30 North Carolina31 Colorado32 Tennessee33 Kentucky34 South Carolina35 Hawaii36 Arkansas37 Oregon38 New Hampshire39 Texas40 Wyoming41 Idaho42 Mississippi43 Oklahoma44 Michigan45 California46 Arizona47 Washington48 Louisiana49 Montana50 New Mexico51 Nevada

12
Comparing Overall, Adult, and Youth RankingAmong the top quarter of ranked states (13 states for each ranking), four states are ranked high across Overall Ranking, Adult Ranking and Youth Ranking (In Orange):
• Massachusetts, Maine, North Dakota, and Minnesota.
In these states, both adults and youth have better mental health outcomes as compared to other states.
Among the bottom quarter of ranking states, five states consistently rank low across Overall Ranking, Adult Ranking and Youth Ranking (In Purple).
• Oklahoma, New Mexico, Washington, Mississippi, and Arizona.
In these states, both adults and youth have worse mental health outcomes as compared to other states.
How Adults Compare to Youth across StatesComparison across tables reveals both the states where adults are better cared for than youth and the states where youth are better cared for than adults.
Adults show better outcomes than youth where states rank higher in the Adult Ranking as compared to the Youth Ranking. These states include (In Red):
• New Jersey, Hawaii, Maryland, Connecticut, Illinois, North Carolina, Virginia, New Hampshire, California, Texas, Montana, Louisiana, and Nevada.
Similarly, youth show better outcomes than adults where states rank higher in Youth Ranking as compared to Adult Ranking. These states include (In Blue):
• Vermont, Wisconsin, Kansas, Ohio, District of Columbia, Indiana, Alaska, Utah and Arkansas.
Overall Ranking1 Massachusetts2 Vermont3 Maine4 North Dakota5 Delaware6 Minnesota7 Maryland8 New Jersey9 South Dakota
10 Nebraska11 Connecticut12 Iowa13 Hawaii14 Pennsylvania15 Wisconsin16 Illinois17 New York18 North Carolina19 Kansas20 Virginia21 Ohio22 Missouri23 New Hampshire24 Rhode Island25 Tennessee26 Florida27 Kentucky28 Colorado29 California30 District of Columbia31 Alaska32 Georgia33 South Carolina34 Indiana35 West Virginia36 Texas37 Utah38 Wyoming39 Alabama40 Oregon41 Michigan42 Idaho43 Arkansas44 Montana45 Oklahoma46 New Mexico47 Louisiana48 Washington49 Nevada50 Mississippi51 Arizona
Adult Ranking1 Massachusetts2 New Jersey3 Hawaii4 Maryland5 Connecticut6 Minnesota7 Delaware8 Illinois9 North Dakota
10 Nebraska11 North Carolina12 Maine13 Pennsylvania14 Virginia15 South Dakota16 Vermont17 Iowa18 New York19 New Hampshire20 California21 Wisconsin22 Tennessee23 Kansas24 Texas25 Florida26 Ohio27 Missouri28 Kentucky29 Georgia30 Alabama31 South Carolina32 Colorado33 Rhode Island34 Montana35 Louisiana36 Michigan37 Nevada38 Idaho39 Wyoming40 New Mexico41 Alaska42 District of Columbia43 West Virginia44 Indiana45 Utah46 Oregon47 Washington48 Arkansas49 Oklahoma50 Arizona51 Mississippi
Youth Ranking1 Vermont2 North Dakota3 Wisconsin4 Iowa5 Maine6 Massachusetts7 South Dakota8 Kansas9 West Virginia
10 Ohio11 Pennsylvania12 Minnesota13 District of Columbia14 Indiana15 Nebraska16 Delaware17 Missouri18 New York19 Illinois20 Maryland21 Alaska22 New Jersey23 Utah24 Rhode Island25 Connecticut26 Virginia27 Georgia28 Alabama29 Florida30 North Carolina31 Colorado32 Tennessee33 Kentucky34 South Carolina35 Hawaii36 Arkansas37 Oregon38 New Hampshire39 Texas40 Wyoming41 Idaho42 Mississippi43 Oklahoma44 Michigan45 California46 Arizona47 Washington48 Louisiana49 Montana50 New Mexico51 Nevada

13
Need vs. AccessThe scores for the six prevalence and nine access measures make up the Need and Access Ranking.
A high ranking on the Need Ranking indicates a lower prevalence of behavioral health concerns. In other words, the lower a state ranks on the Need Ranking, the higher the “need” is for mental health services. The Need Ranking includes the number of adults and youth with mental, emotional, behavioral problems and substance use issues.
The Access Ranking indicates how much access to mental health care a state has. MHA’s access measures include access to insurance, access to treatment, quality and cost of insurance, access to special education, and workforce availability. A high Access Ranking indicates that a state provides relatively more access to insurance and treatment.
Based on MHA’s rankings, it appears that:
States with the lowest prevalence of behavioral health concerns (rank 1-5) are:
• New Jersey, Maryland, Florida, Alabama, and North Carolina.
States with the highest prevalence of behavioral health concerns (rank 47-51) are:
• New Mexico, District of Columbia, Washington, Michigan, and Oklahoma.
States with highest rates of access to mental health care (rank 1-5) are:
• Vermont, Massachusetts, Maine, Delaware and Iowa.
States with lowest rates of access to mental health care (rank 47-51) are:
• Nevada, Mississippi, Alabama, Louisiana, and Texas.
Need Ranking
Access Ranking
Need Ranking1 New Jersey2 Maryland3 Florida4 Alabama5 North Carolina6 Texas7 Georgia8 Illinois9 Virginia
10 Kansas11 North Dakota12 Missouri13 New York14 Nevada15 Connecticut16 Colorado17 Minnesota18 Nebraska19 South Dakota20 Tennessee21 Wisconsin22 South Carolina23 California24 Hawaii25 Louisiana26 Mississippi27 Delaware28 Iowa29 Pennsylvania30 Indiana31 Ohio32 Massachusetts33 Utah34 Alaska35 Idaho36 New Hampshire37 Maine38 Kentucky39 Arkansas40 Arizona41 Rhode Island42 West Virginia43 Wyoming44 Montana45 Oregon46 Vermont47 Oklahoma48 Michigan49 Washington50 District of Columbia51 New Mexico
Access Ranking1 Vermont2 Massachusetts3 Maine4 Delaware5 Iowa6 North Dakota7 Pennsylvania8 Minnesota9 South Dakota
10 District of Columbia11 Nebraska12 Hawaii13 Connecticut14 Wisconsin15 Rhode Island16 New Hampshire17 Ohio18 New York19 Maryland20 Kentucky21 Illinois22 West Virginia23 Michigan24 Kansas25 Wyoming26 New Jersey27 New Mexico28 Oregon29 Alaska30 North Carolina31 Missouri32 Virginia33 Tennessee34 Oklahoma35 Montana36 Indiana37 California38 Washington39 Colorado40 Utah41 Arkansas42 Idaho43 South Carolina44 Florida45 Georgia46 Arizona47 Texas48 Louisiana49 Alabama50 Mississippi51 Nevada

14
Comparing Overall, Need, and Access RankingAmong the top and bottom quarter of ranked states, (13 states for each ranking):
• Florida, Alabama, Texas, and Georgia (In Purple) have the lowest rates of mental health need, but the lowest rates of access to care. Alabama, for example, has the lowest percentage of children with an emotional, behavioral, or developmental issue (EBD, ranked 1st, 6.87 percent of the population, on page 21), but among those children, access to treatment is relatively limited, as approximately a 13.7 percent lack consistent insurance and 46.3 percent did not receive needed treatment.
• Vermont and the District of Columbia (In Orange), on the other hand, have some of the highest rates of need but provide the best access to treatment. Vermont has a relatively high percentage of children with an EBD and is ranked 46th among children with an EBD (11.73 percent). However, in Vermont, only an estimated 3.3 percent of those children lack consistent insurance and only 22.1 percent did not receive needed treatment.
• Arizona and Arkansas (In Red) has both high rates of need and poor access to care, indicating that there are many in Arizona and Arkansas who might face significant barriers to recovery.
• On the other end, North Dakota (In Blue) stands out as having both low mental health prevalence and high access to treatment. People in North Dakota might face fewer barriers to recovery.
Implications on Overall Ranking• Cases like Vermont and Maine show how a state can still have
significantly high rates of mental health need, but move up in the overall ranking because of their strong access to treatment.
• Similarly, having lower rates of mental health need, but very poor access to treatment can result in lower positions in the overall ranking.
Overall Ranking1 Massachusetts2 Vermont3 Maine4 North Dakota5 Delaware6 Minnesota7 Maryland8 New Jersey9 South Dakota
10 Nebraska11 Connecticut12 Iowa13 Hawaii14 Pennsylvania15 Wisconsin16 Illinois17 New York18 North Carolina19 Kansas20 Virginia21 Ohio22 Missouri23 New Hampshire24 Rhode Island25 Tennessee26 Florida27 Kentucky28 Colorado29 California30 District of Columbia31 Alaska32 Georgia33 South Carolina34 Indiana35 West Virginia36 Texas37 Utah38 Wyoming39 Alabama40 Oregon41 Michigan42 Idaho43 Arkansas44 Montana45 Oklahoma46 New Mexico47 Louisiana48 Washington49 Nevada50 Mississippi51 Arizona
Need Ranking1 New Jersey2 Maryland3 Florida4 Alabama5 North Carolina6 Texas7 Georgia8 Illinois9 Virginia
10 Kansas11 North Dakota12 Missouri13 New York14 Nevada15 Connecticut16 Colorado17 Minnesota18 Nebraska19 South Dakota20 Tennessee21 Wisconsin22 South Carolina23 California24 Hawaii25 Louisiana26 Mississippi27 Delaware28 Iowa29 Pennsylvania30 Indiana31 Ohio32 Massachusetts33 Utah34 Alaska35 Idaho36 New Hampshire37 Maine38 Kentucky39 Arkansas40 Arizona41 Rhode Island42 West Virginia43 Wyoming44 Montana45 Oregon46 Vermont47 Oklahoma48 Michigan49 Washington50 District of Columbia51 New Mexico
Access Ranking1 Vermont2 Massachusetts3 Maine4 Delaware5 Iowa6 North Dakota7 Pennsylvania8 Minnesota9 South Dakota
10 District of Columbia11 Nebraska12 Hawaii13 Connecticut14 Wisconsin15 Rhode Island16 New Hampshire17 Ohio18 New York19 Maryland20 Kentucky21 Illinois22 West Virginia23 Michigan24 Kansas25 Wyoming26 New Jersey27 New Mexico28 Oregon29 Alaska30 North Carolina31 Missouri32 Virginia33 Tennessee34 Oklahoma35 Montana36 Indiana37 California38 Washington39 Colorado40 Utah41 Arkansas42 Idaho43 South Carolina44 Florida45 Georgia46 Arizona47 Texas48 Louisiana49 Alabama50 Mississippi51 Nevada
15
Adult Prevalence of Mental Illness
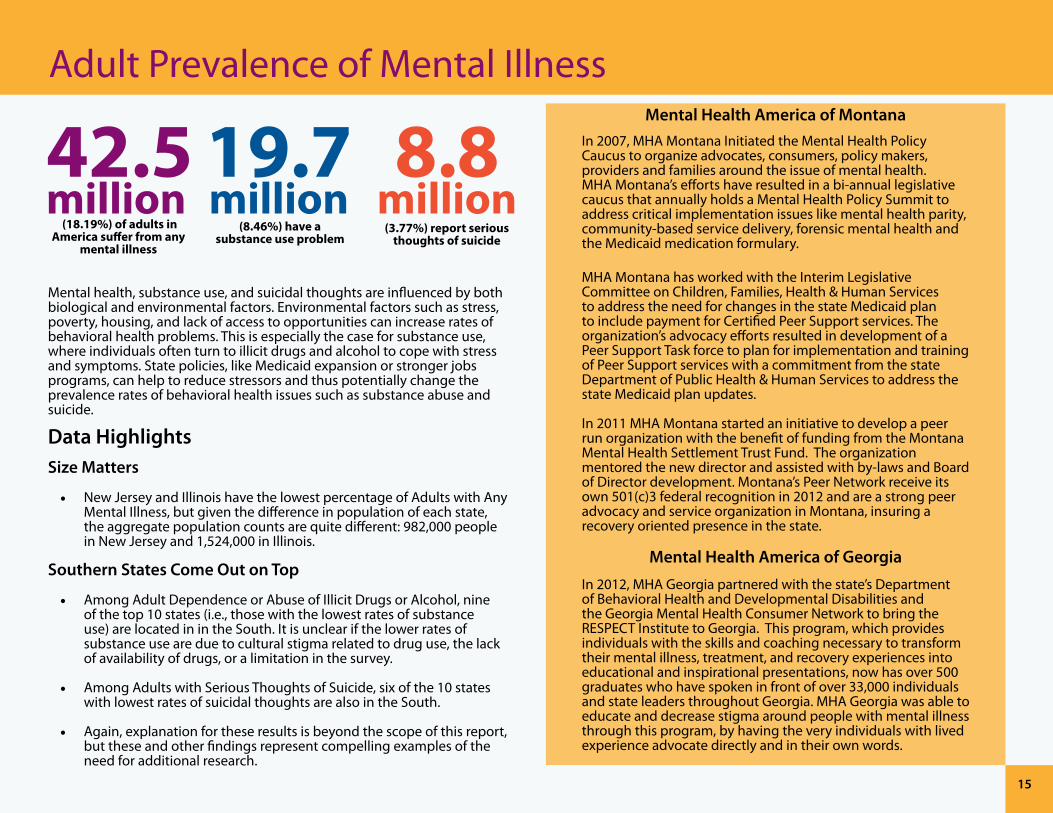
Mental health, substance use, and suicidal thoughts are influenced by both biological and environmental factors. Environmental factors such as stress, poverty, housing, and lack of access to opportunities can increase rates of behavioral health problems. This is especially the case for substance use, where individuals often turn to illicit drugs and alcohol to cope with stress and symptoms. State policies, like Medicaid expansion or stronger jobs programs, can help to reduce stressors and thus potentially change the prevalence rates of behavioral health issues such as substance abuse and suicide.
Data HighlightsSize Matters
• New Jersey and Illinois have the lowest percentage of Adults with Any Mental Illness, but given the difference in population of each state, the aggregate population counts are quite different: 982,000 people in New Jersey and 1,524,000 in Illinois.
Southern States Come Out on Top
• Among Adult Dependence or Abuse of Illicit Drugs or Alcohol, nine of the top 10 states (i.e., those with the lowest rates of substance use) are located in in the South. It is unclear if the lower rates of substance use are due to cultural stigma related to drug use, the lack of availability of drugs, or a limitation in the survey.
• Among Adults with Serious Thoughts of Suicide, six of the 10 states with lowest rates of suicidal thoughts are also in the South.
• Again, explanation for these results is beyond the scope of this report, but these and other findings represent compelling examples of the need for additional research.
Mental Health America of MontanaIn 2007, MHA Montana Initiated the Mental Health Policy Caucus to organize advocates, consumers, policy makers, providers and families around the issue of mental health. MHA Montana’s efforts have resulted in a bi-annual legislative caucus that annually holds a Mental Health Policy Summit to address critical implementation issues like mental health parity, community-based service delivery, forensic mental health and the Medicaid medication formulary.
MHA Montana has worked with the Interim Legislative Committee on Children, Families, Health & Human Services to address the need for changes in the state Medicaid plan to include payment for Certified Peer Support services. The organization’s advocacy efforts resulted in development of a Peer Support Task force to plan for implementation and training of Peer Support services with a commitment from the state Department of Public Health & Human Services to address the state Medicaid plan updates.
In 2011 MHA Montana started an initiative to develop a peer run organization with the benefit of funding from the Montana Mental Health Settlement Trust Fund. The organization mentored the new director and assisted with by-laws and Board of Director development. Montana’s Peer Network receive its own 501(c)3 federal recognition in 2012 and are a strong peer advocacy and service organization in Montana, insuring a recovery oriented presence in the state.
Mental Health America of Georgia
In 2012, MHA Georgia partnered with the state’s Department of Behavioral Health and Developmental Disabilities and the Georgia Mental Health Consumer Network to bring the RESPECT Institute to Georgia. This program, which provides individuals with the skills and coaching necessary to transform their mental illness, treatment, and recovery experiences into educational and inspirational presentations, now has over 500 graduates who have spoken in front of over 33,000 individuals and state leaders throughout Georgia. MHA Georgia was able to educate and decrease stigma around people with mental illness through this program, by having the very individuals with lived experience advocate directly and in their own words.
(18.19%) of adults in America suffer from any
mental illness
(8.46%) have a substance use problem
(3.77%) report serious thoughts of suicide

16
Adults with Any Mental Illness Rank State Percent Number1 New Jersey 14.66 982,0002 Illinois 15.86 1,524,0003 Nevada 16.05 327,0004 Connecticut 16.71 457,0005 North Carolina 16.84 1,213,0006 Texas 16.86 3,104,0007 Florida 16.87 2,509,0008 Minnesota 17.18 692,0009 North Dakota 17.21 90,00010 Massachusetts 17.38 893,00011 Hawaii 17.48 179,00012 Virginia 17.50 1,063,00013 California 17.68 4,964,00014 South Dakota 17.77 108,00015 Nebraska 17.89 243,00016 Maryland 17.93 792,00017 Wisconsin 17.98 778,00018 Pennsylvania 17.99 1,765,00019 Colorado 18.12 694,00020 Kansas 18.20 381,00021 Delaware 18.26 126,00022 Iowa 18.40 424,00023 New Hampshire 18.53 190,00024 New York 18.61 2,792,00025 Rhode Island 18.80 154,00026 Arizona 18.83 901,00027 Montana 18.92 145,00028 Alaska 18.94 97,00029 Georgia 18.99 1,360,00029 Missouri 18.99 855,00031 Louisiana 19.28 649,00032 Alabama 19.34 698,00033 Vermont 19.39 96,00034 District of Columbia 19.44 99,00035 Kentucky 19.47 635,00036 South Carolina 19.56 688,00037 New Mexico 19.59 300,00038 Wyoming 19.60 84,00039 Ohio 19.64 1,709,00040 Arkansas 19.81 432,00040 Michigan 19.81 1,484,00042 Indiana 19.87 961,00043 Maine 20.05 210,00044 Tennessee 20.25 979,00045 Mississippi 20.27 439,00046 Idaho 20.58 235,00047 Washington 20.77 1,074,00048 Oregon 20.89 624,00049 West Virginia 21.38 308,00050 Oklahoma 21.88 609,00051 Utah 22.35 431,000
United States 18.19 42,546,000

17
Adult Dependence or Abuse of Illicit Drugs or Alcohol Rank State Percent Number1 Alabama 6.58 238,0002 Utah 6.79 131,0003 Georgia 7.20 516,0004 Mississippi 7.24 157,0005 North Carolina 7.37 532,0006 Kentucky 7.42 242,0007 Virginia 7.56 459,0008 Arkansas 7.64 167,0009 Florida 7.71 1,146,00010 West Virginia 7.85 113,00011 Kansas 7.90 165,00012 Maryland 7.92 350,00013 Tennessee 7.95 384,00014 Hawaii 7.96 82,00015 New Jersey 8.03 538,00016 Texas 8.07 1,484,00017 Missouri 8.14 367,00018 South Carolina 8.20 289,00019 New York 8.36 1,255,00020 Pennsylvania 8.40 824,00021 Indiana 8.44 408,00022 Idaho 8.45 97,00023 Louisiana 8.48 285,00024 Maine 8.52 89,00025 New Hampshire 8.73 90,00026 California 8.80 2,472,00026 Illinois 8.80 845,00028 Ohio 8.86 771,00029 Michigan 8.92 668,00030 Iowa 8.94 206,00031 Nebraska 8.97 122,00032 Wisconsin 9.08 393,00033 Arizona 9.09 435,00034 Delaware 9.10 63,00035 Minnesota 9.22 372,00036 Connecticut 9.29 254,00037 Massachusetts 9.33 479,00038 Wyoming 9.35 40,00039 Oregon 9.49 283,00040 Washington 9.50 491,00041 New Mexico 9.54 146,00042 Vermont 9.61 48,00043 Oklahoma 9.94 276,00044 Colorado 10.13 388,00045 South Dakota 10.24 62,00046 North Dakota 10.30 54,00047 Nevada 10.31 210,00048 Alaska 10.33 53,00049 Montana 10.38 79,00050 Rhode Island 10.91 89,00051 District of Columbia 13.78 70,000
United States 8.46 19,777,000

18
Adults with Serious Thoughts of Suicide Rank State Percent Number1 Texas 3.34 614,0002 New Jersey 3.37 226,0003 Illinois 3.42 329,0004 Maryland 3.43 152,0005 Tennessee 3.52 170,0006 Georgia 3.53 253,0007 Florida 3.59 534,0007 Minnesota 3.59 145,0009 North Carolina 3.62 261,00010 California 3.63 1,020,00011 Colorado 3.65 140,00012 Connecticut 3.66 100,00013 Virginia 3.71 225,00014 Alabama 3.76 136,00014 Nevada 3.76 77,00016 New York 3.77 566,00017 Nebraska 3.78 52,00018 Delaware 3.80 26,00018 Hawaii 3.80 39,00018 Montana 3.80 29,00018 South Carolina 3.80 134,00022 South Dakota 3.81 23,00023 North Dakota 3.82 20,00024 Kansas 3.83 80,00025 Pennsylvania 3.88 380,00026 Oregon 3.91 117,00027 Massachusetts 3.92 202,00028 Mississippi 3.92 85,00029 Ohio 3.93 342,00030 Iowa 3.94 91,00031 Missouri 3.95 178,00032 New Mexico 3.95 61,00033 Louisiana 3.96 133,00034 Arizona 4.02 193,00034 New Hampshire 4.02 41,00034 Wisconsin 4.02 174,00037 Rhode Island 4.05 33,00038 Idaho 4.08 47,00039 Kentucky 4.11 134,00040 Maine 4.12 43,00041 Wyoming 4.17 18,00042 District of Columbia 4.19 21,00043 Indiana 4.25 206,00044 Vermont 4.32 21,00044 Washington 4.32 224,00046 Arkansas 4.34 95,00047 Oklahoma 4.37 122,00048 Alaska 4.38 22,00049 Michigan 4.43 332,00050 Utah 4.55 88,00051 West Virginia 4.69 68,000
United States 3.77 8,818,000

19
Child/Youth Prevalence of Mental Illness
Protecting youth against mental health problems cannot be understated. For most youth, symptoms start to present themselves at a young age. When services are provided early, youth are less likely to drop out of school, turn to substance use, or engage in risky self-injurious behaviors. Unfortunately, significantly less mental health data are available for youth populations. Without good data on the mental health status of America’s youth, we will not be able to keep track of the impact of mental illness on their wellbeing or adequately support early intervention efforts.
Data HighlightsAlong the Appalachian Mountains
• The highest rates of EBD among youth occur along states just to the west of the Appalachian Mountains. This area also has some of the highest rates of poverty and social inequality.
• This area also shows some of the lowest rates of substance use among youth.
The West
• Roughly five of the 10 states with the highest rates of both substance use and depression among youth are in the West.
of youth report having attempted suicide
once in the last year
(8.66%) report having at least one Major Depressive
Episode in the year
(6.48%) have a substance use
problem
(8.5%) of children in America suffer from an Emotional, Behavioral,
or Developmental (EBD) issue
Twice as many females attempt suicide
(10.6%) as compared to males (5.4%)
Mental Health America of Hawaii
As a critical leader in mental health and mental illness awareness, MHA Hawaii is leading efforts to educate college students on how to recognize and get help for fellow students who may be experiencing mental health problems. Launched in 2014, the pilot program has already educated 1,500 community college students. Its success resulted in the creation of a full-time mental health counselor position on campus.
MHA Hawaii is also leading the advocacy charge by convening an essential monthly meeting between the ten community-based mental health agencies that provide all services for behavioral health for severely mentally ill individuals, the primary insurance provider which contracts out all the services, and the state’s Medicaid office. These regular meetings have helped the agencies provide services for many individuals with mental illness in Hawaii.

20
Highest Highest-Ranked vs. Lowest-Ranked
• The range of prevalence of youth with EBD ranges from 6.87 percent in Alabama to almost double that at 13.95 percent in Kentucky.
• Similarly, the range of youth who attempted suicide also varies significantly among the states. Only 5.47 percent of youth in Massachusetts (ranked 1st) attempt suicide, while 14.34 percent of youth in Rhode Island (ranked 46th) attempt suicide.
Missing Data
• Five jurisdictions have chosen not to collect and report youth suicide attempt data to the CDC including California, the District of Columbia, Minnesota, Oregon, and Washington.
• Although states might collect their own data for rates of suicide attempts among youth, the lack of consistency in how responses are collected makes it more difficult to compare states with missing data to those who responded to the CDC survey.
Depression vs. Suicide Attempt
Most states have similar rates of reported depressive episodes and suicide attempts – but not all.
• Illinois, Indiana, North Dakota and Rhode Island have more youth reporting a suicide attempt than have a depressed episode (at least a 3 percent difference).
• Rhode Island has the largest percent difference with many more youth reporting suicide attempts than a depressed episode (a 5.34 percent difference).
• Iowa and New Hampshire have more youth reporting a depressed episode but lower rates of reported suicide attempts (at least a 3 percent difference).
Mental Health America of Georgia
In 2008, an undertaking of MHA Georgia, Project Healthy Moms (PHM), has grown into a turn-key program for women and families struggling with maternal mental illness. The main objectives of PHM are to disseminate knowledge about maternal mental illnesses to providers and communities within Georgia, increase identification and treatment of maternal mental illness, support families and mothers living with these illnesses, and reducing the stigma associated with them. MHA Georgia achieves its objectives through a statewide resource list, online education and resources, a monthly newsletter, a bilingual warmline peer support, Maternal Mental Illness Screening and Identification trainings, and an annual 5K fundraising/awareness event called Move for Moms.

21
Children with Emotional Behavioral Developmental Issues Rank State Percent Number1 Alabama 6.87 69,3592 South Dakota 7.01 12,6613 Colorado 7.25 78,5354 Utah 7.28 55,5075 Nevada 7.33 42,8316 Hawaii 7.45 19,9097 Maryland 7.62 91,5638 Virginia 7.64 125,2819 Alaska 7.65 12,52910 South Carolina 7.81 75,37311 New Jersey 8.01 145,56812 New Mexico 8.15 37,52513 California 8.23 677,49814 Georgia 8.24 182,70215 Kansas 8.27 53,08416 Missouri 8.39 105,29017 North Dakota 8.42 10,89818 Texas 8.56 516,47219 Nebraska 8.66 34,87820 Wisconsin 8.77 104,14121 Idaho 8.87 33,35622 Florida 9.11 323,23023 Louisiana 9.25 91,67024 New Hampshire 9.44 23,54325 Illinois 9.64 268,41226 Connecticut 9.67 69,75027 North Carolina 9.74 196,29527 Rhode Island 9.74 18,92929 West Virginia 9.95 34,11330 Arizona 10.00 143,57031 Washington 10.02 139,20432 Minnesota 10.29 116,81833 Montana 10.34 20,36634 Oregon 10.42 78,83835 Delaware 10.56 19,21436 Wyoming 10.92 13,11437 New York 10.97 410,38338 Oklahoma 11.02 90,62939 Michigan 11.07 226,09040 Ohio 11.23 271,76141 Iowa 11.27 73,17342 Tennessee 11.29 150,31143 Massachusetts 11.47 143,87544 Pennsylvania 11.57 280,88045 Indiana 11.61 164,91146 Vermont 11.73 13,33647 Mississippi 11.93 78,71848 Maine 12.50 30,34949 Arkansas 12.86 82,48050 District of Columbia 13.56 12,03951 Kentucky 13.95 125,602
United States 8.50 6,250,020

22
Youth Dependence or Abuse of Illicit Drugs or Alcohol Rank State Percent Number1 Utah 4.65 12,0002 Iowa 5.55 13,0003 Alabama 5.60 22,0004 Ohio 5.68 53,0005 Virginia 5.71 35,0006 Maryland 5.76 26,0007 Kentucky 5.77 20,0008 Tennessee 5.78 29,0009 Louisiana 5.80 21,00010 Mississippi 5.81 14,00011 Illinois 5.83 62,00012 Maine 5.84 6,00013 Georgia 5.88 49,00013 Kansas 5.88 14,00015 Indiana 5.92 32,00016 Arkansas 5.95 14,00017 Florida 5.96 82,00018 New York 5.99 88,00019 North Carolina 6.11 46,00020 Wisconsin 6.24 28,00021 West Virginia 6.29 8,00022 Missouri 6.31 30,00023 Idaho 6.32 9,00024 Delaware 6.33 4,00025 North Dakota 6.38 3,00026 Oklahoma 6.41 19,00027 Alaska 6.53 4,00028 South Carolina 6.63 24,00029 Pennsylvania 6.64 64,00030 Texas 6.68 151,00031 Oregon 6.71 20,00032 Minnesota 6.76 29,00033 Connecticut 6.85 20,00033 Nevada 6.85 15,00035 Rhode Island 6.89 5,00036 South Dakota 6.90 4,00037 New Jersey 6.94 49,00038 Washington 6.98 37,00039 Wyoming 7.00 3,00040 Michigan 7.01 57,00041 Massachusetts 7.03 35,00042 New Hampshire 7.11 7,00043 Nebraska 7.12 10,00044 Colorado 7.29 29,00044 District of Columbia 7.29 2,00046 California 7.50 237,00047 Hawaii 7.52 7,00048 Arizona 7.53 40,00049 Vermont 7.76 4,00050 Montana 8.51 6,00051 New Mexico 9.21 16,000
United States 6.48 1,618,000

23
Youth with At Least One Major Depressive Episode Rank State Percent Number1 District of Columbia 7.23 2,0002 North Dakota 7.27 4,0003 New York 7.28 107,0004 New Jersey 7.51 53,0005 Indiana 7.58 41,0006 Missouri 7.62 36,0007 Colorado 7.74 31,0008 Nebraska 7.97 12,0009 Florida 8.05 111,00010 Maryland 8.07 37,00011 North Carolina 8.11 61,00012 Mississippi 8.15 20,00013 Vermont 8.21 4,00014 Connecticut 8.26 24,00014 Minnesota 8.26 35,00016 Alaska 8.27 5,00017 Kansas 8.28 20,00017 Massachusetts 8.28 41,00019 South Dakota 8.32 5,00020 Georgia 8.43 70,00021 Texas 8.45 191,00022 Nevada 8.48 19,00023 Delaware 8.49 6,00024 Tennessee 8.57 43,00024 Wisconsin 8.57 39,00026 Alabama 8.69 33,00026 Pennsylvania 8.69 84,00028 Oklahoma 8.74 27,00029 Illinois 8.86 94,00030 Ohio 8.90 83,00031 Maine 8.91 9,00032 Louisiana 8.96 33,00033 Rhode Island 9.00 7,00034 Arkansas 9.01 21,00035 South Carolina 9.03 32,00036 Montana 9.04 7,00037 West Virginia 9.13 12,00038 Virginia 9.14 57,00039 California 9.17 289,00039 Iowa 9.17 22,00041 Arizona 9.39 50,00042 Wyoming 9.40 4,00043 Idaho 9.47 13,00044 Kentucky 9.52 32,00045 Hawaii 9.79 10,00045 New Hampshire 9.79 10,00047 Michigan 10.06 82,00048 Utah 10.17 27,00049 Oregon 10.23 30,00050 Washington 10.56 56,00051 New Mexico 11.73 20,000
United States 8.66 2,161,000

24
Youth Attempted Suicide Rank State Percent1 Massachusetts 5.472 Vermont 5.613 Pennsylvania 5.714 Iowa 5.985 Wisconsin 6.006 Nebraska 6.027 Colorado 6.138 Ohio 6.189 New Hampshire 6.7010 Oklahoma 6.8111 Missouri 6.9112 Delaware 6.9613 Idaho 7.0114 New York 7.0515 Utah 7.3416 West Virginia 7.5017 Kentucky 7.6618 Florida 7.7019 Montana 7.8720 Connecticut 8.0721 Maine 8.0822 Alaska 8.3623 Kansas 8.4024 Wyoming 8.5925 Georgia 8.8126 Michigan 8.8927 South Dakota 8.9128 Tennessee 8.9829 New Mexico 9.3830 South Carolina 9.4431 Virginia 9.8332 New Jersey 9.8633 North Carolina 9.8934 Texas 10.0835 Alabama 10.3736 Arizona 10.6037 Nevada 10.6538 Hawaii 10.7139 Arkansas 10.8440 Maryland 10.8841 Mississippi 10.9042 Indiana 10.9643 North Dakota 11.4544 Illinois 12.4145 Louisiana 13.1146 Rhode Island 14.3447 California48 District of Columbia49 Minnesota50 Oregon51 Washington
United States 8.01Note: Colorado, Indiana, Iowa, Maryland data from 2011, North Carolina & Pennsylvania data from 2009, California, Oregon, Minnesota & Washington data are not available.

25
Adult Insurance and Access to Care
As noted earlier, the ACA has already decreased the number of uninsured Americans, but it is unclear how many individuals with mental illness gained insurance as a result of the law. This is especially the case in states that failed to expand Medicaid. Even when individuals are insured, it is clear that people continue to face barriers. Barriers include inability to pay for treatment, difficulty using or accessing the mental health benefits offered by insurance, and lack of available services. The most recent, publicly-available data for people with mental illness is from 2012. Thus, it will be several more years before we can fully evaluate the effects of the ACA on individuals with mental illness.
Data HighlightsThe South and West vs. the Northeast and Midwest
• The highest percent of uninsured adults with mental illness are in the Southern and Western states.
• The lowest percent of uninsured adults with mental illness are generally in the Midwest and Northeast.
ACA Enrollment
• California enrolled the highest number of people in the first open enrollment (1,405,102), but also has roughly the same amount of people (1,111,000) who have a mental health problem and are uninsured.
• Hawaii is among those states with the lowest percent of uninsured individuals with AMI. During the first open enrollment, Hawaii enrolled the lowest number of individuals at 8,592, but has an estimated 15,000 uninsured individuals with AMI.
Mental Health Association in New Jersey
As a prominent mental health advocacy organization, MHANJ recently commissioned a study to analyze access to care and availability of appointments with psychiatrists in PPO Managed Care networks in the state. Through a survey sample of 525, MHANJ found that of the 1550 board certified psychiatrists in the state, only 702 were listed managed care networks. Additionally, 33 percent of the information on the plans’ network lists was incorrect. Of those asked (62), 49 percent of psychiatrists were not taking new patients, and of those providers willing to see new individuals, 50 percent had a wait time of over a month. MHANJ is working throughout the state to share these findings with government officials, legislators, the media and the mental health community in an effort to raise awareness on access to care issues. MHANJ is actively educating consumers on how to access care, how the complaint and appeal process works, and what to do if an individual’s needs are not met. They are also currently building a broad-based coalition to create significant change in insurance practices in behavioral health.
MHANJ has also established a statewide Call Center that integrates cutting-edge behavioral health information, referral and care management services with a Peer Recovery Warmline, a Suicide Prevention Life Line, and a Disaster response line to create a comprehensive access point for consumers, family members and the professional community. To date, the Call Center has attracted over 60,000 calls a year, and has expanded to include an Opiate/Heroin line focused on access to treatment and family peer support.
One out of five adults with AMI reported they did not get
the mental health services they felt they needed
(3.9%) of adults in America have a mental illness and are uninsured of individuals with any mental
illness report receiving treatment

26
Mental Health Association of Southeastern Pennsylvania
As part of an MHA Navigator grant, MHASP assisted individuals in Philadelphia and the five county surrounding area of southeastern Pennsylvania during the first open enrollment of the Affordable Care Act (ACA) federal health insurance plans. While MHASP was able to assist individuals who needed insurance but could not afford it, due to the lack of Medicaid expansion in Pennsylvania, they could only refer them to low-cost or free health clinics, charity care, and the emergency room. While many were served during the open enrollment period and in fact obtained insurance, 33 percent of MHASP clients fell in the Medicaid Gap. MHASP is pleased Pennsylvania has decided to expand Medicaid for 2015.
Mental Health America of Georgia
MHA Georgia is also actively involved in “Cover Georgia,” a coalition focused on bringing Medicaid expansion to the state. While working with Cover Georgia, a coalition made up of twenty non-profit organizations, MHA Georgia has scripted media messages, collected stories from individuals with lived experience, and worked to secure community and legislative support.
Highest-Ranked vs. Lowest-Ranked
• Even in the highest ranked state, Vermont, only 57 percent of individuals with a possibly diagnosable mental illness reported that they received treatment.
• In the ten lowest ranked states, only 30 percent of individuals who have a mental illness receive treatment.
Insurance Does Not Mean Access to Treatment
• In Massachusetts, only an estimated 1 percent of adults have AMI and are uninsured (48,000 individuals), but an estimated 20.4 percent of adults with AMI report having an unmet need (174,000 individuals). Thus, even though relatively many people in Massachusetts have access to insurance, there are a significant number of (presumably insured) people who nevertheless report barriers to treatment.

27
Adults with Any Mental Illness and Uninsured Rank State Percent Number1 Massachusetts 0.9 48,0002 Connecticut 1.4 39,0003 Hawaii 1.5 15,0004 Vermont 1.5 7,0005 District of Columbia 1.6 8,0006 Delaware 1.7 12,0007 South Dakota 1.8 11,0008 Wisconsin 1.8 78,0009 Maryland 2.0 86,0009 Minnesota 2.0 78,00011 North Dakota 2.0 10,00012 New Jersey 2.2 146,00012 Pennsylvania 2.2 219,00014 Rhode Island 2.3 19,00015 New York 2.4 354,00016 Iowa 2.5 56,00017 Maine 2.6 27,00017 North Carolina 2.6 182,00019 Kansas 2.7 55,00020 Colorado 2.8 107,00021 Missouri 2.9 129,00021 Nebraska 2.9 39,00021 New Hampshire 2.9 30,00024 Illinois 3.0 287,00024 Virginia 3.0 181,00026 Kentucky 3.4 109,00027 Michigan 3.6 266,00028 Ohio 3.8 327,00029 South Carolina 3.9 136,00030 California 4.0 1,111,00030 Montana 4.0 31,00030 Oklahoma 4.0 111,00030 Wyoming 4.0 17,00034 Florida 4.1 599,00035 Washington 4.2 216,00036 Alaska 4.3 22,00037 Georgia 4.4 313,00037 Indiana 4.4 210,00039 Texas 4.5 811,00040 Arkansas 4.6 101,00040 Louisiana 4.6 154,00042 Oregon 4.6 137,00043 New Mexico 4.9 75,00043 Tennessee 4.9 234,00045 Arizona 5.0 239,00045 Nevada 5.0 100,00045 West Virginia 5.0 72,00048 Idaho 5.4 61,00049 Utah 5.5 105,00050 Mississippi 5.6 121,00051 Alabama 6.3 225,000
United States 3.5 8,127,000

28
Adults with Any Mental Illness Who Received Treatment Rank State Percent Number1 Vermont 57.1 54,0002 Massachusetts 52.7 457,0003 Virginia 51.3 548,0004 Nebraska 51.0 120,0005 Maine 50.1 96,0006 Kansas 49.9 172,0007 New Hampshire 49.8 104,0008 Pennsylvania 48.0 822,0009 Idaho 47.9 127,00010 Delaware 47.8 60,00011 West Virginia 47.7 152,00012 Ohio 47.4 828,00013 South Dakota 47.0 47,00014 South Carolina 46.8 300,00015 Connecticut 46.5 210,00016 Rhode Island 46.4 71,00017 Arkansas 46.2 207,00018 Montana 46.1 66,00019 Kentucky 45.6 289,00020 North Carolina 45.4 497,00021 Minnesota 45.3 283,00022 Missouri 44.8 390,00023 Oregon 44.7 292,00024 Washington 44.4 519,00025 Iowa 44.3 194,00026 New Mexico 43.9 127,00027 Tennessee 43.4 455,00028 Utah 43.2 201,00029 Maryland 43.0 336,00030 Illinois 42.7 653,00031 Michigan 42.5 650,00032 Colorado 41.5 267,00032 Oklahoma 41.5 259,00034 Wisconsin 41.3 296,00035 Indiana 41.1 391,00036 Alabama 40.3 320,00037 Wyoming 40.0 32,00038 District of Columbia 39.9 41,00039 New York 38.9 1,113,00040 North Dakota 38.7 30,00041 Arizona 37.6 368,00042 New Jersey 36.9 361,00043 Alaska 36.2 37,00044 Texas 36.1 1,083,00045 Louisiana 35.9 225,00046 California 35.7 1,680,00047 Florida 35.4 860,00048 Mississippi 34.9 147,00049 Georgia 34.8 424,00050 Nevada 30.9 100,00051 Hawaii 26.5 48,000
United States 41.4 17,410,000

29
Adults with Any Mental Illness Reporting Unmet Need Rank State Percent Number1 Hawaii 11.1 20,0002 Tennessee 15.2 160,0003 North Dakota 15.7 12,0004 Maine 16.8 32,0005 Alabama 17.2 136,0006 New York 17.9 513,0007 Iowa 18.2 80,0008 South Dakota 18.2 18,0009 New Jersey 18.4 180,00010 Nevada 18.5 60,00011 Oklahoma 18.6 117,00012 Georgia 18.9 232,00013 Delaware 19.1 24,00014 Texas 19.3 583,00015 Nebraska 19.6 46,00016 Louisiana 19.7 123,00017 California 19.9 937,00017 Kentucky 19.9 127,00017 Pennsylvania 19.9 340,00020 Wisconsin 20.0 144,00021 Maryland 20.2 158,00021 North Carolina 20.2 221,00023 Florida 20.4 494,00023 Massachusetts 20.4 174,00025 Connecticut 20.6 93,00026 Illinois 20.8 320,00027 Alaska 20.9 21,00028 Wyoming 21.1 17,00029 West Virginia 21.2 68,00030 South Carolina 21.5 138,00031 Vermont 21.5 20,00032 Ohio 21.7 378,00033 Utah 22.4 104,00034 New Hampshire 22.7 47,00035 Michigan 22.9 351,00036 Minnesota 23.0 145,00037 Mississippi 23.2 99,00037 Montana 23.2 33,00039 New Mexico 23.4 67,00040 Missouri 23.9 208,00041 Idaho 24.4 64,00042 Colorado 24.5 158,00042 Oregon 24.5 159,00044 District of Columbia 24.6 25,00045 Rhode Island 25.2 39,00046 Indiana 25.4 242,00047 Arkansas 25.6 114,00047 Virginia 25.6 269,00049 Arizona 26.1 256,00050 Washington 26.3 308,00051 Kansas 28.1 97,000
United States 20.8 8,771,000

30
Child/Youth Insurance and Access to Care
In general, children in America are more likely to have insurance coverage than adults. State Children’s Health Insurance Program (CHIP) is an example of how government insurance can improve access for families who are too poor to pay for private insurance but not poor enough to qualify for Medicaid. For many of America’s youth, however, having insurance coverage does not mean access to treatment. Without treatment, many of America’s youth struggle to thrive. This treatment gap points to the increasing importance of access to school accommodations through an Individualized Education Plan (IEP). Unfortunately, the data show that many youth who need school accommodations through an IEP are not receiving them.
Data HighlightsThe South and West vs. the Northeast and Midwest
• In all three indicators of insurance and access to treatment among youth, children did better in the Northeastern and Midwestern states than in the Southern or Western states.
• Seven of the lowest ranking 10 states where children were least likely to obtain needed treatment are in the South.
• Six of the lowest ranking 10 states where children were least likely to be consistently insured are in the West.
of children with ongoing EBD were uninsured or had periods of no
insurance
Two out of five children in America who needed mental health treatment did
not receive it
of all students are identified as having a Serious Emotional Disturbance (SED) and are therefore likely as a matter of course to have their SED taken into consideration in planning for appropriate educational modifications and accommodations in their Individualized Education Plan
Mental Health America of WisconsinThrough the Wisconsin Council on Mental Health, MHA Wis-consin is working alongside consumers, family members and other leaders to advocate for improvements in overall access to mental health services in the state. Numerous studies had high-lighted the disparities in access to key services across the state, due in part to the requirement for counties to pay the “state” share of Medicaid for certain services.
The advocacy efforts of the Council is already seeing results—the work of MHA Wisconsin and others resulted in state funding for the “state” share of Medicaid for a Medicaid psycho-social rehabilitation programs serving both children and adults, which is expected to double the number of counties offering this service. The state is also expanding wrap-around programs for youth with serious mental illnesses to all counties and tribes, as well as piloting peer run respite programs in three areas of the state.

31
Mental Health Association in New JerseyAdditionally, MHANJ has trained a workforce of 30 Mental Health First Aid (MHFA) trainers with the goal of training 1,000 community gatekeepers to engage the public in understanding behavioral health and fight stigma around mental illness. MHANJ is marketing the training to the business community in an effort to generate revenue and address stigma in the workplace. MHANJ is linking those trained in MHFA with the MHANJ Call Center for ongoing support, access to services, and engagement with organization. MHANJ is also creating broad community partnerships with organizations such as the YWCAs, YMCAs, the Girl Scouts, and the New Jersey League of Municipalities.
• Six of the lowest ranking 10 states where children are least likely identified as SED are in Southern states.
• Five states plus DC are among the top 10 highest-ranking in identifying youth with SED.
• Five of the top 10 highest ranking states where youth are most likely to obtain needed treatment are in the Midwest.
Highest-Ranked vs. Lowest-Ranked
• An estimated 98 percent of children with EBD are insured in the highest-ranked states, like Iowa and New Jersey. In lowest-ranked states, like Nevada and Georgia, only 80 percent of youth with EBD are insured, leaving an estimated 20 percent of youth with EBD uninsured.
• The difference between states providing the most and the least access to needed mental health for youth is significant. In North Dakota, only 13.7 percent of children reported they did not receive needed mental health services, while 59.6 percent of children Louisiana reported that they could not access needed mental health services.
Trouble in Schools
When identifying disability status for access to an IEP, the term “Serious Emotional Disturbance” (SED) is used to define youth with a mental illness. The number of students identified as having an SED for purposes of obtaining an IEP is shown as a rate per 1,000 students. The calculation was made this way for ease of reading. Unfortunately, doing so hides the fact that the percentages are significantly lower.
For example, in Vermont (ranked first), the rate is 24.65, but the actual percentage is 2.47 percent. That is, 2.47 percent of students in Vermont are identified as having SED as compared to only .17 percent of students in Arkansas.
In a 2010 study, the National Institute of Mental Health found that 8 percent of youth have an SED1 . Only .8 percent of children, however, were identified by schools as having an SED for access to an IEP. This means that for every student who is in special education, up to 10 more who need accommodations appropriate to SED are not receiving them. This demonstrates the need for identifying (school-based) ways to increase the accuracy of identification of SED children, which is another important area for future research.
1 http://www.nimh.nih.gov/news/science-news/2012/survey-finds-more-evidence-that-mental-disorders-often-begin-in-youth.shtml

32
Children with Emotional Behavioral Developmental Issues who were Consistently Insured
Rank State Percent Number1 Iowa 98.5 61,1552 New Jersey 98.2 118,2533 Massachusetts 97.5 126,1274 Illinois 97.4 225,5855 Vermont 96.7 10,5945 Wisconsin 96.7 85,5547 South Dakota 96.2 10,5648 Maine 95.3 25,4149 South Carolina 94.6 60,61710 Utah 94.4 44,81410 Virginia 94.4 113,19412 District of Columbia 93.9 9,14013 Ohio 93.7 222,91814 New Mexico 93.5 26,10315 Hawaii 92.8 15,21115 Washington 92.8 104,44217 Delaware 92.5 14,96018 North Dakota 91.8 8,52719 Connecticut 91.7 55,36320 Louisiana 90.9 74,75421 West Virginia 90.3 28,63522 Indiana 90.0 128,50223 Kentucky 89.7 101,25924 Nebraska 89.2 26,37025 Alaska 89.0 9,99926 Arkansas 88.8 67,49826 New Hampshire 88.8 18,52828 Texas 88.7 425,35529 Maryland 88.6 73,13530 Pennsylvania 88.4 202,36631 Missouri 88.1 84,24331 Oregon 88.1 62,86833 Tennessee 87.9 117,75534 North Carolina 87.7 149,94035 Minnesota 87.2 85,13936 Kansas 87.1 40,04237 Montana 86.8 15,23937 New York 86.8 300,66539 Rhode Island 86.7 12,81340 Michigan 86.4 159,04141 Alabama 86.3 53,88342 Wyoming 85.7 9,85143 Mississippi 85.1 52,51244 Oklahoma 84.0 68,00545 Florida 83.4 233,50046 Arizona 83.3 97,86047 Idaho 83.1 22,42248 Colorado 82.7 59,31349 California 80.9 382,83850 Georgia 80.1 125,66151 Nevada 78.1 27,691
National 88.6 4,656,217
Nationwide: 600,745 youth with EBD are uninsured or have periods of no insurance

33
Children who Needed but Did Not Get Mental Health Services Rank State Percent Number1 North Dakota 13.7 1,4942 Vermont 22.1 2,9423 Maine 22.2 6,7234 West Virginia 26.4 8,9795 Kansas 27.8 14,7686 Minnesota 28.5 33,2807 Nebraska 29.3 10,1418 Pennsylvania 31.2 87,7089 Michigan 32.5 73,47810 Wyoming 32.7 4,29011 Arkansas 33.2 27,22612 Delaware 33.5 6,43013 Iowa 33.7 24,65213 New Hampshire 33.7 7,80613 Ohio 33.7 91,60216 Rhode Island 34.0 6,43017 Oregon 34.2 26,94118 Kentucky 34.3 43,03119 Wisconsin 34.6 35,03220 Connecticut 35.0 24,43821 Colorado 35.1 27,58921 Massachusetts 35.1 50,05523 New York 35.6 146,19824 South Dakota 36.4 4,60725 Missouri 36.5 38,43426 Alaska 36.8 4,61227 California 37.3 253,01828 Oklahoma 39.3 35,49629 Tennessee 39.8 59,86030 Montana 40.1 8,17131 Arizona 40.3 57,86132 Texas 40.5 209,21233 Maryland 40.8 37,34234 District of Columbia 41.1 4,94735 Indiana 41.8 68,97036 New Mexico 42.0 15,74837 Florida 42.3 136,28638 Hawaii 42.4 8,43538 New Jersey 42.4 61,73740 Idaho 43.7 14,25741 Illinois 44.9 120,54442 North Carolina 45.7 89,31443 Washington 46.1 64,11044 Alabama 46.3 32,12545 Georgia 47.0 85,85646 Mississippi 47.1 37,09647 Virginia 47.4 59,35148 South Carolina 49.9 37,47449 Nevada 50.7 21,65050 Utah 50.9 28,28051 Louisiana 59.6 54,563
United States 39.0 2,410,591

34
Rank State Rate Number1 Vermont 24.65 1,9302 District of Columbia 23.38 1,3263 Minnesota 19.41 14,7744 Massachusetts 16.51 14,1545 Wisconsin 16.44 12,4276 Rhode Island 15.48 2,0247 Pennsylvania 14.03 22,8588 Indiana 13.71 13,0708 Maine 13.71 2,33510 Iowa 13.35 5,72511 New Hampshire 12.40 2,19212 New York 11.22 27,56613 Illinois 10.87 20,19214 Connecticut 10.47 5,23015 South Dakota 9.95 1,13116 Ohio 9.88 15,60117 Maryland 9.09 6,91518 Georgia 9.05 13,62919 North Dakota 8.98 78820 Michigan 8.75 12,49821 Oregon 8.71 4,52422 Colorado 8.55 6,46723 Virginia 8.34 9,43224 Florida 8.13 19,58425 Kentucky 7.87 4,73426 Wyoming 7.85 64127 Arizona 7.79 7,68728 Missouri 7.63 6,23129 Mississippi 7.52 3,35430 Oklahoma 7.51 4,29031 Nebraska 7.40 1,95732 New Jersey 6.82 8,37733 New Mexico 6.74 2,04134 Hawaii 6.47 1,06335 Delaware 6.34 74536 West Virginia 6.00 1,47937 Texas 5.84 25,51038 Kansas 5.75 2,47439 Alaska 5.69 67140 Montana 5.51 71241 Idaho 5.44 1,39542 Washington 4.76 4,55143 Nevada 4.68 1,88144 South Carolina 4.55 2,94645 California 4.36 24,98145 North Carolina 4.36 5,91147 Utah 4.21 2,26348 Tennessee 3.69 3,29549 Louisiana 2.84 1,75650 Alabama 1.95 1,32251 Arkansas 1.74 750
United States 8.08 359,389
Students Identified with Serious Emotional Disturbance for IEP
* Rate is Per 1,000 students.

35
Access Quality and Network Adequacy
For many, access to insurance does not mean access to care. Barriers such as high costs or a lack of available treatment providers mean that some people, even when they have access to insurance, cannot obtain treatment at all. Others may be able to access treatment only to find that treatment is limited and quality is poor. Furthermore, measuring basic access to treatment (Did you get treatment?) can hide the fact that for many people, even those with access to insurance, finding quality or appropriate treatment is another matter entirely.
The Importance of Measuring OutcomesQuality indicators are becoming increasingly important as measures of efficacy and efficiency. While many outcome measures warrant highlighting, MHA included readmission rates and social connectedness because of their importance this year.
Readmission rates are increasingly used as a measure of outcomes. Short term readmission rates, like the 30-day readmission rate, are often used to measure quality of treatment during an inpatient stay. Longer readmission rates, like 90-day or 180-day readmission rates, are more likely indicators of the quality of both inpatient and outpatient care. Since psychiatric readmission rates are not collected or reported except among state hospitals, however, MHA presents the information reported even as we are aware of its limitations. MHA encourages the collection of psychiatric readmission rates for all hospitals (private and public) and will strive to identify and report on such measures.
Mental Health America of ColoradoMHA Colorado is an established advocate in the state, and is a founding member of the Colorado Mental Health Parity Coalition, which advocates for mental health and substance use equality. The Coalition—at the request of the Colorado Association of Health Plans—is actively working to develop a comprehensive business case and model on how to incorporate paid peers in the mental health and substance use treatment teams.
MHA Colorado is also an active member of the Steering Committee for the Chronic Care Collaborative, which is working with the Colorado Division of Insurance on monitoring mental health parity in private plans. Additionally, MHA Colorado is directly advocating to change the definition of narrow networks, which in its current characterization creates an artificial work force shortage for behavioral health, as well as unnecessarily long wait times (1-2 months) for mental health treatment.
1:3One out of three
children with ongoing EBD
have insurance that is
inadequate
1:3One out of three
adults with disability could not see a doctor because of costs
1:790Nationally, there is only 1 mental health provider
for every 790 individuals
19.6percent
The national 180-day
readmission rate (non-forensic) is
19.6%, which indicates a
significant lack of available
community-based services
70percentSeventy percent of those who receive
mental health services report that they have
improved social connectedness

36
For individuals with mental illness, isolation is a symptom and consequence of mental illness. One of the many important factors in recovery is community inclusion. For individuals with mental illness, being fully engaged in the community through work, school and relationships often results in long-term, positive outcomes. The measure of Improved Social Connectedness, while limited (measure of the public system only), is a good starting point, and we have included it in this report for that reason.
Data HighlightsThe South
• Individuals and families that live in Southern states are much more likely to face barriers accessing treatment, especially when it comes to finding a mental health professional.
• Six of the 10 states with the lowest number of available mental health providers for their population are in the South. The South (as shown in previous charts) also has less access to treatment among both adults and youth as compared to other regions.
• Similarly, eight of the 10 states where more adults with a disability could not see a health care provider due to costs were Southern states.
Highest-Ranked vs. Lowest-Ranked 1 in 5 vs 1 in 2
In the highest-ranked states, West Virginia, Pennsylvania, and Vermont, around 20 percent of children have inadequate insurance. In the lowest-ranked states, Nevada, New Jersey, and Louisiana, 50 percent of children have inadequate insurance. In the NSCH, families had inadequate insurance when their insurance did not meet their child’s needs, did not allow their child to see needed provider, or when out-of-pocket costs are unreasonable.
2x as Likely
In the highest-ranked states, Massachusetts, Hawaii, and Minnesota, around 20 percent of adults could not see a doctor due to costs. In the lowest-ranked states, Mississippi, Arkansas, and South Carolina, adults are two times as likely to not be able to see a doctor due to costs.
Mental Health Association of MarylandThrough the work of its Parity Project, MHA Maryland has partnered with other consumer organizations to ensure parity compliance and enforcement throughout the state. In 2013, this group secured passage of legislation to better enable consumers to enforce their parity rights, requiring plans sold in Maryland to provide notice to consumers about the Mental Health Parity and Addiction Equity Act (MHPAEA) and requiring private review agents to ensure that all medical necessity criteria comply with MHPAEA. We continue legislative efforts to require insurers to demonstrate parity compliance.
MHA Maryland is currently analyzing the networks of private insurance plans sold in 2014 through the Maryland Health Benefit Exchange, in order to understand consumers’ experiences when attempting to access outpatient psychiatric care. MHA Maryland is concerned that while more individuals are insured through Medicaid expansion and state Health Insurance Exchanges, more insurers are narrowing their networks and providers are increasingly opting out of networks. MHA Maryland believe that states should consider formalizing network adequacy standards, and requiring insurers to allow out of network care at in-network cost sharing for consumers who are experiencing unreasonable delays.

37
300:1 vs 1600:1
• In states with the greatest number of available mental health providers, Massachusetts, Delaware and Vermont, there are approximately 300 individuals for every one mental health provider.
• In states with the lowest number of available mental health providers, Georgia, Texas, and Alabama, there are approximately 1,600 individuals for every one provider – 5x less access than the best states.
• Peer support specialists and workforce development programs are possible solutions to the significant mental health workforce gap in the states that have the lowest number of available mental health providers.
Length of Stay Matters
Although Arizona ranks first in State Hospital 180-day Readmission Rate, its median length of stay is 431 days, as compared to Nevada, which ranks last with an 88.99 percent 180-day readmission rate and 13 days as its Median Length of Stay.
States with the lowest rates of 180-day readmission show the highest median length of stay, while those with the highest readmission rates have very short median length of stay. Both ends of the ranking may indicate a lack of adequate community-based services. Individuals who transition in and out of the hospital or who are kept inpatient for long periods of time may do so because they lack evidence-based programs that support them in staying in their community.
Getting People Connected
When people are given quality treatment, they report positive outcomes. This outcome measure demonstrates that providing quality treatment can improve quality of life and ultimately result in recovery.
• States like New Jersey, Florida and Mississippi have the highest rates of improved social connectedness (around 90 percent) as compared to states like Idaho, Oregon and Arkansas, where only 58 percent report improved social connection.
Mental Health America of Los AngelesMHALA recognized the need to develop a strong mental health workforce in the most populous county in the U.S. MHALA’s Training, Consultation and Workforce Development (TC&WD) team has trained more than 500 individuals through its Jump Start Fellowship program, 70% of whom have gone on to jobs in the mental health field. Of those who completed the program, 72% reporting having lived experience in mental health, having a close family member with lived experience or both. Since 2007, TC&WFD provided guest lectures on recovery-based approaches to more than 5,500 students and 300 faculty at local community colleges, four-year universities and graduate programs. The program developed an 18-unit fully accredited Mental Health Worker Program with Cerritos College that has had more than 100 students earn their certificate since 2010. Additionally, TC&WD has trained more than 200 peers through its three-level Peer Provider Training Program, which has been in operation since 2007.

38
Rank State Percent Number1 West Virginia 17.9 5,6542 Pennsylvania 20.2 44,7133 Vermont 20.5 2,2374 Kentucky 23.4 25,4815 Delaware 23.5 3,7676 Arkansas 24.1 17,7416 Iowa 24.1 14,9608 Ohio 24.8 60,7679 Massachusetts 25.0 32,41310 Idaho 25.2 6,48811 Oregon 25.5 17,93512 Maine 25.9 6,86813 Georgia 26.4 38,17213 Kansas 26.4 12,16415 Wyoming 27.1 2,85316 Nebraska 27.4 7,89117 North Carolina 27.6 45,21618 New Mexico 27.8 7,68818 Tennessee 27.8 36,16720 Hawaii 28.0 4,58921 Indiana 28.5 39,64122 Arizona 29.1 30,42523 South Dakota 31.0 3,32524 District of Columbia 31.3 2,96224 Wisconsin 31.3 27,87726 Alabama 31.8 20,07327 California 32.0 146,71327 Michigan 32.0 57,70329 Missouri 32.9 30,81330 Florida 33.3 84,71831 Mississippi 33.4 19,81931 South Carolina 33.4 20,85933 Alaska 33.6 3,57833 Rhode Island 33.6 4,71235 Utah 33.8 15,74536 Washington 34.0 37,14137 Montana 34.1 5,84838 Oklahoma 35.5 27,25239 New York 35.6 120,73340 Minnesota 36.1 34,82640 New Hampshire 36.1 7,07642 North Dakota 36.3 3,27243 Illinois 36.4 82,51344 Colorado 39.6 27,01645 Connecticut 39.8 22,62546 Texas 40.5 179,10347 Maryland 40.6 31,31948 Virginia 42.9 50,64449 Louisiana 43.5 34,56450 New Jersey 46.1 55,51851 Nevada 52.0 16,086
United States 32.3 1,638,262
Children with Ongoing EBD Reporting Inadequate Insurance

39
Rank State Percent Number1 Massachusetts 17.3 141,5202 Hawaii 18.5 28,7293 Minnesota 19.5 115,9964 North Dakota 20.6 14,7885 Maine 21.7 44,0046 Vermont 21.8 16,6447 District of Columbia 22.6 22,0198 Connecticut 23.1 108,9349 Delaware 23.6 27,65110 Maryland 23.8 165,05811 California 24.4 1,250,16912 Alaska 24.9 28,24013 Iowa 25.1 87,54014 Michigan 25.4 400,90415 South Dakota 25.9 26,23516 Nebraska 26.0 52,87516 New York 26.0 752,94218 Rhode Island 26.9 41,19918 Virginia 26.9 311,33420 New Hampshire 27.1 51,96821 New Jersey 27.8 245,67122 Pennsylvania 28.0 492,84423 Ohio 28.4 455,01323 Washington 28.4 320,01525 Illinois 28.7 461,41526 Wisconsin 28.9 205,47127 Idaho 29.4 75,10627 Utah 29.4 102,16229 Montana 29.6 46,66330 Kansas 30.2 110,81031 Missouri 31.0 287,24232 Wyoming 31.2 22,12533 Louisiana 31.5 238,51034 New Mexico 32.0 98,20235 West Virginia 32.4 112,36436 Colorado 32.8 212,87337 Indiana 33.0 297,87238 Oklahoma 33.5 212,96539 Tennessee 33.8 347,08840 North Carolina 33.9 443,22941 Nevada 34.5 120,46042 Arizona 34.6 308,56843 Oregon 34.8 235,10544 Kentucky 35.2 269,32845 Georgia 36.2 511,32446 Texas 37.0 1,074,37247 Florida 37.7 1,099,89648 Alabama 37.9 335,49748 South Carolina 37.9 275,58350 Arkansas 39.5 185,74651 Mississippi 43.7 203,972
United States * 30.3 13,238,519
Adults with Disability Who Could Not See a Doctor Due to Costs

40
Rank State Ratio1 Massachusetts 248:12 Delaware 293:13 Vermont 329:14 Maine 342:15 Rhode Island 361:16 New Mexico 376:17 Oregon 410:18 Oklahoma 426:19 Alaska 450:110 Connecticut 455:111 New Hampshire 493:112 New York 510:112 Wyoming 510:114 Washington 533:115 Nebraska 560:116 Colorado 570:117 Utah 587:118 Hawaii 597:119 California 623:120 Michigan 661:121 Maryland 666:122 District of Columbia 675:123 Arkansas 696:123 North Carolina 696:125 Minnesota 748:126 Montana 752:127 New Jersey 809:128 Pennsylvania 837:129 Idaho 839:130 Illinois 844:131 Kentucky 852:132 Kansas 861:133 South Dakota 871:134 Florida 890:135 Indiana 890:136 Missouri 947:137 Tennessee 974:138 South Carolina 995:139 Virginia 998:140 Nevada 1,015:141 Ohio 1,023:142 Wisconsin 1,024:143 North Dakota 1,033:144 Iowa 1,144:145 Arizona 1,145:146 Mississippi 1,183:147 Louisiana 1,272:148 West Virginia 1,291:149 Georgia 1,440:150 Texas 1,757:151 Alabama 1,827:1
Mental Health Workforce Availability

41
Rank State Percent Median Length of Stay (Days)
# State Hospital Readmission
1 Arizona 0.00 431 01 Hawaii 0.00 97 03 Nebraska 5.05 205 54 Indiana 5.87 197 255 Florida 6.00 166 606 Pennsylvania 6.50 238 447 New Mexico 7.47 21 608 Massachusetts 8.47 77 489 Louisiana 8.51 14 16310 Washington 8.60 71 11511 Idaho 8.85 36 7012 Connecticut 9.63 61 4913 Utah 9.70 117 2914 Montana 10.43 31 7615 California 11.90 150 3216 Virginia 12.05 30 40117 South Carolina 13.40 18 25418 Vermont 13.64 46 2119 Alabama 13.65 44 33620 Mississippi 13.94 25 45721 Maine 14.20 50 7422 Missouri 14.24 176 9423 North Carolina 15.02 24 48824 Texas 15.58 17 2,07325 Arkansas 16.72 58 5526 Oklahoma 16.79 48 70427 District of Columbia 17.71 68 3428 Rhode Island 17.85 5 20429 New York 18.13 75 1,15230 Iowa 18.50 28 21731 West Virginia 19.26 18 20332 Ohio 19.69 14 1,06533 Tennessee 20.48 5 2,00734 Colorado 21.14 31 25635 Georgia 21.30 9 1,48936 Minnesota 21.44 18 41437 Wyoming 21.48 53 3238 New Jersey 22.00 84 47839 North Dakota 22.52 15 14140 Maryland 23.10 105 6441 South Dakota 23.39 10 44242 Illinois 23.52 2,04443 Oregon 24.15 109 9244 Kentucky 25.21 8 2,11145 Michigan 27.09 0 57446 Kansas 27.98 1,08147 Delaware 29.30 12 14348 New Hampshire 30.47 7 72849 Wisconsin 32.59 6 1,31550 Alaska 32.93 6 52151 Nevada 88.99 13 202
United States 19.60 63 22,902
State Hospital 180-Day Readmission Rate
Note: Illinois and Kansis did not report LOS.

42
Rank State Percent1 District of Columbia 95.42 New Jersey 94.43 Florida 86.74 Mississippi 84.45 Oklahoma 80.96 Kentucky 79.87 New York 77.88 Georgia 76.79 New Mexico 76.310 Kansas 75.411 North Dakota 75.412 Alabama 74.713 Delaware 73.814 Connecticut 73.715 Wyoming 73.716 Louisiana 73.517 North Carolina 73.018 West Virginia 72.919 Nevada 72.920 Arizona 72.121 Hawaii 72.022 Illinois 72.023 Nebraska 72.024 Michigan 71.025 Pennsylvania 70.626 Rhode Island 69.827 South Carolina 69.528 Minnesota 69.329 South Dakota 68.930 Missouri 67.631 California 67.532 Montana 66.533 Washington 66.534 Virginia 66.435 Indiana 66.036 Vermont 66.037 Alaska 65.938 Tennessee 65.839 Ohio 65.140 Massachusetts 64.541 Maryland 64.142 New Hampshire 64.143 Wisconsin 64.144 Utah 63.645 Colorado 63.446 Maine 63.147 Texas 62.948 Iowa 59.149 Arkansas 58.750 Oregon 58.551 Idaho 55.8
United States 72.1
Adult Improved Social Connectedness
Note: Illinois, West Virginia data from 2011, Virginia data from 2010

43
As part of the ACA, states were given the option of implementing their own state-run health exchange or using a federally-facilitated exchange. To date, 17 states have created their own State-Based Marketplaces, seven are in Partnership Marketplaces, and 27 states utilize the Federally-Facilitated Marketplace. In 2012, a Supreme Court ruling allowed states to choose whether or not they would expand Medicaid for individuals earning up to 138 percent of the federal poverty line. Today, 28 states (including the District of Columbia) have expanded Medicaid, 19 states have chosen not to expand Medicaid, and four states (Indiana, Utah, Tennessee, and Wyoming) may expand Medicaid within the next year.
In February 2014, the American Mental Health Counselors Association (AMHCA) assessed the impact, in the relevant states, of the decision to not expand Medicaid.2 Since AMHCA’s assessment, Pennsylvania and New Hampshire have expanded Medicaid, leaving an estimated 3.47 million uninsured adults with serious mental health and substance use conditions in the Medicaid Gap.
2 American Mental Health Counselors Association. Dashed Hopes; Broken Promises; More Despair: How the Lack of State Participation in the Medicaid Expansion Will Punish Americans with Mental Illness. (2014). http://www.amhca.org/assets/content/AMHCA_DashedHopes_Report_2_21_14_final.pdf
Issue Spotlight: Insuring Individuals with Mental Illness

44
Ranking Results from First Open EnrollmentFollowing the ACA’s first open enrollment, the Assistant Secretary for Planning and Evaluation (ASPE) reported that 8,019,763 individuals (28 percent of po-tential marketplace enrollees) selected an insurance plan through the Health Insurance Marketplace. States that created their own marketplaces performed slightly better, insuring 32.5 percent of those potentially eligible, as compared to federally facilitated exchanges, which insured 26.3 percent.3
3 The Henry J. Kaiser Family Foundation. Marketplace Enrollment as a Share of the Potential Marketplace Population. http://kff.org/health-reform/state-indicator/marketplace-enrollment-as-a-share-of-the-potential-marketplace-population
Rank State # Who Selected a Marketplace Plan
Estimated #Potential Marketplace Enrollees
% of Potential Population Enrolled
1 Vermont 38,048 45,000 85.17%2 California 1,405,102 3,291,000 42.69%3 Rhode Island 28,485 70,000 40.64%4 Florida 983,775 2,545,000 38.66%5 Idaho 76,061 202,000 37.74%6 Michigan 272,539 725,000 37.57%7 Connecticut 79,192 216,000 36.70%8 Maine 44,258 122,000 36.27%9 North Carolina 357,584 1,073,000 33.34%10 Washington 163,207 507,000 32.17%11 District of Columbia 10,714 36,000 29.77%12 Georgia 316,543 1,063,000 29.77%13 New Hampshire 40,262 137,000 29.33%14 New York 370,451 1,264,000 29.32%15 Delaware 14,087 48,000 29.06%16 Wisconsin 139,815 482,000 29.00%17 Kentucky 82,747 302,000 27.42%18 Virginia 216,356 823,000 26.29%19 New Jersey 161,775 628,000 25.74%20 Utah 84,601 331,000 25.52%21 Indiana 132,423 525,000 25.24%22 Colorado 125,402 501,000 25.02%23 Pennsylvania 318,077 1,276,000 24.93%24 South Carolina 118,324 491,000 24.12%25 Montana 36,584 152,000 24.10%26 Tennessee 151,352 645,000 23.47%
Rank State # Who Selected a Marketplace Plan
Estimated #Potential Marketplace Enrollees
% of Potential Population Enrolled
27 Texas 733,757 3,143,000 23.35%28 Illinois 217,492 937,000 23.21%29 Missouri 152,335 657,000 23.18%30 Arizona 120,071 551,000 21.79%31 Alabama 97,870 464,000 21.08%32 Louisiana 101,778 489,000 20.79%33 Mississippi 61,494 298,000 20.62%34 Oregon 68,308 337,000 20.27%35 Arkansas 43,446 227,000 19.12%36 Kansas 57,013 298,000 19.10%37 Ohio 154,668 812,000 19.04%38 Nevada 45,390 249,000 18.24%39 Nebraska 42,975 239,000 17.99%40 West Virginia 19,856 117,000 17.04%41 New Mexico 32,062 193,000 16.61%42 Alaska 12,890 78,000 16.50%43 Minnesota 48,495 298,000 16.30%44 Maryland 67,757 419,000 16.18%45 Oklahoma 69,221 446,000 15.52%46 Wyoming 11,970 80,000 14.92%47 Hawaii 8,592 58,000 14.85%48 North Dakota 10,597 77,000 13.83%49 Massachusetts 31,695 259,000 12.24%50 South Dakota 13,104 118,000 11.15%51 Iowa 29,163 262,000 11.14%
United States 8,019,763 28,605,000 28.04%

45
The Public or Private System: Parity or Disparity?Because of state differences in Medicaid Expansion and Marketplace Types, whether or not one has access to insurance, whether insurance is affordable, and how complicated access can be depends largely on the state in which you reside. Along with state differences in exchanges and expansion, states vary considerably in how they choose to implement their public mental health system.
The federal and state governments share the responsibility of providing mental health care. In the most basic way, the Federal Government provides support to states mainly through federal regulation, mental health block grants, and insurance programs such as Medicaid, Medicare, CHIP, and TRICARE. States and counties have considerable choice in how and how much they use the available federal support for their constituents. For example, each state sets its own eligibility criteria for traditional Medicaid and CHIP. States also choose how much of the state budget will be spent on mental health treatment in the public system. Together, this collaboration of federal and state policies and funding streams, comprise the “public” mental health system.
Most low income individuals and families, and those with chronic mental health conditions, rely on the public system for their mental health care. Evidenced based practices such as supportive housing, supported employment, Assertive Community Treatment, Multi-systemic therapy, or Wraparound services, were developed in and made available only in the public mental health system. As seen in the following assessment of essential health benefits in the benchmark plans, many private insurance plans explicitly exclude specialized community based services.
The chart below demonstrates the differences across states in children’s insurance coverage.4 The difference in insurance coverage indicates in what system children are able to access their health and mental health care. Most states have larger percentages of children insured through the private market than the public system. In Arkansas, the District of Columbia, Louisiana, Mississippi, and New Mexico, more children are insured in the public system than the private market. If a state or jurisdiction invests in their public mental health system, individuals insured in that system are likely to have better access to care. For example, in 2012, the District of Columbia spent $305.37 per capita in their state mental health expenditures, while Louisiana spent $65.51 per capita.5 This difference in mental health state budget expenditure might explain why individuals in DC have relatively higher access to care.
Furthermore, while looking for mental health data for our report, MHA found more publicly-available data from the public system as compared to the private system. Efforts to increase transparency in the government resulted in reports such as the Uniform Reporting System (URS). The URS is collected and reported by SAMHSA and provides robust mental health data that MHA hopes will be collected and analyzed into the future. However, for purposes of this report, reporting data from the URS suffers from a significant limitation, as it does not include outcomes for those who are obtaining services in the private system. Publicly-available data assessing the standards of mental health care in the private system are very limited.
4 National Survey of Children's Health. Child and Adolescent Health Measurement Initiative, Data Resource Center on Child and Adolescent Health website. http://childhealthdata.org/browse/survey/results?q=2200&r=1 5 NASMHPD Research Institute. SMHA Mental Health Per Capita Expenditures by Population Density, FY 2012. http://www.nri-incdata.org/RevExp2012/T21.pdf
State Public Insurance %
Private Insurance %
Currently Uninsured %
Alabama 45.2 50.7 4.1Alaska 33.7 60.5 5.8Arizona 35 53.2 11.8Arkansas 51.7 43.6 4.7California 39.5 54.1 6.4Colorado 26.4 65.9 7.7Connecticut 32.2 65.1 2.6Delaware 35 61.3 3.7District of Columbia 51.9 46.8 1.3Florida 38.4 52 9.6Georgia 39.3 53.4 7.2Hawaii 31.3 67.4 1.2Idaho 33.8 60.4 5.8Illinois 41.9 56.5 1.6Indiana 37.1 57.5 5.4Iowa 31.7 65.5 2.8Kansas 32.1 62.8 5.1Kentucky 41.6 54.1 4.3Louisiana 54.1 43.8 2.1Maine 40.2 56 3.8Maryland 28.8 66.7 4.5Massachusetts 32.5 66.5 1Michigan 41 56.3 2.7Minnesota 26.3 69.2 4.5Mississippi 51.5 41.1 7.4Missouri 35.4 60.3 4.3Montana 34.6 56.8 8.6Nebraska 28 67 5Nevada 30.7 55.8 13.5New Hampshire 27.5 69.1 3.4New Jersey 30.8 65.7 3.5New Mexico 52 41.3 6.8New York 38.5 58.7 2.9North Carolina 40.9 52.9 6.2North Dakota 21.4 72.1 6.6Ohio 35.6 61.1 3.3Oklahoma 44.5 48.2 7.3Oregon 37.5 58.1 4.4Pennsylvania 30.3 65.5 4.2Rhode Island 36.1 59.9 3.9South Carolina 44.8 48.8 6.4South Dakota 29.6 67.1 3.3Tennessee 40.2 54.4 5.4Texas 38.6 51.9 9.5Utah 16.6 74.7 8.7Vermont 43.6 55 1.3Virginia 25.6 69.1 5.3Washington 31.4 64.8 3.8West Virginia 42.8 53 4.2Wisconsin 34.3 64 1.7Wyoming 30.3 63.8 5.9United States 37.1 57.4 5.6
Type of Insurance Coverage Among Children Age 0-17, 2011/2012

46
From Public to Private ManagementThe increasing use of Medicaid Managed Care adds complexity to the public and private system. Over the last decade, states have progressively transitioned the management of their traditional Medicaid to Medicaid Managed Care (MMC). Under MMC, Medicaid is offered to people through a private insurance company that manages the provision and cost of a person’s or family’s care. During this transition, the mental health system has seen a rise in other types of managed care models, including Accountable Care Organizations and Coordinated Care Organizations, representing networks of providers who act together to provide managed care. For many states, MMC offered a way to extend care to individuals following enrollment in the ACA. One implication of the increased use of MMC is that for an increasing number of individuals and families, their access to mental health treatment will be managed by private for-profit companies.
The following chart shows the variation between states in what percentage of their Medicaid enrollees are in Managed Care vs. Traditional Medicaid.6 States are ranked based on their percentage of State MCC. The ranking is not indicative of whether more or less managed care is better or worse for consumers. More research is needed on the impact of MMC on consumers. MHA supports more data collection and transparency in the private system. Such collection and transparency in the private system will allow the assessment of the impact of the MMC transition and analyze whether increased Medicaid Managed Care increases or decreases access to mental health treatment.
6 The Henry J. Kaiser Family Foundation. Total Medicaid Managed Care Enrollment. http://kff.org/medicaid/state-indicator/total-medicaid-mc-enrollment/
Rank State % in State MMC1 Alaska 0.00%2 New Hampshire 0.00%3 Wyoming 0.00%4 Maine 49.30%5 West Virginia 51.00%6 Massachusetts 53.10%7 Virginia 58.20%8 Vermont 58.50%9 California 60.10%10 Alabama 61.10%11 North Dakota 63.60%12 Wisconsin 63.70%13 Florida 63.80%14 Louisiana 65.30%15 Minnesota 65.70%16 District of Columbia 67.40%17 Illinois 67.80%18 Connecticut 68.60%19 Rhode Island 68.60%20 Indiana 70.30%21 Texas 70.70%22 New Mexico 72.80%23 Maryland 74.60%24 Ohio 75.40%25 South Dakota 75.80%26 Montana 76.10%
Rank State % in State MMC27 New York 76.70%28 New Jersey 77.70%29 Arkansas 78.40%30 Delaware 80.50%31 Pennsylvania 81.50%32 North Carolina 83.20%33 Nevada 83.60%34 Nebraska 85.10%35 Oklahoma 86.50%36 Mississippi 87.20%37 Kansas 87.40%38 Washington 88.10%39 Michigan 88.40%40 Arizona 88.70%41 Kentucky 89.40%42 Iowa 91.10%43 Georgia 91.30%44 Colorado 94.60%45 Missouri 97.70%46 Oregon 98.20%47 Hawaii 98.70%48 Utah 99.80%49 Idaho 100.00%50 South Carolina 100.00%51 Tennessee 100.00%
United States 74.2%
Percentage of State Medicaid Enrollment in Medicaid Managed Care 2011

47
Evaluating Insurance PlansLimitations of Insurance Plan Summary of Benefits and Coverage
MHA evaluated mental health coverage among health exchange plans for comparison in the final Parity and Disparity report. We examined publicly-available information on the health plans that were included on marketplace exchanges. Through this process, MHA discovered that, more often than not, information about insurance plans was provided in the form of a “Summary of Benefits and Coverage.” While such Summaries often appear at first glance to meet the requirements of MHPAEA and the ACA, they are often so limited in detail that it is very difficult to determine if that is actually the case. In order to identify what is actually covered or what exemption a person will face when trying to access his or her treatment, an observer must carefully analyze the plan’s “Outline of Coverage,” “Evidence of Coverage,” or better yet, the full insurance policy. Unfortunately, outlines of coverage or insurance policies for plans on the health exchanges are not easily accessible. In most cases, a person would have to directly and individually request the policy from the insurance company or sign up and pay for insurance before receiving his or her policy by mail or email. In contrast, since 1995, the National Association of Insurance Commissioners has put out model regulations that moved states to require full and fair disclosure of Medicare supplement policies.7 Full and fair disclosure of Medicare supplements included providing consumers with the outline of coverage at the time of application. For this reason, most Medicare Supplement Outline of Coverages can be found online. MHA encourages comparable protections and full disclosure for all insurance plans, especially plans found on the health insurance exchanges.
Because of the above limitations, MHA also examined the available State Benchmark Plans for analysis of their coverage of mental health and substance use treatments.
Essential Health Benefits and State Benchmark Plans
In 2010, the ACA introduced 10 Essential Health Benefits (EHBs) to form a baseline for what all plans on all exchanges must cover. The EHBs explicitly include both mental health and substance use disorder services. To determine specific details around all 10 EHBs, the Department of Health and Human Services (HHS) decided to use a benchmarking system. Each state chose a health plan from existing health plan as its “benchmark” plan. Once a benchmark was selected, that insurance plan became the standard of comparison for other Qualified Health Plans (QHP) within
that state. Only plans that provide “substantially equal” coverage to the designated benchmark plan for each of the EHBs could be accredited as a QHP and included on that state’s health insurance exchange. Thus, the state benchmark plans determine the minimum amount of coverage a QHP may offer for each of the EHBs.
Unfortunately, full policies for the state benchmark plans are not readily available. The HHS Center for Consumer Information & Insurance Oversight (CCIIO) has released some details of coverage for each benchmark plan.8 The details of coverage allow for some analysis of what types of mental health and substance use coverage a consumer may have, and what kinds of limitations he or she might face. Analyzing the benchmark plans provides a starting point for evaluating QHPs for compliance with the rights and regulations set forth in the MHPAEA and the ACA. Finally, even though the benchmarks only provide the minimum guaranteed coverage for each of the EHBs, QHPs may exceed this coverage.
MHPAEA requires that health plans offering mental health services must not limit these services more than they limit comparable medical and surgical services. This protection applies to different kinds of quantitative limits, such as lifetime spending caps or annual visit limits, as well as non-quantitative limits, such as prior authorization requirements or exclusions.
Many of the benchmark plans do not yet comply with parity requirements, and CCIIO notes this on their website. The benchmark plans have visit limits and lifetime monetary limits for mental health that medical and surgical services do not have. There are exclusions in coverage for services such as residential treatment centers for mental health and cognitive rehabilitation without equivalent limitations in medical and surgical services. Under the parity law, there can only be exclusions in mental health coverage if it is the result of a neutral policy that applies to both medical/surgical and mental health, even if it affects mental health services more. This applies to formularies as well – any exclusion or “tiering” criteria cannot be applied disproportionately to mental health services.
In the updated, parity-compliant state benchmark plans, these unequal limitations and exclusions should disappear and be replaced with neutral utilization management guidelines. When the state benchmark plans are not parity-compliant, they provide less guidance to QHPs about their legal obligations. QHPs are working to meet parity requirements within their plans, but, until the state benchmark plans are updated to reflect parity requirements, the QHPs’ obligations under the ACA will be less clear.
7 National Association of Insurance Commissioners. Model Regulation to Implement the NAIC Medicare Supplement Insurance Minimum Standards Model Act. http://www.naic.org/store/free/MDL-651.pdf8 The Center for Consumer Information & Insurance Oversight. Additional Information on Proposed State Essential Health Benefits Benchmark Plans. http://www.cms.gov/CCIIO/Resources/Data-Resources/ehb.html

48
Comparing the State Benchmark Plans
Some plans are vague, while others are specific.
Some benchmark plans detail coverage with relative specificity, while others are notably vague. For example, Blue Cross Blue Shield of Alabama’s 320 Plan states only that it covers mental health and substance use outpatient services, without further explanation or any language about exclusions. Other plans offer more information. Tennessee’s Blue Cross Blue Shield BCBST PPO lists the following in its explanation of excluded coverage for mental health:
“a. Pastoral Counseling; b. Marriage and family counseling without a behavioral health diagnosis; c. Vocational and educational training and/or services; d. Custodial or domiciliary care; e. Conditions without recognizable ICD-9 diagnostic classification, such as adult child of alcoholics (ACOA), and co-dependency and self-help programs; f. Sleep disorders; g. Services related to mental retardation; h. Habilitative as opposed to rehabilitative services, i.e., services to achieve a level of functioning the individual has never attained; i. Court ordered examinations and treatment, unless Medically Necessary; j. Pain management; k. Hypnosis or regressive hypnotic techniques; l. Charges for telephone consultations, missed appointments, completion of forms, or other administrative services.”
It is unclear if specificity is better or worse for the consumer. Plans can specifically exclude important services, which may undermine consumer services and access, but if plans are too vague, then individuals may not know what is covered until they receive a denial. Following an insurance denial, an individual’s only recourse is to file an appeal through the insurance plan and then if necessary, through a state appeal process if one exists, or a state or federal court.
The lack of transparency in marketplace plans means that the responsibility is then placed on the consumer to identify the may or may not be covered after they have already purchased their plan.
Placing this burden on the consumer is problematic. Many people who receive a denial of coverage may not file appeal because the process is burdensome and opaque. Furthermore, even if one individual appeals a denial and it is reversed, unless he or she obtains a binding court opinion, this does not guarantee that the service will be covered for other similarly-situated individuals, who will then need to appeal as well.
By providing outlines of coverage or policies to consumers prior to purchasing a plan, individuals with known health care needs can identify those plans that work best for them and reduce the likelihood of needing to file an appeal and / or being unfairly denied services.
Some plans guarantee a lot more coverage than others.
Some plans guarantee more coverage than others. For example, Blue Cross Blue Shield of North Carolina’s Blue Options plan offers a variety of services, including screening and intensive therapy, along with several kinds of rehabilitative services. This plan also has fewer exclusions than other plans. On the other hand, the BCBS Health Plan of Georgia POS plan explicitly excludes treatment of behavioral disorders and excludes cognitive rehabilitation, among a number of other excluded services. These two plans differ enormously from one another, and these differences will likely remain after the plans are made parity-compliant. Moreover, some benchmarks guarantee that QHPs in their state will cover at least a reasonable amount of mental health services, while others guarantee only the barest amount of late-stage services, such as inpatient treatment. While a QHP may cover more services regardless of what is contained in the state benchmark plan, guaranteed access to these services through the EHB portion of the state benchmark plan is an important protection for individual consumers. Ensuring that consumers have access to low-cost, early treatment such as quality community based outpatient care can reduce utilization of high cost services, such as emergency room visits and residential treatment.
There are many types of exclusions.
Among the 50 plans, 22 of the state benchmark plans had quantitative limits on mental health services. The limits ranged from eight visits (Utah) to many plans which offered up to 60 visits a year for outpatient treatment. Almost all quantitative treatment limits should have been removed from QHPs that were expected to start after July 1st, 2014.

49
Along with traditional non-quantitative treatment limitations such as preauthorization requirements or denials based on whether a treatment is deemed “medically necessary,” below are the most common types of exclusions we found among the state benchmark plans. These exclusions may be indicative of the types of exclusions consumers will continue to see in their QHPs.
Limitations on types of services:
• Family or marital counseling• Bereavement counseling• Services by telephone• Services in non-clinical settings; for example, services provided in-home, schools, domicile, and custodial care• Psychological testing• Residential treatment• Community reintegration service.• Services by practitioners that do not meet certain licensure guidelines, potentially excluding peer specialists• Transportation for providers to get to clients or for clients to get to providers• Cognitive therapy as a rehabilitative service• Services that focus on vocational, educational, or parental counseling• Services that teach self-help techniques like biofeedback• Certain substance use treatments, including detoxification or methadone maintenance
Limitations based on type or severity of the condition:
• “Non-biologically based” conditions• Certain types of disorders, such as oppositional disorders, learning disability, attention deficit disorder, attention deficit hyperactivity disorder,
developmental disabilities or eating disorders• Severity limitations, such as a “break with reality” before certain services may be accessed
Formularies may need to be revised.
Many benchmark plans exclude some branded medications from coverage, and almost all plans use tiered cost-sharing and utilization management such as step therapy or “fail-first” policies, making many of the medications prohibitively expensive or difficult to get. When new medications are covered, they are almost always on the highest cost-sharing tier. Parity requires that formularies treat mental health and general health medications equally, so while neutral policies may still limit access, formularies cannot unfairly limit access to psychotropic medications. For more information, see MHA’s report with Breakaway Policy entitled: Behavioral Prescription Drug and Services Coverage: A Snapshot of Exchange Plans.
Rehabilitative services may need to be revised.
Blue Cross and Blue Shield of Kansas’ Comprehensive Major Medical-Blue Choice excludes cognitive therapy for rehabilitation, while New Jersey’s Horizon HMO specifically includes cognitive therapy. Currently, many state benchmark plans specify that rehabilitative services include physical, occupational, and speech therapy. Rehabilitative services are an EHB and are defined by the National Association of Insurance Commissioners as being “health care services that help a person keep, get back or improve skills and functioning for daily living that have been lost or impaired because a person was sick, hurt or disabled,” and these specifically include “psychiatric rehabilitative services in a variety of inpatient and or outpatient settings.”9 After the benchmark plans are made parity-compliant, the scope of rehabilitative services offered will need to expand dramatically for many plans and will need to include mental health rehabilitation services, unless excluded through neutral policies.
9 National Association of Insurance Commissioners. http://www.naic.org/documents/committees_b_consumer_information_ppaca_glossary.pdf

50
The scope of preventive services is often unclear.
Hawaii Medical Service Association’s Preferred Provider Plan 2010 specifies that it covers exactly what is required by the ACA, while Connecticare’s HMO covers “preventive care/ screening/ immunization” generally. The ACA requires certain preventive services to be covered, including, for example, depression screenings and psychosocial/behavioral assessments. Some of the plans specify that they only cover the statutory minimum, while others state that they cover preventive services generally, so the scope of coverage is often unclear. For all plans, the scope of coverage for preventive services should be as broad as possible to best promote population health and lower downstream costs.
Going Forward
One key finding emerges from this report: whether one has parity or ongoing disparity in mental health care depends on where one lives. MHA believes all people should have parity in mental health care and recommends the following to increase parity and decrease disparity. First, expanding Medicaid and providing insurance to individuals with mental illness is a priority. Without insurance, individuals are more likely to wait until a mental health crisis and use costly services such as emergency hospital visits, and are less likely to have access to early intervention. Second, although access to insurance is an important first step, insurance coverage does not in itself guarantee meaningful access to treatment and supportive services. Health plan carriers should broaden coverage, particularly to include evidence-based community mental health services. Treatment provided, whether in the public or private system, should focus on prevention and early intervention services. Workforce development strategies should be developed and implemented in those states with the fewest available mental health providers. Health plan carriers should include sufficiently broad networks of mental health professional in their plans. Third, data on quality and performance measures of both the private and public mental health systems should be systematically collected and made publicly available. Collecting and making data publicly available will illuminate how various policies, such as transitioning to Medicaid Managed Care, are strengthening parity or increasing disparity across the states. Finally, transparency in insurance coverage will increase meaningful consumer choice and reduce unfair burden on the consumer. Government agencies should require updated state benchmark plans and post these plans online. Government agencies and health plan carriers should ensure that information about plans is fully disclosed to consumers and is as detailed and transparent as possible. Outlines of Coverage for all Qualified Health Plans should be available to consumers online before application. Only by taking these steps to increase transparency and comprehensive coverage can the country achieve the goal of strengthening parity and reducing disparity.

51
GlossaryIndicator Description of Measure SourceAdult Dependence or Abuse of Illicit Drugs or Alcohol
Dependence or abuse is based on definitions found in the 4th edition of the Diagnostic and Statistical Manual of Mental Disorders (DSM-IV). Illicit Drugs include marijuana/hashish, cocaine (including crack), heroin, hallucinogens, inhalants, or prescription-type psychotherapeutics used non-medically, including data from original methamphetamine questions but not including new methamphetamine items added in 2005 and 2006. Data survey year 2011-2012.
SAMHSA, Center for Behavioral Health Statistics and Quality, National Survey on Drug Use and Health, 2011, and 2012
Adults with AMI (Any Mental Illness)
Any Mental Illness (AMI) is defined as having a diagnosable mental, behavioral, or emotional disorder, other than a developmental or substance use disorder, assessed by the Mental Health Surveillance Study (MHSS) Structured Clinical Interview for the Diagnostic and Statistical Manual of Mental Disorders—Fourth Edition—Research Version—Axis I Disorders (MHSS-SCID) which is based on the 4th edition of the Diagnostic and Statistical Manual of Mental Disorders (DSM-IV). Three categories of mental illness severity are defined based on the level of functional impairment: mild mental illness, moderate mental illness, and serious mental illness. Any mental illness includes persons in any of the three categories. These mental illness estimates are based on a predictive model and are not direct measures of diagnostic status. Data survey year 2011-2012.
Substance Abuse and Mental Health Services Administration, Center for Behavioral Health Statistics and Quality. (February 28, 2014). The NSDUH Report: State Estimates of Adult Mental Illness from the 2011 and 2012 National Surveys on Drug Use and Health. Rockville, MD.
Adults with AMI and Uninsured
Any Mental Illness (AMI) is defined as having a diagnosable mental, behavioral, or emotional disorder, other than a developmental or substance use disorder, assessed by the Mental Health Surveillance Study (MHSS) Structured Clinical Interview for the Diagnostic and Statistical Manual of Mental Disorders—Fourth Edition—Research Version—Axis I Disorders (MHSS-SCID) which is based on the 4th edition of the Diagnostic and Statistical Manual of Mental Disorders (DSM-IV). A respondent is classified as NOT having any health insurance (IRINSUR=2) if he/she met EVERY one of the following conditions. (1) Not covered by Private Health Insurance (PRVHLTIN=2) (2) Not covered by Medicare (MEDICARE=2) (3) Not covered by Medicaid (MEDICAID=2) (4) Not covered by Champus, Champva, Va, or Military (CHAMPUS=2) If the respondent is not classified as having or not having any health insurance according to PRVHLTIN, MEDICARE, MEDICAID, and CHAMPUS, then he/she is imputed to either of these two categories, where consistency is maintained between IRINSUR, IRINSUR2, and IRPINSUR. Annual estimated rate from data survey year 2010, 2011, 2012.
SAMHSA, Center for Behavioral Health Statistics and Quality, National Survey on Drug Use and Health, 2010, 2011, and 2012.
Adults with AMI reporting Unmet Need
Perceived Unmet Need for Mental Health Treatment/Counseling is defined as a perceived need for treatment/counseling that was not received. Perception of need was asked of all respondents regardless of disorder status. Respondents with unknown perception of unmet need information were excluded. Annual estimated rate from data survey year 2010, 2011, 2012.
SAMHSA, Center for Behavioral Health Statistics and Quality, National Survey on Drug Use and Health, 2010, 2011, and 2012.
Adults with AMI who Received Treatment
Mental Health Treatment/Counseling is defined as having received inpatient treatment/counseling or outpatient treatment/counseling or having used prescription medication for problems with emotions, nerves, or mental health. Respondents were not to include treatment for drug or alcohol use. Respondents with unknown treatment/counseling information were excluded. Annual estimated rate from data survey year 2010, 2011, 2012.
SAMHSA, Center for Behavioral Health Statistics and Quality, National Survey on Drug Use and Health, 2010, 2011, and 2012.

52
Indicator Description of Measure SourceAdults with Disability who Could Not See a Doctor Due to Costs
Disability questions were added to the Behavioral Risk Factor Surveillance System (BRFSS) core questionnaire in 2004. Consistent with Healthy People 2010, disability was determined using the following two BRFSS questions: “Are you limited in any way in any activities because of physical, mental or emotional problems?” and “Do you now have any health problem that requires you to use special equipment, such as a cane, a wheelchair, a special bed, or a special telephone?” Respondents were defined as having a disability if they answered “Yes” to either of these questions. Respondents were defined as not having a disability if they answered “No” to both questions. “Was there a time in the past 12 months when you needed to see a doctor but could not because of cost?” Responses were grouped into two categories: Yes and No. Data survey year 2012.
Centers for Disease Control and Prevention (CDC). Behavioral Risk Factor Surveillance System Survey Data. Atlanta, Georgia: U.S. Department of Health and Human Services, Centers for Disease Control and Prevention, 2012 http://dhds.cdc.gov/dataviews/
Adults with Serious Thoughts of Suicide
Adults aged 18 or older were asked whether they had seriously thought about, made any plans, or attempted to kill themselves at any time during the past 12 months, or if they had received medical attention from a health professional or stayed overnight in a hospital in the past 12 months because of a suicide attempt. Data survey year 2011-2012.
SAMHSA, Center for Behavioral Health Statistics and Quality, National Survey on Drug Use and Health, 2011, and 2012
Children who Needed but Did Not Get Mental Health Services
Children age 2-17 with an emotional, developmental, or behavioral problems for which they need treatment or counseling (K2Q22) who did not receive treatment from a mental health professional during the past 12 months (K4Q22). Data survey year 2011-2012.
National Survey of Children's Health. Child and Adolescent Health Measurement Initiative, Data Resource Center on Child and Adolescent Health website. Retrieved 09/17/14 from http://childhealthdata.org/browse/allstates?q=2220#
Children with EBD who were Consistently Insured
Children with Ongoing Emotional Behavioral or Developmental issues is defined as any child (age 0-17) with any kind of emotional, developmental, or behavioral problem that requires treatment or counseling (K2Q22 = Yes), and if so, whether the condition(s) have lasted or are expected to last for 12 months or longer (K2Q23). Consistently Insured combines responses to whether the child currently has health insurance coverage (K3Q01) and whether currently insured children have had periods with no insurance (K3Q03), to determine how many children have had continuous coverage for at least one year and how many were uninsured at the time of the survey or at some time within the previous 12 months. Data survey year 2011-2012.
National Survey of Children's Health. Child and Adolescent Health Measurement Initiative, Data Resource Center on Child and Adolescent Health website. Retrieved 09/17/14 from http://childhealthdata.org/browse/allstates?q=2199&g=463
Children with Emotional Behavioral Developmental Issues (EBD)
Children with Emotional Behavioral or Developmental Issues is defined as any child between age 2-17 with any kind of emotional, developmental, or behavioral problem for which he or she needs treatment or counseling. Data survey year 2011-2012.
Child and Adolescent Health Measurement Initiative. National Survey of Children's Health Enhanced Data File. Data Resource Center for Child and Adolescent Health. Retrieved 10/8/14 from http://childhealthdata.org/help/dataset.
Children with Ongoing EBD reporting Inadequate Insurance
Children with Ongoing Emotional Behavioral or Developmental Issues (any child (age 0-17) with any kind of emotional, developmental, or behavioral problem that requires treatment or counseling (K2Q22 = Yes), and if so, whether the condition(s) have lasted or are expected to last for 12 months or longer (K2Q23). Children with an ongoing EBD who have insurance coverage (Denominator), that report inadequate insurance (Numerator), defined as not meeting one or more of the following: 1) usually/always meets child’s needs, 2) usually/always allow child to see needed provider, 3) out-of-pocket costs are usually/always reasonable or has no out-of-pocket costs. Data survey year 2011-2012.
National Survey of Children's Health. Child and Adolescent Health Measurement Initiative, Data Resource Center on Child and Adolescent Health website. Retrieved 09/17/14 from http://childhealthdata.org/browse/allstates?q=2201&g=463&a=4050

53
Indicator Description of Measure SourceImproved Social Connectedness
Adults served in the pubic system were asked to answer on a scale from Strongly Agree to Strongly Disagree answers to the following questions: 1) I am happy with the friendships I have. 2) I have people with whom I can do enjoyable things. 3) I feel I belong in my community. 4) In a crisis, I would have the support I need from family or friends. In the Uniform Reporting System, this measure is called "Improved Social Connectedness." Year 2012.
2012 Center for Mental Health Services, Uniform Reporting System Output Tables, Substance Abuse and Mental Health Services Administration, US Department of Health and Human Services. Retrieved 7/16/14 from /http://www.samhsa.gov/dataoutcomes/urs
Mental Health Workforce
This measure represents the ratio of the state population to the number of mental health providers including psychiatrists, psychologists, licensed clinical social workers, counselors, and advanced practice nurses specializing in mental health care. Survey data year 2013.
County Health Rankings & Roadmaps. http://www.countyhealthrankings.org/app/virginia/2014/measure/factors/62/map. This data comes from the National Provider Identification data file, which has some limitations. Providers who transmit electronic health records are required to obtain an identification number, but very small providers may not obtain a number. While providers have the option of deactivating their identification number, some mental health professionals included in this list may no longer be practicing or accepting new clients.
State Hospital Readmission: 180 days Non-Forensic
Adults and Children served in the public system who had readmission within 180 days to state psychiatric Hospital: "Civil" (Non-Forensic) patients. Year 2012.
2012 Center for Mental Health Services, Uniform Reporting System Output Tables, Substance Abuse and Mental Health Services Administration, US Department of Health and Human Services. Retrieved 7/16/14 from /http://www.samhsa.gov/dataoutcomes/urs
Students Identified with Seriously Emotional Disturbance for IEP
Percent of Children Identified as having a Serious Emotional Disturbance among enrolled students Grade 1-12 and Ungraded. This measure was calculated from data provided by IDEA Part B Child Count and Educational Environments, Common Core of Data. Under IDEA regulation, Serious Emotional Disturbance is identified as a condition exhibiting one or more of the following characteristics over a long period of time and to a marked degree that adversely affects a child's educational performance: (A) An inability to learn that cannot be explained by intellectual, sensory, or health factors. (B) An inability to build or maintain satisfactory interpersonal relationships with peers and teachers. (C) Inappropriate types of behavior or feelings under normal circumstances. (D) A general pervasive mood of unhappiness or depression. (E) A tendency to develop physical symptoms or fears associated with personal or school problems. Emotional disturbance includes schizophrenia. The term does not apply to children who are socially maladjusted, unless it is determined that they have an emotional disturbance under paragraph (c)(4)(i) of this section. Year 2011-2012.
IDEA Data Center, 2012 IDEA Part B Child Count and Educational Environments, https://inventory.data.gov/dataset/8715a3e8-bf48-4eef-9deb-fd9bb76a196e/resource/a68a23f3-3981-47db-ac75-98a167b65259. US Department of Education, National Center for Education Statistics, Common Core of Data. http://nces.ed.gov/ccd/stnfis.asp

54
Indicator Description of Measure SourceYouth Attempted Suicide
Among youth grade 9 through 12th, percentage of Youth in High School who reported that during the past 12 months, they attempt suicide one or more times. Data survey year 2013.
Centers for Disease Control and Prevention. 2013. Youth Risk Behavior Survey. Available at: http://nccd.cdc.gov/youthonline
Youth Dependence or Abuse of Illicit Drugs or Alcohol
Among youth age 12-17, dependence or abuse is based on definitions found in the 4th edition of the Diagnostic and Statistical Manual of Mental Disorders (DSM-IV). Illicit Drugs include marijuana/hashish, cocaine (including crack), heroin, hallucinogens, inhalants, or prescription-type psychotherapeutics used non-medically, including data from original methamphetamine questions but not including new methamphetamine items added in 2005 and 2006. See Section B.4.8 in Appendix B of the Results from the 2008 National Survey on Drug Use and Health: National Findings. Data survey year 2011-2012
SAMHSA, Center for Behavioral Health Statistics and Quality, National Survey on Drug Use and Health, 2010, 2011, and 2012 (2010 Data – Revised March 2012).
Youth with At Least One Major Depressive Episode
Among youth age 12-17, major depressive episode (MDE) is defined as in the 4th edition of the Diagnostic and Statistical Manual of Mental Disorders (DSM-IV), which specifies a period of at least 2 weeks when a person experienced a depressed mood or loss of interest or pleasure in daily activities and had a majority of specified depression symptoms. For youth age 12-17. Survey Data 2011-2012.
SAMHSA, Center for Behavioral Health Statistics and Quality, National Survey on Drug Use and Health, 2010, 2011, and 2012 (2010 Data – Revised March 2012).