parental involvement in children’s education 2007 · parental involvement in children’s...
TRANSCRIPT
Research Report DCSF-RR034
Parental Involvement inChildren’s Education 2007
Mark Peters, Ken Seeds, Andrew Goldstein andNick Coleman
BMRB Social Research
Parental Involvement in Children’s Education 2007
Mark Peters, Ken Seeds, Andrew Goldstein and Nick Coleman
BMRB Social Research
The views expressed in this report are the authors’ and do not necessarily reflect those of the Department for Children, Schools and Families.
© BMRB International Ltd 2008 ISBN 978 1 84775 144 7
Research Report No DCSF-RR034


1
Executive Summary
Background
BMRB Social Research were commissioned by the Department for Children, Schools and
Families (DCSF) to conduct a survey of parents and carers of children, in order to
examine parental involvement in children’s education.
The then Department for Education and Skills (DfES) commissioned previous surveys in
2001 and 2004. The main objective of the 2007 survey was to investigate the extent and
variety of parents’ involvement in their children’s schooling (including comparing data
with the 2001 and 2004 surveys).
Summary of research method
A telephone survey of 5,032 parents and carers of children aged 5-16 attending
maintained schools (living in England) was carried out by BMRB between August and
October 2007. Interviews lasted approximately 20 minutes on average and were
conducted via Computer Assisted Telephone Interviewing (CATI).
The survey was based on a nationally representative sample of this group. Differences
are reported only when they are statistically significant at the 95 per cent confidence
level.
Key findings
• Around half (51%) of parents felt very involved in their child’s school life: this is
an increase from 29% in 2001, to 38% in 2004 to 51% in the 2007 survey.
Women, parents with young children, parents who left full-time education later,
those from Black or Black British backgrounds and parents of a child with a
Statement of SEN were all more likely than average to feel very involved. Lone
parents and non-resident parents were both less likely than average to feel very
involved.
• Similar to survey findings in previous years, work commitments were the main
barrier to greater involvement (mentioned by 44% of respondents).
• Parents are now more likely to see a child’s education as mainly or wholly their
responsibility (28%). This represents a shift from previous years, when parents
were more likely to see it as the school’s responsibility.
• Nearly all parents (96%) agreed that it was extremely important to make sure
that their child attended school regularly and on time, a finding consistent with
2001 and 2004
• Around three in four of all parents felt that it was extremely important to help
with their child’s homework, a similar proportion to previous years. Further, the
2
same proportion said they felt confident always or most of the time when helping
their children with homework; the proportion who said they are always confident
has fallen a little since 2001.
• Informal discussions with school staff were seen as the most useful way of finding
out about children’s progress in school (28% found them the most useful
method). In previous years of the survey, parents’ evenings had been seen as the
most useful means of communication.
Summary of Findings
Overall involvement and responsibility
• Around half (51%) of parents felt very involved in their child’s school life: the
proportion who said they were very involved has increased from 29% in 2001, to
38% in 2004 to 51% in the 2007 survey. Women, parents with young children,
parents who left full-time education later, those from Black or Black British
backgrounds, parents of a child with a Statement of SEN were all more likely than
average to feel very involved. Lone parents and non-resident parents were both
less likely than average to feel very involved.
• In two-parent households, it was common for both parents to share some
involvement in their child‘s school life, although women tended to feel more
involved than men (53% compared with 45% felt very involved).
• Two in three parents said that they would like to be more involved in their child’s
school life. Although this is slightly lower than in 2001, this reflects the fact that
parents now feel that they are more involved.
• Those who said they felt uninvolved in their child’s education were more likely
than those who said they felt involved to desire greater involvement (73%
compared with 65%).
• Similar to survey findings in previous years, work commitments were the main
barrier to greater involvement (mentioned by 44% of respondents).
Parents attitudes to educational responsibility
• Parents are now more likely to see a child’s education as mainly or wholly their
responsibility (28%). This represents a shift from previous years, when parents
were more likely to see it as the school’s responsibility. Non-white parents were
most likely to say it was the parent’s responsibility rather than the schools.
• Nearly all parents (96%) agreed that it was extremely important to make sure
that their child attended school regularly and on time, a finding consistent with
2001 and 2004.
3
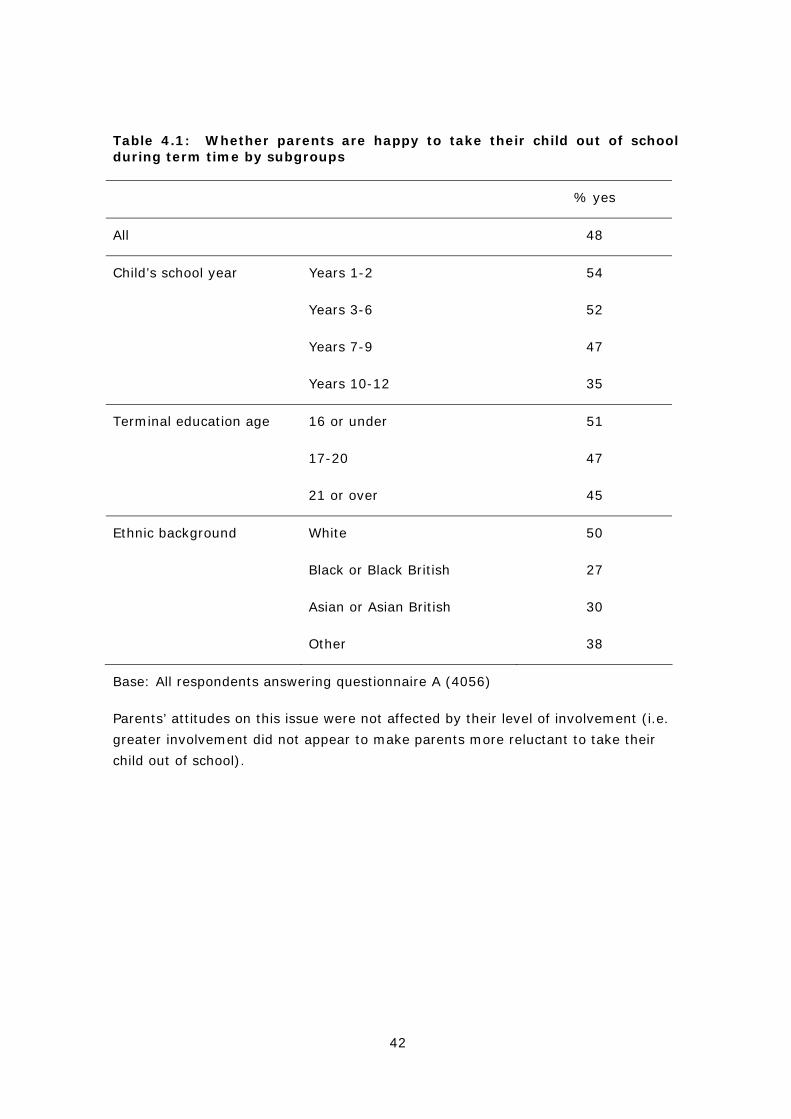
• Around a half (48%) of parents said that they would be happy to take their child
out of school during term time (for example to go on a family holiday), and this
did not vary by the level of involvement the parents had in their child’s school
life. Parents were more reluctant to do this if their child was in year 10 or above
(35% would be happy to do so). These findings are consistent with findings from
previous surveys (46% and 49% said they would be happy to take their child out
of school in 2004 and 2001 respectively).
Involvement with the child’s education
• One in three parents (32%) said they help their children with their homework
every time, while a further 26% do so most times. This represents a slight
increase on previous years’ figures.
• Around three in four parents felt that it was extremely important to help with
their child’s homework, a similar proportion to previous years.
• Three in four of all parents said they felt confident always or most of the time
when helping their children with homework; the proportion who said they are
always confident has fallen a little since 2001. The main reasons for lacking
confidence were changing teaching methods and a lack of understanding of the
child’s work.
• Most parents also take part in other activities with their children, such as doing
school projects together (83%), making things (81%), playing sport (80%) and
reading (79%). These figures have increased since 2004, indicating that parents
now participate in a wider range of activities with their children.
Involvement with the school
• Around one in three parents (35%) had helped out in class or at school at some
point, while 30% had been involved with the PTA and 21% with a Parent Council
or Forum; 15% had been involved with a homework club. In total, around half of
parents (53%) had taken part in at least one of these activities.
• The majority of parents felt that it was extremely important to attend events such
as parents’ evenings (75%) and to support schools’ policies on children’s
behaviour (80%). Both these attitudes and the level of involvement in school-
based activities have remained similar to previous years of the survey.
• Although most parents (58%) felt there were enough opportunities for
involvement in their child’s school, 28% would like to see more opportunities.
• Certain groups of parents were more involved in both school activities and with
their child’s homework: women who were not working full-time and parents with
younger children, as well as those from non-white ethnic groups. In addition,
parents were more likely to take part in school-based activities if they had left
4
full-time education after the age of 16. Non-resident parents were far less likely
to be involved in school activities or with homework, but were just as likely as
other parents to do out-of-school activities with their child, such as reading,
making things and sport.
• Parents who get involved in school activities (particularly homework clubs or
parent councils) were most likely to want to get more involved in their child’s
education. This suggests that involvement breeds a desire to get more involved,
although this contradicts some of the findings summarised earlier (notably that
those who felt less involved were most likely to desire more involvement).
Communication with school
• Informal discussions with school staff were seen as the most useful way of finding
out about children’s progress in school (28% found them the most useful
method). In previous years of the survey, parents’ evenings had been seen as the
most useful means of communication, but in the 2007 survey this had decreased
in comparison with informal discussions. Parents of children in primary schools
were particularly likely to value informal discussions.
• The two methods of communication that parents thought schools should use
more were written communication, including notes brought home by children
(21%), and email (16%).
• Parents were generally very positive towards information provided by the school,
and the level of consultation and support provided. They were particularly
positive towards the clarity of information provided about their child’s progress
(86% said their child’s school provided clear information) and the school being
welcoming to parents (92% said their child’s school was welcoming to parents).
Attitudes have also become more positive over time and views on communication
and consultation were particularly positive amongst parents of children in primary
schools.
• Three in four parents said that they were well informed about their options when
choosing a school for their child, and this was consistently high across different
groups of parents.
• Using School Profiles enables maintained schools to communicate with parents
about many different facets of the school, including how the school is
progressing, its priorities and also its performance. A total of 29% of parents had
heard of School Profiles. Awareness was highest amongst parents of children in
years 10-12 (33% were aware).
• Only half of those who were aware of School Profiles had read them (15% of all
parents surveyed). Respondents mentioned various benefits and information on a
5
school’s academic results and performance was considered most useful (41%
thought this information was good1).
Awareness of initiatives
• Awareness of Home School Agreements has not changed since 2001 and two in
five parents had not heard of them. Overall, 39% of parents said that they had
signed one. Just under half of parents had heard of Bookstart (this was higher
among parents of younger children), while most respondents said they knew at
least a little about school achievement and attainment tables. Awareness of
Ofsted had increased since 2001.
Children’s characteristics
• Overall, 12% of parents in the survey said that their child had been identified as
having Special Educational Needs (SEN), and 6% had a Statement of SEN. In
these households, parents were more likely than average to have a long-term
illness or disability and to be in a lower social grade.
• One in five respondents said that their child attended a Supplementary or
Complementary School or Homework Club.
• Almost all parents said they had internet access at home, although access was
lower amongst disadvantaged groups2 Access to the internet at home has risen
over the years of this survey, from 69% in 2001 to 92% in the current survey.
Special Educational Needs
• The survey findings show various sub-group differences, but some of the
strongest impacts and most consistent differences have been found in respect of
parents of children with Special Educational Needs (SEN).
• Parents of children with statements of SEN were more likely to feel very involved
in their child’s education (63% versus 51% overall). Parents of children with SEN
were also more likely to want to increase their involvement in their child’s school
life (70% of parents of children with identified SEN and 73% of parents of
children with a statement wanted to be more involved).
1 Respondents were asked to list anything they thought was good about The School
Profiles (i.e. responses were not prompted).
2 Disadvantaged parents in this context refers specifically to lone parent households,
households where English is not the main language and lower social grades.
6
• In line with the more general survey findings, 84% who felt not very or not at all
involved wanted to do more. However, even amongst those who already felt very
or fairly involved, 70% still wanted to do more. The data therefore show a clear
desire for parents of children with SEN to be involved in their children’s schooling.
• Parents of children identified as having SEN were also more likely to have children
attending supplementary homework clubs and were more likely to say it was
important that their child actually attended (52% versus 32% overall). They also
thought it was extremely important to get in touch with their school when they
had a specific request about how their child was getting on (amongst parents of
children with a statement of SEN, 85% thought it was extremely important).
• Parents of children with SEN were less likely than other parents to feel they had
opportunities to have a say in how their school is run (43% disagreed they had
enough opportunities). They also had a preference for face-to-face modes of
communication with their child’s school rather than through letters, e-mails or on
the telephone. More specifically, 29% said informal face-to-face discussions and
20% said other formal meetings were most useful.
• Parents of children with a statement of SEN were more positive in relation to
information provided by the school that can help them support their child’s
progress. However, parents of children with SEN (statemented or otherwise) were
more negative in relation to jargon in school information (39% agreed that there
was too much jargon in school information).
Comparisons over time
• Previous surveys of parent’s attitudes and involvement were carried out in 2001
and 2004 and it is possible to identify various trends over time.
• Generally speaking, there appears to be an increased perception of involvement
amongst parents and this increase is partly borne out in the increased levels of
involvement in activities which aid children’s learning (eg reading, playing sport,
cooking). The largest increase was in the proportion who read with their children
(an increase from 70% in 2004 to 79% in 2007) and the proportion that play
sport with their children (an increase from 71% in 2004 to 80% in 2007).
• There was also an increase in the proportion (28%) who felt a child’s education is
mainly the parent’s responsibility (an increase from 20% in 2001 and 19% in
2004).
• Parents were also more positive about the ways in which schools communicate
with them and valued informal discussions with schools more than they had done
in 2004 and 2001. More specifically, 28% found informal discussions their most
useful mode of communication, compared to 18% in 2004 and 10% in 2001.
7
• One area where the survey findings indicate less positive results was in relation to
‘confidence’. Fewer parents (33%) felt confident helping their children with
homework. The main decrease took place between 2001 and 2004 (when it
decreased from 41% to 35%).
• Although parents were positive about communication issues, an increased
proportion felt that school information contained ‘too much jargon’ (30% felt this
was the case compared to 27% in 2001).
Implications for Policy and Further Research
The findings have a number of implications for policy and further research, which have
been summarised below:
• Parents feel increasingly involved in their child’s school life. They are also more likely
to see education as their own responsibility as well as the school’s, and this is likely
to heighten their sense of involvement.
• The desire to get more involved tends to be stronger amongst disadvantaged groups
(e.g. those in lower social grades, ethnic minorities, respondents with a long-term
illness or disability). Further work may be needed to understand how to get these
parents more involved and understand their barriers to involvement. For instance,
the survey (and previous surveys in 2004 and 2001) have shown that work
commitments are a significant barrier for some parents.
• The proportion of parents that would be happy to take their children out of school
remains similar to previous years. There may be scope for further information in this
area in terms of communicating the negative consequences of this to parents.
• In terms of future communication strategies, informal discussions are now seen as
the most useful method of communication. Methods other than face-to-face contact
(eg e-mail) were more popular with parents who are currently less involved, so these
methods could be focused on such parents.
• Parents of children who had been identified as having SEN but who had not been
statemented were least positive about the communication they had with schools. It is
possible that these parents need more consultation on their child’s progress.
• Awareness of Home-School Agreements was limited and has not changed since 2001.
8
Table of Contents
Executive Summary............................................................................................1
1 Introduction ..............................................................................................15
1.1 Background.........................................................................................15
1.2 Research design..................................................................................16
1.2.1 Sample population .......................................................................16
1.2.2 Establishing eligibility and child selection ....................................17
1.3 Questionnaire design and pilot survey................................................18
1.4 Analysis and weighting .......................................................................19
1.5 Structure of report..............................................................................19
1.6 Explanatory notes...............................................................................20
1.6.1 Interpreting the survey findings ..................................................20
1.6.2 Data tables...................................................................................20
2 Child and household characteristics ..........................................................21
2.1 Household composition.......................................................................21
2.2 Respondent age ..................................................................................22
2.3 Economic activity and terminal education age ....................................22
2.4 Social grade ........................................................................................23
2.5 Marital Status .....................................................................................24
2.6 Ethnicity .............................................................................................24
2.7 Disability and caring responsibilities ..................................................24
2.8 Language ............................................................................................25
2.9 Internet access...................................................................................25
2.10 School year of selected child ...........................................................27
2.11 Age of selected child........................................................................28

9
2.12 Gender of selected child ..................................................................28
2.13 Children with Special Educational Needs (SEN)...............................28
2.14 Supplementary or Complementary School or Homework Club .........30
3 Overall involvement and responsibility......................................................31
3.1 How involved parents feel in their child’s school life ..........................31
3.1.1 Types of parents most likely to be involved .................................32
3.2 Which parent is more involved?..........................................................34
3.3 Parents’ confidence in their own involvement ....................................35
3.4 Getting more involved.........................................................................35
3.5 Barriers to greater involvement..........................................................38
4 Attitudes to parental responsibility ...........................................................39
4.1 Relative responsibility of schools and parents ....................................39
4.2 Making sure child attends school ........................................................40
4.2.1 Taking children out of school during term time............................41
5 Involvement with child’s education...........................................................43
5.1 The importance of helping with homework.........................................43
5.2 How often parents help their child with homework ............................45
5.3 Confidence in helping with homework ................................................46
5.4 Reasons for lack of confidence............................................................50
5.5 Other activities: Which activities parents do with their child ..............51
5.6 Importance of making sure children attend homework clubs .............53
6 Involvement/partnership with school .......................................................55
6.1 Importance of involvement at school..................................................55
6.2 Level of involvement with the school..................................................57
6.2.1 Impact of actual involvement with the school on perceived desire
to get more involved..................................................................................60

10
6.3 Whether parents have enough opportunities for involvement ............61
7 Communication with school.......................................................................63
7.1 Methods of communication .................................................................63
7.2 Most useful methods of communication..............................................65
7.3 Which methods should schools use more?..........................................68
7.4 Frequency parents receive and would like to receive reports .............69
7.5 Whether parents find real-time reporting appealing...........................70
7.6 Confidence in talking to teachers........................................................72
7.7 Attitudes to communication with school .............................................74
7.8 Importance of communication ............................................................78
7.9 Communication about the school ........................................................78
7.10 Being informed about choosing a school .........................................80
7.11 School Profiles.................................................................................81
7.11.1 Levels and sources of awareness .................................................81
7.11.2 Whether read School Profile.........................................................83
7.11.3 Advantages and potential improvements .....................................84
8 Awareness of initiatives ............................................................................89
9 Special Educational Needs .........................................................................92
10 Comparisons over time...........................................................................95
10.1 Comparing trend data......................................................................95
10.2 Areas of Consistency .......................................................................95
10.3 Changes over time...........................................................................96
11 Implications for Policy and Further Research.........................................98
Technical Appendix ........................................................................................100
Questionnaire A: Parents Involvement in Children’s Education ..................100

11
Questionnaire B: Parents Involvement in Children’s Education...................120
Fieldwork procedures .................................................................................139
Fieldwork figures ........................................................................................140
Analysis ......................................................................................................141
12
Index of Tables
Table 1.1: Sample populations in 2001, 2004 and 2007 surveys .................... 17
Table 2.1 Respondent’s social grade............................................................... 23
Table 2.2 Social grade comparison between surveys...................................... 23
Table 2.3: Internet access at home by subgroups.......................................... 26
Table 2.4: School year of selected child .......................................................... 27
Table 2.5: Disability and Special Educational Needs by subgroups ................ 29
Table 3.1: Whether parents want to be more involved, by sub-groups .......... 37
Table 4.1: Whether parents are happy to take their child out of school
during term time by subgroups .................................................. 42
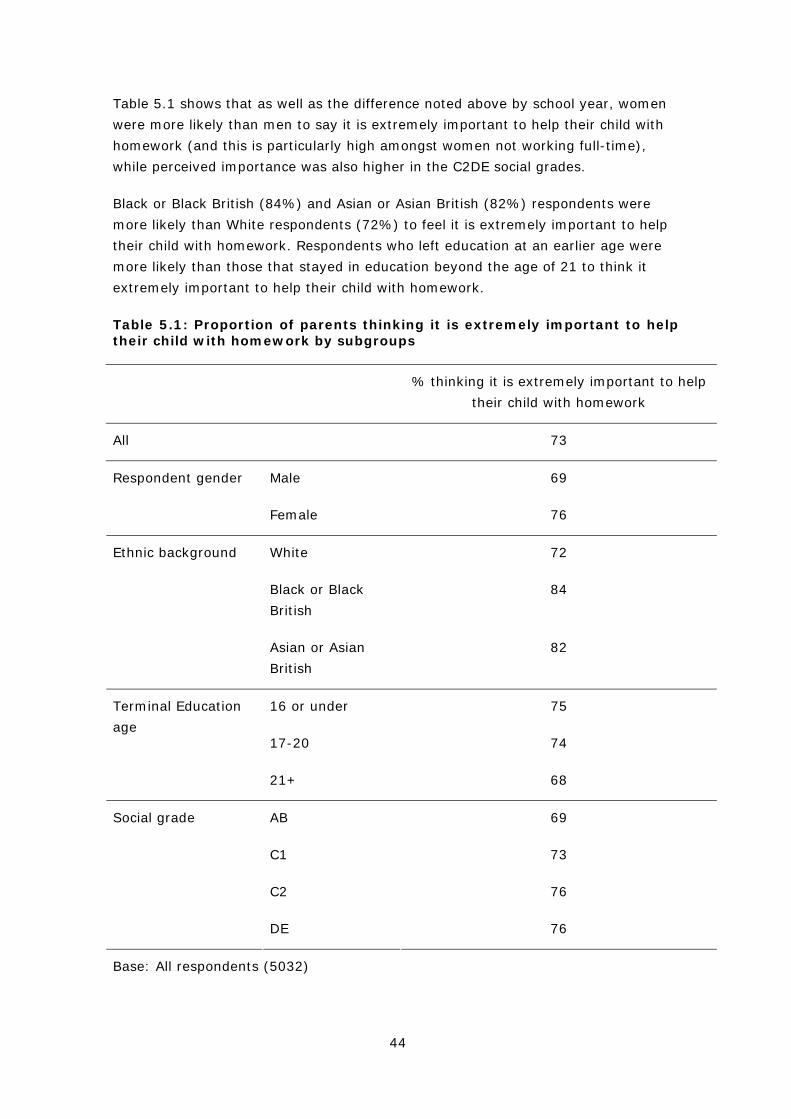
Table 5.1: Proportion of parents thinking it is extremely important to help
their child with homework by subgroups.................................... 44
Table 6.1: Those who felt it extremely important to be involved in school in
other ways by subgroups............................................................ 56
Table 6.2: Parents who were involved with other activities at child’s school
(whenever there is an opportunity or sometimes) by
subgroups................................................................................... 59
Table 6.3: Whether parents would like to be more involved in child’s school
life by involvement in other activities......................................... 61
Table 6.4: Whether parents have enough opportunities to have a say in
how child’s school is run by subgroups....................................... 62
Table 7.1: Use of communication methods by subgroups .............................. 65
Table 7.2: Confidence in talking to teachers by subgroups ............................ 73
Table 7.3: Preferred method of contact ......................................................... 80
Table 7.4: Awareness of School Profiles by subgroups .................................. 82
Table 7.5: How helpful School Profiles were by subgroups............................. 87
Table 8.1: Whether signed a Home School Agreement by subgroups............. 91
13
Index of Charts
Chart 2.1: Summary of household characteristics.......................................... 21
Chart 2.2: Summary of household characteristics.......................................... 22
Chart 2.3: Age of selected child ...................................................................... 28
Chart 3.1: How involved parents feel in their child’s school life – trend
data ............................................................................................ 31
Chart 3.2: Types of parents most likely to be involved .................................. 33
Chart 3.3: Which parent is more involved in child’s school life, by gender
and working status..................................................................... 34
Chart 3.4: Whether parents agree that they would like to be more involved
in their child’s school life............................................................ 36
Chart 4.1: Relative responsibility for a child’s education – trend data ........... 39
Chart 5.1: Proportion of parents who think it is extremely important to
help their child with homework - trend data............................... 43
Chart 5.2: Proportion of parents who help their child with homework every
time or most of the time by school year ..................................... 45
Chart 5.3: How often parents help their child with homework – trend data.... 46
Chart 5.4: How confident parents feel helping their child with homework...... 47
Chart 5.5: How confident parents feel helping their child with homework –
trend data................................................................................... 48
Chart 5.6: How confident parents feel helping their child with homework by
school year ................................................................................. 49
Chart 5.7: Why some parents are not confident helping with homework........ 50
Chart 5.8: Other activities parents do with their child .................................... 51
Chart 5.9 Other activities parents do with their child – trend data ................. 52
Chart 5.10: Whether parents take part in other activities with their child –
trend data................................................................................... 53
Chart 5.11: Whether parent feels it is extremely important that their child
attends supplementary homework club by school year .............. 54
14
Chart 6.1: Importance of getting involved with school in other ways............. 55
Chart 6.2: Frequency that parents get involved with other activities.............. 57
Chart 7.1: Ways of communicating about child’s progress in class ................ 63
Chart 7.2: Most useful way of finding out about child’s progress in school.... 66
Chart 7.3: Usefulness of parents’ evenings and informal discussions –
trend data................................................................................... 67
Chart 7.4: Communication methods that schools should use more ................ 68
Chart 7.5: How often parents would ideally like to see how their child is
doing .......................................................................................... 69
Chart 7.6: How often parents receive formal reports...................................... 70
Chart 7.7: Reasons why a secure website would be appealing or not
appealing.................................................................................... 72
Chart 7.8: Attitudes to communication with school: information ................... 75
Chart 7.9: Attitudes to communication with school: relationship and
support....................................................................................... 76
Chart 7.10: Attitudes to communication with school: involvement and
contact ....................................................................................... 77
Chart 7.11: Attitudes to communication with school, trend data (positive
responses).................................................................................. 78
Chart 7.12: Preferred method of communication ........................................... 79
Chart 7.13: How parents found out about School Profiles............................... 83
Chart 7.14: What is good about School Profiles .............................................. 85
Chart 7.15: How School Profile could be improved ......................................... 86
Chart 7.16: Respondents’ views on School Profiles ........................................ 88
Chart 8.1: Awareness of initiatives and Practices .......................................... 89
Chart 8.2: Awareness of initiatives and practices – trend data ...................... 90
15
1 Introduction
1.1 Background
The benefits of parental involvement in a child’s education have long been
recognised. Parents play a crucial role in influencing the aspirations and
achievements of their children.
“Research suggests that parenting appears to be the most important factor
associated with educational achievement at age 10, which in turn is strongly
associated with achievement in later life. Parental involvement in education
seems to be a more important influence than poverty, school environment
and the influence of peers”.
(Every Child Matters, 2003)
Additionally, Desforges (2003)3 has demonstrated a large body of evidence which
points to the link between a parent’s involvement in a child’s learning and a child’s
subsequent achievement.
The White Paper, ‘Excellence in Schools’, released in 1997 recognised the need for
pupils to get support from parents to ensure they reach their full potential. A
number of initiatives since this paper were introduced to encourage schools to
involve parents and to encourage parents to become more involved.
In 1999, and again in 2004, the Department for Education and Skills commissioned
a Computer-Assisted Telephone Interviewing (CATI) survey of parents of children
aged 5 to 16, which investigated the parents’ attitudes towards their children’s
education.
Following on from these earlier surveys, in June 2007 BMRB was commissioned by
the Department for Children, Schools and Families to carry out a telephone survey
of a nationally representative sample of parents of children aged 5 to 16 who
attended maintained schools in England. The primary objective of the 2007 survey
was to investigate the variety and extent of parents’ involvement in their children’s
schooling (including, where possible, updating tracking data to build on the 2001
3 2003, Desforges, C with Abouchaar, A: The Impact of Parental Involvement,
Parental Support and Family Education on Pupil Achievements and Adjustment: A
Literature Review, Department for Education and Skills
16
and 2004 surveys); an additional aim was to examine the level of awareness
parents have of government initiatives in this field.
1.2 Research design
The survey used a random sample design and largely replicates the 2001 survey.
The sampling frame used was held by Survey Sampling International (SSI), an
organisation dedicated to the provision of survey samples. Random digit dial (RDD)
sampling (developed by SSI) was used to provide a nationally representative
sample of the residential population in England, with both listed and unlisted phone
numbers represented, drawn from all eligible exchange codes. The sample design
differs slightly from 2004 when the survey was conducted as a quota survey.
1.2.1 Sample population
The sample definition was parents or carers of children aged between 5 and 16 who
attend a maintained school in England.4 The sample population for the 2007 survey
differs from 2001 and 2004 in the following ways:
• In 2007, it was decided to include non-resident parents in the sample (i.e.
parents or carers of children who do not actually live in their household, but
who said they have contact with the child discussed in the interview at least
once a month). Non-resident parents were not included in either the 2001 or
2004 surveys.
• In 2007 and 2001, the survey included lone-parents.5 In 2004, however,
interviews were only conducted with parents or carers who lived in a two-
parent household.
A comparison of the sample populations in the 2001, 2004 and 2007 surveys is
provided in Table 1.1.
4 References to “parents” throughout the report should be taken to include all
parents and carers.
5 As well as lone parent households, the 2001 and 2007 surveys also included a
small number of households containing more than two parents.

17
Table 1.1: Sample populations in 2001, 2004 and 2007 surveys
Sample population 2001 2004 2007
Parents of children aged 5 to 16 who attend a maintained school in England (comprising):
• Two-parent households
• Lone parent households X
• Non-resident parents X X
Minority ethnic group booster sample X X
Throughout the report, where observations have been made between the different
surveys, it should be noted that this ‘trend data’ is based only on two-parent
households (for the purposes of comparability).
1.2.2 Establishing eligibility and child selection
Once a household had been contacted, the interviewer had to determine whether
anyone in the household was eligible or not; this was done by asking a series of
screening questions.
The first question identified whether the respondent was a parent or carer of a child
between the age of 5 and 16. Respondents were then asked whether anyone else in
the household met the necessary criteria. If there was more than one eligible
parent in the household, the CATI programme randomly selected one of the parents
to take part in the interview.
Once an eligible parent had been selected to take part, they were then asked how
many children in the household were between the ages of 5 and 16 and attending a
maintained school. If there was more than one eligible child, the parent was asked
to give the age of each child and then the CATI programme randomly selected a
‘reference child’; the interviewer subsequently prompted the parent to answer
questions in relation to the selected child throughout the rest of the interview.6
6 Parents usually find it easier to talk about one child rather than their children
‘generally’; this approach helps them focus their responses rather than attempt to
generalise about all their children. It is also allows analysis of the data to be
undertaken by certain variables specific to the selected child, e.g. their school year,
whether the child has a disability, etc.
18
1.3 Questionnaire design and pilot survey
The questionnaire used for the survey had seven discrete sections:
A. Introduction and screener
B. Child selection
C. Child’s details
D. Attitudes towards education
E. Level of involvement
F. Communications with school
G. Demographics
A continuing research objective for the survey in 2007 was to examine awareness
of current government initiatives in relation to parents and their children’s
education (see Section 1.1). Incorporating new questions to meet this objective
into the existing questionnaire would have potentially resulted in an overly long and
burdensome interview for respondents. It was therefore decided to devise two
different versions: questionnaire A and questionnaire B. Both questionnaires had
the same structure (as outlined above) and the content was also largely similar.
However, questionnaire B contained some additional questions on current
government initiatives (which were not included in questionnaire A), whilst
questionnaire A included some further questions in Sections D-F (which were not
included in questionnaire B).
It was decided that approximately 80% of respondents would receive questionnaire
A and approximately 20% would receive questionnaire B; eligible parents were
randomly allocated to either questionnaire A or B in these proportions by the CATI
programme. This would achieve a very high base size for the core of questions
(mainly ‘all respondents’, about 5000, or in some cases about 4000) to enable
robust and detailed analysis, while also providing a sufficient base size for the more
topical questions included in questionnaire B. This utilises the total sample size
more effectively by only asking a limited proportion of the total sample certain
topical questions that do not require the full robust sample size. Throughout the
report ‘all respondents’ has been used when a question was included in both
questionnaires. here a question was asked in only one of the questionnaires (A or
B), this is clearly stated in the relevant text or chart/table.
A pilot survey was conducted to test aspects of the questionnaire including the
initial contact stage (i.e. the introduction and screening), the interview length (of
19
questionnaire A and B) and the actual questions themselves (especially the
questions being used for the first time on this survey).
Fifty interviews were conducted during the pilot stage. Around half of these
interviews included additional ‘cognitive questions’ specifically to test parents’
understanding of some of the new questions being introduced for the first time in
this survey. Revisions to the questions were made on the basis of the pilot findings.
A copy of both versions of the questionnaire (A and B) can be found in the
Technical Appendix.
1.4 Analysis and weighting
Once interviews had been conducted, data was collated and open-ended responses
were coded. All code frames were approved before use. Tabulations of the data and
an SPSS dataset were produced and checked. Further details on analysis are
provided in the Technical Appendix.
A two stage weighting approach was carried out:
• design weights were applied to reflect the differential probability of selection
for eligible parents in different size households;
• differential response weighting - once the design weights had been applied,
the data was further interrogated for evidence of non-response bias using
data from the Labour Force Survey. The characteristics compared were
gender, ethnicity, age, household type and working status. A weight was
then derived to correct for any differences.
The percentages reported throughout the report are based on weighted data.
1.5 Structure of report
The report is split into the following discrete chapters:
• Chapter 2 provides details of the sample profile and household
characteristics.
• Chapter 3 looks at respondents’ overall involvement in their children’s
education, as well as how responsible they feel for their child’s education.
• Chapter 4 examines attitudes to educational responsibility.
• Chapter 5 explores the level of involvement parents have in their child’s
homework and other activities.
• Chapter 6 discusses involvement with the school.
20
• Chapter 7 looks at communication with the school.
• Chapter 8 focuses on awareness of current initiatives.
• Chapters 9, 10 and 11 are summary chapters which discuss, respectively,
children with Special Educational Needs, comparisons between the 2001,
2004 and 2007 surveys over time, and implications for policy and further
research.
The report also includes a Technical Appendix containing: questionnaire A,
questionnaire B and final fieldwork figures.
1.6 Explanatory notes
1.6.1 Interpreting the survey findings
When interpreting the findings for this survey, it should be borne in mind that the
survey is based on a large sample (but not the total population of parents of 5-16
year olds). This means that all findings are subject to small sampling tolerances. In
the report, differences are reported only when they are statistically significant at
the 95 per cent confidence level (and if the differences were considered relevant
and/or interesting to the topic being discussed). Further, where differences by two
(or more) variables are potentially correlated (e.g. gender and working status of
parent), basic multivariate analysis has been undertaken to determine which, if
any, are the key drivers.
1.6.2 Data tables
The report includes tables showing findings analysed by various characteristics (e.g.
child’s school year, social grade). In some cases the percentages do not always add
up to exactly to 100 for each column and this is normally due to rounding of
individual percentages to the nearest whole number. It may also be because
multiple responses are possible in some cases. The following symbols have been
used throughout:
* Less than 0.5 per cent
- No observations
21
2 Child and household characteristics
2.1 Household composition
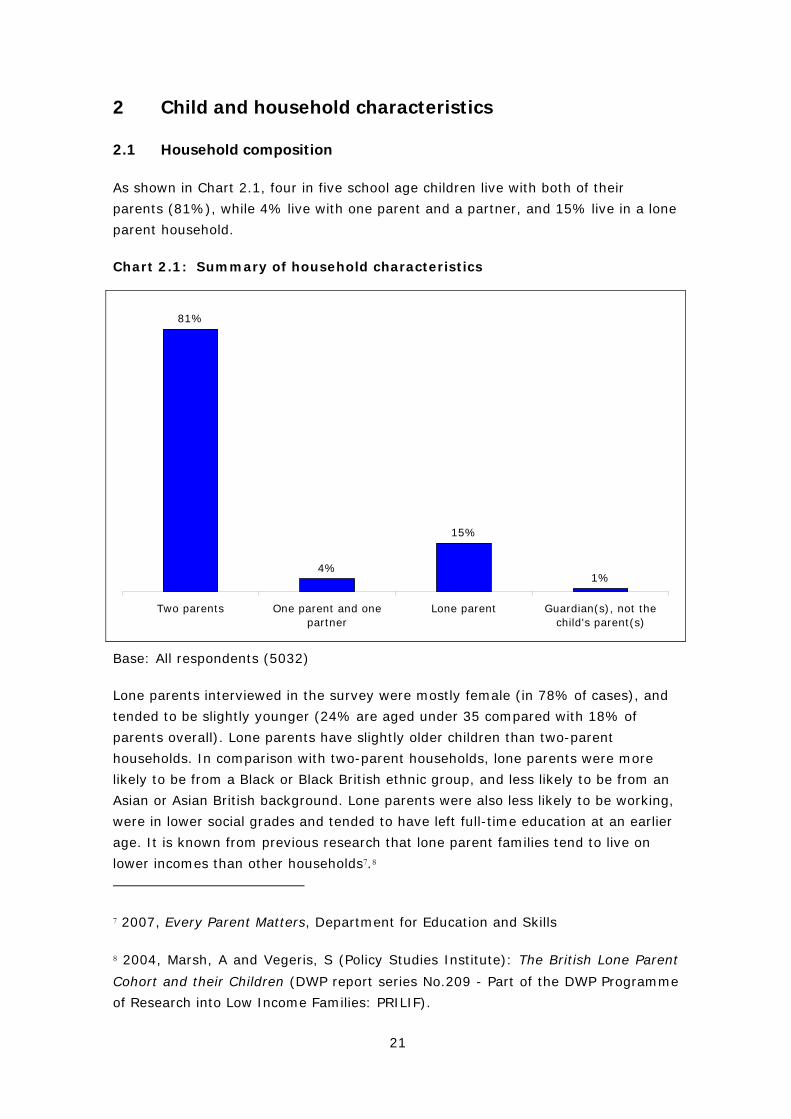
As shown in Chart 2.1, four in five school age children live with both of their
parents (81%), while 4% live with one parent and a partner, and 15% live in a lone
parent household.
Chart 2.1: Summary of household characteristics
81%
4%
15%
1%
Two parents One parent and onepartner
Lone parent Guardian(s), not thechild's parent(s)
Base: All respondents (5032)
Lone parents interviewed in the survey were mostly female (in 78% of cases), and
tended to be slightly younger (24% are aged under 35 compared with 18% of
parents overall). Lone parents have slightly older children than two-parent
households. In comparison with two-parent households, lone parents were more
likely to be from a Black or Black British ethnic group, and less likely to be from an
Asian or Asian British background. Lone parents were also less likely to be working,
were in lower social grades and tended to have left full-time education at an earlier
age. It is known from previous research that lone parent families tend to live on
lower incomes than other households7.8
7 2007, Every Parent Matters, Department for Education and Skills
8 2004, Marsh, A and Vegeris, S (Policy Studies Institute): The British Lone Parent
Cohort and their Children (DWP report series No.209 - Part of the DWP Programme
of Research into Low Income Families: PRILIF).
22
Three per cent of respondents in the survey were non-resident parents. These
respondents were predominantly male (in 85% of cases). As with men who lived
with their children, they were likely to be in full-time work (in 67% of cases), but
tended to have left full-time education earlier than other parents (53% had left
school by the age of 16 compared with 42% of other parents).
2.2 Respondent age
One half (52%) of respondents were aged between 35 and 44, a quarter (27%)
were aged between 45 and 54, while one in six (17%) were aged between 25 and
34. Respondents aged 55 or over accounted for 3% of the sample and those aged
under 25 comprised 1%.
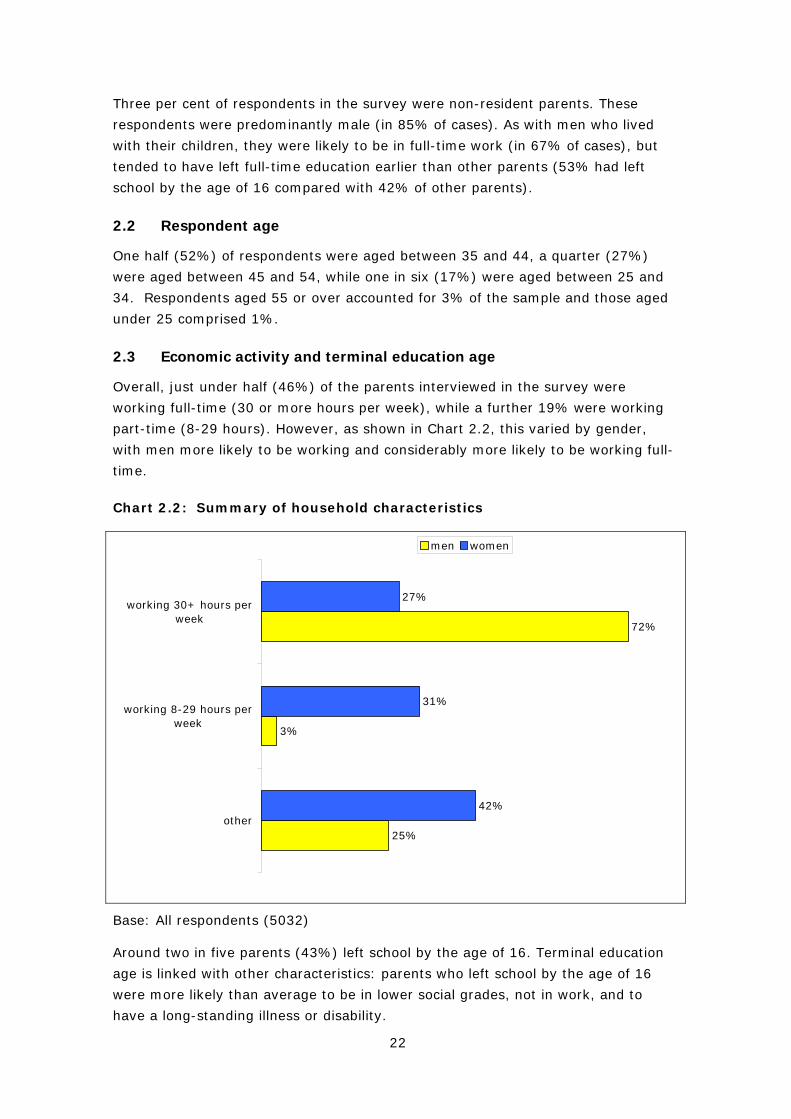
2.3 Economic activity and terminal education age
Overall, just under half (46%) of the parents interviewed in the survey were
working full-time (30 or more hours per week), while a further 19% were working
part-time (8-29 hours). However, as shown in Chart 2.2, this varied by gender,
with men more likely to be working and considerably more likely to be working full-
time.
Chart 2.2: Summary of household characteristics
25%
3%
72%
42%
31%
27%
other
working 8-29 hours perweek
working 30+ hours perweek
men women
Base: All respondents (5032) Around two in five parents (43%) left school by the age of 16. Terminal education
age is linked with other characteristics: parents who left school by the age of 16
were more likely than average to be in lower social grades, not in work, and to
have a long-standing illness or disability.

23
2.4 Social grade
Table 2.1 shows a breakdown of respondents by social grade.
Table 2.1 Respondent’s social grade
Social grade % of respondents
A 8
B 21
C1 30
C2 21
D 10
E 7
Base: All respondents (5032)
A comparison with the previous surveys in the series shows that respondents are
broadly broken down into social grade in similar proportions to those in 2001. In
2004 there were fewer respondents in the AB grades, while there were more
respondents in the other social grade categories.
Table 2.2 Social grade comparison between surveys
2001 2004 2007
AB 33 17 32
C1 27 35 30
C2 25 28 22
DE 14 19 13
Base: All respondents from 2 parent households (2001 = 1513, 2004 = 2021, 2007
= 4277)
24
2.5 Marital Status
The majority (82%) of respondents were married or living as married. Eight per
cent of respondents were single while a further 5% were divorced and 3%
separated. One per cent of respondents widowed and a further 1% were in a civil
partnership.
2.6 Ethnicity
Eighty-six per cent of respondents described themselves as white and the majority
of these described themselves as White British (95%). Seven per cent of
respondents described themselves as Asian or Asian British of which 41% were
Indian and 31% were Pakistani. Three per cent of respondents were from a Black or
Black British background.
2.7 Disability and caring responsibilities
One in nine parents (11%) said they had a long-standing illness, disability or
infirmity. As with the public as a whole, older parents were more likely to have a
long-standing illness or disability (14% of those aged 45 or over), as were those
not working (16%) and in lower social grades. Lone parents were also more likely
than average to have a long-term illness or disability (18%).
One in seven respondents (14%) said that they provided care, help or support for
someone because of illness, disability, old age or infirmity. This is relevant, as
parents who have caring responsibilities may find it difficult to devote as much time
to their children’s education and school activities.
Caring responsibilities were more common amongst older parents (ranging from
12% of parents under 35 to 22% of those aged 55 or over) and women (16%
compared with 13% of men). They were also more common among parents who
were not working (20%) and in lower social grades. There was also a link between
caring responsibilities and respondents having a long-term illness or disability
themselves (24% of parents with a long-term illness or disability also had caring
responsibilities).
25
2.8 Language
Six per cent of parents said that English was not the first or main language of their
household. Younger respondents were more likely to say that this was the case
(11% of those aged under 35). Where English was not the main language of the
household, respondents were less likely to be working and tended to be in lower
social grades, despite having left full-time education at a later age. They were less
likely to be lone parent households.
In the London region, 21% of parents said English was not the main language
spoken in the household.
2.9 Internet access
Nine in ten parents (90%) said that they had access to the Internet at home, while
6% had no access at all (including at work, school or college).
Table 2.3 shows how access to the internet at home varies by sub-group. Access is
significantly lower amongst a number of disadvantaged groups; specifically, lone
parent households, households where English is not the main language and lower
social grades.

26
Table 2.3: Internet access at home by subgroups
% with internet
access at home
All 90
Child’s school year Years 1-2 89
Years 3-6 88
Years 7-9 91
Years 10-12 93
Respondent age Less than 35 84
35-44 92
45-54 91
55+ 83
Social grade AB 97
C1 93
C2 87
D 81
E 69
Respondent work status Working 30+ hours per week 93
Working 8-29 hours per week 90
Other 85
Lone parent household 79
Respondent illness or disability 85
Child has statement of SEN 85
English not main language in household 77
Base: All respondents (5032)
27
The proportion of households with internet access at home has risen from 69% in
2001, to 78% in 2004, to 92% in the current survey (based on two-parent
households only).
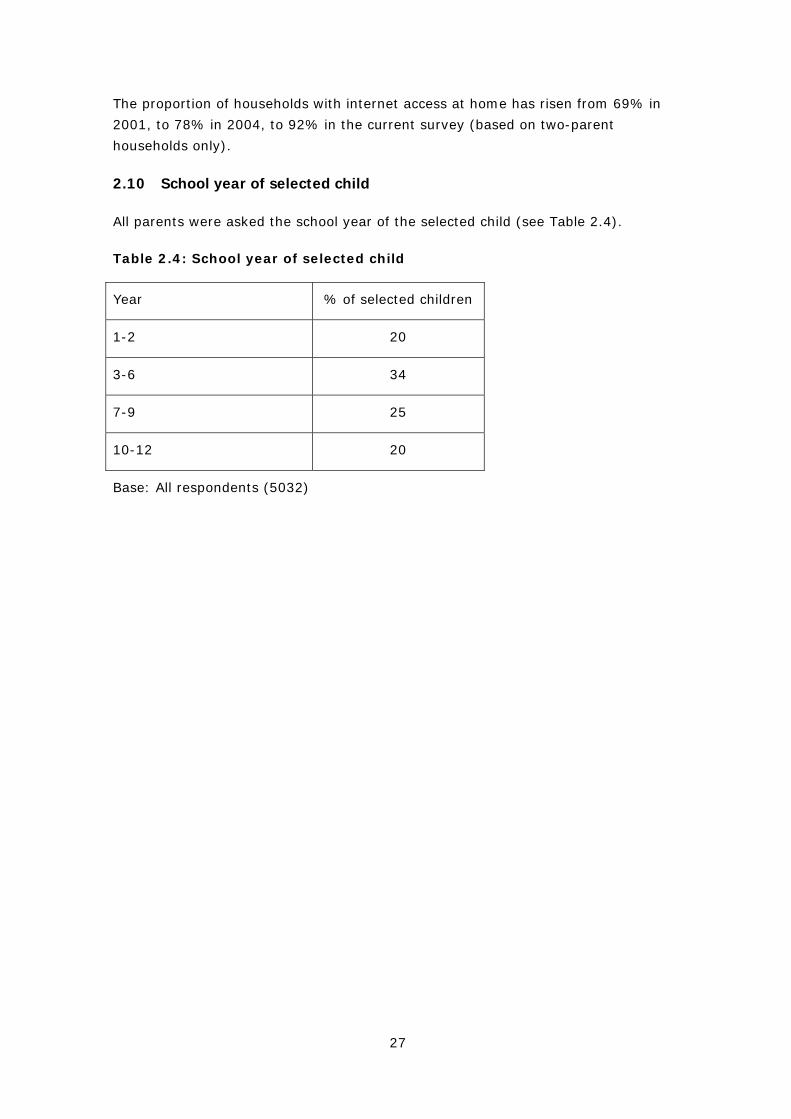
2.10 School year of selected child
All parents were asked the school year of the selected child (see Table 2.4).
Table 2.4: School year of selected child
Year % of selected children
1-2 20
3-6 34
7-9 25
10-12 20
Base: All respondents (5032)

28
2.11 Age of selected child
As shown in Chart 2.3, there is a fairly even dispersion of selected children across
the different ages in the eligible range (5-16).9
Chart 2.3: Age of selected child
8%
10%
9%
9%
8%
9%
8%
9%
8%
8%
9%
5%
5
6
7
8
9
10
11
12
13
14
15
16
Age
in y
ears
2.12 Gender of selected child
The proportions of selected children who were boys and girls were approximately
equal (53% boys and 47% girls).
2.13 Children with Special Educational Needs (SEN)
Table 2.5 shows the proportion of parents who said that their child:
• had a long-standing illness or disability
• had been identified as having Special Educational Needs (SEN)
• had a Statement of Special Educational Needs (SEN).
9 Note that as the age and school year of the selected child are clearly correlated,
the findings in this report have generally only been analysed by school year.

29
In each case, the proportion was higher amongst older children, boys, those in
lower social grades and in lone parent households. It was also higher where parents
had a long-term illness or disability.
Table 2.5: Disability and Special Educational Needs by subgroups
% with long-
term illness
or disability
%
with
SEN
% with
statement
of SEN
All 9 12 6
Child’s school year Years 1-2 7 8 3
Years 3-6 8 11 6
Years 7-9 11 14 8
Years 10-12 10 13 7
Child’s gender Male 11 15 9
Female 7 8 3
Social grade AB 7 9 4
C1 9 12 6
C2 9 10 5
D 10 13 8
E 19 22 15
Lone parent household 14 15 7
Respondent has an illness or disability 20 18 10
Base: All respondents (5032)
One in seven children who had been identified as having Special Educational Needs
attended a special rather than a mainstream school (14%), and this increased to
26% among children with a Statement of SEN.

30
2.14 Supplementary or Complementary School or Homework Club
One in five respondents (19%) said that their child attended a Supplementary or
Complementary School or Homework Club. This was slightly higher amongst older
children (ranging from 17% in years 1-2 to 23% in years 10-12) and was also
higher amongst children with a Statement of SEN (26%). Black or Black British
respondents were also more likely to say that their child attended a Supplementary
or Complementary School or Homework Club (35%), as were parents in the London
region (29%).
31
3 Overall involvement and responsibility
This chapter looks at parents’ perceptions of their involvement in their child’s school
life, whether they would like to be more involved and the barriers they have to
greater involvement.
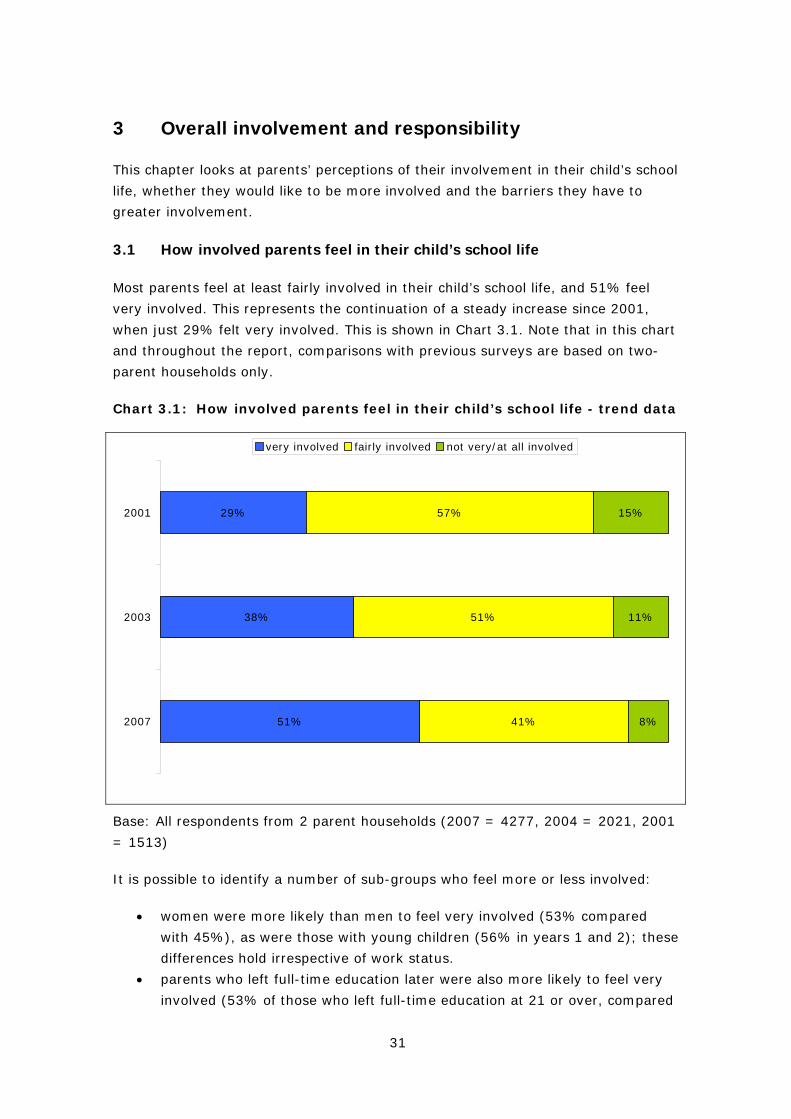
3.1 How involved parents feel in their child’s school life
Most parents feel at least fairly involved in their child’s school life, and 51% feel
very involved. This represents the continuation of a steady increase since 2001,
when just 29% felt very involved. This is shown in Chart 3.1. Note that in this chart
and throughout the report, comparisons with previous surveys are based on two-
parent households only.
Chart 3.1: How involved parents feel in their child’s school life - trend data
51%
38%
29%
41%
51%
57%
8%
11%
15%
2007
2003
2001
very involved fairly involved not very/at all involved
Base: All respondents from 2 parent households (2007 = 4277, 2004 = 2021, 2001
= 1513)
It is possible to identify a number of sub-groups who feel more or less involved:
• women were more likely than men to feel very involved (53% compared
with 45%), as were those with young children (56% in years 1 and 2); these
differences hold irrespective of work status.
• parents who left full-time education later were also more likely to feel very
involved (53% of those who left full-time education at 21 or over, compared
32
with 51% of those who left at 17-20 and 47% of those who left by the age
of 16)
• those from Black or Black British backgrounds were far more likely to feel
very involved (72%) than those from White (49%) and Asian or Asian British
(54%) backgrounds (irrespective of terminal education age).
• Parents of a child with a Statement of SEN (63%) were also more likely to
feel very involved
• Lone parents (46%) were less likely to feel very involved, and the figure for
non-resident parents was much lower (34%, with 27% feeling not very or at
all involved).
There were no differences according to whether the parent had a long-term illness
or disability or caring responsibility, and this remains the case throughout the
report in relation to both involvement and attitudes.
Respondents’ answers are linked to their actual level of involvement (covered in the
next chapters), particularly their involvement in school activities. However, those
with less actual involvement often still felt involved (37% of parents who were not
involved in any school activities and who never or only occasionally helped their
child with homework still said they felt very involved in their child’s school life). It is
also noticeable that while parents feel more involved than they did in previous
years, their actual level of involvement in school activities and in homework has
remained similar. What has increased in this year’s survey is the level of parental
involvement in out-of-school activities (eg reading, cooking and making things with
the child and playing sport). It is this participation in wider activities that may
account for the stronger feeling of involvement. It is also possible that parents are
taking a greater interest in their child’s education, even if this has not translated
into greater day-to-day involvement.
3.1.1 Types of parents most likely to be involved
Logistic regression was carried out on the parent’s perception of involvement in the
child’s education. This analysis looked at parents who said they are ‘very involved’
in their child’s education. This technique controls for other factors in the data and
indicates how much more or less likely a parent is to say they are very involved in
their child’s education depending on the answers they give to other questions.10
10 Logistic regression was carried out using SPSS. It looks at the main effects of variables, whilst controlling for other factors within the data. The technique attempts to identify variables that contribute to explaining as much of the variance as possible for involvement in education, as well as indicating how much more or less likely a parent is to say they are very involved if they give a particular answer. Further details are provided in the Technical Appendix
33
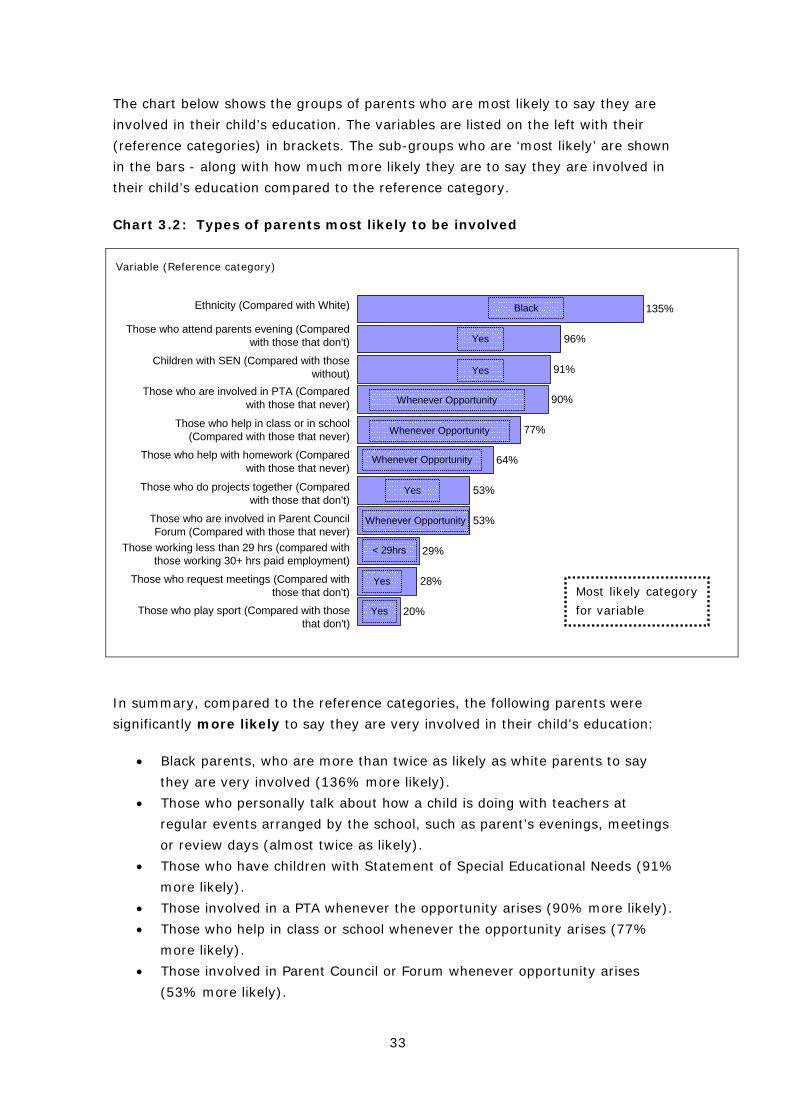
The chart below shows the groups of parents who are most likely to say they are
involved in their child’s education. The variables are listed on the left with their
(reference categories) in brackets. The sub-groups who are ‘most likely’ are shown
in the bars - along with how much more likely they are to say they are involved in
their child’s education compared to the reference category.
Chart 3.2: Types of parents most likely to be involved
20%
28%
29%
53%
53%
64%
77%
90%
91%
96%
135%Black
Yes
Yes
Whenever Opportunity
Whenever Opportunity
Whenever Opportunity
Yes
Whenever Opportunity
< 29hrs
Yes
Yes
Ethnicity (Compared with White)
Those who attend parents evening (Comparedwith those that don't)
Children with SEN (Compared with thosewithout)
Those who are involved in PTA (Comparedwith those that never)
Those who help in class or in school(Compared with those that never)
Those who help with homework (Comparedwith those that never)
Those who do projects together (Comparedwith those that don't)
Those who are involved in Parent CouncilForum (Compared with those that never)
Those working less than 29 hrs (compared withthose working 30+ hrs paid employment)
Those who request meetings (Compared withthose that don't)
Those who play sport (Compared with thosethat don't)
In summary, compared to the reference categories, the following parents were
significantly more likely to say they are very involved in their child’s education:
• Black parents, who are more than twice as likely as white parents to say
they are very involved (136% more likely).
• Those who personally talk about how a child is doing with teachers at
regular events arranged by the school, such as parent’s evenings, meetings
or review days (almost twice as likely).
• Those who have children with Statement of Special Educational Needs (91%
more likely).
• Those involved in a PTA whenever the opportunity arises (90% more likely).
• Those who help in class or school whenever the opportunity arises (77%
more likely).
• Those involved in Parent Council or Forum whenever opportunity arises
(53% more likely).
Variable (Reference category)
Most likely category
for variable
34
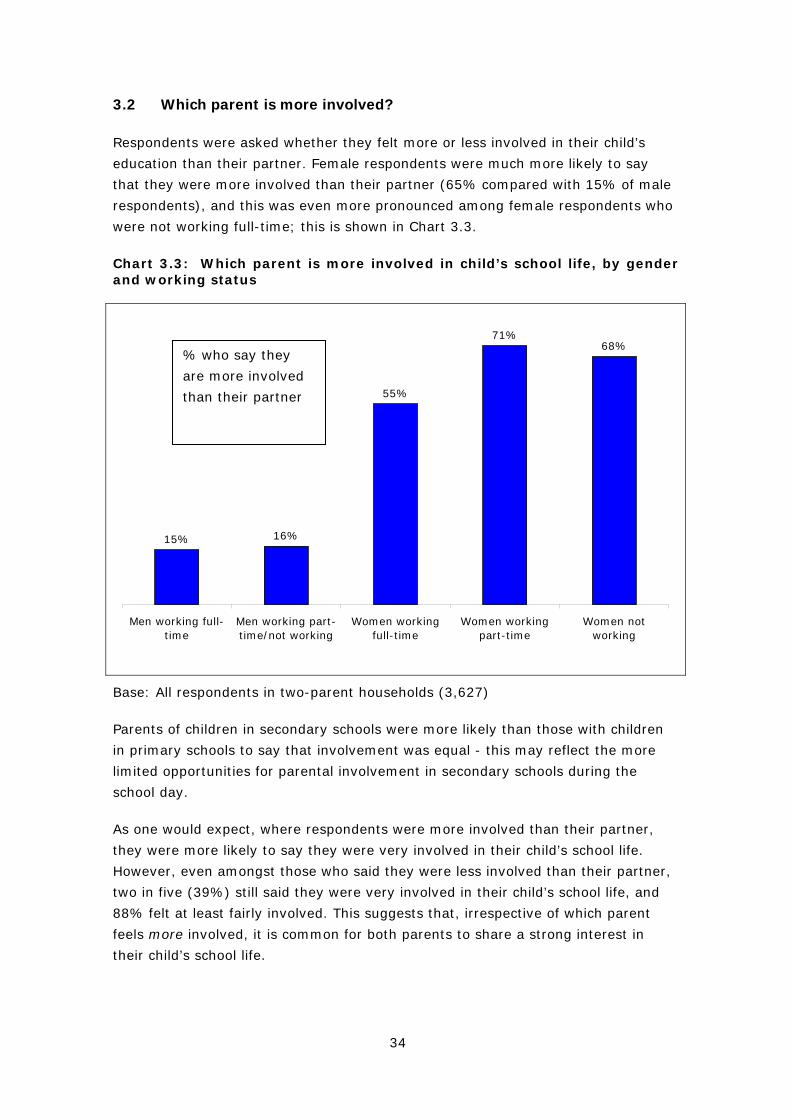
3.2 Which parent is more involved?
Respondents were asked whether they felt more or less involved in their child’s
education than their partner. Female respondents were much more likely to say
that they were more involved than their partner (65% compared with 15% of male
respondents), and this was even more pronounced among female respondents who
were not working full-time; this is shown in Chart 3.3.
Chart 3.3: Which parent is more involved in child’s school life, by gender and working status
15% 16%
55%
71%68%
Men working full-time
Men working part-time/not working
Women workingfull-time
Women workingpart-time
Women notworking
Base: All respondents in two-parent households (3,627)
Parents of children in secondary schools were more likely than those with children
in primary schools to say that involvement was equal - this may reflect the more
limited opportunities for parental involvement in secondary schools during the
school day.
As one would expect, where respondents were more involved than their partner,
they were more likely to say they were very involved in their child’s school life.
However, even amongst those who said they were less involved than their partner,
two in five (39%) still said they were very involved in their child’s school life, and
88% felt at least fairly involved. This suggests that, irrespective of which parent
feels more involved, it is common for both parents to share a strong interest in
their child’s school life.
% who say they
are more involved
than their partner

35
3.3 Parents’ confidence in their own involvement
Almost all parents (94%) agreed that if the school told them that their child was
not making good progress, they would be confident that their involvement could
help. Overall, 62% agreed strongly with this statement, and this was higher
amongst parents of children at primary schools than at secondary schools (65%
and 57% respectively). More generally, answers reflected how involved parents felt
they were in their child’s school life overall.
3.4 Getting more involved
Two in three parents (66%) agreed that they would like to be more involved in
their child’s school life, while 31% disagreed. A comparison with 2001 (when the
question was last asked) shows that parents were more likely to want greater
involvement in 2001 than in the current survey (as shown in Chart 3.4). However,
these findings reflect that parents felt they were actually less involved in 2001 than
in the current survey, as noted above, and therefore had greater scope to do more.
This is confirmed by analysis of the 2007 findings, which shows that those who said
they were less involved with their child’s school life, or who said the other parent
was more involved, were more likely to say they wanted to do more.

36
Chart 3.4: Whether parents agree that they would like to be more involved in their child’s school life
35%
33%
30%
39%
21%
20%
10%
7%
4%
2%
2007
2001
definitely agree tend to agree tend to disagree definitely disagree don't know
Base: All respondents answering questionnaire A (4056)
To some extent, sub-group variations follow the general pattern described above:
those groups who felt less involved in their child’s school life were those who
wanted to be more involved. This applied particularly to men (69% agreed), non-
resident parents (81%) and those who left full-time education at an earlier age
(68% of those who left school by the age of 16).
Other sub-group differences, however, are not related to this pattern (i.e. there
were also some groups of parents who, despite already feeling they were very
involved, desired even greater involvement). In particular, those in non-White
ethnic groups and those whose first language is not English were more likely than
other parents to want to be more involved (and the difference by language still
holds when analysing within ethnic group). The same applied to parents in lower
social grades and those not in work, as well as respondents with a long-term illness
or disability and those with a child who had a Statement of SEN. The desire to be
more involved was also stronger amongst parents of younger children. These
details are shown in Table 3.1.

37
Table 3.1: Whether parents want to be more involved, by sub-groups
% agree % disagree
All 66 31
Child’s school year Years 1-2 71 26
Years 3-6 67 29
Years 7-9 65 32
Years 10-12 59 37
Social grade A 51 44
B 58 37
C1 66 30
C2 70 28
D 75 23
E 74 23
Ethnic background White 63 33
Black or Black British 84 12
Asian or Asian British 82 17
other 85 12
Main language English 64 32
Not English 85 14
Child with Statement of SEN 73 19
Respondent illness or disability 74 22
Base: All respondents answering questionnaire A (4056)
38
3.5 Barriers to greater involvement
When asked whether anything stops them from getting more involved in their
child’s school life, parents were most likely to mention work commitments (44%).
The only other reasons given by more than a handful of respondents were the
demands of other children or childcare issues (7%) and lack of time generally
(6%). These findings are very similar to those obtained in previous years of the
survey.
The proportion mentioning work commitments ranged from 64% amongst those
working full–time, to 41% of those working part-time, to 17% of those not working
(or working less than 8 hours per week); the last figure is presumably a reflection
of working patterns generally (even if they were not currently in a job) or of the
restrictions caused by their partner being in work. Amongst women who were not
working, 20% gave childcare issues or the demands of other children as a reason.
Overall, one in four (24%) said that they had no specific barriers, and this tended
to be higher amongst the groups who said that they wanted to be more involved in
their child’s school life: parents from Black/Black British or Asian/Asian British
backgrounds (35% and 40% respectively) and those whose main language is not
English (39%). It was also higher among those with a child who has a Statement of
SEN (33%).

39
4 Attitudes to parental responsibility
In this chapter, we consider parents’ views on the balance of responsibility for
children’s education between themselves and the school, and also examine their
views on their child’s school attendance: how important they think it is to make
sure their child attends regularly and on time, and what their views are on taking
children out of school during term time.
4.1 Relative responsibility of schools and parents
Respondents were asked whether they thought, in general, that a child’s education
was wholly or mainly the responsibility of the parent or the school. Similar
proportions felt it was the parent’s responsibility as the school’s (28% and 26%
respectively).
As shown in Chart 4.1, this represents a shift in attitudes over time, with a greater
proportion saying it is the parent’s responsibility in the current survey than in 2004
and 2001.
Chart 4.1: Relative responsibility for a child’s education - trend data
28%
19%
20%
45%
50%
38%
26%
31%
43%
2007
2003
2001
wholly/mainly parent both equally wholly/mainly school
Base: All respondents (5032)
Findings were very consistent across different sub-groups, with the exception of
ethnic background: respondents from non-White backgrounds were least likely to
say that a child’s education is the school’s responsibility rather than the parent’s
(even when controlling for terminal education age). This is shown in chart 4.2.

40
Chart 4.2: Relative responsibility for a child’s education by ethnic
background
33%
29%
30%
27%
46%
54%
53%
45%
21%
17%
17%
27%
Other
Asian or Asian British
Black or Black British
White
Wholly/mainly parent Both equally Wholly/mainly school
Base: All respondents (5032)
Respondents who said that a child’s education was wholly or mainly the school’s
responsibility were still likely to feel at least fairly involved in their child’s school life
(88%). This indicates that even where parents feel it is mainly the school’s
responsibility, this does not necessarily denote a reluctance to be involved.
As might be expected, parents who felt that it is mainly or wholly the parents who
are responsible for their child’s education were more likely than those who felt it
was the school’s responsibility to feel very involved in their child’s education (52%
compared with 40%).
4.2 Making sure child attends school
Nearly all parents (96%) felt that it was extremely important to make sure that
their child attended school regularly and on time, exactly the same proportion
measured in 2001 and 2004.
While very high amongst all groups, the proportion who said it was extremely
important was slightly lower amongst men (94%), in particular men who were not
in work (93%). It was also slightly lower amongst parents from Asian or Asian
British backgrounds (93%) compared with parents from Black or Black British
backgrounds (98%).
41
4.2.1 Taking children out of school during term time
The issue of children being absent from school, for example for term-time holidays,
was highlighted in the Government’s “Every Parent Matters” publication, which
supported school and local authorities who decline approval of such absence 11.
Parents were divided on the issue of whether they would be happy to take their
child out of school during term time (for example to go on a family holiday or
extended family break): 48% said they would be happy to do this, but 42% said
they wouldn’t and 10% said it would depend. These findings are very similar to
those obtained in the 2001 and 2004 surveys (49% and 46% said they would
respectively).
Men were more likely than women to say they would be happy to take their child
out of school during term time (52% compared with 44%), with women working
full-time the most reluctant to do this (41% said they would be happy). Parents
with younger children were also more prepared to take them out of school, as
shown in Table 4.2. This table also shows that parents from non-White ethnic
backgrounds would be less happy to take their children out of school, as were those
who left full-time education at an older age.
11 2007, Every Parent Matters, Department for Education and Skills
42
Table 4.1: Whether parents are happy to take their child out of school during term time by subgroups
% yes
All 48
Child’s school year Years 1-2 54
Years 3-6 52
Years 7-9 47
Years 10-12 35
Terminal education age 16 or under 51
17-20 47
21 or over 45
Ethnic background White 50
Black or Black British 27
Asian or Asian British 30
Other 38
Base: All respondents answering questionnaire A (4056)
Parents’ attitudes on this issue were not affected by their level of involvement (i.e.
greater involvement did not appear to make parents more reluctant to take their
child out of school).
43
5 Involvement with child’s education
This chapter examines the level of involvement that parents have with their child’s
homework, as well as other educational and recreational activities. It also looks at
parents’ views on the importance of this type of involvement.
5.1 The importance of helping with homework
Parents were asked to rate how important it was that they help their child with
homework on a five-point scale where 1 meant ‘not at all important’ and five meant
‘extremely important’. Nearly three-quarters (73%) of respondents said it was
extremely important to help their child with homework.
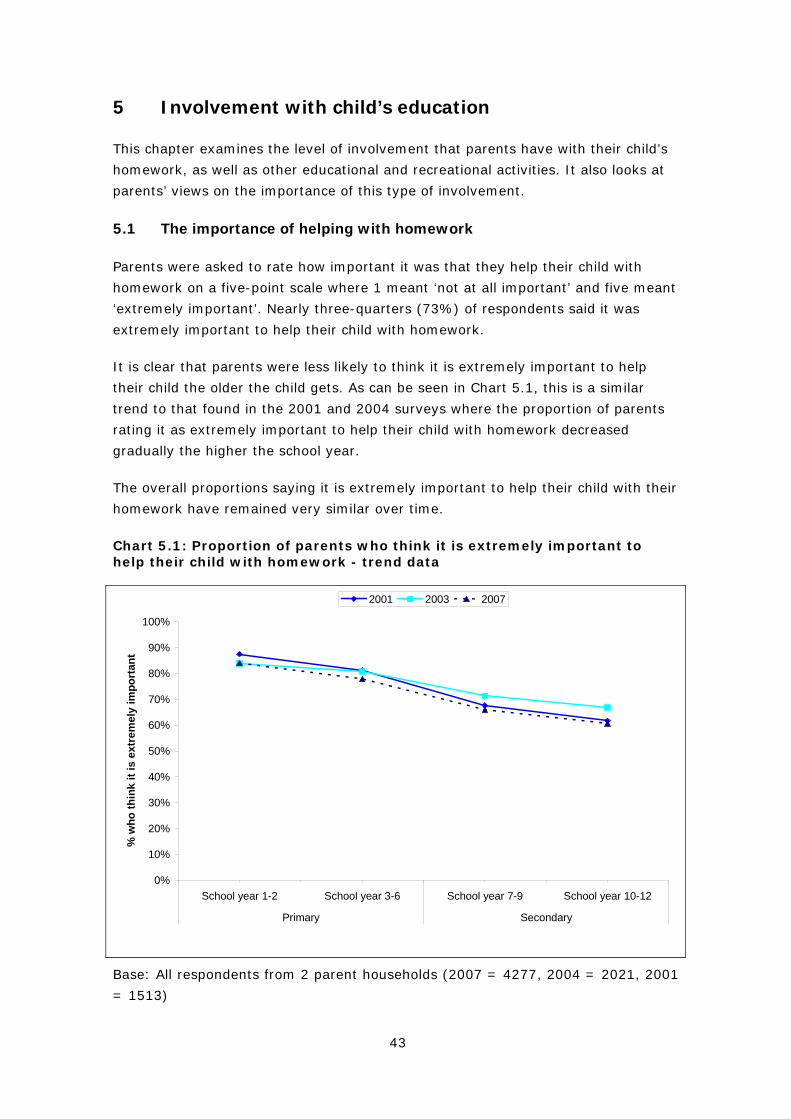
It is clear that parents were less likely to think it is extremely important to help
their child the older the child gets. As can be seen in Chart 5.1, this is a similar
trend to that found in the 2001 and 2004 surveys where the proportion of parents
rating it as extremely important to help their child with homework decreased
gradually the higher the school year.
The overall proportions saying it is extremely important to help their child with their
homework have remained very similar over time.
Chart 5.1: Proportion of parents who think it is extremely important to help their child with homework - trend data
0%
10%
20%
30%
40%
50%
60%
70%
80%
90%
100%
School year 1-2 School year 3-6 School year 7-9 School year 10-12
Primary Secondary
% w
ho th
ink
it is
ext
rem
ely
impo
rtan
t
2001 2003 2007
Base: All respondents from 2 parent households (2007 = 4277, 2004 = 2021, 2001
= 1513)
44
Table 5.1 shows that as well as the difference noted above by school year, women
were more likely than men to say it is extremely important to help their child with
homework (and this is particularly high amongst women not working full-time),
while perceived importance was also higher in the C2DE social grades.
Black or Black British (84%) and Asian or Asian British (82%) respondents were
more likely than White respondents (72%) to feel it is extremely important to help
their child with homework. Respondents who left education at an earlier age were
more likely than those that stayed in education beyond the age of 21 to think it
extremely important to help their child with homework.
Table 5.1: Proportion of parents thinking it is extremely important to help their child with homework by subgroups
% thinking it is extremely important to help
their child with homework
All 73
Male 69 Respondent gender
Female 76
White 72
Black or Black
British
84
Ethnic background
Asian or Asian
British
82
16 or under 75
17-20 74
Terminal Education
age
21+ 68
AB 69
C1 73
C2 76
Social grade
DE 76
Base: All respondents (5032)
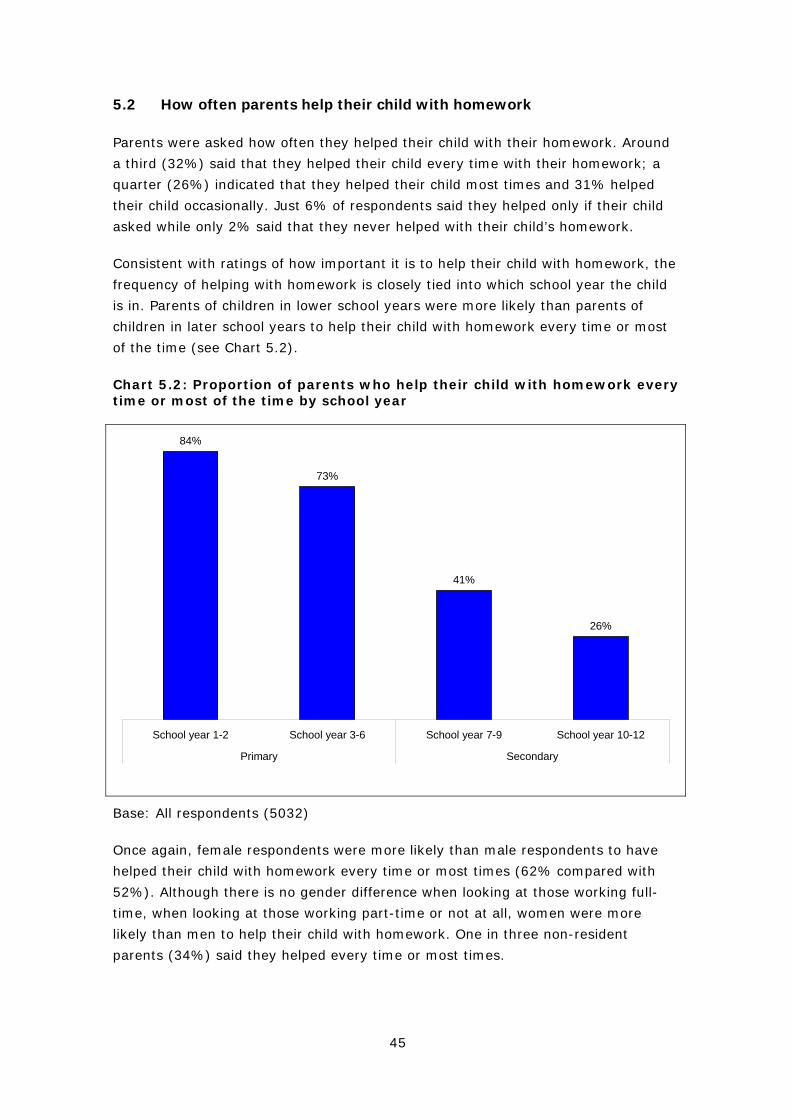
45
5.2 How often parents help their child with homework
Parents were asked how often they helped their child with their homework. Around
a third (32%) said that they helped their child every time with their homework; a
quarter (26%) indicated that they helped their child most times and 31% helped
their child occasionally. Just 6% of respondents said they helped only if their child
asked while only 2% said that they never helped with their child’s homework.
Consistent with ratings of how important it is to help their child with homework, the
frequency of helping with homework is closely tied into which school year the child
is in. Parents of children in lower school years were more likely than parents of
children in later school years to help their child with homework every time or most
of the time (see Chart 5.2).
Chart 5.2: Proportion of parents who help their child with homework every time or most of the time by school year
84%
73%
41%
26%
School year 1-2 School year 3-6 School year 7-9 School year 10-12
Primary Secondary
Base: All respondents (5032)
Once again, female respondents were more likely than male respondents to have
helped their child with homework every time or most times (62% compared with
52%). Although there is no gender difference when looking at those working full-
time, when looking at those working part-time or not at all, women were more
likely than men to help their child with homework. One in three non-resident
parents (34%) said they helped every time or most times.
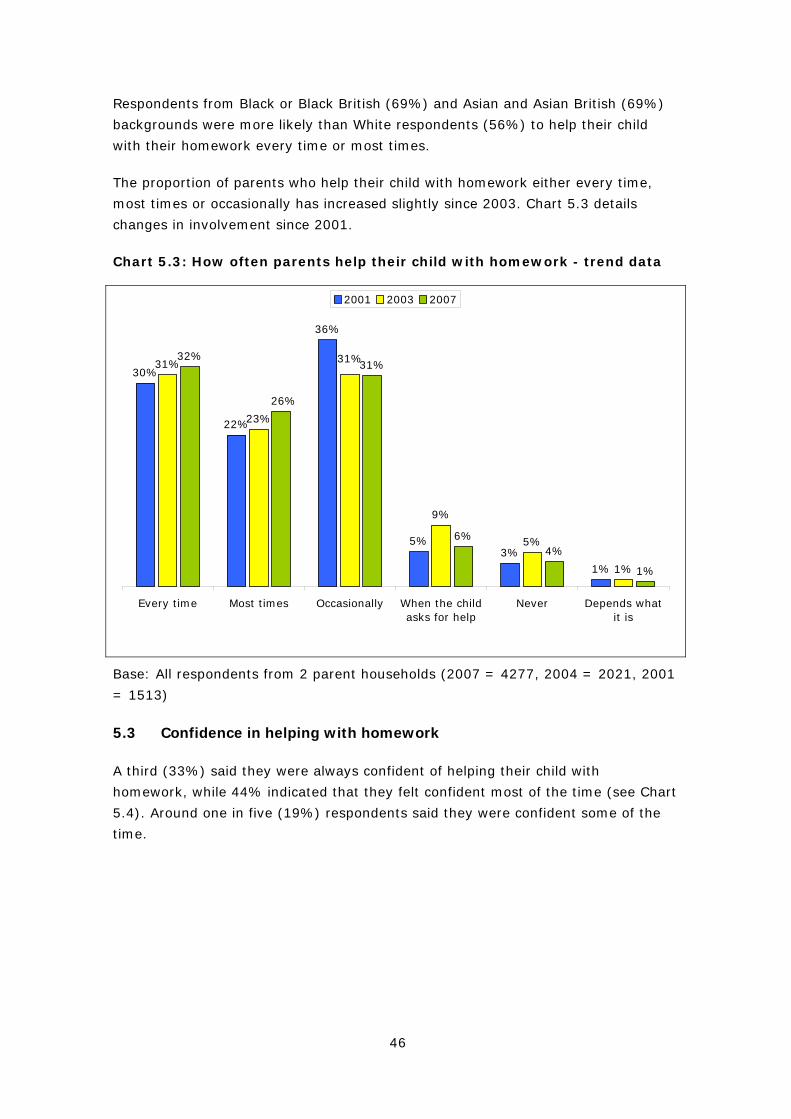
46
Respondents from Black or Black British (69%) and Asian and Asian British (69%)
backgrounds were more likely than White respondents (56%) to help their child
with their homework every time or most times.
The proportion of parents who help their child with homework either every time,
most times or occasionally has increased slightly since 2003. Chart 5.3 details
changes in involvement since 2001.
Chart 5.3: How often parents help their child with homework - trend data
30%
22%
36%
5%3%
1%
31%
23%
9%
5%
1%
32%31%
6%4%
1%
31%
26%
Every time Most times Occasionally When the childasks for help
Never Depends whatit is
2001 2003 2007
Base: All respondents from 2 parent households (2007 = 4277, 2004 = 2021, 2001
= 1513)
5.3 Confidence in helping with homework
A third (33%) said they were always confident of helping their child with
homework, while 44% indicated that they felt confident most of the time (see Chart
5.4). Around one in five (19%) respondents said they were confident some of the
time.

47
Chart 5.4: How confident parents feel helping their child with homework
33%
44%
19%
1% 1% 1%
Alwaysconfident
Confident mostof the time
Confident someof the time
Never confident Depends whatit is
Don't know
Base: All respondents (5032)
The proportion of parents in two parent households who always feel confident
helping their child with homework has decreased slightly over time, although the
main change took place between 2001 and 2004 (see Chart 5.5).

48
Chart 5.5: How confident parents feel helping their child with homework - trend data
41% 40%
16%
1% 2%
35%
42%
18%
2% 3%
35%
44%
18%
1% 1%
Always confident Confident most ofthe time
Confident some ofthe time
Never confident Depends what it is
2001 2003 2007
Base: All respondents from 2 parent households (2007 = 4277, 2004 = 2021, 2001
= 1513)
Parents of children in lower school years were more likely than parents of older
children to feel confident about helping their child with homework (see Chart 5.6).
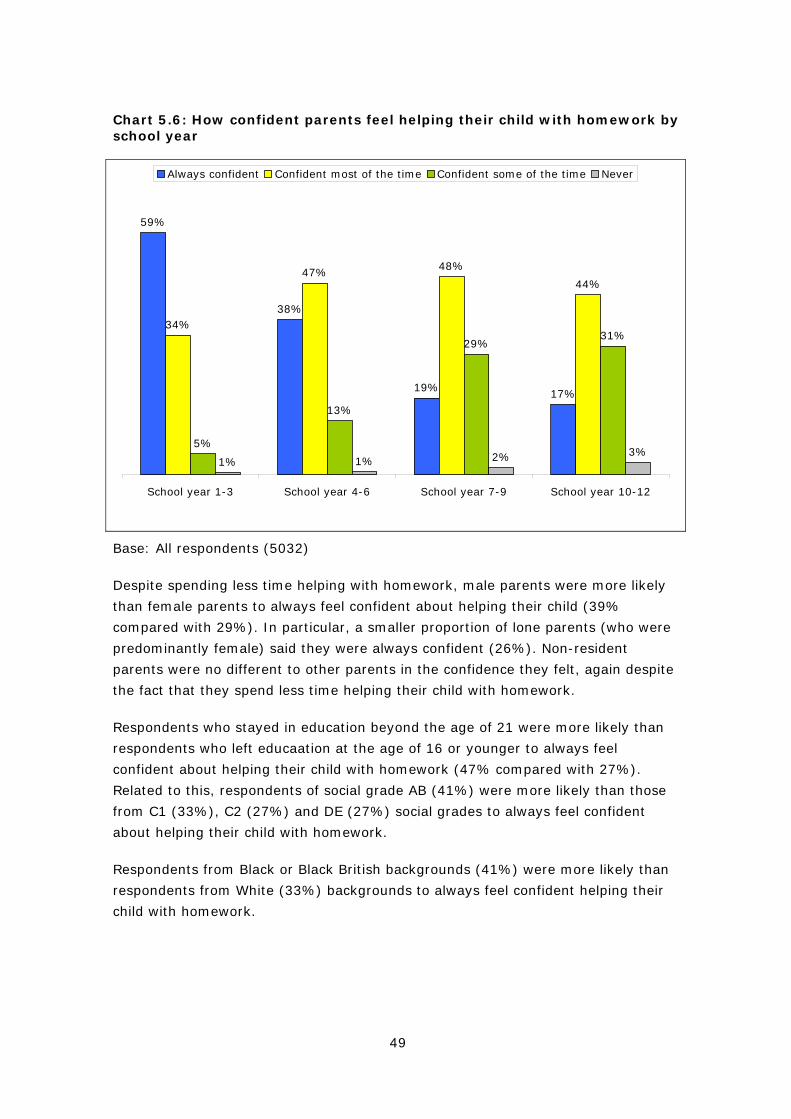
49
Chart 5.6: How confident parents feel helping their child with homework by school year
59%
38%
19% 17%
34%
47% 48%
44%
5%
13%
29%31%
1% 1% 2% 3%
School year 1-3 School year 4-6 School year 7-9 School year 10-12
Always confident Confident most of the time Confident some of the time Never
Base: All respondents (5032)
Despite spending less time helping with homework, male parents were more likely
than female parents to always feel confident about helping their child (39%
compared with 29%). In particular, a smaller proportion of lone parents (who were
predominantly female) said they were always confident (26%). Non-resident
parents were no different to other parents in the confidence they felt, again despite
the fact that they spend less time helping their child with homework.
Respondents who stayed in education beyond the age of 21 were more likely than
respondents who left educaation at the age of 16 or younger to always feel
confident about helping their child with homework (47% compared with 27%).
Related to this, respondents of social grade AB (41%) were more likely than those
from C1 (33%), C2 (27%) and DE (27%) social grades to always feel confident
about helping their child with homework.
Respondents from Black or Black British backgrounds (41%) were more likely than
respondents from White (33%) backgrounds to always feel confident helping their
child with homework.
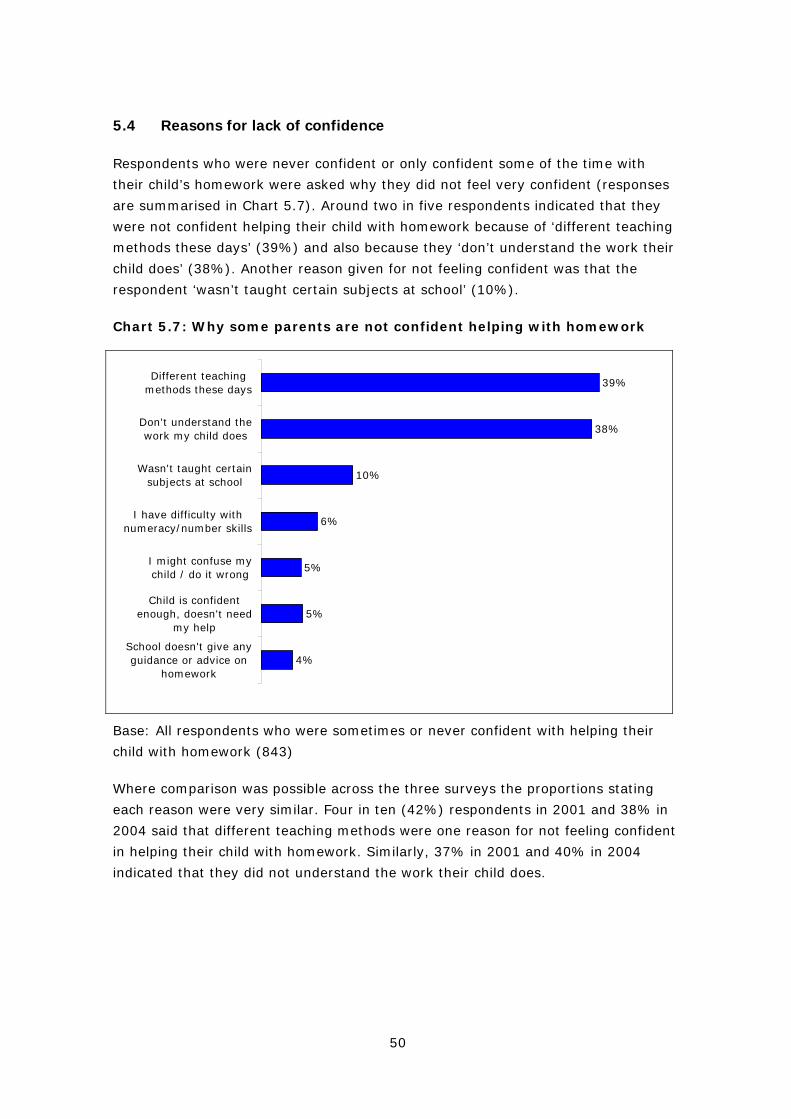
50
5.4 Reasons for lack of confidence
Respondents who were never confident or only confident some of the time with
their child’s homework were asked why they did not feel very confident (responses
are summarised in Chart 5.7). Around two in five respondents indicated that they
were not confident helping their child with homework because of ‘different teaching
methods these days’ (39%) and also because they ‘don’t understand the work their
child does’ (38%). Another reason given for not feeling confident was that the
respondent ‘wasn’t taught certain subjects at school’ (10%).
Chart 5.7: Why some parents are not confident helping with homework
39%
38%
10%
6%
5%
5%
4%
Different teachingmethods these days
Don't understand thework my child does
Wasn't taught certainsubjects at school
I have difficulty withnumeracy/number skills
I might confuse mychild / do it wrong
Child is confidentenough, doesn't need
my help
School doesn't give anyguidance or advice on
homework
Base: All respondents who were sometimes or never confident with helping their
child with homework (843)
Where comparison was possible across the three surveys the proportions stating
each reason were very similar. Four in ten (42%) respondents in 2001 and 38% in
2004 said that different teaching methods were one reason for not feeling confident
in helping their child with homework. Similarly, 37% in 2001 and 40% in 2004
indicated that they did not understand the work their child does.
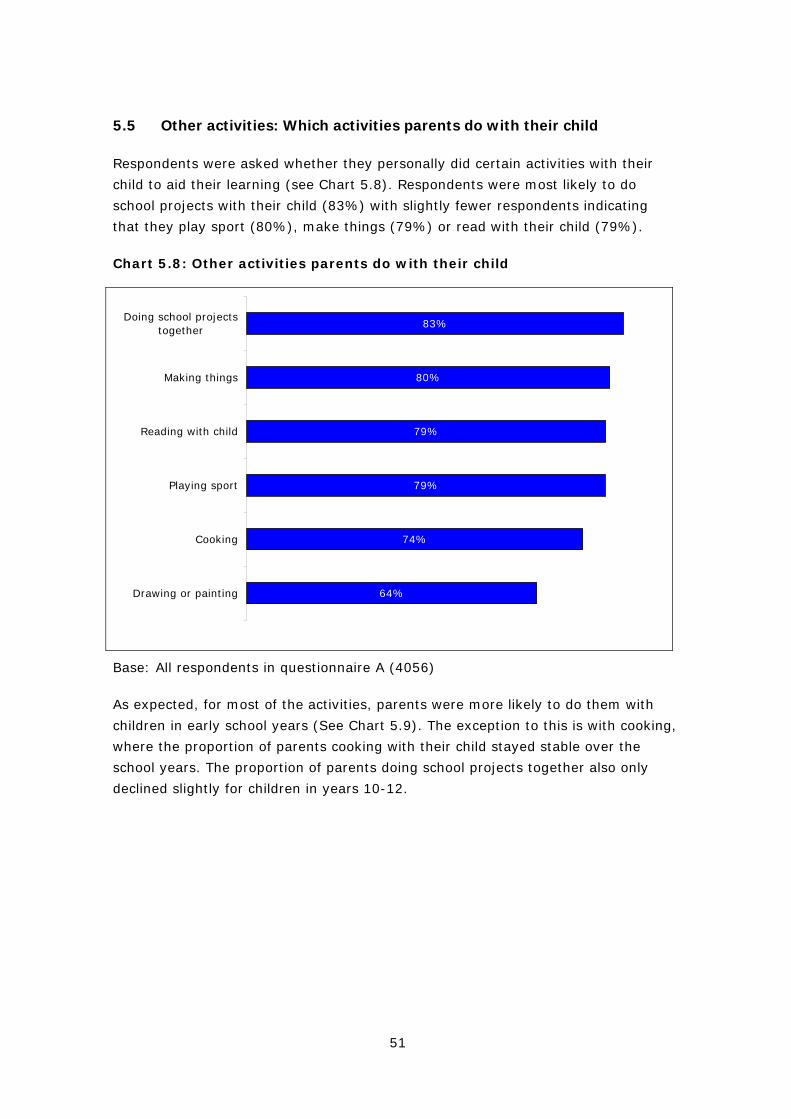
51
5.5 Other activities: Which activities parents do with their child
Respondents were asked whether they personally did certain activities with their
child to aid their learning (see Chart 5.8). Respondents were most likely to do
school projects with their child (83%) with slightly fewer respondents indicating
that they play sport (80%), make things (79%) or read with their child (79%).
Chart 5.8: Other activities parents do with their child
64%
74%
79%
79%
80%
83%
Drawing or painting
Cooking
Playing sport
Reading with child
Making things
Doing school projectstogether
Base: All respondents in questionnaire A (4056)
As expected, for most of the activities, parents were more likely to do them with
children in early school years (See Chart 5.9). The exception to this is with cooking,
where the proportion of parents cooking with their child stayed stable over the
school years. The proportion of parents doing school projects together also only
declined slightly for children in years 10-12.
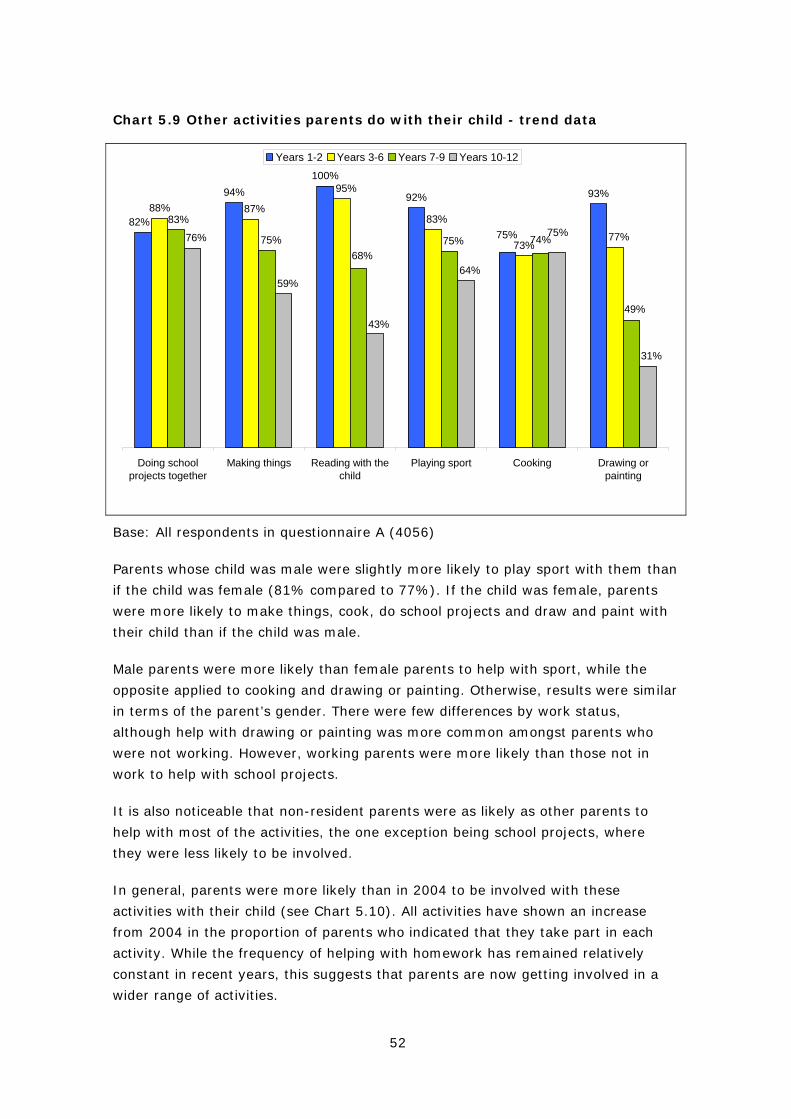
52
Chart 5.9 Other activities parents do with their child - trend data
94%100%
92% 93%88%
73%75%
82%77%
83%
95%
87%
49%
74%75%75%68%
83%
31%
75%
64%
43%
59%
76%
Doing schoolprojects together
Making things Reading with thechild
Playing sport Cooking Drawing orpainting
Years 1-2 Years 3-6 Years 7-9 Years 10-12
Base: All respondents in questionnaire A (4056)
Parents whose child was male were slightly more likely to play sport with them than
if the child was female (81% compared to 77%). If the child was female, parents
were more likely to make things, cook, do school projects and draw and paint with
their child than if the child was male.
Male parents were more likely than female parents to help with sport, while the
opposite applied to cooking and drawing or painting. Otherwise, results were similar
in terms of the parent’s gender. There were few differences by work status,
although help with drawing or painting was more common amongst parents who
were not working. However, working parents were more likely than those not in
work to help with school projects.
It is also noticeable that non-resident parents were as likely as other parents to
help with most of the activities, the one exception being school projects, where
they were less likely to be involved.
In general, parents were more likely than in 2004 to be involved with these
activities with their child (see Chart 5.10). All activities have shown an increase
from 2004 in the proportion of parents who indicated that they take part in each
activity. While the frequency of helping with homework has remained relatively
constant in recent years, this suggests that parents are now getting involved in a
wider range of activities.

53
Chart 5.10: Whether parents take part in other activities with their child - trend data
61%
67%
71%
70%
74%
79%
64%
73%
80%
79%
81%
83%
Drawing or painting
Cooking
Playing sport
Reading with child
Making things
Doing school projectstogether
2003 2007
Base: All respondents from 2 parent households (2007 = 4277, 2004 = 2021)
Parents were also asked about other activities they did with their child. One in six
(16%) said they take their child on outdoor activities or field trips, while 10% take
their child to sporting activities or classes, and 8% to museums or art galleries. As
with other activities, these were more common amongst parents of younger
children.
5.6 Importance of making sure children attend homework clubs
The chapter on child and household characteristics reported that 19% of children
attended a Supplementary or Complementary School or Homework Club.
Of these, 35% of parents said that it was extremely important that they attend
one. This is a decline from 2004 when 44% felt it was extremely important that
their child attended a supplementary homework club.
Chart 5.11 shows the proportion of parents whose child attends a supplementary
homework club who thought it extremely important that the child attends the club.
Attendance at a Supplementary or Complementary School or Homework Club
increases with the child’s age, and it is also clear that the older the child, the more
important parents felt it was for their child to attend the supplementary homework
club.
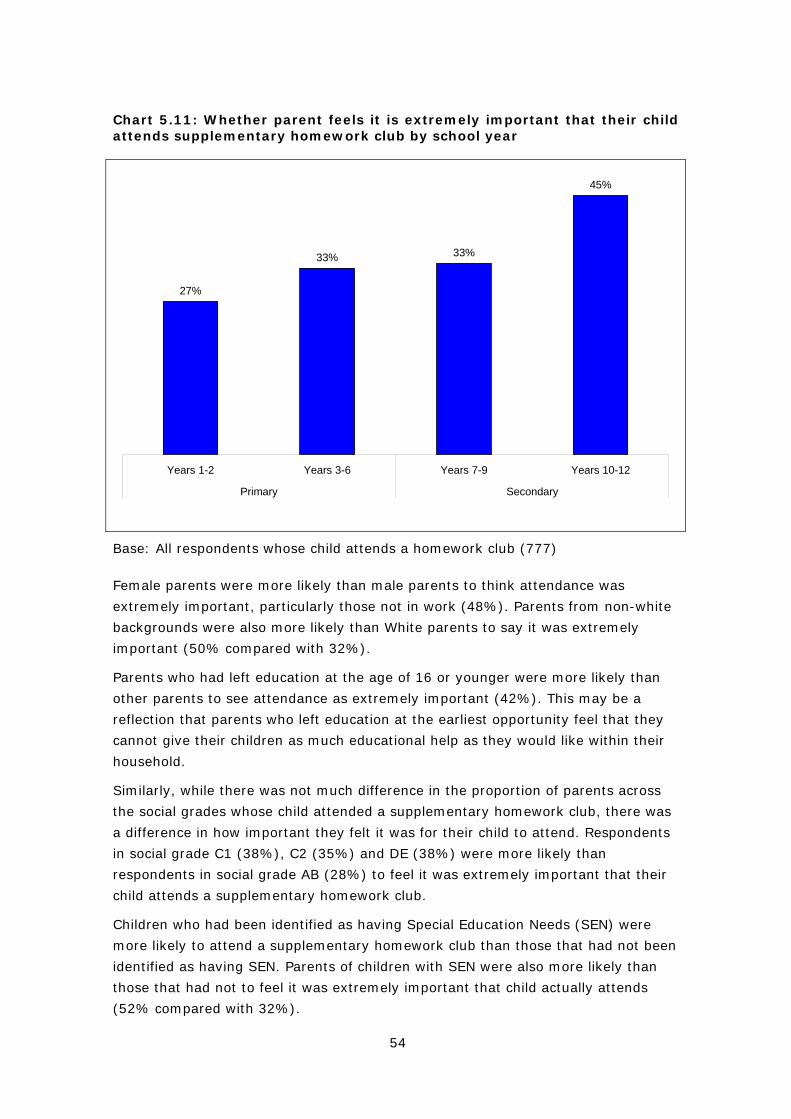
54
Chart 5.11: Whether parent feels it is extremely important that their child attends supplementary homework club by school year
27%
33% 33%
45%
Years 1-2 Years 3-6 Years 7-9 Years 10-12
Primary Secondary
Base: All respondents whose child attends a homework club (777)
Female parents were more likely than male parents to think attendance was
extremely important, particularly those not in work (48%). Parents from non-white
backgrounds were also more likely than White parents to say it was extremely
important (50% compared with 32%).
Parents who had left education at the age of 16 or younger were more likely than
other parents to see attendance as extremely important (42%). This may be a
reflection that parents who left education at the earliest opportunity feel that they
cannot give their children as much educational help as they would like within their
household.
Similarly, while there was not much difference in the proportion of parents across
the social grades whose child attended a supplementary homework club, there was
a difference in how important they felt it was for their child to attend. Respondents
in social grade C1 (38%), C2 (35%) and DE (38%) were more likely than
respondents in social grade AB (28%) to feel it was extremely important that their
child attends a supplementary homework club.
Children who had been identified as having Special Education Needs (SEN) were
more likely to attend a supplementary homework club than those that had not been
identified as having SEN. Parents of children with SEN were also more likely than
those that had not to feel it was extremely important that child actually attends
(52% compared with 32%).
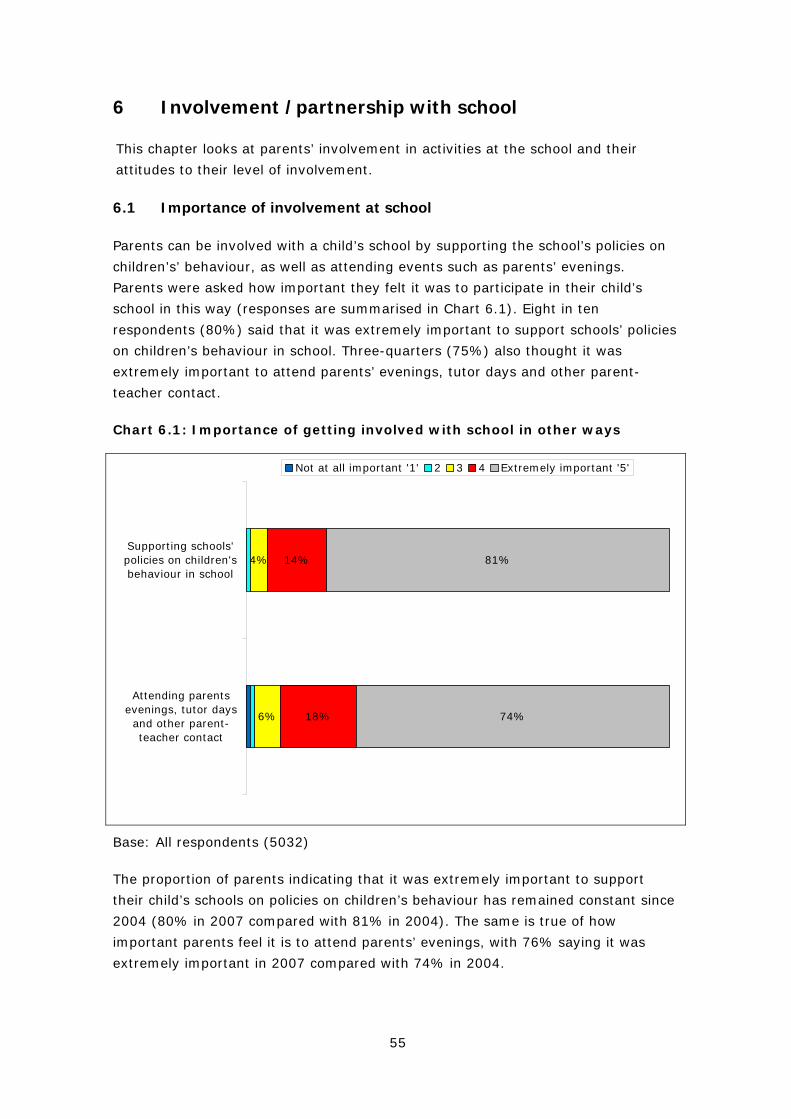
55
6 Involvement /partnership with school
This chapter looks at parents’ involvement in activities at the school and their
attitudes to their level of involvement.
6.1 Importance of involvement at school
Parents can be involved with a child’s school by supporting the school’s policies on
children’s’ behaviour, as well as attending events such as parents’ evenings.
Parents were asked how important they felt it was to participate in their child’s
school in this way (responses are summarised in Chart 6.1). Eight in ten
respondents (80%) said that it was extremely important to support schools’ policies
on children’s behaviour in school. Three-quarters (75%) also thought it was
extremely important to attend parents’ evenings, tutor days and other parent-
teacher contact.
Chart 6.1: Importance of getting involved with school in other ways
6%
4%
18%
14%
74%
81%
Attending parentsevenings, tutor daysand other parent-teacher contact
Supporting schools'policies on children'sbehaviour in school
Not at all important '1' 2 3 4 Extremely important '5'
Base: All respondents (5032)
The proportion of parents indicating that it was extremely important to support
their child’s schools on policies on children’s behaviour has remained constant since
2004 (80% in 2007 compared with 81% in 2004). The same is true of how
important parents feel it is to attend parents’ evenings, with 76% saying it was
extremely important in 2007 compared with 74% in 2004.
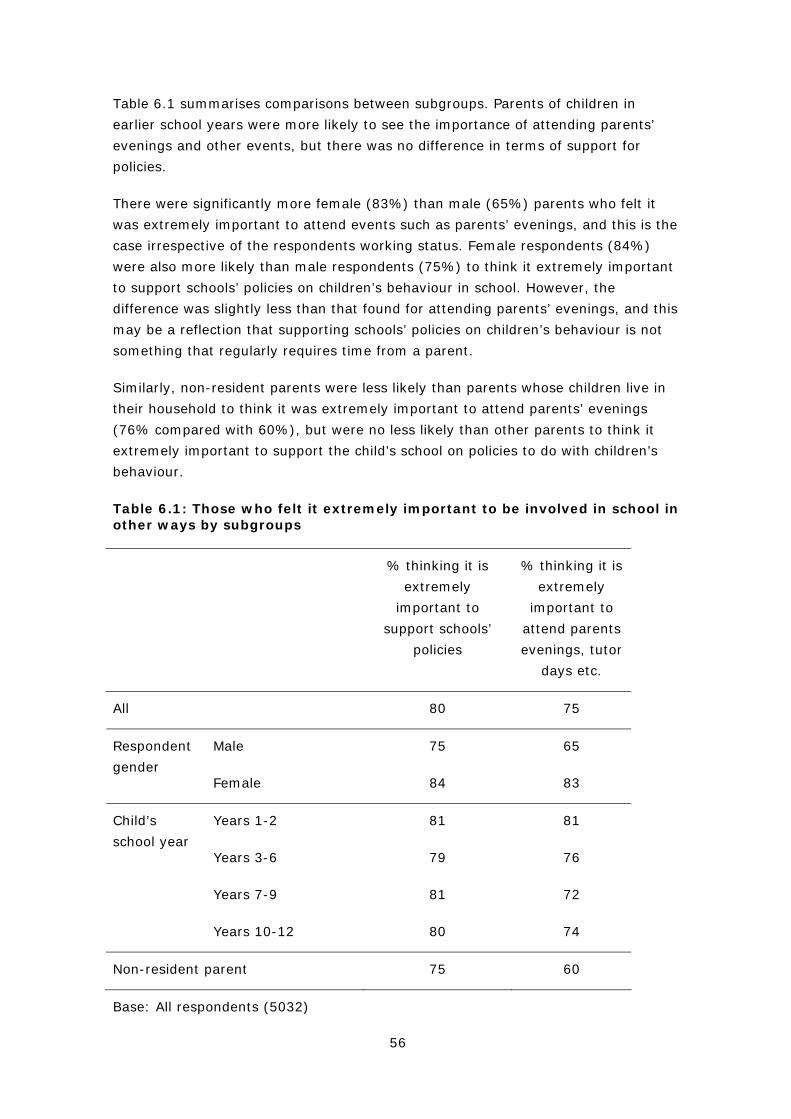
56
Table 6.1 summarises comparisons between subgroups. Parents of children in
earlier school years were more likely to see the importance of attending parents’
evenings and other events, but there was no difference in terms of support for
policies.
There were significantly more female (83%) than male (65%) parents who felt it
was extremely important to attend events such as parents’ evenings, and this is the
case irrespective of the respondents working status. Female respondents (84%)
were also more likely than male respondents (75%) to think it extremely important
to support schools’ policies on children’s behaviour in school. However, the
difference was slightly less than that found for attending parents’ evenings, and this
may be a reflection that supporting schools’ policies on children’s behaviour is not
something that regularly requires time from a parent.
Similarly, non-resident parents were less likely than parents whose children live in
their household to think it was extremely important to attend parents’ evenings
(76% compared with 60%), but were no less likely than other parents to think it
extremely important to support the child’s school on policies to do with children’s
behaviour.
Table 6.1: Those who felt it extremely important to be involved in school in other ways by subgroups
% thinking it is
extremely
important to
support schools’
policies
% thinking it is
extremely
important to
attend parents
evenings, tutor
days etc.
All 80 75
Male 75 65 Respondent
gender Female 84 83
Years 1-2 81 81
Years 3-6 79 76
Years 7-9 81 72
Child’s
school year
Years 10-12 80 74
Non-resident parent 75 60
Base: All respondents (5032)
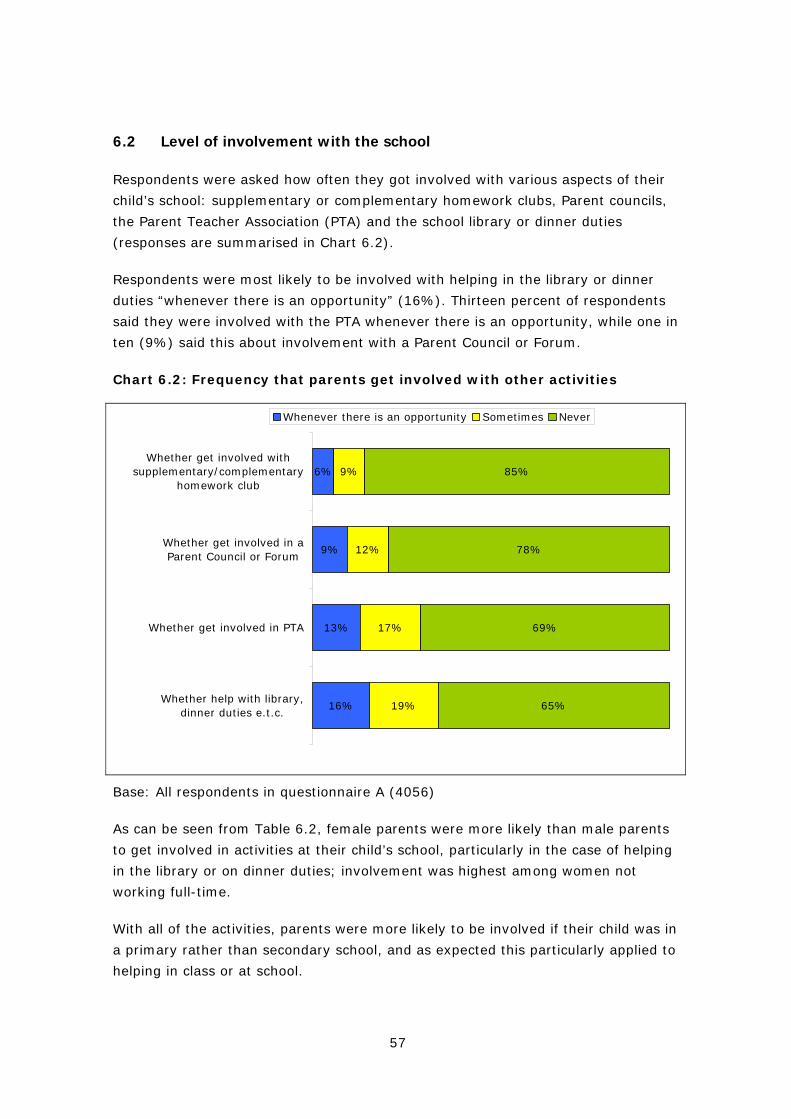
57
6.2 Level of involvement with the school
Respondents were asked how often they got involved with various aspects of their
child’s school: supplementary or complementary homework clubs, Parent councils,
the Parent Teacher Association (PTA) and the school library or dinner duties
(responses are summarised in Chart 6.2).
Respondents were most likely to be involved with helping in the library or dinner
duties “whenever there is an opportunity” (16%). Thirteen percent of respondents
said they were involved with the PTA whenever there is an opportunity, while one in
ten (9%) said this about involvement with a Parent Council or Forum.
Chart 6.2: Frequency that parents get involved with other activities
6%
9%
13%
16%
9%
12%
17%
19%
85%
78%
69%
65%
Whether get involved withsupplementary/complementary
homework club
Whether get involved in aParent Council or Forum
Whether get involved in PTA
Whether help with library,dinner duties e.t.c.
Whenever there is an opportunity Sometimes Never
Base: All respondents in questionnaire A (4056)
As can be seen from Table 6.2, female parents were more likely than male parents
to get involved in activities at their child’s school, particularly in the case of helping
in the library or on dinner duties; involvement was highest among women not
working full-time.
With all of the activities, parents were more likely to be involved if their child was in
a primary rather than secondary school, and as expected this particularly applied to
helping in class or at school.

58
Respondents who finished education at 16 or younger were less likely than those
who continued with education to help out in class, help out in the PTA or in a Parent
Council or Forum; the difference was most pronounced in relation to the PTA.
Respondents from Asian or Asian British or Black or Black British backgrounds were
more likely than White respondents to be involved in all of the activities, and
involvement was also higher in the London region than elsewhere.
Non-resident parents were less likely to take part in the various activities, with the
exception of homework clubs (where there was no difference). Lone parents were
less likely to be involved in the PTA, but otherwise had a similar level of
involvement to those in two-parent households.
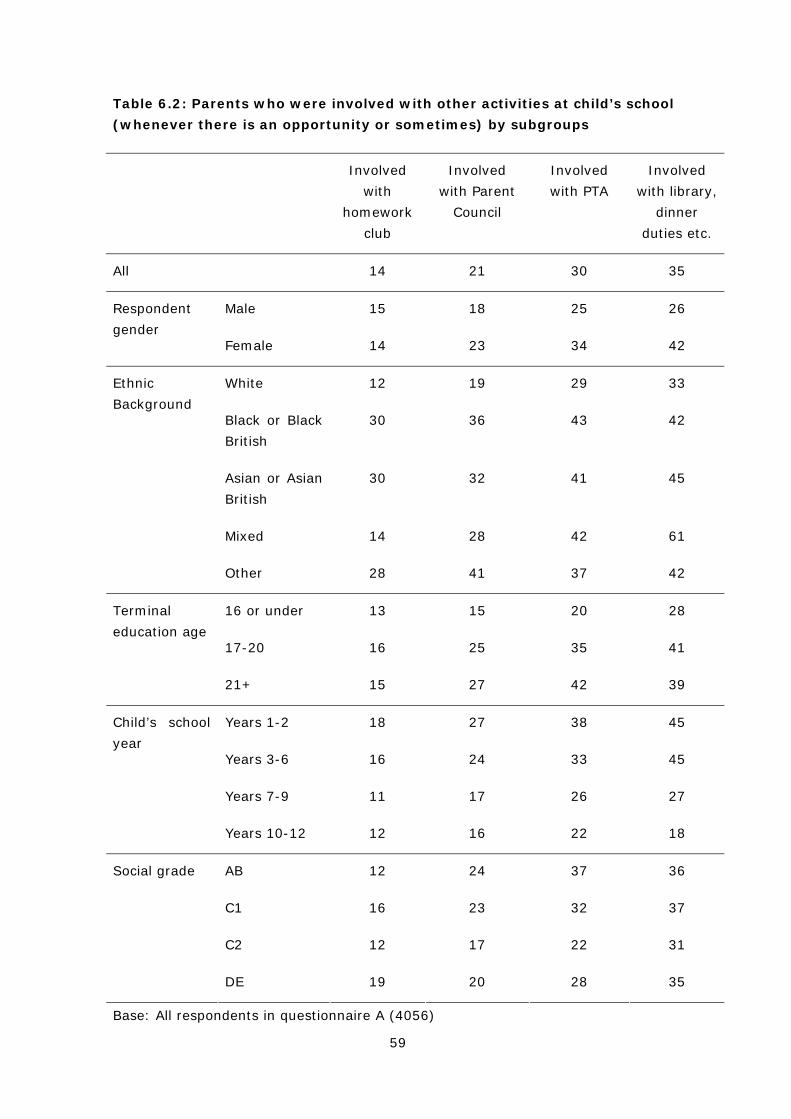
59
Table 6.2: Parents who were involved with other activities at child’s school
(whenever there is an opportunity or sometimes) by subgroups
Involved
with
homework
club
Involved
with Parent
Council
Involved
with PTA
Involved
with library,
dinner
duties etc.
All 14 21 30 35
Male 15 18 25 26 Respondent
gender Female 14 23 34 42
White 12 19 29 33
Black or Black
British
30 36 43 42
Asian or Asian
British
30 32 41 45
Mixed 14 28 42 61
Ethnic
Background
Other 28 41 37 42
16 or under 13 15 20 28
17-20 16 25 35 41
Terminal
education age
21+ 15 27 42 39
Years 1-2 18 27 38 45
Years 3-6 16 24 33 45
Years 7-9 11 17 26 27
Child’s school
year
Years 10-12 12 16 22 18
AB 12 24 37 36
C1 16 23 32 37
C2 12 17 22 31
Social grade
DE 19 20 28 35
Base: All respondents in questionnaire A (4056)

60
Overall around half of parents (53%) said that they took part in at least one of
these four activities. Summarising the sub-group differences, involvement was
higher amongst women and parents of children at primary school. It was also
higher amongst parents from non-white ethnic backgrounds. In these respects,
patterns of involvement were the same as for helping with homework. However,
participation in school activities was also higher amongst parents who left full-time
education at an older age, something that did not apply to help with homework or
other help with children.
The items covered in this year’s questionnaire differ from previous surveys, and this
makes it difficult to make direct comparisons. However, it is clear that the level of
involvement is similar to that in previous years, with very similar figures for
involvement in the PTA and helping out in class or in school.
6.2.1 Impact of actual involvement with the school on perceived desire to get more involved
In Section 3.4 we examined the extent to which parents agreed that they would like
to be more involved in their child’s school life. There were some differences
apparent when looking at the level of desire for greater involvement analysed by
the activities in which parents say they are sometimes or often involved. Table 6.3
shows that parents who get involved in a homework club were more likely to feel
that they would like to be more involved in their child’s school life than those who
never get involved
Further, parents who get involved with a parent forum or council whenever there is
an opportunity were more likely than those who never get involved to feel they
would like to be more involved in their child’s school life.
However, the findings for desired greater involvement did not vary by how often
parents said they were involved in a PTA or helped with dinner duties, in the library,
etc.
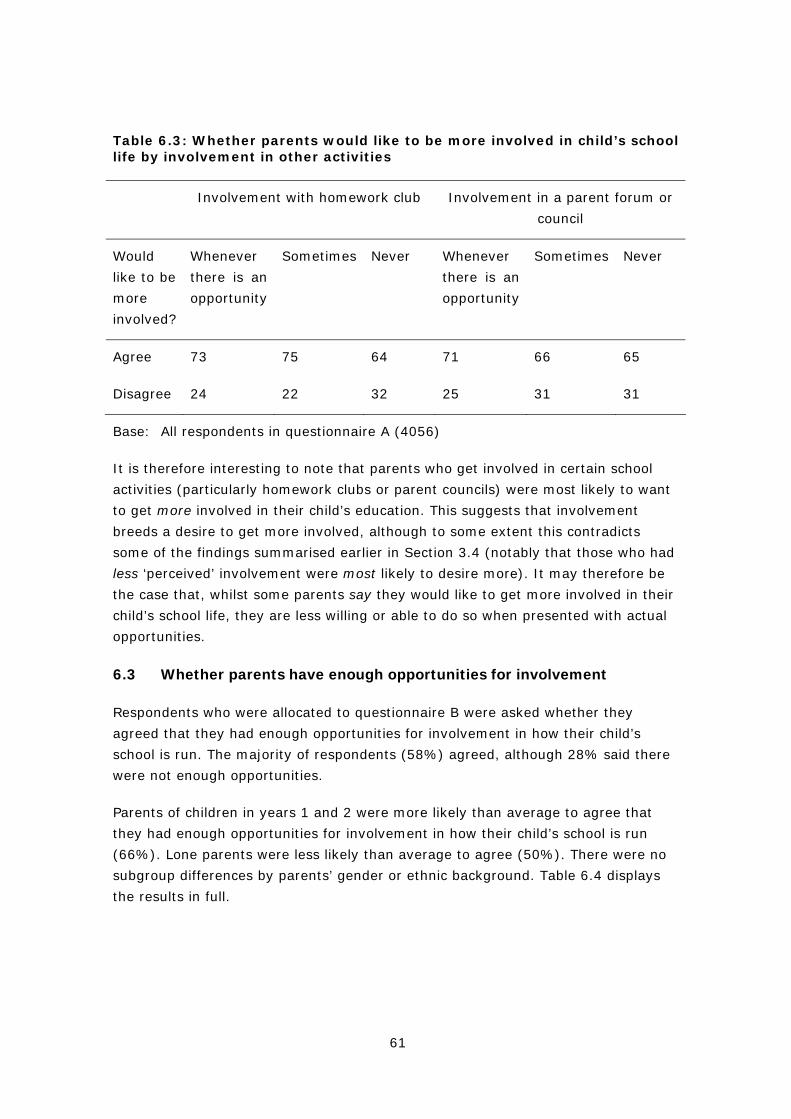
61
Table 6.3: Whether parents would like to be more involved in child’s school life by involvement in other activities
Involvement with homework club Involvement in a parent forum or
council
Would
like to be
more
involved?
Whenever
there is an
opportunity
Sometimes Never Whenever
there is an
opportunity
Sometimes Never
Agree 73 75 64 71 66 65
Disagree 24 22 32 25 31 31
Base: All respondents in questionnaire A (4056)
It is therefore interesting to note that parents who get involved in certain school
activities (particularly homework clubs or parent councils) were most likely to want
to get more involved in their child’s education. This suggests that involvement
breeds a desire to get more involved, although to some extent this contradicts
some of the findings summarised earlier in Section 3.4 (notably that those who had
less ‘perceived’ involvement were most likely to desire more). It may therefore be
the case that, whilst some parents say they would like to get more involved in their
child’s school life, they are less willing or able to do so when presented with actual
opportunities.
6.3 Whether parents have enough opportunities for involvement
Respondents who were allocated to questionnaire B were asked whether they
agreed that they had enough opportunities for involvement in how their child’s
school is run. The majority of respondents (58%) agreed, although 28% said there
were not enough opportunities.
Parents of children in years 1 and 2 were more likely than average to agree that
they had enough opportunities for involvement in how their child’s school is run
(66%). Lone parents were less likely than average to agree (50%). There were no
subgroup differences by parents’ gender or ethnic background. Table 6.4 displays
the results in full.
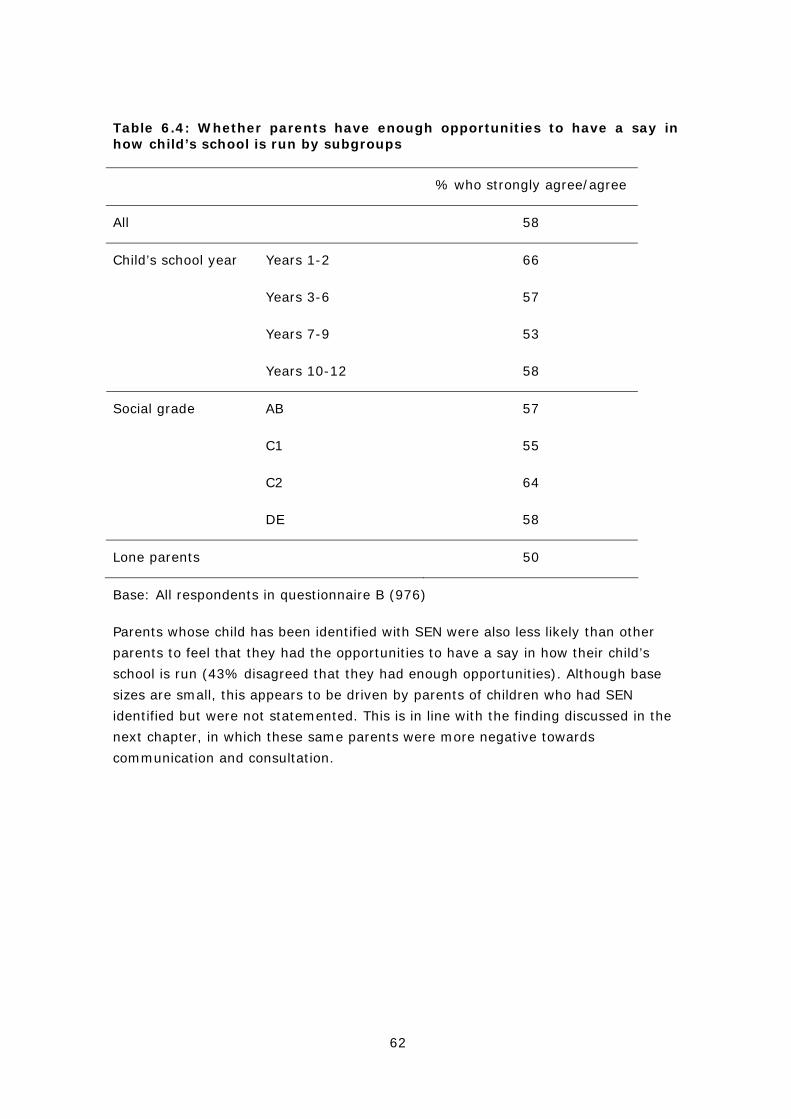
62
Table 6.4: Whether parents have enough opportunities to have a say in how child’s school is run by subgroups
% who strongly agree/agree
All 58
Years 1-2 66
Years 3-6 57
Years 7-9 53
Child’s school year
Years 10-12 58
AB 57
C1 55
C2 64
Social grade
DE 58
Lone parents 50
Base: All respondents in questionnaire B (976)
Parents whose child has been identified with SEN were also less likely than other
parents to feel that they had the opportunities to have a say in how their child’s
school is run (43% disagreed that they had enough opportunities). Although base
sizes are small, this appears to be driven by parents of children who had SEN
identified but were not statemented. This is in line with the finding discussed in the
next chapter, in which these same parents were more negative towards
communication and consultation.

63
7 Communication with school
This chapter examines parents’ experiences of communicating with schools,
specifically their views on the effectiveness of current communication between
schools and parents, the methods currently used and their preferences for
communication. Effective communication with parents was a focus of the 2005
DfES White Paper “Higher Standards, Better Schools for All, More Choice for Parents
and Pupils”, and the more recent Every Parent Matters publication stressed the
need to use technology to make communication quicker and easier 12.
7.1 Methods of communication
Most parents said that they had attended events such as Parents’ evenings,
Parents’ Meetings or Review Days (95%), while other methods of communication
about their child’s progress in class (as shown in Chart 7.1) had been used by
around half of parents in each case.
Chart 7.1: Ways of communicating about child’s progress in class
53%
48%
54%
95%
written communication(letters, email)
meetings requested byparent
meetings requested byschool
regular events (parents'evenings, parents'
meetings, review days)
Base: All respondents (5032)
12 2007, Every Parent Matters, Department for Education and Skills
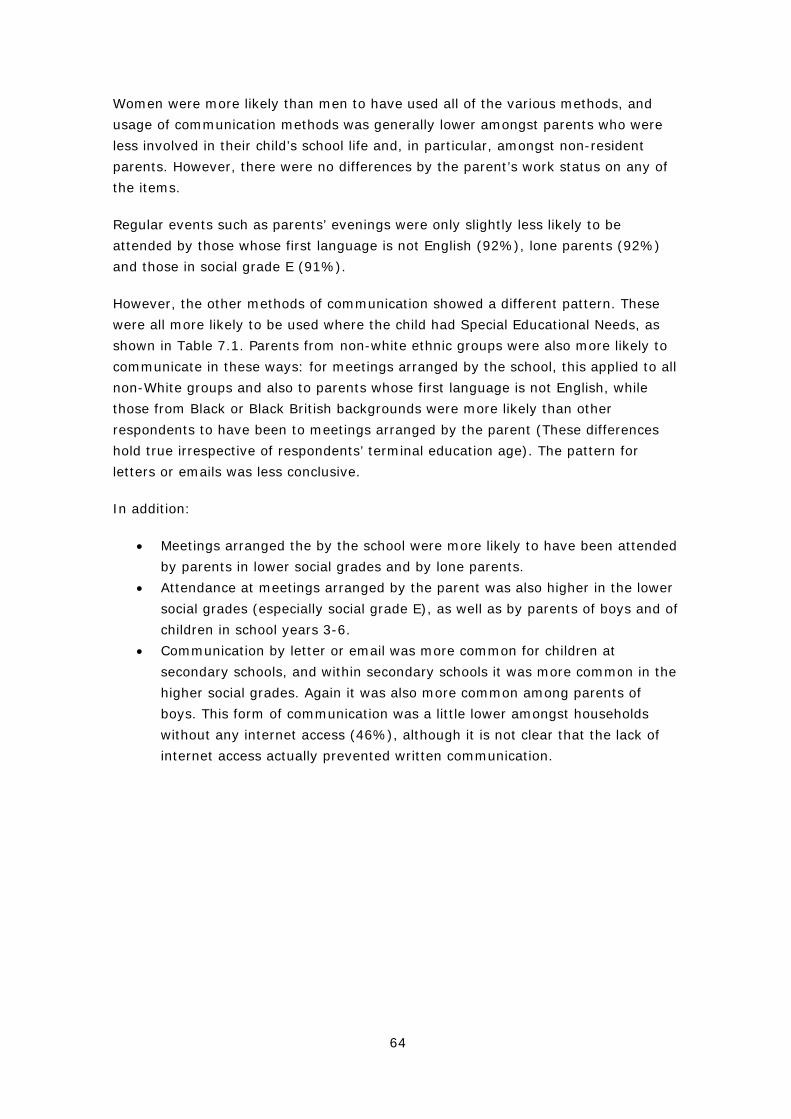
64
Women were more likely than men to have used all of the various methods, and
usage of communication methods was generally lower amongst parents who were
less involved in their child’s school life and, in particular, amongst non-resident
parents. However, there were no differences by the parent’s work status on any of
the items.
Regular events such as parents’ evenings were only slightly less likely to be
attended by those whose first language is not English (92%), lone parents (92%)
and those in social grade E (91%).
However, the other methods of communication showed a different pattern. These
were all more likely to be used where the child had Special Educational Needs, as
shown in Table 7.1. Parents from non-white ethnic groups were also more likely to
communicate in these ways: for meetings arranged by the school, this applied to all
non-White groups and also to parents whose first language is not English, while
those from Black or Black British backgrounds were more likely than other
respondents to have been to meetings arranged by the parent (These differences
hold true irrespective of respondents’ terminal education age). The pattern for
letters or emails was less conclusive.
In addition:
• Meetings arranged the by the school were more likely to have been attended
by parents in lower social grades and by lone parents.
• Attendance at meetings arranged by the parent was also higher in the lower
social grades (especially social grade E), as well as by parents of boys and of
children in school years 3-6.
• Communication by letter or email was more common for children at
secondary schools, and within secondary schools it was more common in the
higher social grades. Again it was also more common among parents of
boys. This form of communication was a little lower amongst households
without any internet access (46%), although it is not clear that the lack of
internet access actually prevented written communication.
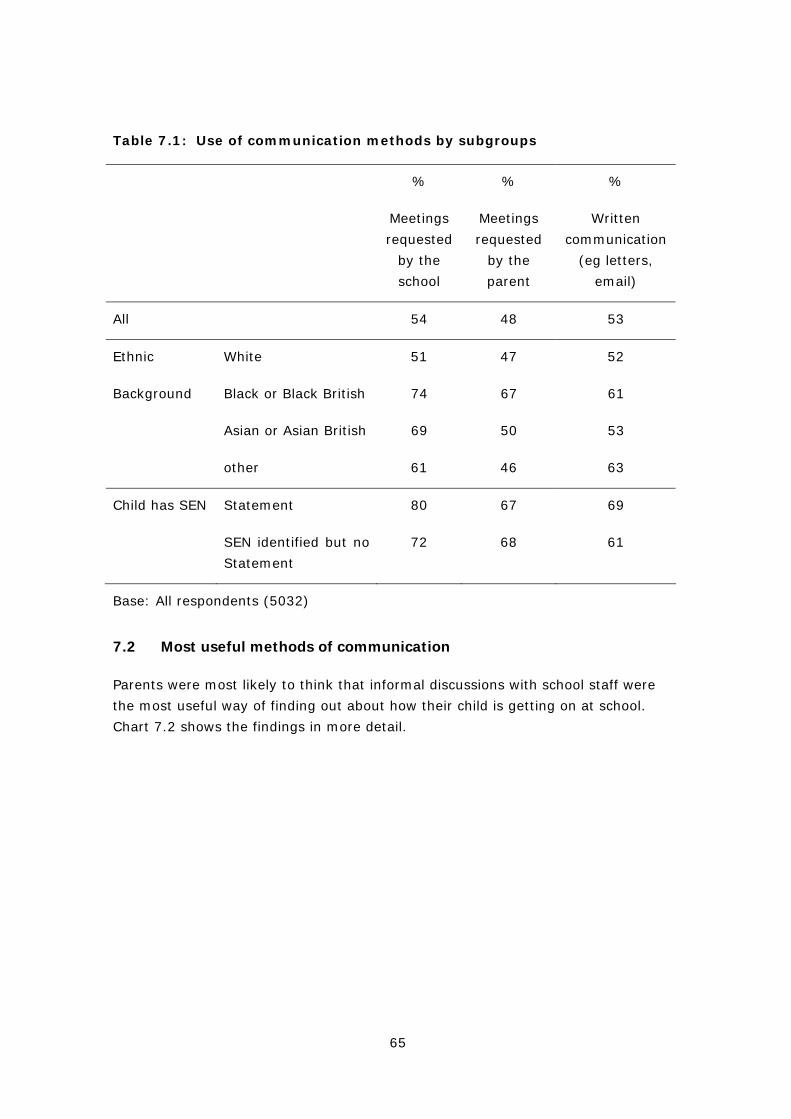
65
Table 7.1: Use of communication methods by subgroups
%
Meetings
requested
by the
school
%
Meetings
requested
by the
parent
%
Written
communication
(eg letters,
email)
All 54 48 53
Ethnic White 51 47 52
Background Black or Black British 74 67 61
Asian or Asian British 69 50 53
other 61 46 63
Child has SEN Statement 80 67 69
SEN identified but no
Statement
72 68 61
Base: All respondents (5032)
7.2 Most useful methods of communication
Parents were most likely to think that informal discussions with school staff were
the most useful way of finding out about how their child is getting on at school.
Chart 7.2 shows the findings in more detail.
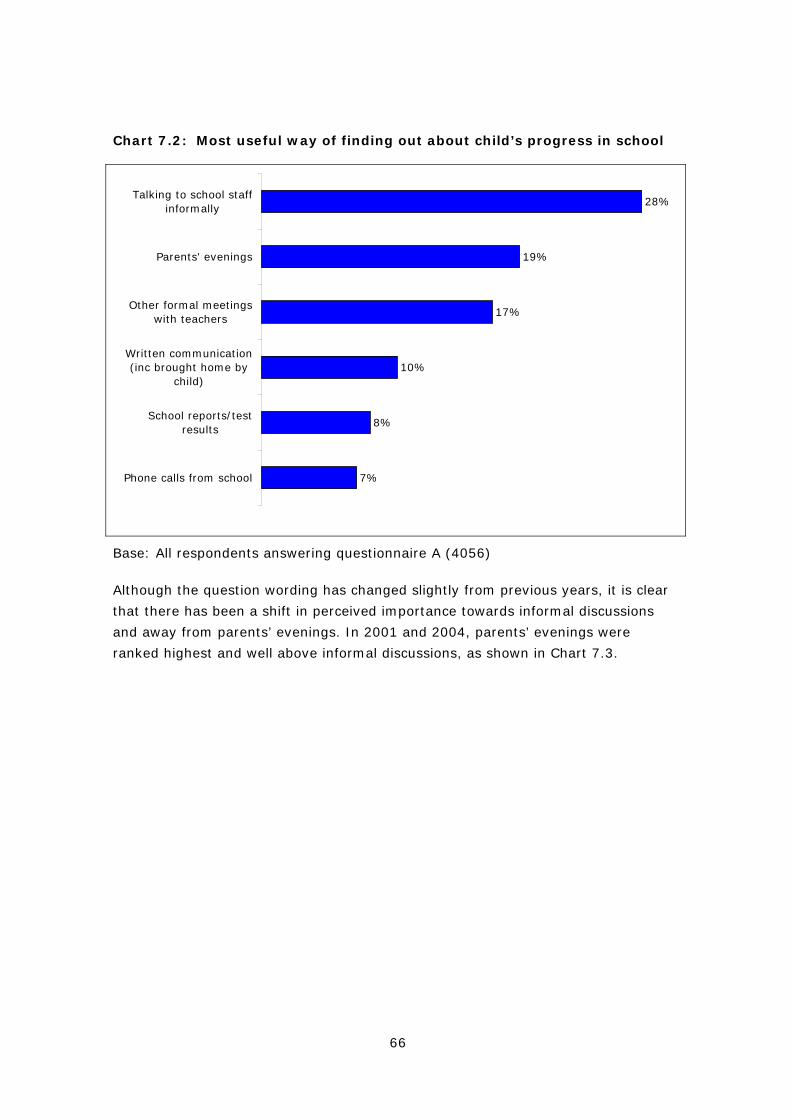
66
Chart 7.2: Most useful way of finding out about child’s progress in school
7%
8%
10%
17%
19%
28%
Phone calls from school
School reports/testresults
Written communication(inc brought home by
child)
Other formal meetingswith teachers
Parents' evenings
Talking to school staffinformally
Base: All respondents answering questionnaire A (4056)
Although the question wording has changed slightly from previous years, it is clear
that there has been a shift in perceived importance towards informal discussions
and away from parents’ evenings. In 2001 and 2004, parents’ evenings were
ranked highest and well above informal discussions, as shown in Chart 7.3.
67
Chart 7.3: Usefulness of parents’ evenings and informal discussions - trend data
43%
35%
19%
10%
18%
28%
2001 2003 2007
Parents' evenings
Informal discussions
Base: All respondents
There were differences in the preferences of different parents:
• Parents of children in primary schools were most likely to find informal
meetings the most useful way of finding out about how their child is getting
on at school (38% compared with 16% in secondary schools); parents of
children in secondary school were more likely than those in primary schools
to find written communication the most helpful (13% written
communication, 11% school reports/test results and 4% email).
• Female parents, especially those not in work, were most likely to find
informal discussions the most useful.
• Face-to-face meetings (other than parents’ evenings) were most popular
amongst parents of children with SEN than other parents
• More generally, the proportion who found face-to-face meetings the most
useful way of finding out about how their child is getting on at school
increased along with the level of involvement in school activities, and this
applied particularly to informal discussions. Other methods (written and
telephone) could therefore be targeted for communicating with parents who
are currently less involved.
• There was a difference by social grade: those in higher social grades were
more likely to find parents’ evenings the most useful method, as well as
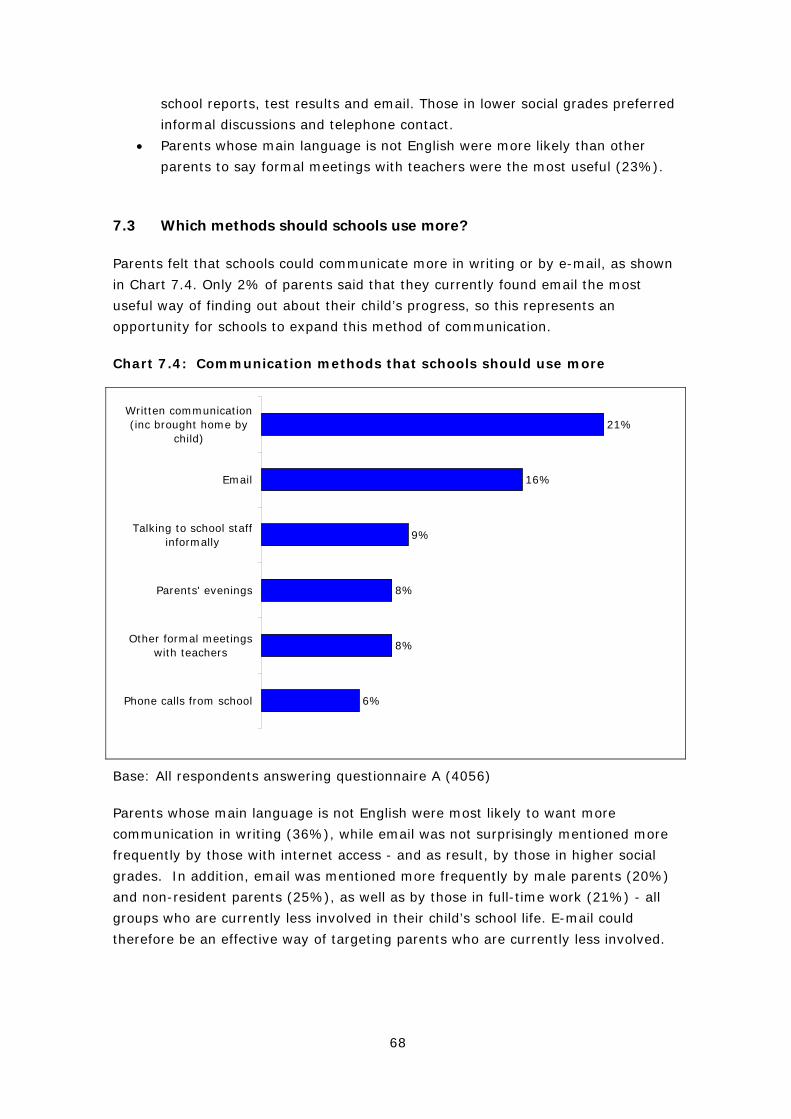
68
school reports, test results and email. Those in lower social grades preferred
informal discussions and telephone contact.
• Parents whose main language is not English were more likely than other
parents to say formal meetings with teachers were the most useful (23%).
7.3 Which methods should schools use more?
Parents felt that schools could communicate more in writing or by e-mail, as shown
in Chart 7.4. Only 2% of parents said that they currently found email the most
useful way of finding out about their child’s progress, so this represents an
opportunity for schools to expand this method of communication.
Chart 7.4: Communication methods that schools should use more
6%
8%
8%
9%
16%
21%
Phone calls from school
Other formal meetingswith teachers
Parents' evenings
Talking to school staffinformally
Written communication(inc brought home by
child)
Base: All respondents answering questionnaire A (4056)
Parents whose main language is not English were most likely to want more
communication in writing (36%), while email was not surprisingly mentioned more
frequently by those with internet access - and as result, by those in higher social
grades. In addition, email was mentioned more frequently by male parents (20%)
and non-resident parents (25%), as well as by those in full-time work (21%) - all
groups who are currently less involved in their child’s school life. E-mail could
therefore be an effective way of targeting parents who are currently less involved.

69
7.4 Frequency parents receive and would like to receive reports
Over half of respondents (57%) would like to receive information on their child’s
progress at least once a term while 31% would like to receive information twice a
year or less (see Chart 7.5). Seven percent would like to see how their child is
doing at least once a month while a small minority (3%) would like this information
as and when they want it.
Chart 7.5: How often parents would ideally like to see how their child is doing
3%
7%
57%
31%
As and when I want to At least once a month At least once a term Twice a year or less
Base: All respondents (5032)
Subgroup differences between those wanting to see how well their child is doing at
least once a term include:
• Male respondents were more likely than female respondents (60% compared
with 55%).
• Parents in full-time employment (61%) were more likely than respondents
not in full-time (54%).
• Respondents who left education at 17 or later were more likely compared
with those that left education at 16 or earlier (60% versus 54%
respectively).
• Respondents in social grades ABC1 (60%) were more likely than
respondents in C2DE (53%).
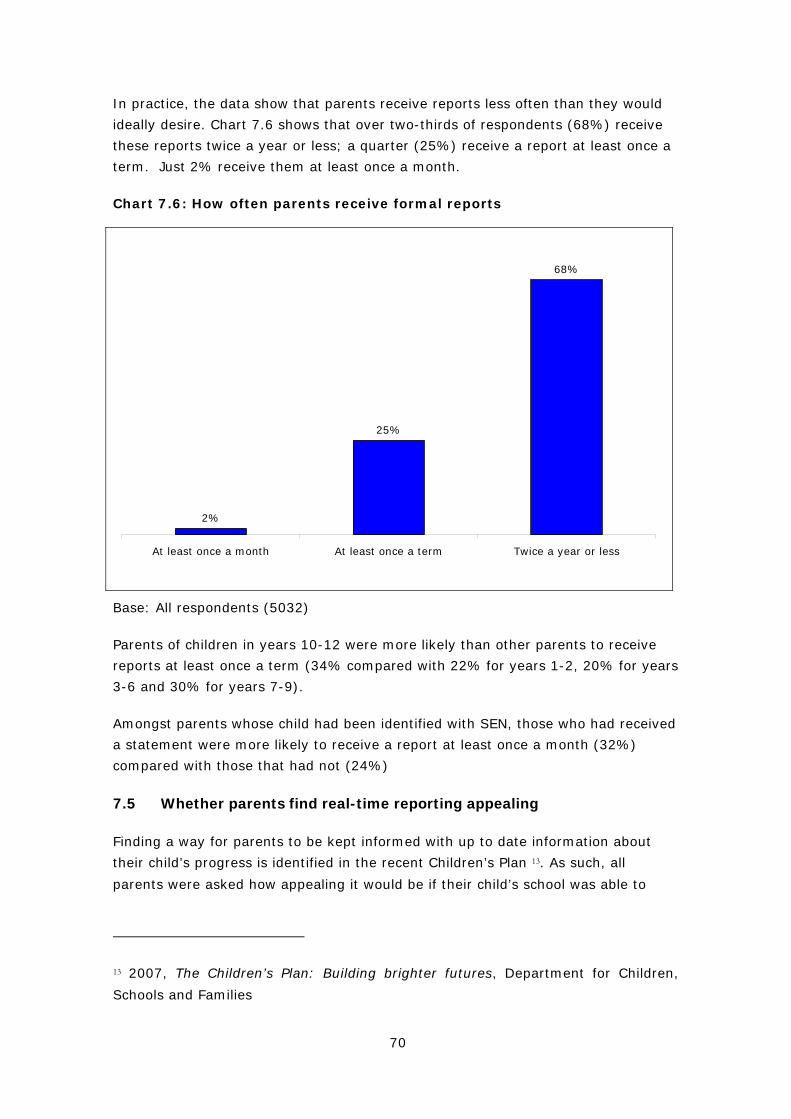
70
In practice, the data show that parents receive reports less often than they would
ideally desire. Chart 7.6 shows that over two-thirds of respondents (68%) receive
these reports twice a year or less; a quarter (25%) receive a report at least once a
term. Just 2% receive them at least once a month.
Chart 7.6: How often parents receive formal reports
2%
25%
68%
At least once a month At least once a term Twice a year or less
Base: All respondents (5032)
Parents of children in years 10-12 were more likely than other parents to receive
reports at least once a term (34% compared with 22% for years 1-2, 20% for years
3-6 and 30% for years 7-9).
Amongst parents whose child had been identified with SEN, those who had received
a statement were more likely to receive a report at least once a month (32%)
compared with those that had not (24%)
7.5 Whether parents find real-time reporting appealing
Finding a way for parents to be kept informed with up to date information about
their child’s progress is identified in the recent Children’s Plan 13. As such, all
parents were asked how appealing it would be if their child’s school was able to
13 2007, The Children’s Plan: Building brighter futures, Department for Children,
Schools and Families
71
provide a secure website with up-to-date information on how well their child was
progressing. Four-fifths of parents (80%) indicated that this would be appealing.
Parents working full-time were slightly more likely than those not working full-time
to find the idea of a secure website appealing (83% compared with 79%).
Parents were asked why they found the idea of a secure website appealing or not
appealing (responses are summarised in Chart 7.7). The most popular benefit given
by parents was that a secure website would enable the parent to see how their
child was progressing (35%), illustrated by one verbatim response below:
‘Because she’s in her final year so I’d like to know that she’s got all her
coursework and homework in and her attendance, behaviour, punctuality
was as I’d expect’
A quarter of parents answering this question gave the convenience of a website as
being the reason why it was appealing, again demonstrated by a respondent’s
verbatim response:
‘It’s easier to do things in your own time rather than relying on the school’
A smaller proportion of respondents gave negative reasons for why they found a
website unappealing. The most common negative reason was that a website would
not be secure (7%) while 5% of parents said they would lose personal contact with
teachers or the school. A typical negative verbatim response was:
‘[it] Doesn’t matter how secure a website is, someone would find a way’

72
Chart 7.7: Reasons why a secure website would be appealing or not appealing
3%
4%
5%
7%
9%
9%
9%
26%
35%Can see how he/she is progressing/doing
Immediate/easy access to informationanytime
Would be able to monitor child's progresswith up to date information
No need to go into school to obtaininformation
Allows you to identify any problems quickly
Positive
Negative
Possible security/privacy issues
Loss of personal contact with school/teachers
Don't like/own/use computers/internet
Happy with current level of information
Base: All respondents answering questionnaire B (976)
7.6 Confidence in talking to teachers
Two in three parents (65%) said that they feel very confident in talking to teachers
at their child’s school, while most of the remainder described themselves as fairly
confident (31%).
As shown in Table 7.2, men were more likely than women to say they were very
confident in talking to teachers (and the proportion fell to 59% amongst women
who were not working), and confidence also increased with age and amongst higher
social grades. Lone parents were less likely to say they were very confident than
other parents.
A similar pattern was identified earlier in the report in relation to confidence in
helping with homework, with men and those in higher social grades more confident
and lone parents less confident.
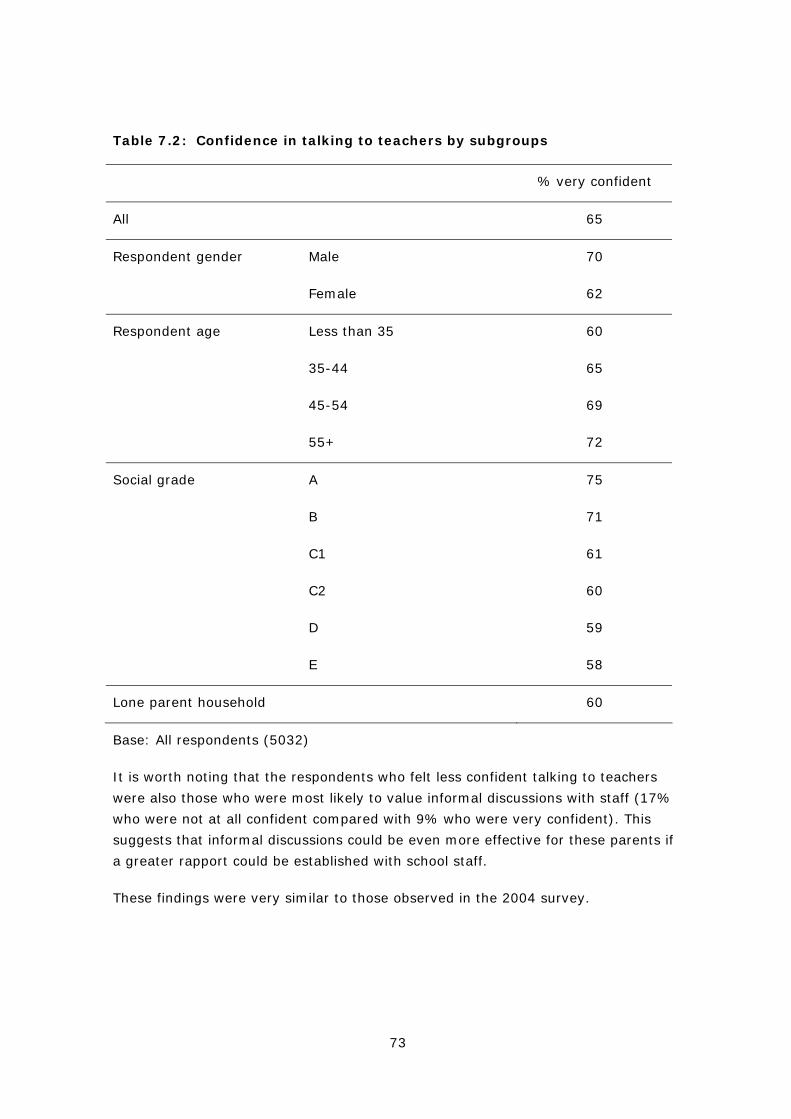
73
Table 7.2: Confidence in talking to teachers by subgroups
% very confident
All 65
Respondent gender Male 70
Female 62
Respondent age Less than 35 60
35-44 65
45-54 69
55+ 72
Social grade A 75
B 71
C1 61
C2 60
D 59
E 58
Lone parent household 60
Base: All respondents (5032)
It is worth noting that the respondents who felt less confident talking to teachers
were also those who were most likely to value informal discussions with staff (17%
who were not at all confident compared with 9% who were very confident). This
suggests that informal discussions could be even more effective for these parents if
a greater rapport could be established with school staff.
These findings were very similar to those observed in the 2004 survey.

74
7.7 Attitudes to communication with school
Respondents were asked whether they agreed or disagreed with a number of
statements relating to communication between parents and the school. In general,
parents were very positive towards their relationship with the school and the
information provided.
Chart 7.8 shows attitudes towards information given by the school about children.
More than four in five respondents agreed that the school gave them clear
information on how their child was getting on, gave them information that helped
them understand how they could support their child’s progress, and gave them
enough information so that they could judge how far their child is fulfilling his/her
potential. On the first of these items (the clarity of information), 60% said they
definitely agreed. Similarly, the majority of respondents disagreed that school
information was ‘full of jargon’, although 30% did agree with this statement.
The main sub-group differences were:
• Views were more positive amongst parents of younger children (the
exception being information to judge how far children are fulfilling their
potential, where there was no difference).
• On the first two statements (clarity of information and helping to understand
how parents can support their child’s progress), views were more positive
amongst parents whose first language is not English and those in lower
social grades. However, these groups were also more negative in relation to
school information containing jargon. It might be concluded that using
jargon, while undesirable, does not have a large impact on the overall
impression of information.
• Parents of children with a Statement of SEN were more positive in relation to
information that can help them support their child’s progress and
information that can allow them to judge how far their child is fulfilling
his/her potential. They were also more likely to say that they knew who to
contact at the school (covered in the section on involvement and contact
below). However, those with a child with SEN (statemented or otherwise)
were more negative in relation to jargon in school information. More
generally, there was a tendency across the various statements in this
section of the questionnaire for views to be less positive amongst parents of
children who had been identified as having SEN but had not been
statemented.

75
On these and all of the other statements in this section, parents who felt less
involved in their child’s school life tended to be less positive, and this was also the
case specifically for non-resident parents. However, closer examination does not
indicate any particular types of involvement that lead to more positive attitudes (ie
views were consistently most positive among parents taking part in different school
activities and/or helping their child with homework).
Chart 7.8: Attitudes to communication with school: information
13%
37%
38%
60%
17%
44%
46%
26%
29%
9%
8%
8%
37%
3%
3%
5%
3%
6%
5%
1%
A lot of informationgiven by the school
about my child'seducation is full of
jargon
The school gives meenough information forme to judge how far mychild is fulfilling his/her
potential
Information from theschool helps me
understand how I cansupport my child's
progress
My child's school givesme clear information onhow my child is getting
on
definitely agree tend to agree tend to disagree definitely disagree neither/don't know
Base: All respondents (5032), except “my child’s school gives me clear information
on how my child is getting on”: all respondents answering questionnaire A (4056)
The attitude statements in Chart 7.9 relate to the relationship between school and
parent, and the level of support provided. More than two in three respondents
(69%) definitely agreed that the school is welcoming to parents, and respondents
were also positive towards the support given when their child started at the school.
Respondents also disagreed that talking too often to teachers would label them a
troublemaker, and that the school catered better for mums than dads.
Views were again more positive amongst parents of younger children, particularly in
relation to the school being welcoming to parents. Parents who were not working
were also more positive towards the school’s welcoming attitude. However, while
non-working parents were also more positive towards the school making it easy for
parents to be involved (see statement on involvement and contact below), there
was generally little or no difference according to parents’ work status in the various
attitudes statements in this chapter.

76
Men were more likely than women to agree that the school catered better for mums
than dads (23% compared with 10%), although the majority of men still disagreed
with this statement.
Chart 7.9: Attitudes to communication with school: relationship and support
5%
6%
47%
69%
10%
9%
41%
23%
41%
23%
4%
4%
20%
57%
2%
2%
23%
4%
5%
1%
My child's school seemsto cater better for
mums than it does fordads
If I talk too often toteachers at my school, I
will be labelled atroublemaker
When my child startedtheir current school, Ifelt well supported by
the school
I find my child's schoolwelcoming to parents
definitely agree tend to agree tend to disagree definitely disagree neither/don't know
Base: All respondents (5032), except “when my child started their current school, I
felt well supported by the school” and “my child’s school seems to cater better for
mums than it does for dads”: all respondents answering questionnaire B (976)
Chart 7.10 includes attitudes relating to involvement and contact with the school.
Once again, views were very positive, in particular on knowing exactly who to
contact if parents had concerns.
Views were again more positive amongst parents of younger children, and women
were more positive on these issues than men.
On the first two statements, views were more positive in the lower social grades
and amongst those whose first language is not English, but the opposite was true of
knowing who to contact at the school. This suggests that these groups are generally
content with their level of involvement with the school but may have less direct
contact with staff.
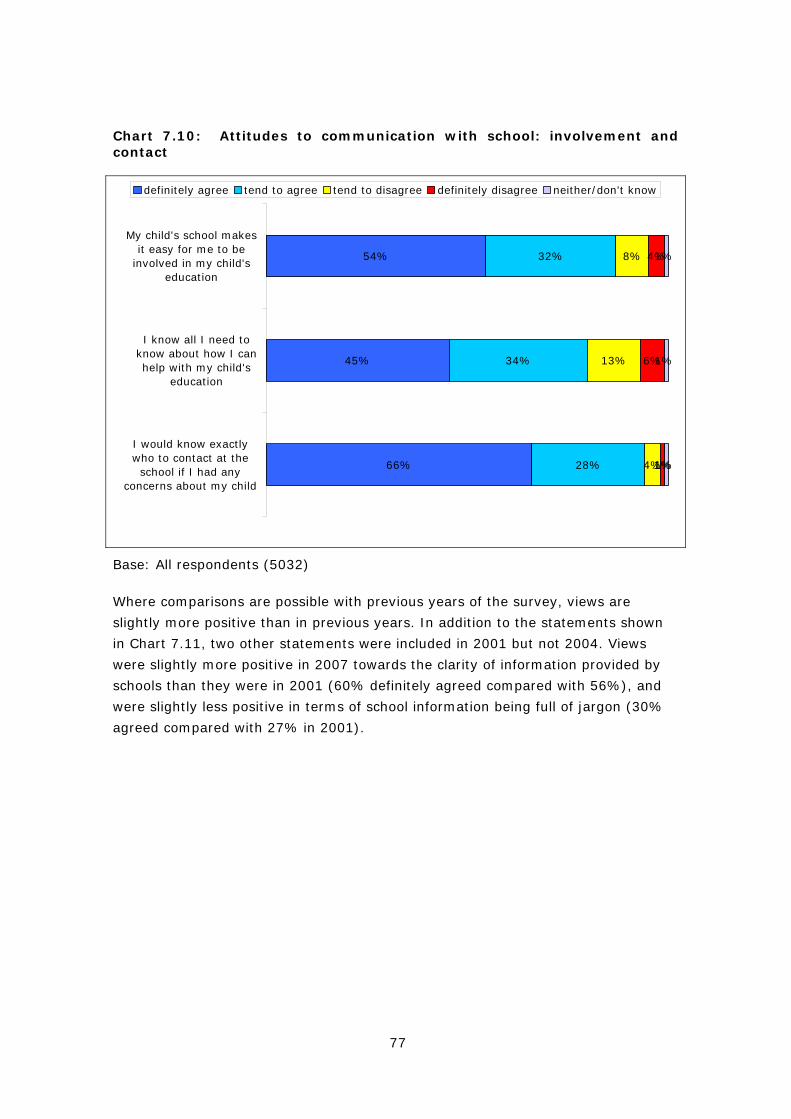
77
Chart 7.10: Attitudes to communication with school: involvement and contact
66%
45%
54%
28%
34%
32%
4%
13%
8%
1%
6%
4%
1%
1%
1%
I would know exactlywho to contact at the
school if I had anyconcerns about my child
I know all I need toknow about how I canhelp with my child's
education
My child's school makesit easy for me to be
involved in my child'seducation
definitely agree tend to agree tend to disagree definitely disagree neither/don't know
Base: All respondents (5032)
Where comparisons are possible with previous years of the survey, views are
slightly more positive than in previous years. In addition to the statements shown
in Chart 7.11, two other statements were included in 2001 but not 2004. Views
were slightly more positive in 2007 towards the clarity of information provided by
schools than they were in 2001 (60% definitely agreed compared with 56%), and
were slightly less positive in terms of school information being full of jargon (30%
agreed compared with 27% in 2001).
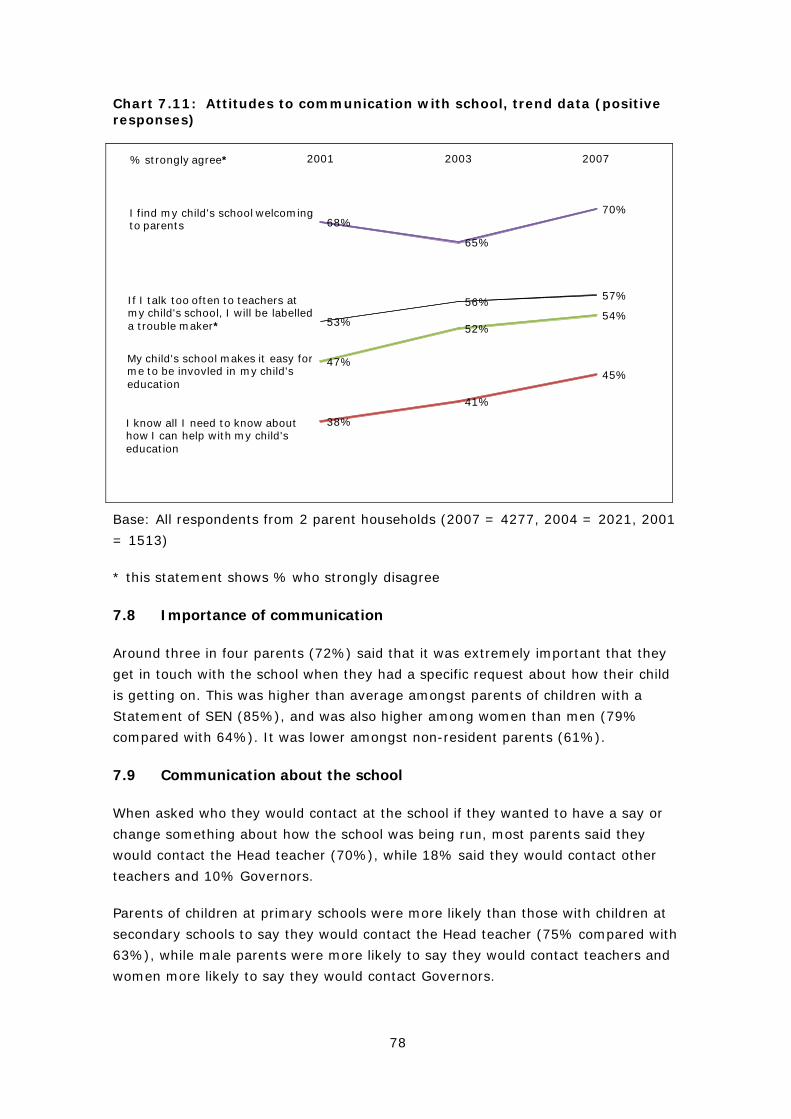
78
Chart 7.11: Attitudes to communication with school, trend data (positive responses)
53%
56% 57%
38%
41%
45%47%
52%54%
68%
65%
70%
2001 2003 2007
I find my child's school welcoming to parents
If I talk too often to teachers at my child's school, I will be labelled a trouble maker*
My child's school makes it easy for me to be invovled in my child's education
I know all I need to know about how I can help with my child's education
% strongly agree*
Base: All respondents from 2 parent households (2007 = 4277, 2004 = 2021, 2001
= 1513)
* this statement shows % who strongly disagree
7.8 Importance of communication
Around three in four parents (72%) said that it was extremely important that they
get in touch with the school when they had a specific request about how their child
is getting on. This was higher than average amongst parents of children with a
Statement of SEN (85%), and was also higher among women than men (79%
compared with 64%). It was lower amongst non-resident parents (61%).
7.9 Communication about the school
When asked who they would contact at the school if they wanted to have a say or
change something about how the school was being run, most parents said they
would contact the Head teacher (70%), while 18% said they would contact other
teachers and 10% Governors.
Parents of children at primary schools were more likely than those with children at
secondary schools to say they would contact the Head teacher (75% compared with
63%), while male parents were more likely to say they would contact teachers and
women more likely to say they would contact Governors.
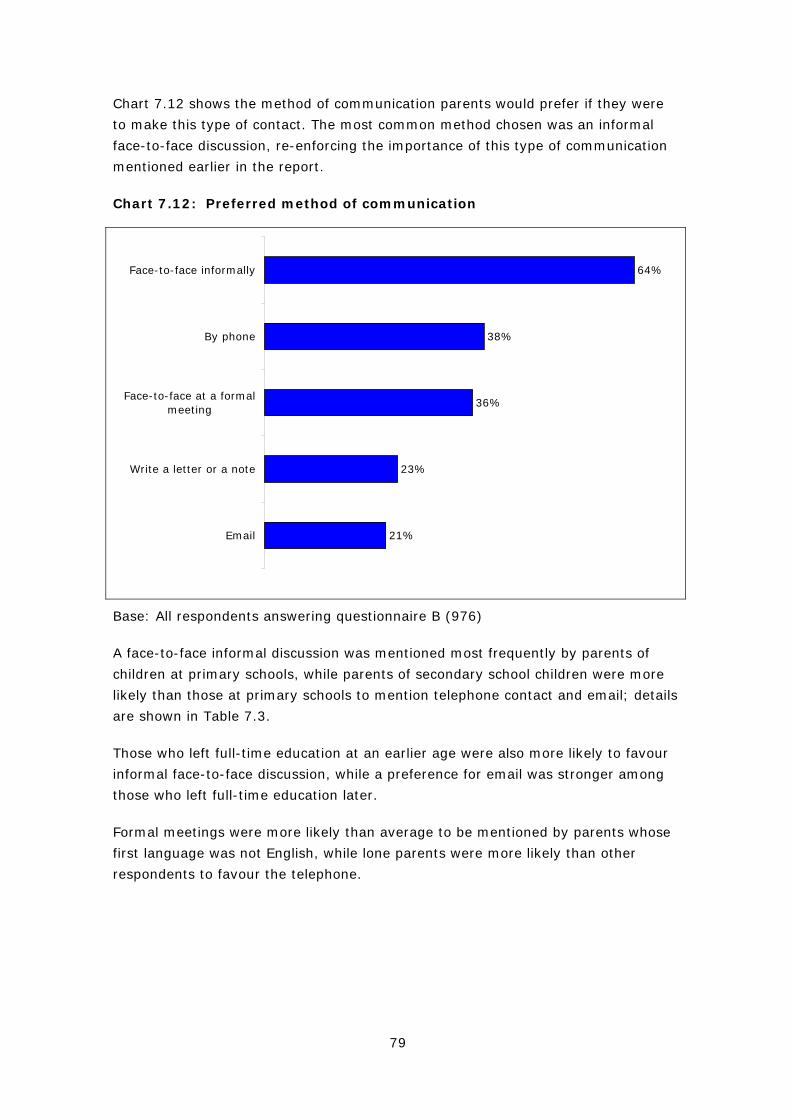
79
Chart 7.12 shows the method of communication parents would prefer if they were
to make this type of contact. The most common method chosen was an informal
face-to-face discussion, re-enforcing the importance of this type of communication
mentioned earlier in the report.
Chart 7.12: Preferred method of communication
21%
23%
36%
38%
64%
Write a letter or a note
Face-to-face at a formalmeeting
By phone
Face-to-face informally
Base: All respondents answering questionnaire B (976)
A face-to-face informal discussion was mentioned most frequently by parents of
children at primary schools, while parents of secondary school children were more
likely than those at primary schools to mention telephone contact and email; details
are shown in Table 7.3.
Those who left full-time education at an earlier age were also more likely to favour
informal face-to-face discussion, while a preference for email was stronger among
those who left full-time education later.
Formal meetings were more likely than average to be mentioned by parents whose
first language was not English, while lone parents were more likely than other
respondents to favour the telephone.
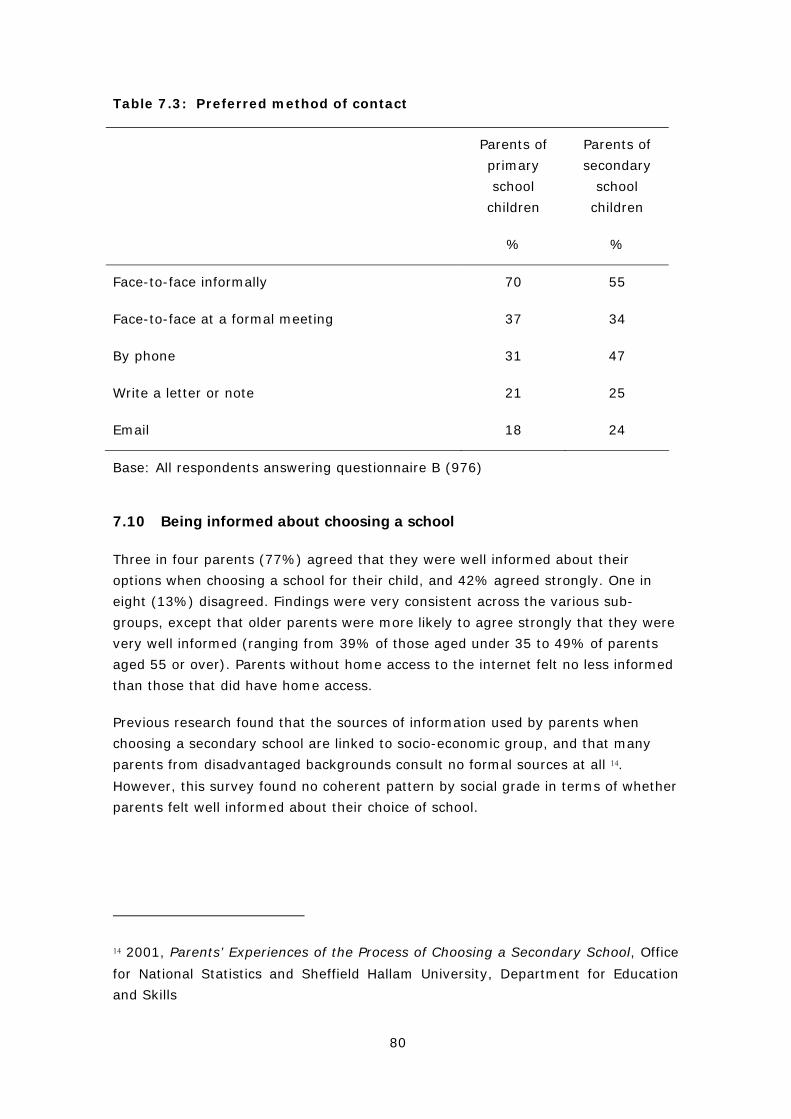
80
Table 7.3: Preferred method of contact
Parents of
primary
school
children
%
Parents of
secondary
school
children
%
Face-to-face informally 70 55
Face-to-face at a formal meeting 37 34
By phone 31 47
Write a letter or note 21 25
Email 18 24
Base: All respondents answering questionnaire B (976)
7.10 Being informed about choosing a school
Three in four parents (77%) agreed that they were well informed about their
options when choosing a school for their child, and 42% agreed strongly. One in
eight (13%) disagreed. Findings were very consistent across the various sub-
groups, except that older parents were more likely to agree strongly that they were
very well informed (ranging from 39% of those aged under 35 to 49% of parents
aged 55 or over). Parents without home access to the internet felt no less informed
than those that did have home access.
Previous research found that the sources of information used by parents when
choosing a secondary school are linked to socio-economic group, and that many
parents from disadvantaged backgrounds consult no formal sources at all 14.
However, this survey found no coherent pattern by social grade in terms of whether
parents felt well informed about their choice of school.
14 2001, Parents’ Experiences of the Process of Choosing a Secondary School, Office
for National Statistics and Sheffield Hallam University, Department for Education
and Skills
81
7.11 School Profiles
7.11.1 Levels and sources of awareness
School Profiles were introduced as part of The Education Act 2005. The school
profile is a mechanism for maintained schools to report annually to parents about
many different facets of the school, including the school's progress, priorities and
performance. School profiles are prepared on a standard template which includes
performance statistics and a summary of the latest Ofsted report, provided by the
DCSF and narrative sections under standard headings, written by the school.
All respondents in the survey were asked whether they were aware of School
Profiles and three in ten (29%) respondents reported that they were.
Looking at the main subgroups, the following types of parents were more likely to
have heard of School Profiles (see Table 7.4 for full details):
• those with children in school years 10 and 11;
• those whose terminal education age was 21 or over;
• those in social class A and B.
Further, as might be expected, parents who said they were very or fairly involved in
their child’s school life were more likely to have heard of School Profiles than those
who said they were not very or not at all involved.
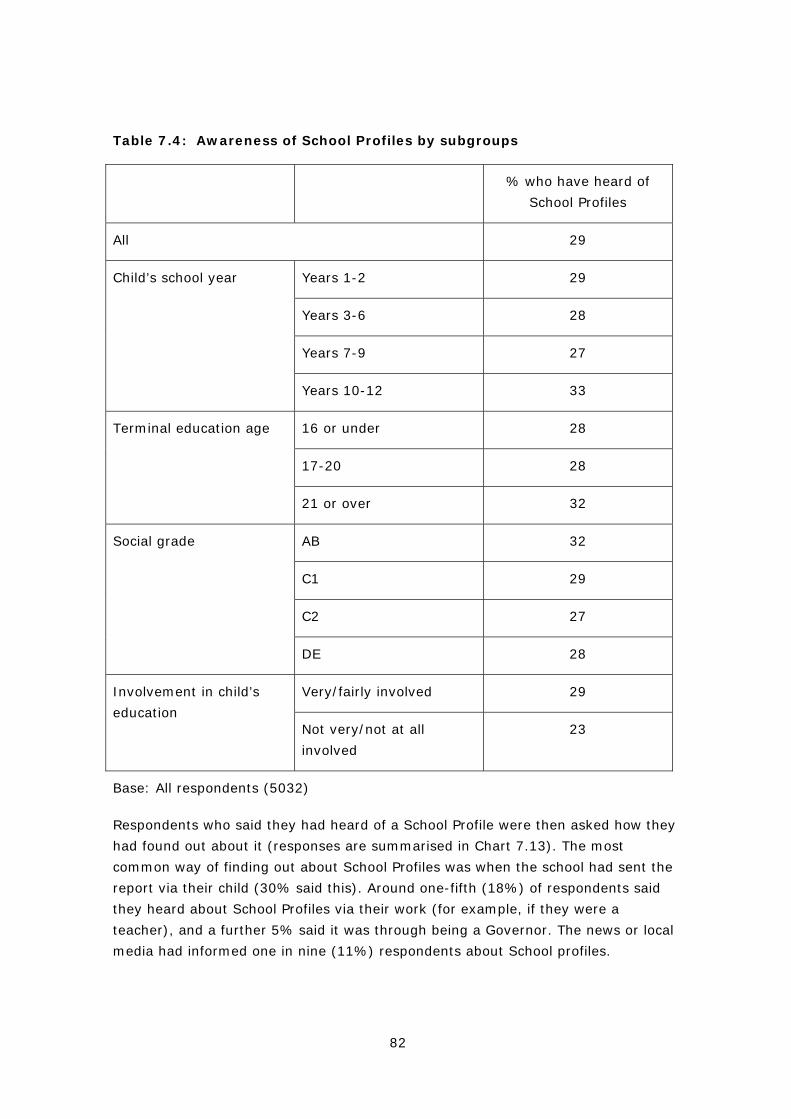
82
Table 7.4: Awareness of School Profiles by subgroups
% who have heard of
School Profiles
All 29
Years 1-2 29
Years 3-6 28
Years 7-9 27
Child’s school year
Years 10-12 33
16 or under 28
17-20 28
Terminal education age
21 or over 32
AB 32
C1 29
C2 27
Social grade
DE 28
Very/fairly involved 29 Involvement in child’s
education Not very/not at all
involved
23
Base: All respondents (5032)
Respondents who said they had heard of a School Profile were then asked how they
had found out about it (responses are summarised in Chart 7.13). The most
common way of finding out about School Profiles was when the school had sent the
report via their child (30% said this). Around one-fifth (18%) of respondents said
they heard about School Profiles via their work (for example, if they were a
teacher), and a further 5% said it was through being a Governor. The news or local
media had informed one in nine (11%) respondents about School profiles.
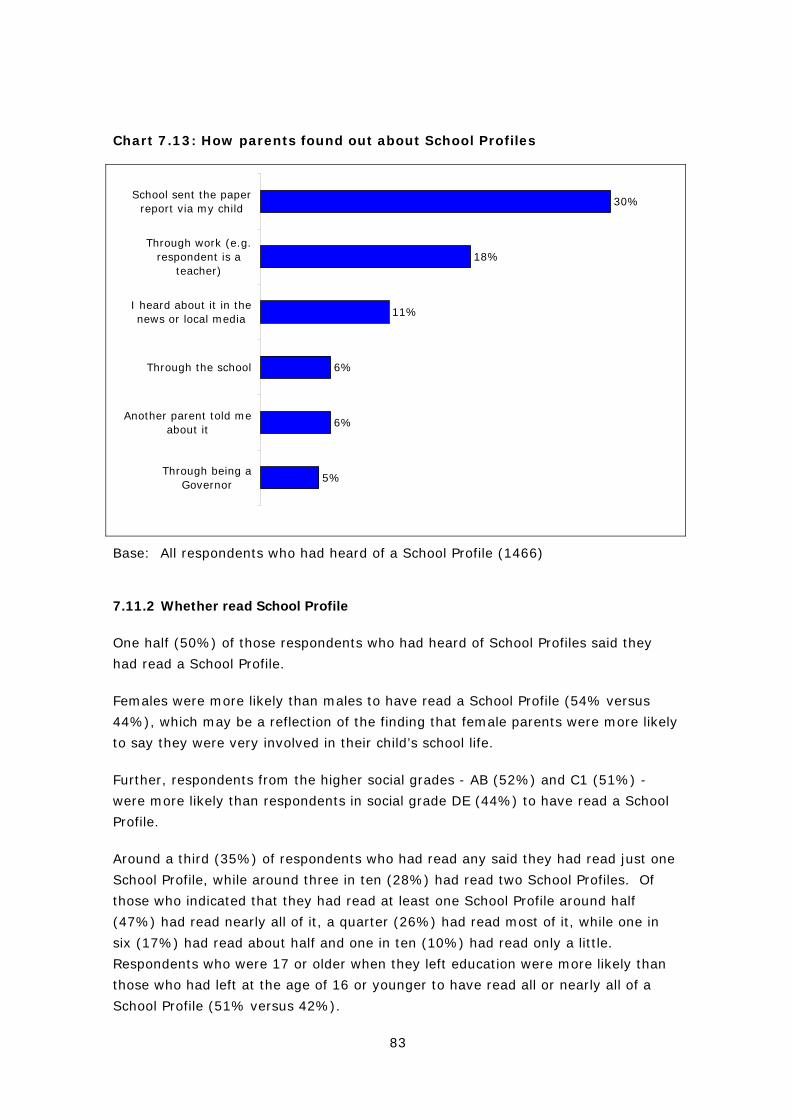
83
Chart 7.13: How parents found out about School Profiles
30%
18%
11%
6%
6%
5%
School sent the paperreport via my child
Through work (e.g.respondent is a
teacher)
I heard about it in thenews or local media
Through the school
Another parent told meabout it
Through being aGovernor
Base: All respondents who had heard of a School Profile (1466)
7.11.2 Whether read School Profile
One half (50%) of those respondents who had heard of School Profiles said they
had read a School Profile.
Females were more likely than males to have read a School Profile (54% versus
44%), which may be a reflection of the finding that female parents were more likely
to say they were very involved in their child’s school life.
Further, respondents from the higher social grades - AB (52%) and C1 (51%) -
were more likely than respondents in social grade DE (44%) to have read a School
Profile.
Around a third (35%) of respondents who had read any said they had read just one
School Profile, while around three in ten (28%) had read two School Profiles. Of
those who indicated that they had read at least one School Profile around half
(47%) had read nearly all of it, a quarter (26%) had read most of it, while one in
six (17%) had read about half and one in ten (10%) had read only a little.
Respondents who were 17 or older when they left education were more likely than
those who had left at the age of 16 or younger to have read all or nearly all of a
School Profile (51% versus 42%).
84
7.11.3 Advantages and potential improvements
All respondents who had read at least part of a School Profile were asked what they
thought was good about it (the most commonly mentioned responses are detailed
in Chart 7.14). 15 Having something that gave parents information on a school’s
academic results and performance was what parents thought was best about School
Profiles (mentioned by 41%), as illustrated by some of the verbatim responses
which respondents provided:
‘they give you an insight on how the school’s performing.’
‘tell you how the school is doing and the results that they get.’
One in three (31%) respondents felt that the School Profile was good because it
provided information about a school and its facilities and policies, as shown by the
examples of further verbatim responses:
‘It gives a clear perspective of the school's ethos rather than data on exam
reports.’
‘tell you about the school in terms of facilities and the running of the school
and the important things for the children.’
One in eight respondents (13%) felt that School Profiles provided them the
opportunity to compare different schools, and a similar proportion (12%) said that
they kept them informed about current issues at the school.
15 Respondents were asked to list anything they thought was good about school
profiles (i.e. responses were not prompted).

85
Chart 7.14: What is good about School Profiles
4%
4%
6%
12%
13%
31%
41%
Shows strengths andweaknesses of school
Provides info aboutschool's staff
Ideal for new people toarea/looking for new school
Keeps parents informedabout current issues
Provides opportunity tocompare schools
Provides info about schoolfacilities/activities/policies
Academicresults/performance
Base: All respondents who have read a School Profile (730)
Respondents were also asked how they thought School Profiles could be improved
(Chart 7.15 displays the most commonly mentioned suggestions).16 Encouragingly,
the most common response to the question was actually that it did not need
improving (15% said this). One verbatim response that exemplifies this is:
‘I think they are as good as they can get as it is down to the parent whether
they want to sit and read it. The information is there if you want to read it.’
The next most commonly suggested improvements were related to its style: 7% of
respondents said that it should be more concise and the same proportion said that
it should use less jargon. Examples of respondent’s verbatim answers included:
‘Probably shorter. Punchier. More to the point.’
‘There is a lot of jargon in them and I’m fairly intelligent and I find them
hard to read.’
16 Respondents were asked to list anything they thought could be improved (i.e.
responses were not prompted).

86
Chart 7.15: How School Profile could be improved
15%
7%
7%
5%
4%
4%
4%
Nothing/does not needimproving
It could be moreconcise/simplify it
Use less jargon/plainEnglish
Be available morefrequently
Should be available via e-mail or internet
Provide specific info aboutindividual years
Make it easier tounderstand
Base: All respondents who have read a School Profile (730)
Respondents who had read a School Profile and who were allocated to questionnaire
A were asked how helpful they had found the School Profile. The majority of
respondents were positive towards School Profiles: 87% found it helpful, including
three in ten (31%) who said they found it very helpful.
As shown in Table 7.5, parents of primary school children were more positive
towards School Profiles than those with secondary school children. Further, parents
who considered themselves very or fairly involved in their child’s school life were
more positive towards School Profiles than parents who were not very involved.

87
Table 7.5: How helpful School Profiles were by subgroups
% who find it helpful
All 87
Years 1-2 90
Years 3-6 93
Years 7-9 78
Child’s school year
Years 10-12 83
Very/fairly involved 88 Involvement in child’s
school life Not very/not at all
involved
71
Base: All respondents who were allocated to questionnaire A and have read a
School Profile (599)
Questionnaire B respondents who had not heard of School Profiles were read a brief
description of what they entail and were then asked whether they agreed or
disagreed with a series of statements (responses are summarised in Chart 7.16).
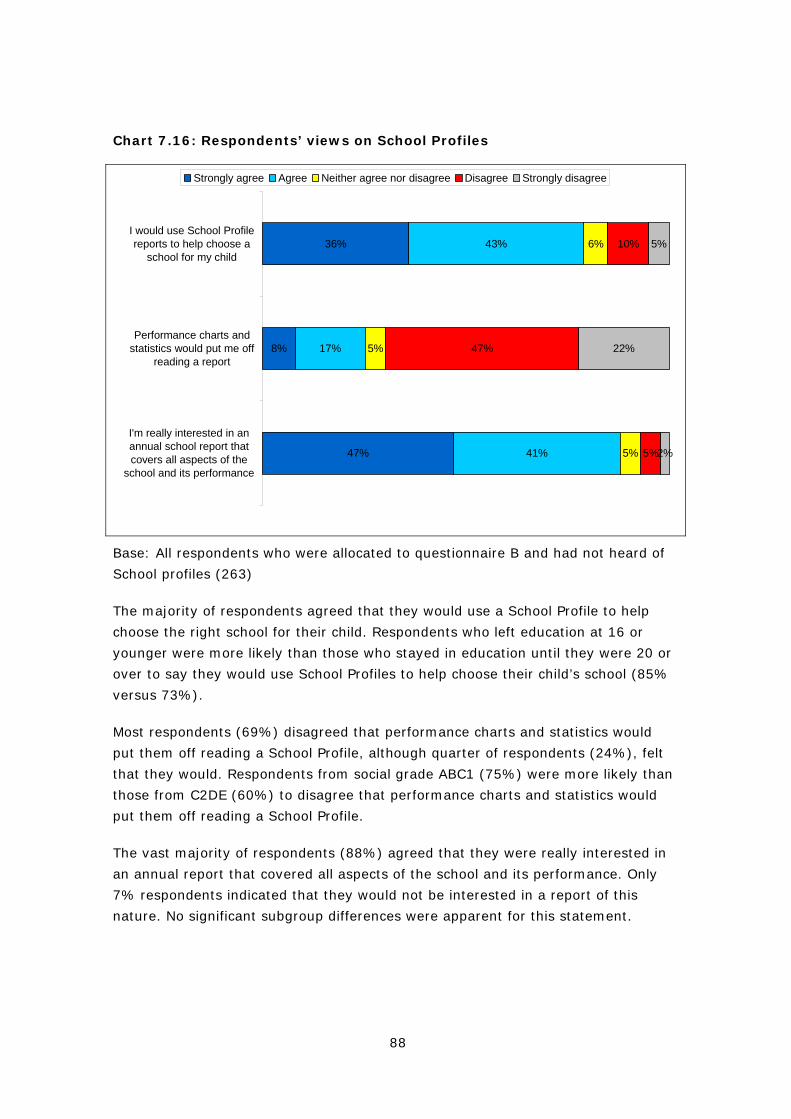
88
Chart 7.16: Respondents’ views on School Profiles
47%
8%
36%
41%
17%
43%
5%
5%
6%
5%
47%
10%
2%
22%
5%
I'm really interested in anannual school report thatcovers all aspects of the
school and its performance
Performance charts andstatistics would put me off
reading a report
I would use School Profilereports to help choose a
school for my child
Strongly agree Agree Neither agree nor disagree Disagree Strongly disagree
Base: All respondents who were allocated to questionnaire B and had not heard of
School profiles (263)
The majority of respondents agreed that they would use a School Profile to help
choose the right school for their child. Respondents who left education at 16 or
younger were more likely than those who stayed in education until they were 20 or
over to say they would use School Profiles to help choose their child’s school (85%
versus 73%).
Most respondents (69%) disagreed that performance charts and statistics would
put them off reading a School Profile, although quarter of respondents (24%), felt
that they would. Respondents from social grade ABC1 (75%) were more likely than
those from C2DE (60%) to disagree that performance charts and statistics would
put them off reading a School Profile.
The vast majority of respondents (88%) agreed that they were really interested in
an annual report that covered all aspects of the school and its performance. Only
7% respondents indicated that they would not be interested in a report of this
nature. No significant subgroup differences were apparent for this statement.
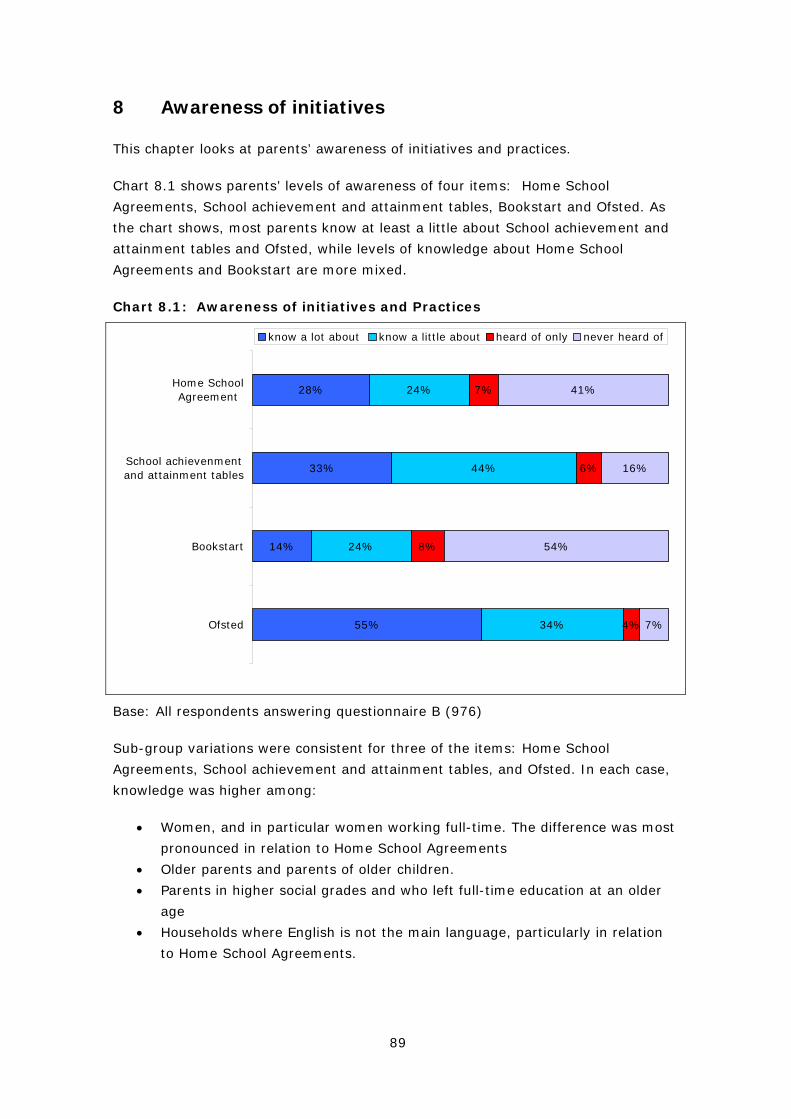
89
8 Awareness of initiatives
This chapter looks at parents’ awareness of initiatives and practices.
Chart 8.1 shows parents’ levels of awareness of four items: Home School
Agreements, School achievement and attainment tables, Bookstart and Ofsted. As
the chart shows, most parents know at least a little about School achievement and
attainment tables and Ofsted, while levels of knowledge about Home School
Agreements and Bookstart are more mixed.
Chart 8.1: Awareness of initiatives and Practices
55%
14%
33%
28%
34%
24%
44%
24%
4%
8%
6%
7%
7%
54%
16%
41%
Ofsted
Bookstart
School achievenmentand attainment tables
Home SchoolAgreement
know a lot about know a little about heard of only never heard of
Base: All respondents answering questionnaire B (976)
Sub-group variations were consistent for three of the items: Home School
Agreements, School achievement and attainment tables, and Ofsted. In each case,
knowledge was higher among:
• Women, and in particular women working full-time. The difference was most
pronounced in relation to Home School Agreements
• Older parents and parents of older children.
• Parents in higher social grades and who left full-time education at an older
age
• Households where English is not the main language, particularly in relation
to Home School Agreements.
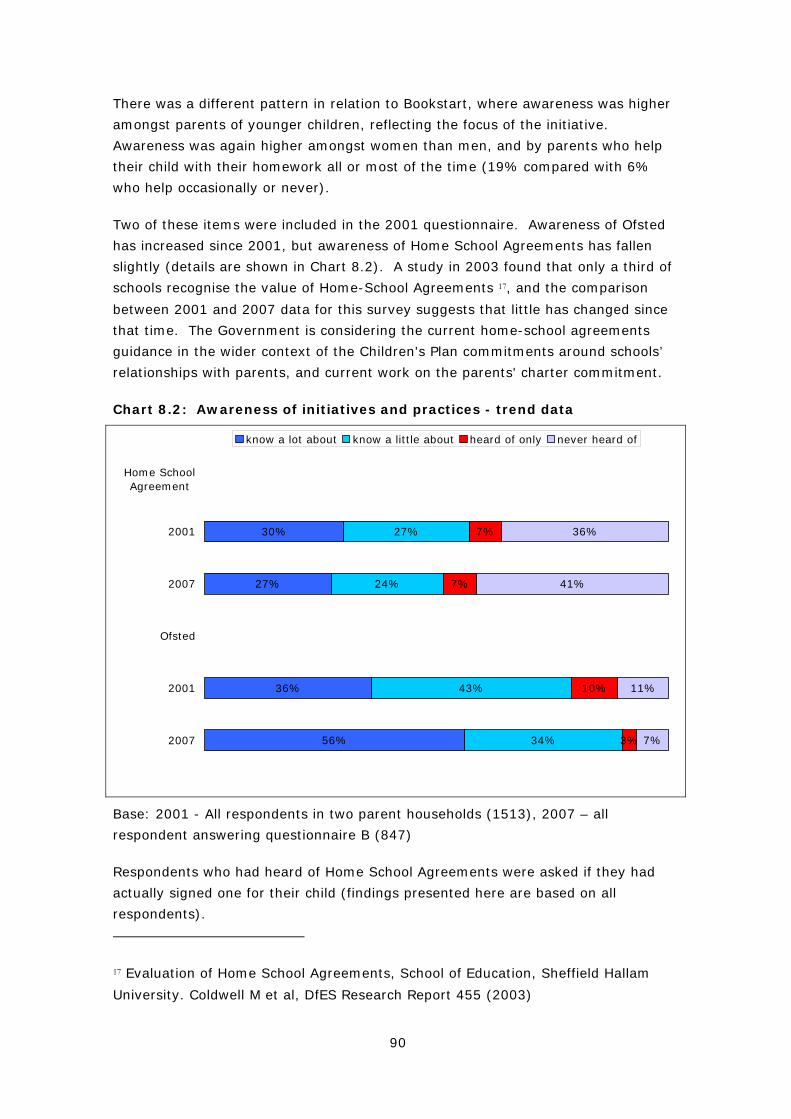
90
There was a different pattern in relation to Bookstart, where awareness was higher
amongst parents of younger children, reflecting the focus of the initiative.
Awareness was again higher amongst women than men, and by parents who help
their child with their homework all or most of the time (19% compared with 6%
who help occasionally or never).
Two of these items were included in the 2001 questionnaire. Awareness of Ofsted
has increased since 2001, but awareness of Home School Agreements has fallen
slightly (details are shown in Chart 8.2). A study in 2003 found that only a third of
schools recognise the value of Home-School Agreements 17, and the comparison
between 2001 and 2007 data for this survey suggests that little has changed since
that time. The Government is considering the current home-school agreements
guidance in the wider context of the Children's Plan commitments around schools’
relationships with parents, and current work on the parents' charter commitment.
Chart 8.2: Awareness of initiatives and practices - trend data
56%
36%
27%
30%
34%
43%
24%
27%
3%
10%
7%
7%
7%
11%
41%
36%
2007
2001
Ofsted
2007
2001
Home SchoolAgreement
know a lot about know a little about heard of only never heard of
Base: 2001 - All respondents in two parent households (1513), 2007 – all
respondent answering questionnaire B (847)
Respondents who had heard of Home School Agreements were asked if they had
actually signed one for their child (findings presented here are based on all
respondents).
17 Evaluation of Home School Agreements, School of Education, Sheffield Hallam
University. Coldwell M et al, DfES Research Report 455 (2003)
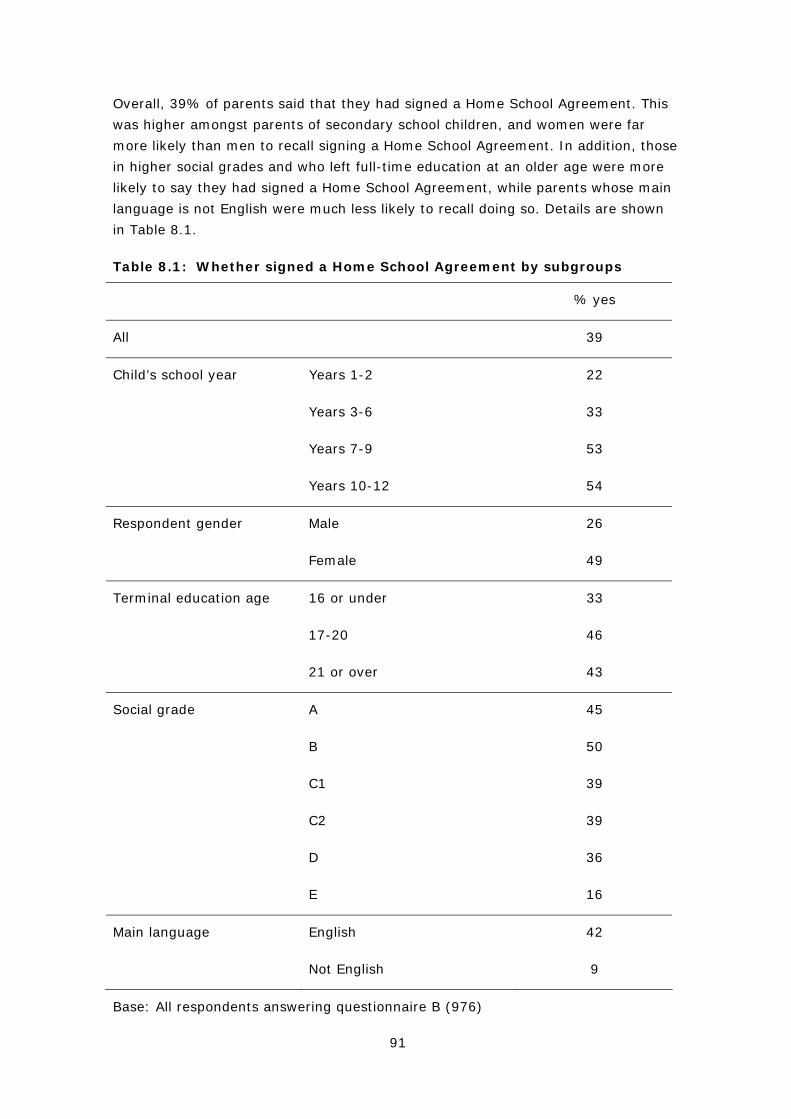
91
Overall, 39% of parents said that they had signed a Home School Agreement. This
was higher amongst parents of secondary school children, and women were far
more likely than men to recall signing a Home School Agreement. In addition, those
in higher social grades and who left full-time education at an older age were more
likely to say they had signed a Home School Agreement, while parents whose main
language is not English were much less likely to recall doing so. Details are shown
in Table 8.1.
Table 8.1: Whether signed a Home School Agreement by subgroups
% yes
All 39
Child’s school year Years 1-2 22
Years 3-6 33
Years 7-9 53
Years 10-12 54
Respondent gender Male 26
Female 49
Terminal education age 16 or under 33
17-20 46
21 or over 43
Social grade A 45
B 50
C1 39
C2 39
D 36
E 16
Main language English 42
Not English 9
Base: All respondents answering questionnaire B (976)

92
9 Special Educational Needs
This report has illustrated various sub-group differences including the impact that
gender, ethnicity, marital status and social class all have on measures of parental
involvement and communication. Some of the strongest impacts and most
consistent differences have, however, been found in respect of parents of children
with Special Educational Needs (SEN).
To set this in context, the SEN Code of Practice (2001)18 acknowledges the pressure
that parents of pupils with SEN can come under. It recognises that parents need
support to gain confidence in making their thoughts known to staff and it
emphasises the importance of parental involvement in their children’s education.
Among its many themes, the Code of Practice aims to promote a climate of co-
operation and participation between parents and school, enabling pupils with SEN
to achieve their potential.
More specifically, the Code of Practice re-enforces the role that ‘partnership’ with
parents plays in promoting an ethos of co-operation:
“Partnership with parents plays a key role in promoting a culture of co-
operation between parents, schools, LEAs and others. This is important
in enabling children and young people with SEN to achieve their
potential” (SEN Code of Practice: section 2.1, p16).
The Code of Practice sets out a number of recommendations around the delivery of
information, advice and support to parents. The growth of parent partnership
services and other advice centres for parents aims to provide support and advice
about SEN, providing information about the options available to parents so that
parents can make appropriate, informed decisions.
In January 2007, some 1.56 million school age pupils had been identified by their
school or local authority as having SEN (19% of the school population) and 3% of
the school population had statements 19. In the survey, over one in 10 (12%)
parents had children with SEN and 6% had children with statements of SEN 20. The
key findings from these groups are summarised below.
18 Special Educational Needs: Code of Practice: 2001 (DfES /581 / 2001)
19 DCSF School Census January 2007
20 Survey measures of SEN always tend to underestimate the true population figure
to some extent as parents are not always aware that their child has a SEN
(particularly if they are not statemented).
93
Parents of children with statements of SEN were more likely to feel very involved in
their child’s education (63% compared with 48% of parents of children who do not
have statements of SEN). Parents of children with SEN were also more likely to
want to increase their involvement in their child’s school life (71% of parents of
children with SEN compared with 65% of parents of children who do not have SEN).
As shown in chapter 3, those who had less involvement with their child’s school life,
were more likely to say they wanted to do more. The same is true amongst parents
of children with SEN: 81% of those who felt not very or not all involved wanted to
do more. However, even amongst those who already felt very or fairly involved,
70% still wanted to do more. The data therefore show a clear desire for parents of
children with SEN to be involved in their children’s schooling.
Parents of children with SEN were also more likely to have children attending
supplementary homework clubs (23% compared with 19% of parents of children
who do not have SEN) and were more likely to say it was extremely important that
their child actually attended (52% compared with 32% of parents of children who
do not have SEN). They also thought it was extremely important to get in touch
with their school when they had a specific request about how their child was getting
on (amongst parents of children with a statement of SEN, 85% thought it was
extremely important compared with 72% amongst parents of children without a
statement of SEN).
Although many parents of children with SEN sought increased involvement, they
were less likely than other parents to feel they had opportunities to have a say in
how their school is run (43% disagreed they had enough opportunities compared
with 26% of parents whose child did not have SEN). The data also suggests that
this particularly appears to be the case for parents of children with SEN but who did
not have statements.
That parents of pupils with SEN perceive themselves to have greater involvement
than average is borne out by the level of communication they have with schools.
They were more likely to have attended meetings requested by the school or by
themselves and to have received written communication. There was, however, a
preference for face-to-face modes of communication.
As well as holding a desire to have increased involvement, parents of children with
SEN also had a desire for clear information. The data show that parents of children
with a statement of SEN were more positive in relation to information that can help
them support their child’s progress. However, parents of children with SEN
(statemented or otherwise) were more negative in relation to jargon in school
information. The survey data also show that parents of children with SEN were also
more likely to have a longstanding illness or disability of their own (17% compared
with 10% of parents of children who do not have SEN).
94
The SEN Code of Practice states that information should be accessible for parents
with learning difficulties and should be parent-friendly. The SEN Code also offers
guidelines on effective communication strategies. These include drawing on
parental knowledge, focusing on children’s strengths, recognising emotions, aiding
understanding and recognising different perspectives and backgrounds. The Code
also recognises the role that parents need to play in the process:
“Parents also have a responsibility to communicate effectively with
professionals to support their children’s education. In working with
schools they should communicate regularly with their child’s school and
alert them to any concerns [and]…fulfil their obligations under home
school agreements..” (SEN Code of Practice: section 2.11, p18).
In summary, the survey has shown that many parents of children with SEN want to
be actively involved in their child’s school life and they want clear information. The
findings suggest that parents of children with SEN who do not have statements may
need more or different types of consultation on their child’s progress. The diversity
of special needs (particularly in relation to statements) may mean that parents will
want appropriate advice and guidance that suits their individual needs.
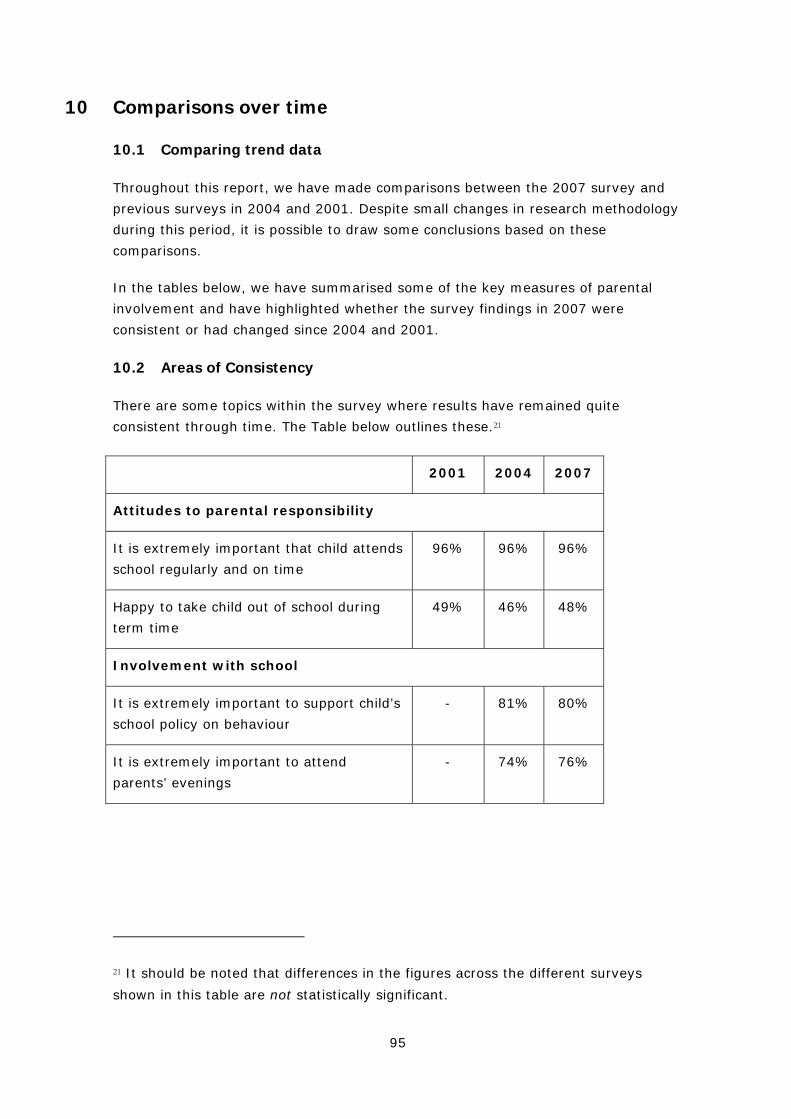
95
10 Comparisons over time
10.1 Comparing trend data
Throughout this report, we have made comparisons between the 2007 survey and
previous surveys in 2004 and 2001. Despite small changes in research methodology
during this period, it is possible to draw some conclusions based on these
comparisons.
In the tables below, we have summarised some of the key measures of parental
involvement and have highlighted whether the survey findings in 2007 were
consistent or had changed since 2004 and 2001.
10.2 Areas of Consistency
There are some topics within the survey where results have remained quite
consistent through time. The Table below outlines these.21
2001 2004 2007
Attitudes to parental responsibility
It is extremely important that child attends
school regularly and on time
96% 96% 96%
Happy to take child out of school during
term time
49% 46% 48%
Involvement with school
It is extremely important to support child’s
school policy on behaviour
- 81% 80%
It is extremely important to attend
parents’ evenings
- 74% 76%
21 It should be noted that differences in the figures across the different surveys
shown in this table are not statistically significant.
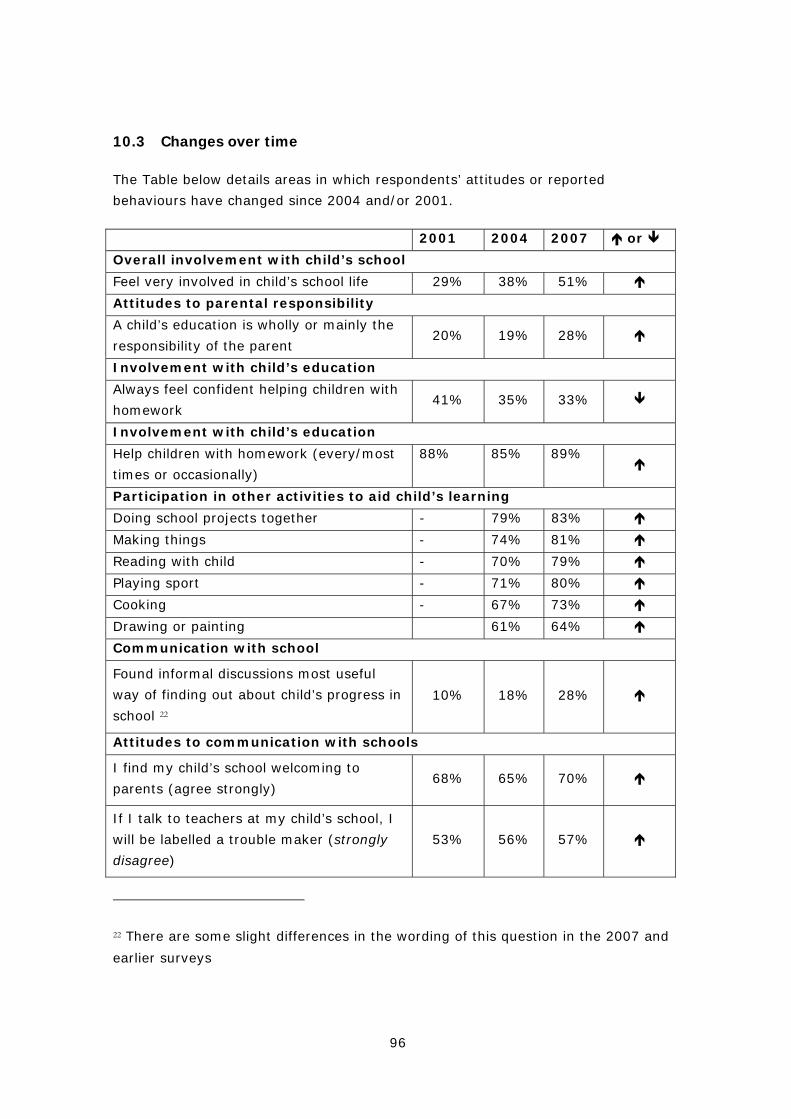
96
10.3 Changes over time
The Table below details areas in which respondents’ attitudes or reported
behaviours have changed since 2004 and/or 2001.
2001 2004 2007 or
Overall involvement with child’s school
Feel very involved in child’s school life 29% 38% 51%
Attitudes to parental responsibility
A child’s education is wholly or mainly the
responsibility of the parent 20% 19% 28%
Involvement with child’s education
Always feel confident helping children with
homework 41% 35% 33%
Involvement with child’s education
Help children with homework (every/most
times or occasionally)
88% 85% 89%
Participation in other activities to aid child’s learning
Doing school projects together - 79% 83%
Making things - 74% 81%
Reading with child - 70% 79%
Playing sport - 71% 80%
Cooking - 67% 73%
Drawing or painting 61% 64%
Communication with school
Found informal discussions most useful
way of finding out about child’s progress in
school 22
10% 18% 28%
Attitudes to communication with schools
I find my child’s school welcoming to
parents (agree strongly) 68% 65% 70%
If I talk to teachers at my child’s school, I
will be labelled a trouble maker (strongly
disagree)
53% 56% 57%
22 There are some slight differences in the wording of this question in the 2007 and
earlier surveys
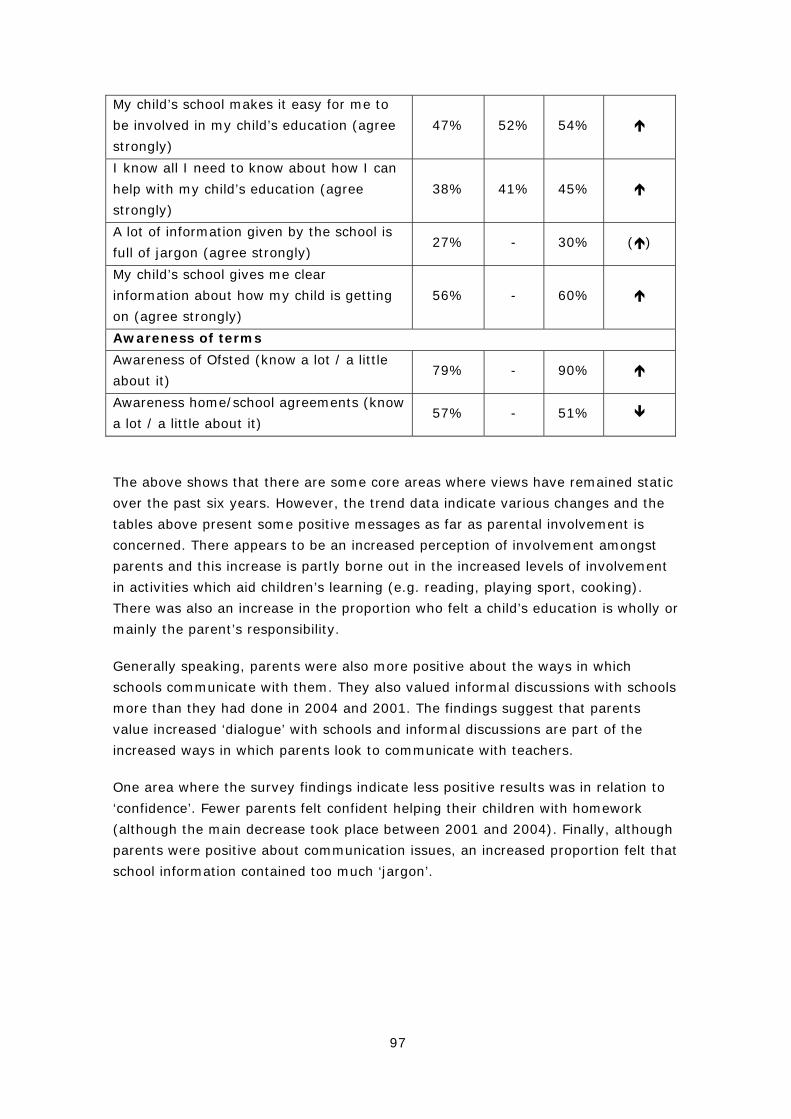
97
My child’s school makes it easy for me to
be involved in my child’s education (agree
strongly)
47% 52% 54%
I know all I need to know about how I can
help with my child’s education (agree
strongly)
38% 41% 45%
A lot of information given by the school is
full of jargon (agree strongly) 27% - 30% ( )
My child’s school gives me clear
information about how my child is getting
on (agree strongly)
56% - 60%
Awareness of terms
Awareness of Ofsted (know a lot / a little
about it) 79% - 90%
Awareness home/school agreements (know
a lot / a little about it) 57% - 51%
The above shows that there are some core areas where views have remained static
over the past six years. However, the trend data indicate various changes and the
tables above present some positive messages as far as parental involvement is
concerned. There appears to be an increased perception of involvement amongst
parents and this increase is partly borne out in the increased levels of involvement
in activities which aid children’s learning (e.g. reading, playing sport, cooking).
There was also an increase in the proportion who felt a child’s education is wholly or
mainly the parent’s responsibility.
Generally speaking, parents were also more positive about the ways in which
schools communicate with them. They also valued informal discussions with schools
more than they had done in 2004 and 2001. The findings suggest that parents
value increased ‘dialogue’ with schools and informal discussions are part of the
increased ways in which parents look to communicate with teachers.
One area where the survey findings indicate less positive results was in relation to
‘confidence’. Fewer parents felt confident helping their children with homework
(although the main decrease took place between 2001 and 2004). Finally, although
parents were positive about communication issues, an increased proportion felt that
school information contained too much ‘jargon’.
98
11 Implications for Policy and Further Research
This report has highlighted a number of findings which have important policy
implications, for example, in providing evidence about what types of communication
and involvement parents value most. There are also various considerations for
further research and these have also been summarised below:
• The survey confirms that many parents experience multiple disadvantage (eg.
internet access is lower amongst disadvantaged groups, parents of SEN pupils
are more likely to have a health problem or disability, lone parents tended to
leave school earlier and be in lower social grades). As a result, it is important to
understand the full range of issues faced by parents when trying to
communicate better and encourage participation.
• Parents feel increasingly involved in their child’s school life, reflecting an
increase in parental participation in activities with children. While involvement
with homework and school-based activities show little change, parents are now
more likely to take part in wider activities, such as reading, cooking, making
things and playing sport. Parents today are also more likely to see education as
their own responsibility rather than the school’s, and this could heighten their
sense of involvement.
• The desire to get more involved tends to be stronger amongst disadvantaged
groups, e.g. those in lower social grades, ethnic minorities, respondents with a
long-term illness or disability. Further work may be needed to understand how
to get these parents more involved and understand their barriers to
involvement. For instance, the survey (and previous surveys in 2004 and 2001)
have shown that work commitments are a significant barrier for some parents.
Other research (e.g. Welsh et al, 2004 23) has shown that parents may lack the
skill and confidence to be involved with their children’s learning.
• Despite positive changes on a number of issues, the proportion that would be
happy to take their children out of school remains similar to previous years, and
responses are not affected by the level of parental involvement. This suggests
that this may not be seen as an important issue by parents, and that there is
scope for further information to communicate the negative consequences to
parents).
23 Welsh, E, Buchanan, A, Flouri, E and Lewis J (2004): Involved fathering and child
well being. Father’s involvement with secondary school age children. London:
National Children’s Bureau for JRF.

99
• Informal discussions are now seen as the most useful method of communication
with schools, particularly by those who are more involved. This is therefore a
good way of developing relationships further with parents who are already more
involved.
• Methods other than face-to-face contact were more popular with parents who
are currently less involved, so these methods could be focused on these
parents. Specifically, email was more popular with men (including non-resident
parents) and those in full-time work, while lone parents favoured the telephone
as a mode of contact.
• Communication with schools is viewed positively, and parents feel well
informed. One group that was more negative was parents of children who had
been identified as having SEN but who had not been statemented. It is possible
that these parents need more consultation on their child’s progress.
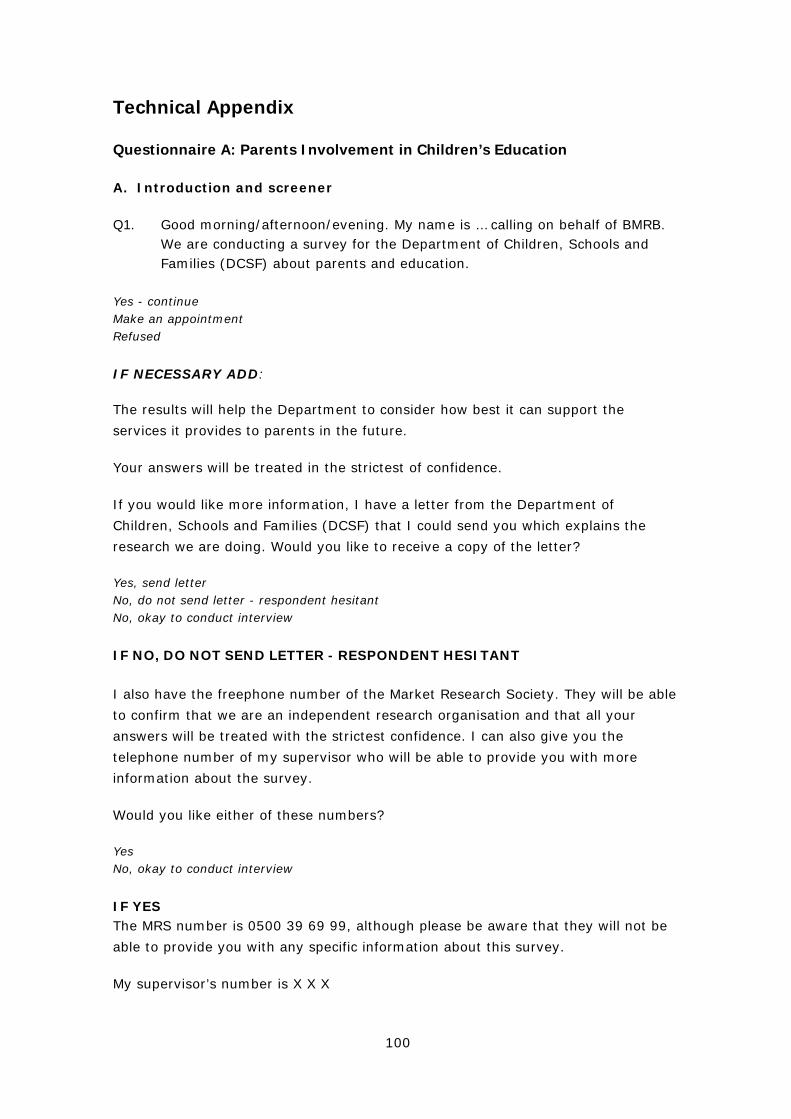
100
Technical Appendix
Questionnaire A: Parents Involvement in Children’s Education
A. Introduction and screener
Q1. Good morning/afternoon/evening. My name is … calling on behalf of BMRB. We are conducting a survey for the Department of Children, Schools and Families (DCSF) about parents and education.
Yes - continue Make an appointment Refused
IF NECESSARY ADD: The results will help the Department to consider how best it can support the
services it provides to parents in the future.
Your answers will be treated in the strictest of confidence.
If you would like more information, I have a letter from the Department of
Children, Schools and Families (DCSF) that I could send you which explains the
research we are doing. Would you like to receive a copy of the letter?
Yes, send letter No, do not send letter - respondent hesitant No, okay to conduct interview
IF NO, DO NOT SEND LETTER - RESPONDENT HESITANT I also have the freephone number of the Market Research Society. They will be able
to confirm that we are an independent research organisation and that all your
answers will be treated with the strictest confidence. I can also give you the
telephone number of my supervisor who will be able to provide you with more
information about the survey.
Would you like either of these numbers?
Yes No, okay to conduct interview
IF YES The MRS number is 0500 39 69 99, although please be aware that they will not be
able to provide you with any specific information about this survey.
My supervisor’s number is X X X
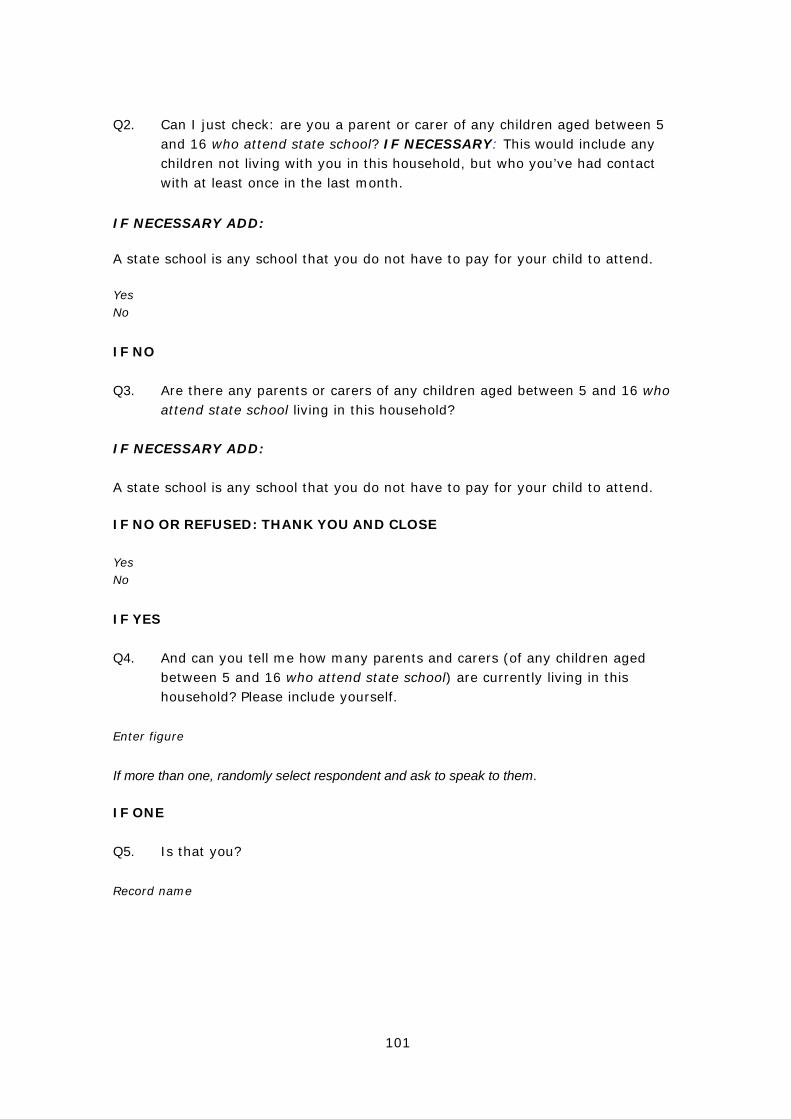
101
Q2. Can I just check: are you a parent or carer of any children aged between 5 and 16 who attend state school? IF NECESSARY: This would include any children not living with you in this household, but who you’ve had contact with at least once in the last month.
IF NECESSARY ADD: A state school is any school that you do not have to pay for your child to attend.
Yes No
IF NO Q3. Are there any parents or carers of any children aged between 5 and 16 who
attend state school living in this household? IF NECESSARY ADD: A state school is any school that you do not have to pay for your child to attend.
IF NO OR REFUSED: THANK YOU AND CLOSE Yes No
IF YES Q4. And can you tell me how many parents and carers (of any children aged
between 5 and 16 who attend state school) are currently living in this household? Please include yourself.
Enter figure
If more than one, randomly select respondent and ask to speak to them.
IF ONE Q5. Is that you? Record name
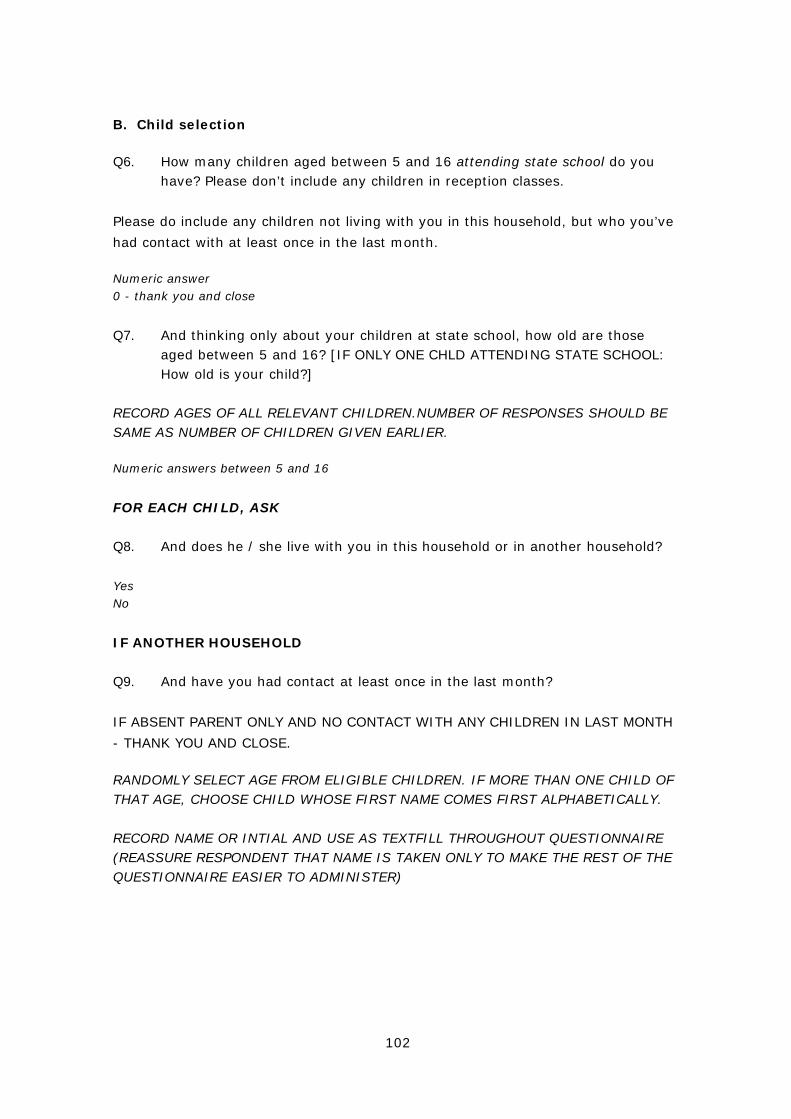
102
B. Child selection
Q6. How many children aged between 5 and 16 attending state school do you have? Please don’t include any children in reception classes.
Please do include any children not living with you in this household, but who you’ve
had contact with at least once in the last month.
Numeric answer 0 - thank you and close
Q7. And thinking only about your children at state school, how old are those aged between 5 and 16? [IF ONLY ONE CHLD ATTENDING STATE SCHOOL: How old is your child?]
RECORD AGES OF ALL RELEVANT CHILDREN.NUMBER OF RESPONSES SHOULD BE SAME AS NUMBER OF CHILDREN GIVEN EARLIER. Numeric answers between 5 and 16
FOR EACH CHILD, ASK Q8. And does he / she live with you in this household or in another household? Yes No
IF ANOTHER HOUSEHOLD Q9. And have you had contact at least once in the last month?
IF ABSENT PARENT ONLY AND NO CONTACT WITH ANY CHILDREN IN LAST MONTH
- THANK YOU AND CLOSE.
RANDOMLY SELECT AGE FROM ELIGIBLE CHILDREN. IF MORE THAN ONE CHILD OF THAT AGE, CHOOSE CHILD WHOSE FIRST NAME COMES FIRST ALPHABETICALLY. RECORD NAME OR INTIAL AND USE AS TEXTFILL THROUGHOUT QUESTIONNAIRE (REASSURE RESPONDENT THAT NAME IS TAKEN ONLY TO MAKE THE REST OF THE QUESTIONNAIRE EASIER TO ADMINISTER)

103
IF NOT ABSENT PARENT ONLY Q10. And which of these phrases best describes the child’s household? READ OUT A two parent household A household with one parent and one partner A single parent household A household with two guardians and neither are the child’s parents A household with only one guardian, who is not the child’s parent
ASK ALL Q11. How involved do you personally feel in <child’s> school life? (Read out) Very involved Fairly involved Not very involved Not at all involved Don’t know
IF TWO PARENT HOUSEHOLD OR ONE PARENT AND ONE PARTNER OR TWO
GUARDIANS WHO ARE NOT THE CHILDS PARENTS AT Q9
Q12. And overall, would you say that you or your partner is more involved in <child’s>’s school life?
DO NOT READ OUT. PROBE - AND IS THAT MUCH MORE, OR A LITTLE MORE? I am much more involved I am a little more involved Equally involved (Do not read out) My partner is a little more involved My partner is much more involved

104
C. Childs details
Thank you for taking part in this questionnaire about <child>’s education. Thinking about <child>,
Q13. What School Year is <child> in? (Use age to take a best guess if unsure) Reception(Age 4 or 5) Year 1 (Age 5 or 6) Year 2 (Age 6 or 7) Year 3 (Age 7 or 8) Year 4 (Age 8 or 9) Year 5 (Age 9 or 10) Year 6 (Age 10 or 11) Year 7 (Age 11 or 12) Year 8 ( Age 12 or 13) Year 9 (Age 13 or 14) Year 10 (Age 14 or 15) Year 11 (Age 15 or 16) Year 12 (Age 16 o 17) Don’t Know
ASK IF CHILD AGED 11-12 AND DON’T KNOW SCHOOL YEAR. Q14. Is <child> at primary or secondary school? Secondary Middle School Primary
ASK ALL Q15. And is <child> a boy or a girl? (Ask only if not obvious or already
mentioned) Male Female
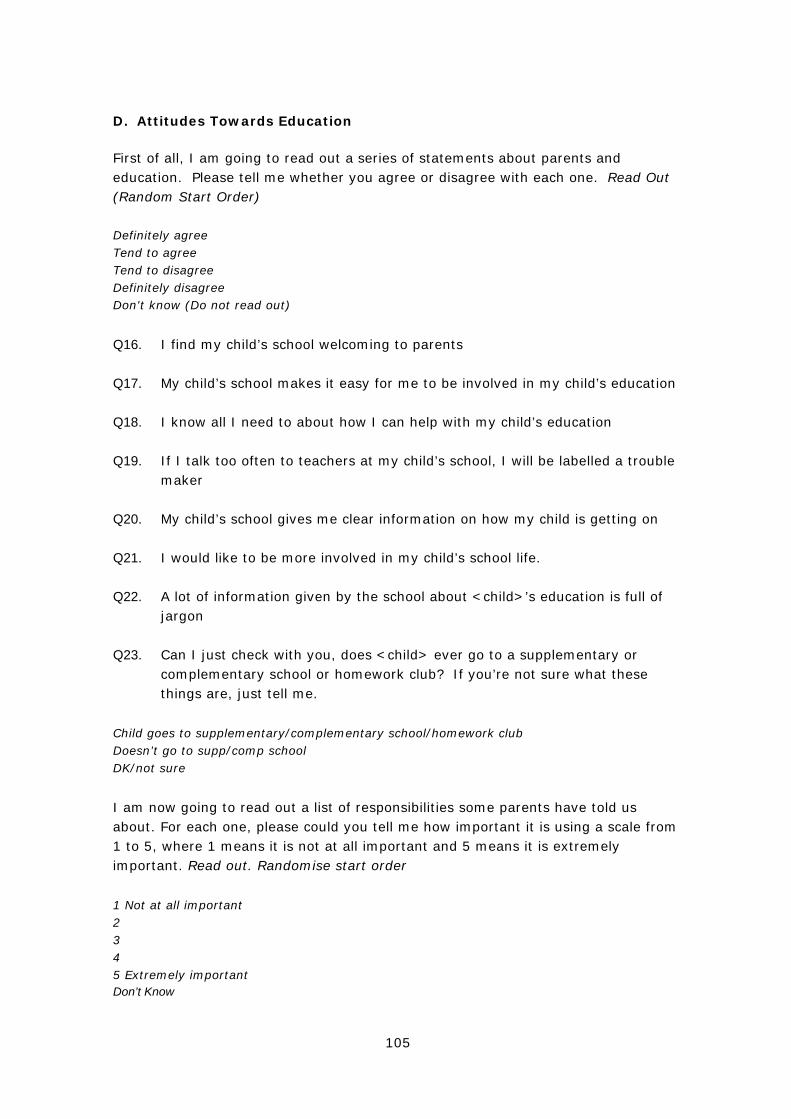
105
D. Attitudes Towards Education
First of all, I am going to read out a series of statements about parents and education. Please tell me whether you agree or disagree with each one. Read Out (Random Start Order) Definitely agree Tend to agree Tend to disagree Definitely disagree Don't know (Do not read out)
Q16. I find my child’s school welcoming to parents Q17. My child’s school makes it easy for me to be involved in my child’s education Q18. I know all I need to about how I can help with my child’s education Q19. If I talk too often to teachers at my child’s school, I will be labelled a trouble
maker Q20. My child’s school gives me clear information on how my child is getting on Q21. I would like to be more involved in my child’s school life. Q22. A lot of information given by the school about <child>’s education is full of
jargon Q23. Can I just check with you, does <child> ever go to a supplementary or
complementary school or homework club? If you’re not sure what these things are, just tell me.
Child goes to supplementary/complementary school/homework club Doesn’t go to supp/comp school DK/not sure
I am now going to read out a list of responsibilities some parents have told us about. For each one, please could you tell me how important it is using a scale from 1 to 5, where 1 means it is not at all important and 5 means it is extremely important. Read out. Randomise start order 1 Not at all important 2 3 4 5 Extremely important Don’t Know

106
Q24. Making sure your child attends school regularly and on time Q25. Helping your child with homework Q26. Attending parents evenings, tutor days and other parent-teacher contact Q27. Getting in touch with the school when you have a specific request about how
<child> is getting on Q28. Supporting schools’ policies on children’s behaviour in school IF ‘CHILD GOES TO SUPPLEMENTARY/COMPLEMENTARY SCHOOL/HOMEWORK CLUB’ AT Q23 Q29. Making sure your child attends a supplementary, complementary school or
homework club Q30. Sometimes parents take their child out of school during term time, for
example, to go on a family holiday or extended family break. Would you be happy to do this yourself?
Yes No Depends on circumstances (Do not read out) Don’t Know
Q31. Thinking in general about children and education, would you say that a child’s education is: Read out. Reverse order in alternate interviews.
Wholly the parent’s responsibility Mainly the parent’s responsibility Mainly the school’s responsibility Wholly the school’s responsibility Both equally (Do not read out)
Don’t Know (Do not read out)
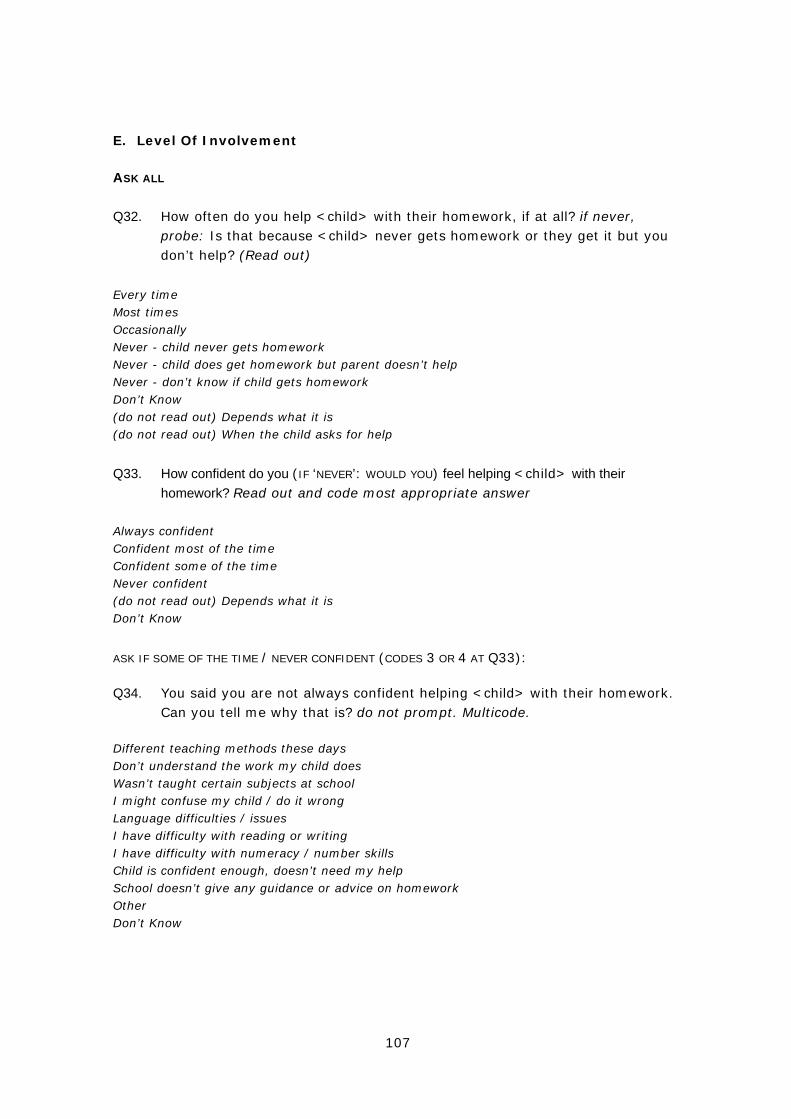
107
E. Level Of Involvement
ASK ALL Q32. How often do you help <child> with their homework, if at all? if never,
probe: Is that because <child> never gets homework or they get it but you don’t help? (Read out)
Every time Most times Occasionally Never - child never gets homework Never - child does get homework but parent doesn’t help Never - don’t know if child gets homework Don’t Know (do not read out) Depends what it is (do not read out) When the child asks for help
Q33. How confident do you (IF ‘NEVER’: WOULD YOU) feel helping <child> with their homework? Read out and code most appropriate answer
Always confident Confident most of the time Confident some of the time Never confident (do not read out) Depends what it is Don’t Know
ASK IF SOME OF THE TIME / NEVER CONFIDENT (CODES 3 OR 4 AT Q33):
Q34. You said you are not always confident helping <child> with their homework. Can you tell me why that is? do not prompt. Multicode.
Different teaching methods these days Don’t understand the work my child does Wasn’t taught certain subjects at school I might confuse my child / do it wrong Language difficulties / issues I have difficulty with reading or writing I have difficulty with numeracy / number skills Child is confident enough, doesn’t need my help School doesn’t give any guidance or advice on homework Other Don’t Know
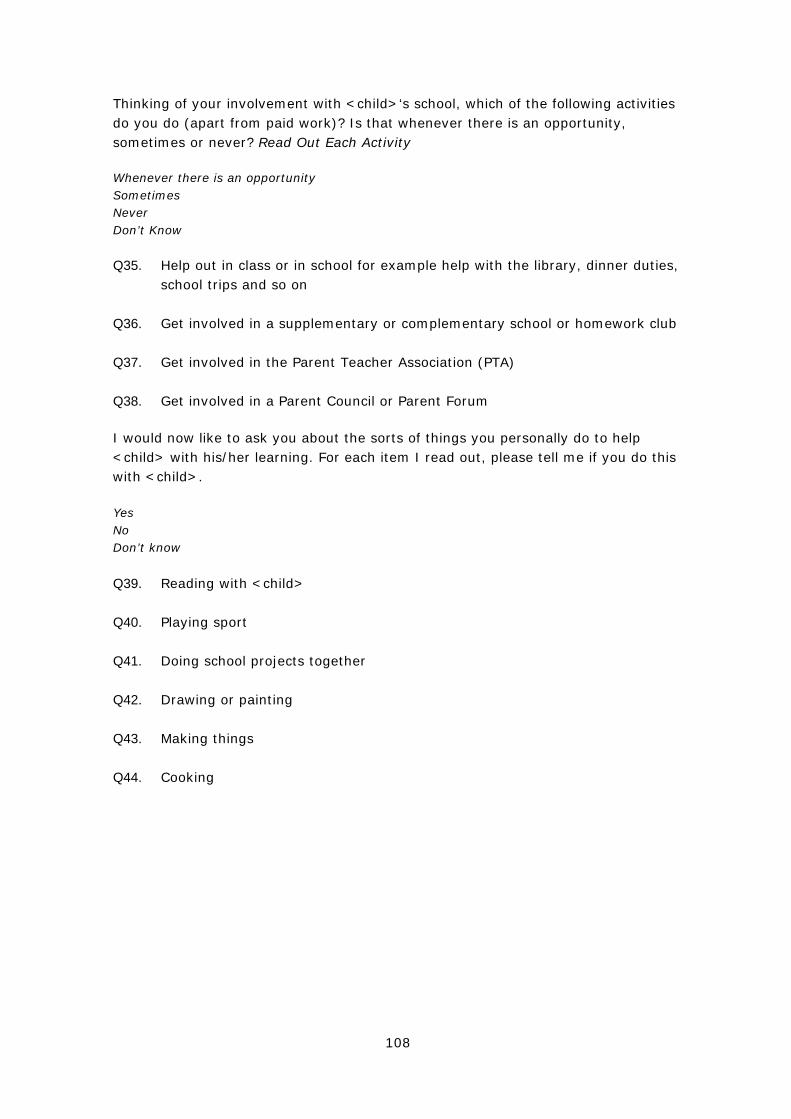
108
Thinking of your involvement with <child>‘s school, which of the following activities do you do (apart from paid work)? Is that whenever there is an opportunity, sometimes or never? Read Out Each Activity
Whenever there is an opportunity Sometimes Never Don’t Know
Q35. Help out in class or in school for example help with the library, dinner duties, school trips and so on
Q36. Get involved in a supplementary or complementary school or homework club Q37. Get involved in the Parent Teacher Association (PTA) Q38. Get involved in a Parent Council or Parent Forum
I would now like to ask you about the sorts of things you personally do to help <child> with his/her learning. For each item I read out, please tell me if you do this with <child>. Yes No Don’t know
Q39. Reading with <child> Q40. Playing sport Q41. Doing school projects together Q42. Drawing or painting Q43. Making things Q44. Cooking
109
Q45. Apart from the things I’ve just mentioned, do you do anything else with
<child> to help him / her with his / her learning? If Yes: What else do you do? Do not read out. Code as many as apply.
Arrange or pay for tuition in particular subjects (eg English, maths, languages, music) Buy books Buy educational computer software Discuss news / current events together Do homework with him / her Do outdoor activities / field trips together Give encouragement Play games Set additional homework or tests Supervise child’s access to internet Take him / her to participate in sporting activities/classes e.g. swimming, football, gymnastics, ballet, judo etc Take to museums / art galleries Other No, don’t do anything else to help with learning Don’t Know Refused
Q46. Is there anything that stops you getting more involved with <child>‘s school
life? Do not prompt. If says ‘lack of time’, code it but explicitly ask ‘what else, apart from lack of time?’ Probe: in what way?
Work commitments Specific mention of shift work Not sure what the school wants me to do Language difficulties Transport problems (availability / cost etc) Confidence / don’t feel qualified / don’t have any skills they need Child does not want me to Child does not tell me what is happening at school Demands / needs of other children / Childcare difficulties Partner / other parent or carer takes the responsibility Lack of time No specific barriers Don’t live with child Other (specify)
110
F. Communication With School
Next I would like you to think about communication with <child>’s school.
Can you tell me whether you personally have talked about how your child is doing
in class
with <child>’s teachers…. Read out
Q47. At regular events such as Parents’ evenings, Parents Meetings or Review Days arranged by the school
Q48. At other meetings requested by the school
Q49. At meetings requested by the parent
Q50. Through written communication like letters or email
Yes No
Q51. We find that some parents are more confident than others when talking with teachers. How confident do you personally feel when talking to teachers at <child>’s school? Read Out
Very confident Fairly confident Not very confident Not at all confident (do not read out) Depends on teacher (do not read out) Depends on subject (do not read out) I don’t talk to teachers Don’t Know
Q52. Thinking of ALL the different ways in which you could get information, which is the most useful way for you to find out about how <CHILD> is getting on at school? Code one only. Do not read out precodes.
Parents’ evenings Talking to school staff informally, such as in the playground Other formal meetings with teachers School reports / Test results Notes or letters from school that child brings home or other written communication Child tells me or I asks child The school website Emails Text messages Phone calls from the school Partner / wife / husband tells me Don’t know Other (specify)
111
Q53. And which ways of communicating information do you feel should be used more by <child’s> school? Code as many as apply.Do not read out precodes.
Parents’ evenings Talking to school staff informally, such as in the playground Other formal meetings with teachers School reports / Test results Notes or letters from school that child brings home or other written communication Child tells me or I asks child The school website Emails Text messages Phone calls from the school Partner / wife / husband tells me Don’t know Other (specify)
Q54. In the future, all schools will publish something called a School Profile. It’s a new annual report about how well schools perform and other school information. Have you heard of it before now?
Yes No
IF YES AT Q54 CONTINUE. OTHERS GO TO Q62
Q55. How did you find out about the School Profile? Do not read out. Code as many as apply.
School sent the paper report via my child I came across it online when looking at schools websites Through a web search engine (Google, Ask, Yahoo etc) Another parent told me about it I heard about it in the news or local media Through work (e.g. respondent is a teacher) Other (specify) Don’t remember
Q56. Have you actually read any School Profiles? Yes No
IF YES AT Q56 . OTHER GO TO Q62
Q57. How many? If necessary - just an approximate figure is fine Enter figure
112
Q58. And thinking back to when you read the report/these reports, would you say you (if more than one: generally)…
read only a little read about half read most of it read nearly all or all of it
IF HAVE READ ANY AMOUNT CONTINUE, OTHER GO TO Q62
Q59. As a reminder, the purpose of School Profiles is to provide parents with information about a school and how it is performing. So thinking now about School Profiles and their purpose, can you tell me, firstly, what you think are good about School Profiles?
(Open ended)
Q60. And, secondly, how would you like to see School Profile publications
improved? (Open ended)
Q61. And overall, how helpful would you say School Profile reports are to you? (Read out)
Very helpful Quite helpful Not very helpful Not at all helpful
To what extent do you agree or disagree with the following statements? (Read out) Strongly agree Agree Neither agree nor disagree Disagree Strongly disagree Don’t know Did not choose the school (Q66 only)
Q62. The school gives me enough information for me to judge how far <child> is fulfilling his / her potential
Q63. Information from the school helps me understand how I can support
<child>’s progress Q64. I would know exactly who to contact at the school if I had any concerns
about <child>
113
Q65. If the school told me <child> was not making good progress, I’m very confident that my involvement could help.
Q66. When I was choosing a school for <child>, I felt well informed about my options
RANDOMISE ORDER
Q67. <Child> tends to do well in subjects involving reading and writing Q68. <Child> tends to do well in number based subjects
Q69. To let you know how <child> is doing, schools write formal reports at certain points in the year. How often does <child> get these from school? Do not read out
Daily Weekly More often than weekly, but less than monthly Monthly Every half term (6 times a year) 4 or 5 times a year Every term (3 times a year) Twice a year Once a year Less often Never Don’t know
Q70. And how often would you ideally like to be able to see how well <child> is
doing at school? Do not read out As and when I want to Daily Weekly More often than weekly, but less than monthly Monthly Every half term (6 times a year) 4 or 5 times a year Every term (3 times a year) Twice a year Once a year Less often Never Don’t know

114
Q71. And in addition to any reports that <child> currently gets, if <child>’s school was able to provide a secure website where you could see how well <child> was doing with the most up to date information, how appealing would this be to you? Read out
Very appealing Quite appealing Not very appealing Not at all appealing Don’t know (Do not read out)
115
G. Demographics
Thank you. Now I need to ask you a few more questions about yourself to make sure we get a good spread of opinions.
Q72. What was your age last birthday? enter age
Q73. Are you ... (read out list) Married / Living as married In a Civil Partnership Single / Engaged Widowed Separated Divorced Refused
Q74. At what age did you personally finish your full time education? 14 or under 15 16 17 18 19 20 21 - 23 24 or more Still studying Refused
Q75. Which of these best describes your employment at the moment, if any? (read out)
Working in a paid job more than 29 hours a week Working in a paid job between 8 and 29 hours a week Working in a paid job less than 8 hours a week Self employed Not in paid employment / looking after house or home Full time student at school Full time student at university / college Unemployed Retired from paid employment Don't Know

116
Q76. Do you have access to the Internet at all? interviewer: if yes probe for where access, home, work, school / college or elsewhere
Home access to internet Access to internet at work Access to internet at school/college Access to internet elsewhere No access to internet Don't Know
Q77. Do you regard yourself as belonging to any particular religion?
INTERVIEWER, IF YES: To what religious faith would you say you belong? No / None Christian (Church of England, Catholic, Protestant, and all other Christian denominations) Buddhist Hindu Jewish Islam / Muslim Sikh Other Refused
Q78. Next, please choose one answer from this list to indicate your cultural background? read out
White Mixed Asian or Asian British Black or Black British Chinese Some other background Don't Know Refused
IF WHITE probe for specific background: white White British White Irish Traveller of Irish heritage Gypsy / Roma Any other white background Don't Know
117
IF MIXED ETHNIC GROUP probe for specific background: mixed
White and Black Caribbean White and Black African White and Asian Any other mixed background Don't Know
IF ASIAN OR ASIAN BRITISH probe for specific background: Asian
Indian Pakistani Bangladeshi Any other Asian background Don't Know
IF BLACK OR BLACK BRITISH probe for specific background: black
Black Caribbean Black African Any other black background Don't Know
Q79. Is English the first or main language of your household?
Yes No IF YES Q80. Is English the only language or are other languages spoken?
yes, English only yes, English is first language but other languages also spoken no, another language is household’s first language household is bi-lingual don't know refused
ASK ALL
118
Q81. Do you provide any care, help or support for anyone because of illness,
disability, old age or infirmity of any kind? [qdisot] This does not include caring as part of a paid job.
Yes No Don't know Refused
Q82. Do you have a longstanding illness, disability or infirmity? by ‘longstanding’ I
mean anything that has troubled you over a period of at least 12 months or that it likely to affect you over a period of at least 12 months?
Yes No Don't know Refused
Q83. And does <child> have a longstanding illness, disability or infirmity? (if necessary: by ‘longstanding’ I mean anything that has troubled <child> over a period of at least 12 months or that it likely to affect <child> over a period of at least 12 months?
Yes No Don't know Refused
ASK ALL Q84. Has <child> been identified as having special educational needs? Yes No Don't Know Refused
ASK IF YES AT Q84 Q85. Does <child> have a Statement of Special Educational Needs? Yes No Don't Know Refused

119
Q86. What type of school does <child> attend? Mainstream school Special school Don't Know Refused
Q87. Could you tell me how many fixed telephone lines are available for incoming telephone calls to your household? (PLEASE ONLY INCLUDE THOSE WITH DIFFERENT NUMBERS AND DO NOT INCLUDE MOBILE PHONES.)
1..10 DK REF
ASK ALL Q88. Social Grade Establish who in the household is the chief income earner and code social grade for the chief income earner. A B C1 C2 D E Refused
Q89. Please can you give me your full postcode? Enter
Q90. Would you be willing for the Department of Children, Schools and Families (DCSF), or someone working on behalf of the Department, to contact you again in the future as a follow-up to this survey?
Yes No
THANK AND CLOSE INTERVIEWER: RECORD WHETHER SUPPORTED TRANSLATION USED
120
Questionnaire B: Parents Involvement in Children’s Education
A. Introduction and screener
Q1. Good morning/afternoon/evening. My name is … calling on behalf of BMRB. We are conducting a survey for the Department of Children, Schools and Families (DCSF) about parents and education.
Yes - continue Make an appointment Refused
If necessary add: The results will help the Department to consider how best it can support the
services it provides to parents in the future.
Your answers will be treated in the strictest of confidence.
If you would like more information, I have a letter from the Department of
Children, Schools and Families (DCSF) that I could send you which explains the
research we are doing. Would you like to receive a copy of the letter?
Yes, send letter No, do not send letter - respondent hesitant No, okay to conduct interview
IF NO, DO NOT SEND LETTER - RESPONDENT HESITANT I also have the freephone number of the Market Research Society. They will be able
to confirm that we are an independent research organisation and that all your
answers will be treated with the strictest confidence. I can also give you the
telephone number of my supervisor who will be able to provide you with more
information about the survey.
Would you like either of these numbers?
Yes No, okay to conduct interview
IF YES The MRS number is 0500 39 69 99, although please be aware that they will not be
able to provide you with any specific information about this survey.
My supervisor’s number is X X X
121
Q2. Can I just check: are you a parent or carer of any children aged between 5 and 16 who attend state school? IF NECESSARY: This would include any children not living with you in this household, but who you’ve had contact with at least once in the last month.
If necessary add: A state school is any school that you do not have to pay for your child to attend.
Yes No
IF NO Q3. Are there any parents or carers of any children aged between 5 and 16 who
attend state school living in this household? If necessary add: A state school is any school that you do not have to pay for your child to attend.
IF NO OR REFUSED: THANK YOU AND CLOSE Yes No
IF YES Q4. And can you tell me how many parents and carers (of any children aged
between 5 and 16 who attend state school) are currently living in this household? Please include yourself.
Enter figure
If more than one, randomly select respondent and ask to speak to them.
IF ONE Q5. Is that you? Record name
122
B. Child selection
Q6. How many children aged between 5 and 16 attending state school do you have? Please don’t include any children in reception classes.
Please do include any children not living with you in this household, but who you’ve
had contact with at least once in the last month.
Numeric answer 0 - thank you and close
Q7. And thinking only about your children at state school, how old are those aged between 5 and 16? [IF ONLY ONE CHLD ATTENDING STATE SCHOOL: How old is your child?]
RECORD AGES OF ALL RELEVANT CHILDREN.NUMBER OF RESPONSES SHOULD BE SAME AS NUMBER OF CHILDREN GIVEN EARLIER. Numeric answers between 5 and 16
FOR EACH CHILD ASK Q8. And does he / she live with you in this household or in another household? Yes No
IF ANOTHER HOUSEHOLD Q9. And have you had contact at least once in the last month?
IF ABSENT PARENT ONLY AND NO CONTACT WITH ANY CHILDREN IN LAST MONTH
- THANK YOU AND CLOSE.
RANDOMLY SELECT AGE FROM ELIGIBLE CHILDREN. IF MORE THAN ONE CHILD OF THAT AGE, CHOOSE CHILD WHOSE FIRST NAME COMES FIRST ALPHABETICALLY. RECORD NAME OR INTIAL AND USE AS TEXTFILL THROUGHOUT QUESTIONNAIRE (REASSURE RESPONDENT THAT NAME IS TAKEN ONLY TO MAKE THE REST OF THE QUESTIONNAIRE EASIER TO ADMINISTER)

123
IF NOT ABSENT PARENT ONLY Q10. And which of these phrases best describes the child’s household? READ OUT A two parent household A household with one parent and one partner A single parent household A household with two guardians and neither are the child’s parents A household with only one guardian, who is not the child’s parent
ASK ALL Q11. How involved do you personally feel in <child’s> school life? (Read out) Very involved Fairly involved Not very involved Not at all involved Don’t know
IF TWO PARENT HOUSEHOLD OR ONE PARENT AND ONE PARTNER OR TWO
GUARDIANS WHO ARE NOT THE CHILDS PARENTS AT Q9
Q12. And overall, would you say that you or your partner is more involved in <child’s>’s school life?
DO NOT READ OUT. PROBE - AND IS THAT MUCH MORE, OR A LITTLE MORE? I am much more involved I am a little more involved Equally involved (DO NOT READ OUT) My partner is a little more involved My partner is much more involved

124
C. Childs details
Thank you for taking part in this questionnaire about <child>’s education. Thinking about <child>,
Q13. What School Year is <child> in? (Use age to take a best guess if unsure) Reception(Age 4 or 5) Year 1 (Age 5 or 6) Year 2 (Age 6 or 7) Year 3 (Age 7 or 8) Year 4 (Age 8 or 9) Year 5 (Age 9 or 10) Year 6 (Age 10 or 11) Year 7 (Age 11 or 12) Year 8 ( Age 12 or 13) Year 9 (Age 13 or 14) Year 10 (Age 14 or 15) Year 11 (Age 15 or 16) Year 12 (Age 16 or 17) Don’t Know
ASK IF CHILD AGED 11-12 AND DON’T KNOW SCHOOL YEAR: Q14. Is <child> at primary or secondary school? Secondary Middle School Primary
ASK ALL Q15. And is <child> a boy or a girl? (Ask only if not obvious or already
mentioned) Male Female

125
D. Attitudes Towards Education
Q16. First of all, I am going to read out a series of statements about parents and education. Please tell me whether you agree or disagree with each one. Read Out (Random Start Order)
Definitely agree Tend to agree Tend to disagree Definitely disagree Don't know (Do not read out)
Q17. I find my child’s school welcoming to parents Q18. My child’s school makes it easy for me to be involved in my child’s education Q19. I know all I need to about how I can help with my child’s education Q20. If I talk too often to teachers at my child’s school, I will be labelled a trouble
maker Q21. A lot of information given by the school about <child>’s education is full of
jargon
I am now going to read out a list of responsibilities some parents have told us about. For each one, please could you tell me how important it is using a scale from 1 to 5, where 1 means it is not at all important and 5 means it is extremely important. Read out. Randomise start order 1 Not at all important 2 3 4 5 Extremely important Don’t Know
Q22. Making sure your child attends school regularly and on time Q23. Helping your child with homework Q24. Attending parents evenings, tutor days and other parent-teacher contact Q25. Supporting schools’ policies on children’s behaviour in school

126
Q26. Thinking in general about children and education, would you say that a child’s education is … Read out. Reverse order in alternate interviews.
Wholly the parent’s responsibility Mainly the parent’s responsibility Mainly the school’s responsibility Wholly the school’s responsibility Both equally (Do not read out) Don’t Know (Do not read out)

127
E. Level Of Involvement
ASK ALL Q27. How often do you help <child> with their homework, if at all? if never,
probe: Is that because <child> never gets homework or they get it but you don’t help? (Read out)
Every time Most times Occasionally Never - child never gets homework Never - child does get homework but parent doesn’t help Never - don’t know if child gets homework Don’t Know (do not read out) Depends what it is (do not read out) When the child asks for help
Q28. How confident do you (IF ‘NEVER’: WOULD YOU) feel helping <child> with their homework? Read out and code most appropriate answer
Always confident Confident most of the time Confident some of the time Never confident (do not read out) Depends what it is Don’t Know
128
F. Communication With School
Next I would like you to think about communication with <child>’s school.
Can you tell me whether you personally have talked about how your child is doing in class
with <child>’s teachers…. Read out
Q29. At regular events such as Parents’ evenings, Parents Meetings or Review Days arranged by the school
Q30. At other meetings requested by the school Q31. At meetings requested by the parent Q32. Through written communication like letters or email Yes No
Q33. We find that some parents are more confident than others when talking with
teachers. How confident do you personally feel when talking to teachers at <child>’s school? Read Out
Very confident Fairly confident Not very confident Not at all confident (do not read out) Depends on teacher (do not read out) Depends on subject (do not read out) I don’t talk to teachers Don’t Know
Q34. In the future, all schools will publish something called a School Profile. It’s a new annual report about how well schools perform and other school information. Have you heard of it before now?
Yes No
IF YES AT Q34CONTINUE. OTHERS GO TO Q41

129
Q35. How did you find out about the School Profile? Do not read out. Code as many as apply.
School sent the paper report via my child I came across it online when looking at schools websites Through a web search engine (Google, Ask, Yahoo etc) Another parent told me about it I heard about it in the news or local media Through work (e.g. respondent is a teacher) Other (specify) Don’t remember
Q36. Have you actually read any School Profiles? Yes No
IF YES AT Q36. OTHERS GO TO Q41 Q37. How many? If necessary - just an approximate figure is fine Enter figure
Q38. And thinking back to when you read the report/these reports, would you say you (if more than one: generally)… (Read out)
read only a little read about half read most of it read nearly all or all of it
IF HAVE READ ANY AMOUNT CONTINUE, OTHER GO TO Q41
Q39. As a reminder, the purpose of School Profiles is to provide parents with information about a school and how it is performing. So thinking now about School Profiles and their purpose, can you tell me, firstly, what you think are good about School Profiles?
(Open ended)
Q40. And, secondly, how would you like to see School Profile publications
improved? (Open ended)
GO TO Q44
130
School Profiles contain information and charts describing how well a school performs in tests, how it compares to other schools locally and nationally, which subjects it specialises in and how it is planning to improve. They follow a standard format to make them easier to read and compare. I’m going to read out some statements about these reports, and just based on your first impressions and this description, could you tell me please how far you agree or disagree with these. RANDOMISE ORDER. Strongly agree Agree Neither agree nor disagree Disagree Strongly disagree Don’t know
Q41. I would use School Profile reports to help choose a school for <child> Q42. Performance charts and statistics would put me off reading a report Q43. I’m really interested in an annual school report that covers all aspects of the
school and it’s performance
To what extent do you agree or disagree with the following statements? (Read out) Strongly agree Agree Neither agree nor disagree Disagree Strongly disagree Don’t know Did not choose the school (Q49 only)
Q44. The school gives me enough information for me to judge how far <child> is fulfilling his / her potential
Q45. Information from the school helps me understand how I can support
<child>’s progress Q46. I would know exactly who to contact at the school if I had any concerns
about <child> Q47. If the school told me <child> was not making good progress, I’m very
confident that my involvement could help. Q48. I have enough opportunities to have a say in how <child>’s school is run
131
Q49. When I was choosing a school for <child>, I felt well informed about my options
Q50. When <child> started their current school, I felt well supported by the school Q51. <child>’s school seems to cater better for mums than it does for dads RANDOMISE ORDER
Q52. <Child> tends to do well in subjects involving reading and writing Q53. <Child> tends to do well in number based subjects
Q54. If you wanted to have a say or change something about how <child>’s school was being run, who would you contact to do this? (Multicode, do not prompt)
Governors Teachers generally Headteacher or headteacher’s office School Council / Parent Council Other parents / friends Local Authority / Local Education Authority (LA, LEA) Department for Education and Skills / DfES MP / local councillor My child Local media My partner Other (specify) Don’t know / not sure
Q55. And ideally, how would like to be able contact them? (Read out) Face to face informally Face to face at a formal meeting Phone them Write a letter or note Email Text message
I am now going to read out a number of terms used about schools and education. For each one, could you tell me if you have heard of the term and how much you know about it. Record what respondent thinks of their knowledge level, even if you think you know he/she is wrong! (Read out) Heard of the term and know a lot about what it means Heard of the term and know a little about what it means Heard of the term but don’t know what it means Never heard of the term

132
LIST RANDOMISED APART FROM FIRST TERM WHICH ALWAYS COMES FIRST. Q56. Home School Agreement Q57. School achievement and attainment tables Q58. Bookstart Q59. Ofsted IF HAVE HEARD OF HOME SCHOOL AGREEMENT Q60. You mentioned you had heard of the Home School Agreement. Have you
actually signed one of these for <child>? Yes No Don’t know / Not sure
Q61. To let you know how <child> is doing, schools write formal reports at certain points in the year. How often does <child> get these from school? Do not read out
Daily Weekly More often than weekly, but less than monthly Monthly Every half term (6 times a year) 4 or 5 times a year Every term (3 times a year) Twice a year Once a year Less often Never Don’t know

133
Q62. And how often would you ideally like to be able to see how well <child> is
doing at school? Do not read out As and when I want to Daily Weekly More often than weekly, but less than monthly Monthly Every half term (6 times a year) 4 or 5 times a year Every term (3 times a year) Twice a year Once a year Less often Never Don’t know
Q63. And in addition to any reports that <child> currently gets, if <child>’s school was able to provide a secure website where you could see how well <child> was doing with the most up to date information, how appealing would this be to you? Read out
Very appealing Quite appealing A little appealing Not very appealing Not at all appealing Don’t know (Do not read out)
Q64. And why do you say that? (Open ended)
134
G. Demographics
Thank you. Now I need to ask you a few more questions about yourself to make sure we get a good spread of opinions.
Q65. What was your age last birthday? enter age
Q66. Are you ... (read out list) Married/Living as married In a Civil Partnership Single/Engaged Widowed Separated Divorced Refused
Q67. At what age did you personally finish your full time education? 14 or under 15 16 17 18 19 20 21 - 23 24 or more Still studying Refused
Q68. Which of these best describes your employment at the moment, if any? (read out)
Working in a paid job more than 29 hours a week Working in a paid job between 8 and 29 hours a week Working in a paid job less than 8 hours a week Self employed Not in paid employment / looking after house or home Full time student at school Full time student at university / college Unemployed Retired from paid employment Don't Know

135
Q69. Do you have access to the Internet at all? interviewer: if yes probe for
where access, home, work, school/college or elsewhere Home access to internet Access to internet at work Access to internet at school/college Access to internet elsewhere No access to internet Don't Know
Q70. Do you regard yourself as belonging to any particular religion? INTERVIEWER, IF YES: To what religious faith would you say you belong? No / None Christian (Church of England, Catholic, Protestant, and all other Christian denominations) Buddhist Hindu Jewish Islam / Muslim Sikh Other Refused
Q71. Next, please choose one answer from this list to indicate your cultural background? read out
White Mixed Asian or Asian British Black or Black British Chinese Some other background Don't Know Refused
IF WHITE probe for specific background: white
White British White Irish Traveller of Irish heritage Gypsy/Roma Any other white background Don't Know
136
IF MIXED ETHNIC GROUP probe for specific background: mixed
White and Black Caribbean White and Black African White and Asian Any other mixed background Don't Know
IF ASIAN OR ASIAN BRITISH probe for specific background: Asian
Indian Pakistani Bangladeshi Any other Asian background Don't Know
IF BLACK OR BLACK BRITISH probe for specific background: black
Black Caribbean Black African Any other black background Don't Know
Q72. Is English the first or main language of your household?
Yes No
IF YES
Q73. Is English the only language or are other languages spoken?
yes, English only yes, English is first language but other languages also spoken no, another language is household’s first language household is bi-lingual don't know refused
ASK ALL Q74. Do you provide any care, help or support for anyone because of illness,
disability, old age or infirmity of any kind? [qdisot] This does not include caring as part of a paid job.
Yes No Don't know Refused
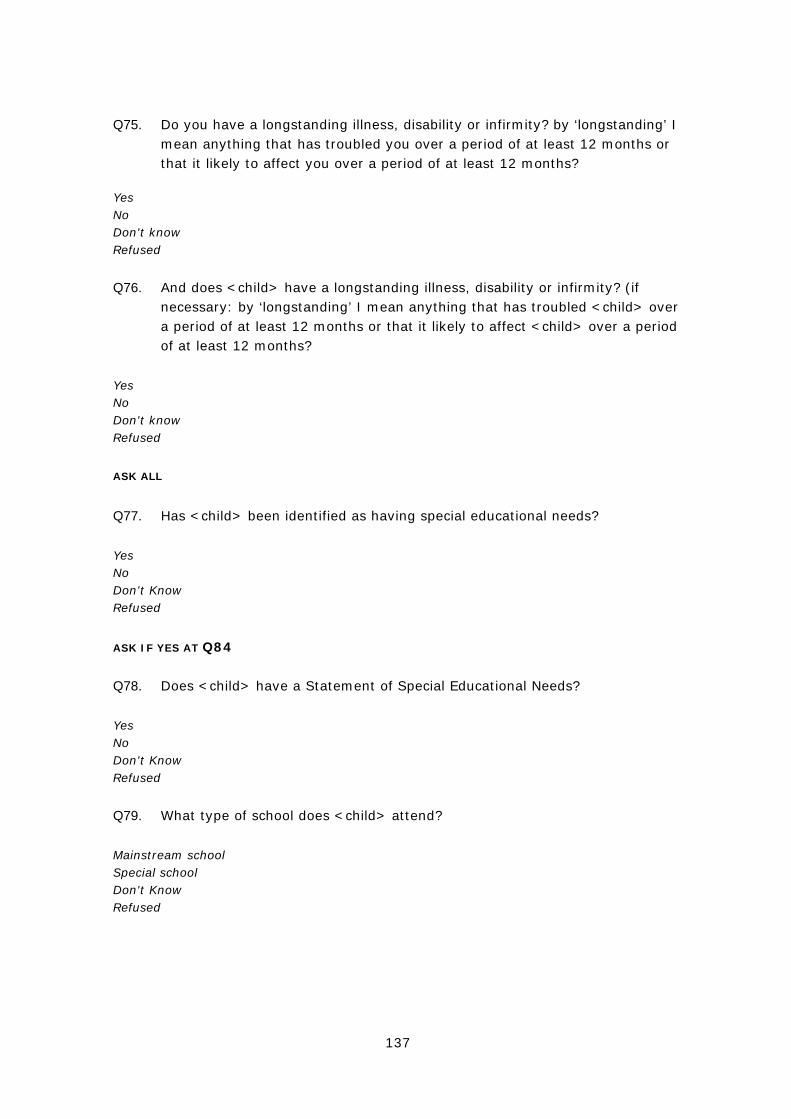
137
Q75. Do you have a longstanding illness, disability or infirmity? by ‘longstanding’ I mean anything that has troubled you over a period of at least 12 months or that it likely to affect you over a period of at least 12 months?
Yes No Don't know Refused
Q76. And does <child> have a longstanding illness, disability or infirmity? (if
necessary: by ‘longstanding’ I mean anything that has troubled <child> over a period of at least 12 months or that it likely to affect <child> over a period of at least 12 months?
Yes No Don't know Refused
ASK ALL
Q77. Has <child> been identified as having special educational needs? Yes No Don't Know Refused
ASK IF YES AT Q84 Q78. Does <child> have a Statement of Special Educational Needs? Yes No Don't Know Refused
Q79. What type of school does <child> attend? Mainstream school Special school Don't Know Refused

138
Q80. Could you tell me how many fixed telephone lines are available for incoming telephone calls to your household? (PLEASE ONLY INCLUDE THOSE WITH DIFFERENT NUMBERS AND DO NOT INCLUDE MOBILE PHONES.)
1..10 Don’t Know Refused
ASK ALL
Q81. Social Grade Establish who in household is the chief income earner and code social grade for the chief income earner. A B C1 C2 D E Refused
Q82. Please can you give me your full postcode? Enter
Q83. Would you be willing for the Department of Children, Schools and Families (DCSF), or someone working on behalf of the Department, to contact you again in the future as a follow-up to this survey?
Yes No
THANK AND CLOSE INTERVIEWER: RECORD WHETHER SUPPORTED TRANSLATION USED

139
Fieldwork procedures
Briefing of interviewers
All interviewers were briefed personally by the BMRB research team. They were
given detailed information on the background and objectives of the survey. The
interviewers were also given instructions on how to introduce the survey.
Fieldwork
Fieldwork was carried out by between 6th August and 23rd October 2007. Eligible
households were selected by screening a random sample of telephone numbers. A
total of 5,032 interviews were conducted (4,056 using questionnaire A and 976
using questionnaire B). Interviews lasted approximately 20 minutes on average and
were conducted via Computer Assisted Telephone Interviewing (CATI) out of
BMRB’s telephone centres in Ealing and Hull.
Supervision and quality control
For all telephone surveys, BMRB’s standard quality control procedures are those
stipulated by IQCS (Interviewer Quality Control Scheme). As an IQCS member
company, our quality control standards meet or exceed those required and our
records are available for annual inspection. Our quality control procedures are
summarised as follows:
• each interviewer is monitored at least every fourth shift;
• at least 7% of interviews are monitored;
• monitoring records are completed for each interviewer; these are discussed
with the interviewer and signed;
• no interviews are carried out without a supervisor present;
• an interviewer performance review is held each month;
• all interviewers are personally briefed on each project.
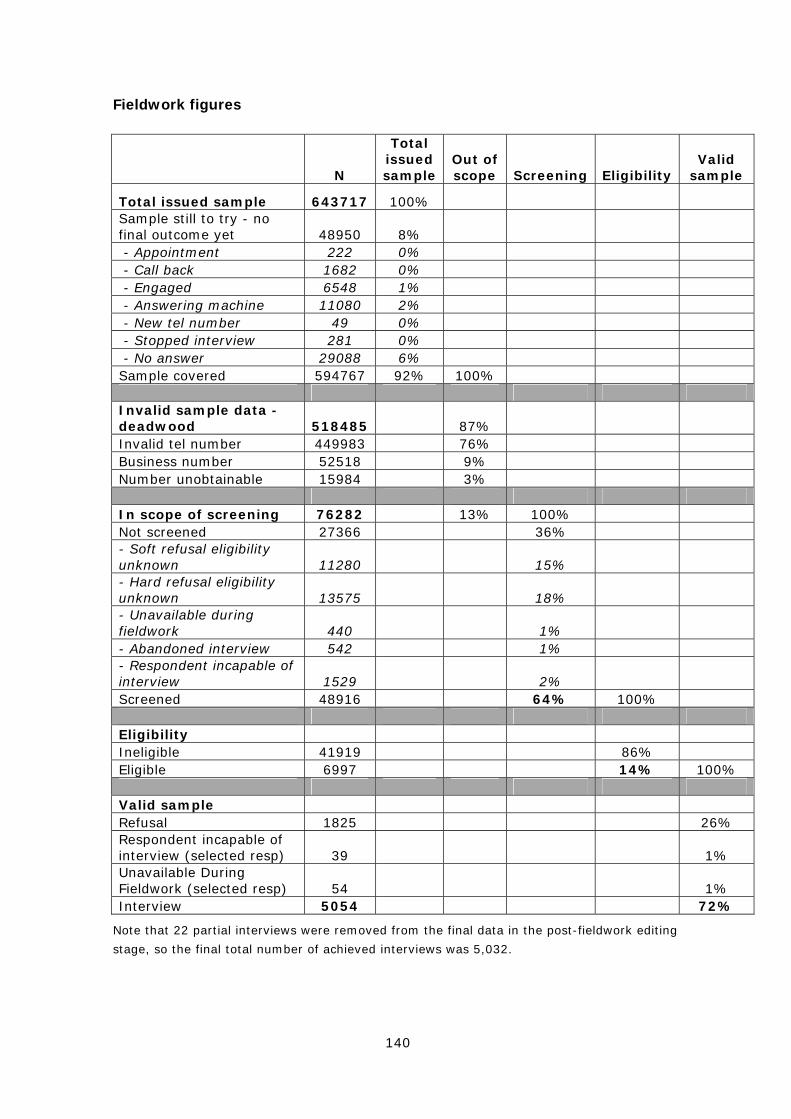
140
Fieldwork figures
N
Total issued sample
Out of scope Screening Eligibility
Valid sample
Total issued sample 643717 100% Sample still to try - no final outcome yet 48950 8% - Appointment 222 0% - Call back 1682 0% - Engaged 6548 1% - Answering machine 11080 2% - New tel number 49 0% - Stopped interview 281 0% - No answer 29088 6% Sample covered 594767 92% 100% Invalid sample data - deadwood 518485 87% Invalid tel number 449983 76% Business number 52518 9% Number unobtainable 15984 3% In scope of screening 76282 13% 100% Not screened 27366 36% - Soft refusal eligibility unknown 11280 15% - Hard refusal eligibility unknown 13575 18% - Unavailable during fieldwork 440 1% - Abandoned interview 542 1% - Respondent incapable of interview 1529 2% Screened 48916 64% 100% Eligibility Ineligible 41919 86% Eligible 6997 14% 100% Valid sample Refusal 1825 26% Respondent incapable of interview (selected resp) 39 1% Unavailable During Fieldwork (selected resp) 54 1% Interview 5054 72%
Note that 22 partial interviews were removed from the final data in the post-fieldwork editing
stage, so the final total number of achieved interviews was 5,032.
141
Analysis
Logistic regression
The logistic regression results show the explanatory power of different factors,
whilst controlling for all other factors, on whether parents were likely to perceive
themselves as ‘very involved’ in their child’s education. The table below show the
odds ratios relating to different factors associated with a parent’s involvement.
Odds Ratios
The odds ratios are calculated by taking the ratio of the odds of one group being
involved compared to the odds of the reference group24 being involved. An odds
ratio greater than one implies an increased likelihood of involvement, whereas an
odds ratio of less than one implies a decreased likelihood of involvement. For
example, the odds ratios in the table below show that parents who help in class or
at school whenever the opportunity were 77% more likely to perceive themselves
as involved, than those who never helped.
Significance
Whether or not variables were included in the earlier models was based upon the
statistical significance of their bivariate relationship with involvement. However, the
final model shown here only includes variables that were also found to improve the
prediction of involvement in the multivariate analysis, all others were removed if
not statistically significant. Variables that are statistically significant at the 95 per
cent confidence level (i.e. less than ‘0.05’ statistical significance) are indicated by
an asterisk in the tables25.
24 The reference group is indicated in each table by the characteristic with an odds ratio of (1.0).
25 This means that there is less than a five percent chance that the variable of interest actually had no
effect on involvement.
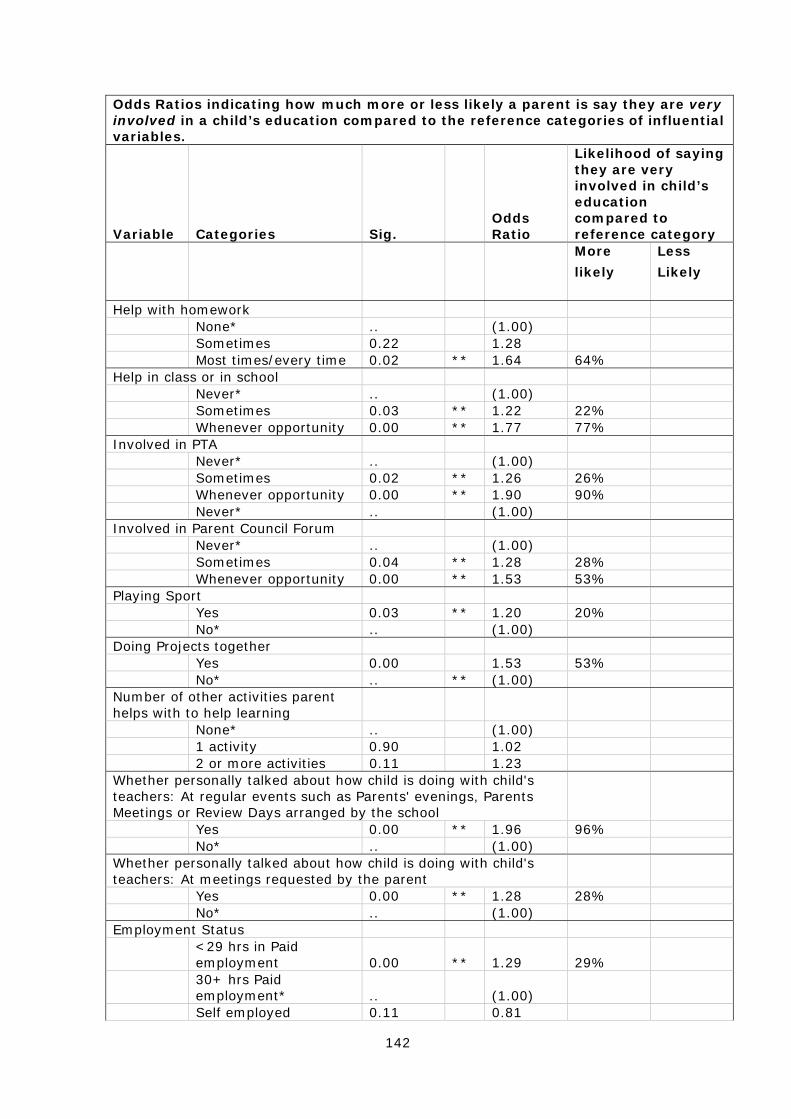
142
Odds Ratios indicating how much more or less likely a parent is say they are very involved in a child’s education compared to the reference categories of influential variables.
Variable Categories Sig. Odds Ratio
Likelihood of saying they are very involved in child’s education compared to reference category
More
likely
Less
Likely
Help with homework None* .. (1.00) Sometimes 0.22 1.28 Most times/every time 0.02 ** 1.64 64% Help in class or in school Never* .. (1.00) Sometimes 0.03 ** 1.22 22% Whenever opportunity 0.00 ** 1.77 77% Involved in PTA Never* .. (1.00) Sometimes 0.02 ** 1.26 26% Whenever opportunity 0.00 ** 1.90 90% Never* .. (1.00) Involved in Parent Council Forum Never* .. (1.00) Sometimes 0.04 ** 1.28 28% Whenever opportunity 0.00 ** 1.53 53% Playing Sport Yes 0.03 ** 1.20 20% No* .. (1.00) Doing Projects together Yes 0.00 1.53 53% No* .. ** (1.00) Number of other activities parent helps with to help learning
None* .. (1.00) 1 activity 0.90 1.02 2 or more activities 0.11 1.23 Whether personally talked about how child is doing with child's teachers: At regular events such as Parents' evenings, Parents Meetings or Review Days arranged by the school
Yes 0.00 ** 1.96 96% No* .. (1.00) Whether personally talked about how child is doing with child's teachers: At meetings requested by the parent
Yes 0.00 ** 1.28 28% No* .. (1.00) Employment Status <29 hrs in Paid
employment 0.00 ** 1.29 29%
30+ hrs Paid employment* .. (1.00)
Self employed 0.11 0.81
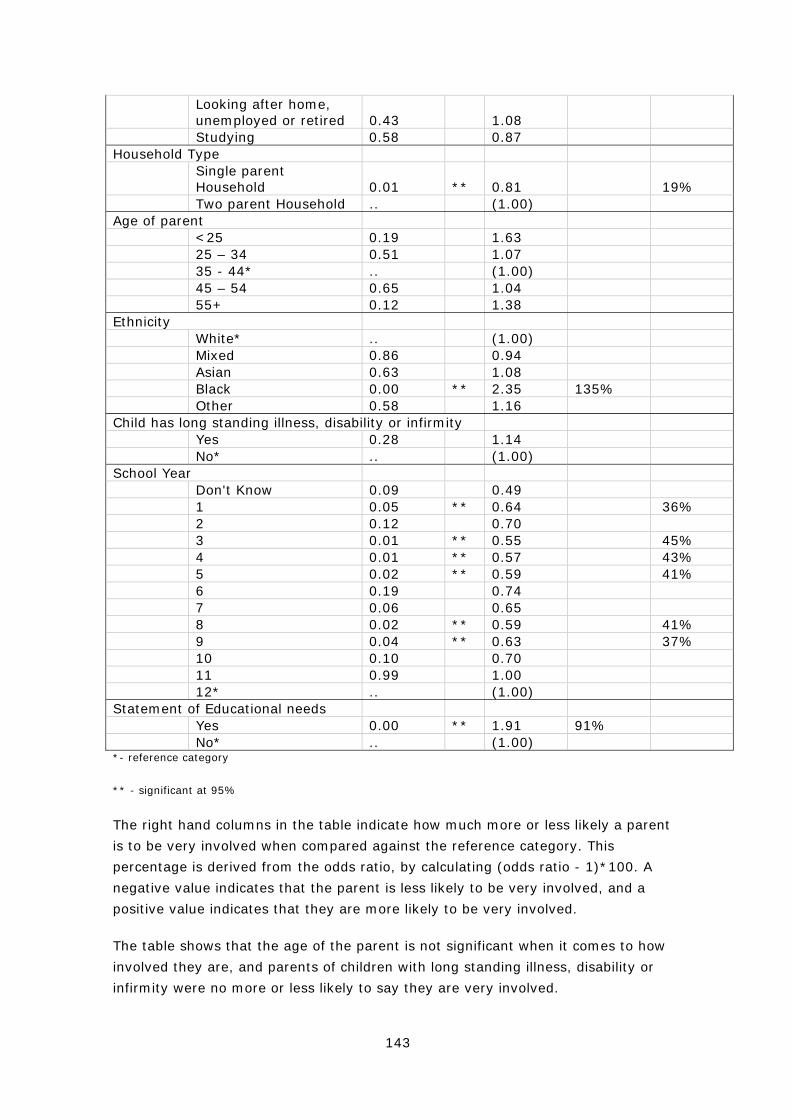
143
Looking after home, unemployed or retired 0.43 1.08
Studying 0.58 0.87 Household Type Single parent
Household 0.01 ** 0.81 19% Two parent Household .. (1.00) Age of parent <25 0.19 1.63 25 – 34 0.51 1.07 35 - 44* .. (1.00) 45 – 54 0.65 1.04 55+ 0.12 1.38 Ethnicity White* .. (1.00) Mixed 0.86 0.94 Asian 0.63 1.08 Black 0.00 ** 2.35 135% Other 0.58 1.16 Child has long standing illness, disability or infirmity Yes 0.28 1.14 No* .. (1.00) School Year Don't Know 0.09 0.49 1 0.05 ** 0.64 36% 2 0.12 0.70 3 0.01 ** 0.55 45% 4 0.01 ** 0.57 43% 5 0.02 ** 0.59 41% 6 0.19 0.74 7 0.06 0.65 8 0.02 ** 0.59 41% 9 0.04 ** 0.63 37% 10 0.10 0.70 11 0.99 1.00 12* .. (1.00) Statement of Educational needs Yes 0.00 ** 1.91 91% No* .. (1.00) *- reference category
** - significant at 95%
The right hand columns in the table indicate how much more or less likely a parent
is to be very involved when compared against the reference category. This
percentage is derived from the odds ratio, by calculating (odds ratio - 1)*100. A
negative value indicates that the parent is less likely to be very involved, and a
positive value indicates that they are more likely to be very involved.
The table shows that the age of the parent is not significant when it comes to how
involved they are, and parents of children with long standing illness, disability or
infirmity were no more or less likely to say they are very involved.

144
The table further shows that parents who never help with homework were 39% less
likely than those who help every time to be very involved in their education. Even
when controlling for school year, this factor influences the likelihood.
When controlling for age and working status, single parent households were 19%
less likely than 2 parent households to say they are very involved in their children’s
education.
The school year of the child also plays a part in how involved a parent feels.
Compared to those with children in year 12, those in years 1, 3-5, 8 and 9 were
significantly less likely to be very involved in the child’s education. This suggests
that parents of children in years of transition between primary and secondary
school, and those doing GCSEs or A-levels were more likely to be very involved in
their child’s education.
Cluster analysis
In addition to the logistic regression, cluster analysis based on parents’ attitudes
was also carried out. However, as most parents were generally positive on most of
the attitudinal measures, there was not enough differentiation to be able to produce
distinct clusters; the models attempted were therefore not statistically significant.
Other analysis variables
The following analysis variables were also considered, but did not reveal any
significant differences:
• Region - there were some differences between London and elsewhere (noted in the report), but otherwise there was very little variation or consistency.
• Urban / rural - no obvious patterns emerged.
• IMD / education deprivation index - there were only a few differences, which
were closely linked to differences by social grade.

Ref: DCSF-RR034
ISBN: 978 1 84775 144 7
© BMRB International Ltd 2008
www.dcsf.gov.uk/research
Published by the Department forChildren, Schools and Families