parasitic worms and population cycles of red grouse
TRANSCRIPT

6
Parasitic Worms and PopulationCycles of Red Grouse
Peter J. Hudson, Andy P. Dobson, and David Newborn
6.1 Historical Introduction to Grouse Research
Many years before Charles Elton collected the detailed data on fur returns toThe Hudson’s Bay Trading Company, or described the regular fluctuations insmall mammal numbers, scientists and naturalists had observed and wereproposing explanations for the cause of periodic crashes in numbers of redgrouse known as ‘‘grouse disease.’’ MacDonald (1883) claimed ‘‘that it wasmore than eighty years since the alarm of grouse disease was sounded in thiscountry,’’ implying that naturalists were starting to examine the phenomenonnearly 200 years ago. In 1873, The House of Commons established a SelectCommittee to consider the game laws of the United Kingdom and, since thishad followed a year of particularly severe population collapse in red grousenumbers, they took exhaustive evidence on a wide range of possible causes of‘‘grouse disease.’’ An examination of the letters in The Times and The Fieldshows that the debate over the cause of the population crashes was conten-tious and as heated as many of the recent debates over the causes of popula-tion cycles.
Scientific studies were initiated by Cobbold (1873) who examined grousekilled during a population crash, published a pamphlet that described thepresence of large numbers of ‘‘strongle worms,’’ and advocated the theorythat the cause of grouse disease was wholly due to the presence of nematodeworms. In 1905, the Board of Agriculture appointed a Committee of Inquiryon Grouse Disease to investigate the life history of the parasite and the causesof ‘‘grouse disease.’’ The extensive survey and detailed analysis was quiteremarkable for the time, and was presented in a two-volume publication
[08:51 20/5/02 n:/3896 BERRYMAN.751/3896-AllText.3d] Ref: 3896 Auth: Berryman Title: Population Cycle All Chapters Page: 109 1-188
109
(Lovat 1911). The Committee surveyed grouse populations, undertookexperiments and, after nearly 2000 dissections, came to the conclusion that‘‘the strongyle worm, and the strongyle worm alone, is the immediate causacausans of adult ‘Grouse Disease.’ ’’ The Principal Field Officer was E. A.Wilson, a gifted artist and scientist who was later appointed as the ScientificDirector to Captain Scott’s Antarctic expedition on the Terra Nova.Unfortunately, Wilson never saw the production of the final report as hedied with Scott during the return from the South Pole.
Mackenzie (1952) presented and described the bag records of grouse spe-cies shot in the United Kingdom, and Moran (1952) undertook time series,analysis that described the tendency of the populations to show regular oscil-lations. Lack (1954) was concerned that the oscillations were not as regular asthe Canadian lynx time series, and postulated that the main cause of thecycles was an interaction between parasites and food. He based this ideanot on new data, but on a reading of the main report by the Inquiry onGrouse Disease (Lovat 1911). The red grouse remained a focus of populationresearch and, in 1956, Professor Wynne-Edwards established a unit ofAberdeen University to ‘‘test the Animal Dispersion Hypothesis.’’ Later, ashis ideas on group selection were generally dismissed, workers focused on therole of spacing behavior in the population dynamics of red grouse. After 30years of detailed work, Wynne-Edwards (1986) summarized his perspectiveon the findings thus:
‘‘Grouse disease as a lethal epidemic was a misunderstanding: instead, as pre-
dicted at the outset, it’s the birds themselves that by mutual competition
determine their own population density. . . .The successful ones occupy the
habitat in a virtually continuous mosaic. The surplus ones become outcasts,
and expendable; all of them are normally dead from secondary causes before
the spring when breeding starts. ‘Grouse disease’ was a mistaken diagnosis of
the after effects of social exclusion.’’
This statement is in direct contrast with the clear statement given by Lovat(1911), and underemphasizes the detailed experiments and monitoring thathas been undertaken on the role of spacing behavior by the workers in north-east Scotland. Since this book is concerned with the hypothesis that grousecycles are caused by trophic interactions, we will not review the large litera-ture on the possible role of spacing behavior in grouse population dynamics(see, e.g., Moss and Watson 1991).
By the 1970s it was generally accepted amongst population biologists thatspacing behavior determined grouse density and that grouse disease was aconsequence of the behavior of the birds. This idea fitted the belief portrayedin text books that in ‘‘natural systems’’ parasites were selected to be benign totheir hosts and not to have an important long-term impact on host dynamics(e.g., Ricklefs 1979). However, Anderson and May (1978) synthesized thedisciplines of population biology and parasitology to provide a sound math-ematical framework that captured the dynamics of the parasite–host relation-ship. They specifically identified the destabilizing characteristics of the
[08:51 20/5/02 n:/3896 BERRYMAN.751/3896-AllText.3d] Ref: 3896 Auth: Berryman Title: Population Cycle All Chapters Page: 110 1-188
110 Population Cycles

parasite–host relationship that would generate oscillations in host abundance.Their models showed that a random or regular distribution of parasites in thehost population, parasite-induced reduction in host fecundity, and timedelays in parasite development would all destabilize a host population,although the final dynamics would be a consequence of the tension betweenthese processes and other stabilizing mechanisms. Interestingly, their workhighlighted the importance of parasite-induced reduction in host fecundityand emphasized that, depending on the relative degree of parasite aggregationwithin the host population, this had to be larger than the relative impacts onsurvival. This observation is interesting in the context of the previous studieson ‘‘grouse disease,’’ where workers considered only the lethal effects ofparasites and not the sublethal effects that provided a more focused explana-tion of red grouse cycles.
From this historical perspective the question arises ‘‘What are the sublethaleffects of parasites on red grouse and what role do they play in the populationdynamics of red grouse?’’ The social behavior hypothesis proposes that para-sites are a consequence of the effects of social exclusion (Jenkins et al. 1963).In contrast, the parasite hypothesis suggests that parasites reduce fecundity ofgrouse in a way that causes the grouse population to cycle in abundance. Thischapter examines this hypothesis in more detail and summarizes a series ofpublished studies (Hudson et al. 1985, 1992a,b, 1999, Hudson 1986a,b, 1992,Dobson and Hudson 1992, 1995, Hudson and Dobson 1996).
6.2 Time Series Analysis
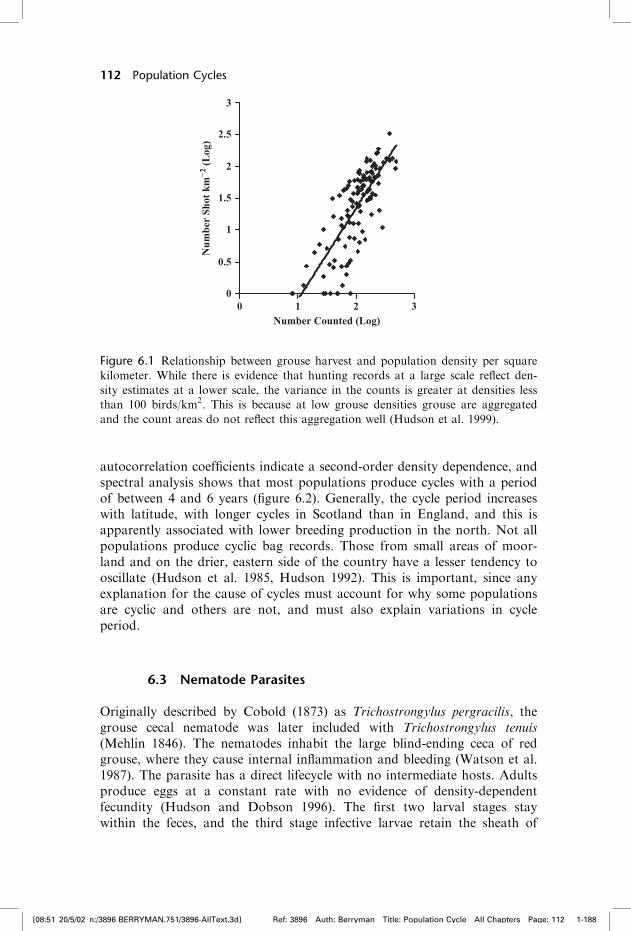
Red grouse population time series occur in the form of bag records andsample counts within populations. Each privately owned grouse moor seeksto maximize its long-term hunting returns which, in reality, means harvestingto a level where a suitable breeding stock is left for the following year.Hunting is not regulated, and the individual landowner decides how manybirds can be harvested. For more than 150 years, landowners have keptdetailed and accurate counts of numbers harvested each year on differentmanaged estates. Since each is managed independently and often separatedfrom others by natural watersheds, workers have tended to consider each timeseries as independent. Population counts show that bag records are usually afair reflection of abundance (figure 6.1), although since hunting takes place inthe fall, approximately two thirds of the harvest is of immature birds and sobreeding production influences bag records. Overall, the variance in huntingmortality is greater at population densities less than 100 birds/km2, probablybecause grouse are aggregated and counts less accurate at low densities(Hudson et al. 1999).
Time series analysis of the bag records shows that the majority of timeseries (Potts et al. 1984, Hudson et al. 1985, Hudson 1992) show significantautocorrelation coefficients at half the cycle period, which is typical ofphase-forgetting quasi-cycles (Gurney and Nisbett 1998). Significant partial
[08:51 20/5/02 n:/3896 BERRYMAN.751/3896-AllText.3d] Ref: 3896 Auth: Berryman Title: Population Cycle All Chapters Page: 111 1-188
Parasitic Worms and Population Cycles of Red Grouse 111
autocorrelation coefficients indicate a second-order density dependence, andspectral analysis shows that most populations produce cycles with a periodof between 4 and 6 years (figure 6.2). Generally, the cycle period increaseswith latitude, with longer cycles in Scotland than in England, and this isapparently associated with lower breeding production in the north. Not allpopulations produce cyclic bag records. Those from small areas of moor-land and on the drier, eastern side of the country have a lesser tendency tooscillate (Hudson et al. 1985, Hudson 1992). This is important, since anyexplanation for the cause of cycles must account for why some populationsare cyclic and others are not, and must also explain variations in cycleperiod.
6.3 Nematode Parasites
Originally described by Cobold (1873) as Trichostrongylus pergracilis, thegrouse cecal nematode was later included with Trichostrongylus tenuis(Mehlin 1846). The nematodes inhabit the large blind-ending ceca of redgrouse, where they cause internal inflammation and bleeding (Watson et al.1987). The parasite has a direct lifecycle with no intermediate hosts. Adultsproduce eggs at a constant rate with no evidence of density-dependentfecundity (Hudson and Dobson 1996). The first two larval stages staywithin the feces, and the third stage infective larvae retain the sheath of
[08:51 20/5/02 n:/3896 BERRYMAN.751/3896-AllText.3d] Ref: 3896 Auth: Berryman Title: Population Cycle All Chapters Page: 112 1-188
112 Population Cycles
3
2.5
2
1.5
1
0.5
00 1 2 3
Number Counted (Log)
Num
ber
Shot
km
_2 (
Log
)
Figure 6.1 Relationship between grouse harvest and population density per square
kilometer. While there is evidence that hunting records at a large scale reflect den-
sity estimates at a lower scale, the variance in the counts is greater at densities less
than 100 birds/km2. This is because at low grouse densities grouse are aggregated
and the count areas do not reflect this aggregation well (Hudson et al. 1999).

[08:51 20/5/02 n:/3896 BERRYMAN.751/3896-AllText.3d] Ref: 3896 Auth: Berryman Title: Population Cycle All Chapters Page: 113 1-188
Figure 6.2 Time series analysis of grouse harvesting records. (a) Numbers shot per
annum is nonstationary, so the time series was detrended using a third-order poly-
nomial, and the residuals used for the analysis. (b) Partial autocorrelogram with
Bartlett lines indicating the level of significance. (c) Smoothed spectral analysis of
time series indicating a cycle period of approximately 5 years.
the second larval stage, leave the cecal pat, and ascend the growing shootsof the principal food plant of red grouse, heather Calluna vulgaris (Saunderset al. 1999, 2000). The larval stage requires moist conditions for develop-ment and to aid mobility up the plant (Hudson 1986b, Saunders et al.1999), and infection occurs when the grouse eat the growing tips. Uptakeof worms by immature grouse occurs principally during July and August,when temperature allows development (Hudson 1996, Hudson and Dobson1996). Some infective stages may shed the coat of the second larval stageand remain dormant in the gut mucosa before commencing development inlate winter (Shaw 1988). The parasites show an aggregated distributionwithin the adult host population (Hudson et al. 1992a), although the degreeof aggregation is weak (k of the negative binomial ¼ 1) compared with themajority of parasitic infections (Shaw and Dobson 1995). This is probably aconsequence of the low level of acquired resistance within the host popula-tion (Hudson and Dobson 1996).
To relate changes in the population to changes in parasite burdens, redgrouse numbers have been carefully monitored annually since 1979 on 1 km2
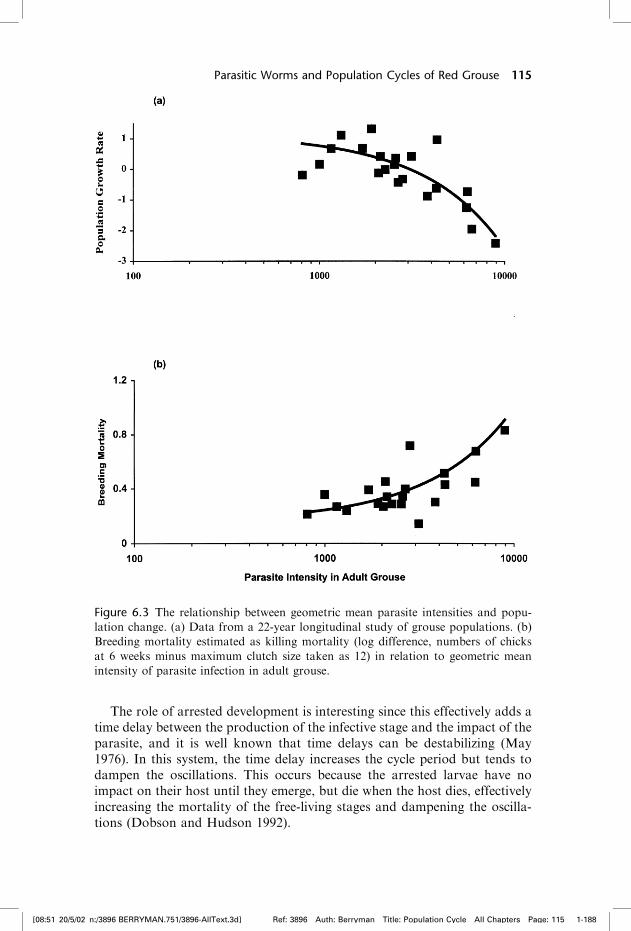
plots. Sample counts are taken every spring to record breeding density and inJuly to record number of chicks reared per female. The per-capita rate ofchange of the population decreases, and breeding mortality increases, as theintensity of worm infection increases (figure 6.3). Replicated field experimentshave shown that grouse with experimentally reduced infections have higherbrood production and survival (Hudson 1986b, Hudson et al. 1992a). Thisfinding shows that parasitic infections reduce grouse breeding production,and is in line with the model of May and Anderson (1978), which predictsthat parasite-induced reduction in host fecundity is destabilizing.
6.4 Population Model
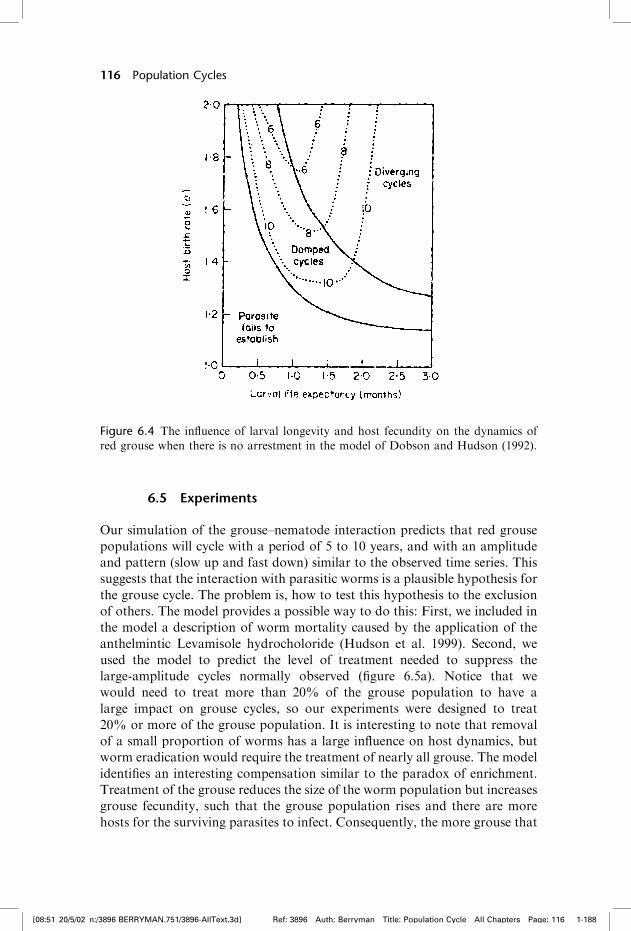
Dobson and Hudson (1992) explored the dynamics of the interactionbetween red grouse and T. tenuis with Anderson–May models. We incor-porated a third equation to describe changes in the size of free-livingparasites and included a description of arrested larval development. Themodel is based on the lifecycle of the parasite and includes the parasite-induced impacts on survival and brood production of the grouse, asdetermined by field experiments. Simulations with the model suggestthat time delays caused by parasite-arrested development (or hypobiosis)are not the main cause of population oscillations. Cyclic oscillations inthe model occur when the ratio of parasite-induced reduction in hostfecundity to parasite-induced reduction in host survival is greater thanthe degree of parasite aggregation within the host population. In otherwords, the relative impact on fecundity destabilizes the host populationand is the principal cause of the oscillation. The reproductive rate of thegrouse and the life expectancy of the free-living stages determine the cycleperiod (figure 6.4).
[08:51 20/5/02 n:/3896 BERRYMAN.751/3896-AllText.3d] Ref: 3896 Auth: Berryman Title: Population Cycle All Chapters Page: 114 1-188
114 Population Cycles
The role of arrested development is interesting since this effectively adds atime delay between the production of the infective stage and the impact of theparasite, and it is well known that time delays can be destabilizing (May1976). In this system, the time delay increases the cycle period but tends todampen the oscillations. This occurs because the arrested larvae have noimpact on their host until they emerge, but die when the host dies, effectivelyincreasing the mortality of the free-living stages and dampening the oscilla-tions (Dobson and Hudson 1992).
[08:51 20/5/02 n:/3896 BERRYMAN.751/3896-AllText.3d] Ref: 3896 Auth: Berryman Title: Population Cycle All Chapters Page: 115 1-188
Parasitic Worms and Population Cycles of Red Grouse 115
Figure 6.3 The relationship between geometric mean parasite intensities and popu-
lation change. (a) Data from a 22-year longitudinal study of grouse populations. (b)
Breeding mortality estimated as killing mortality (log difference, numbers of chicks
at 6 weeks minus maximum clutch size taken as 12) in relation to geometric mean
intensity of parasite infection in adult grouse.
6.5 Experiments
Our simulation of the grouse–nematode interaction predicts that red grouse
populations will cycle with a period of 5 to 10 years, and with an amplitude
and pattern (slow up and fast down) similar to the observed time series. This
suggests that the interaction with parasitic worms is a plausible hypothesis for
the grouse cycle. The problem is, how to test this hypothesis to the exclusion
of others. The model provides a possible way to do this: First, we included in
the model a description of worm mortality caused by the application of the
anthelmintic Levamisole hydrocholoride (Hudson et al. 1999). Second, we
used the model to predict the level of treatment needed to suppress the
large-amplitude cycles normally observed (figure 6.5a). Notice that we
would need to treat more than 20% of the grouse population to have a
large impact on grouse cycles, so our experiments were designed to treat
20% or more of the grouse population. It is interesting to note that removal
of a small proportion of worms has a large influence on host dynamics, but
worm eradication would require the treatment of nearly all grouse. The model
identifies an interesting compensation similar to the paradox of enrichment.
Treatment of the grouse reduces the size of the worm population but increases
grouse fecundity, such that the grouse population rises and there are more
hosts for the surviving parasites to infect. Consequently, the more grouse that
[08:51 20/5/02 n:/3896 BERRYMAN.751/3896-AllText.3d] Ref: 3896 Auth: Berryman Title: Population Cycle All Chapters Page: 116 1-188
116 Population Cycles
Figure 6.4 The influence of larval longevity and host fecundity on the dynamics of
red grouse when there is no arrestment in the model of Dobson and Hudson (1992).

[08:51 20/5/02 n:/3896 BERRYMAN.751/3896-AllText.3d] Ref: 3896 Auth: Berryman Title: Population Cycle All Chapters Page: 117 1-188
Figure 6.5 (a) Predicted decreases in cycle amplitude of grouse populations with
increasing proportion of anthelmintic-treated grouse. (b) Equilibrium grouse and
worm populations obtained by increasing levels of treatment with antihelmint.
Treatment results in higher grouse fecundity and, consequently, an increase in trans-
mission such that more than 96% of the population needs to be treated to eradicate
the worms (after Hudson et al. 1999).
are treated the greater the force of infection on the untreated birds and theiroffspring. Ultimately, eradication of the parasite requires that more than 90%of the grouse be treated (figure 6.5b).
6.5.1 Experimental Methods
Six study areas approximately 20 km2. in size were located in either NorthYorkshire or County Durham in northern England in independentlymanaged grouse populations. Using the model with previous estimates ofgrouse abundance and worm burdens, we predicted that the first crashwould occur in 1989. During the winter before the crash large numbers ofgrouse were caught at night by dazzling the birds (Hudson and Newborn1995). On four of the six study areas, grouse were treated orally with theanthelmintic Levamisole hydrochloride to reduce intensities of worm infec-tion, and marked with a patagial wing flash. The remaining two populationswere left untreated. On three of the treated populations, about 20% of thepopulation were caught, treated, and tagged, but on the third only about 15%were treated. The next population crash was predicted in 1993, and in thisyear two of the previously treated areas were retreated. Bag records frommanaged estates were used to monitor changes in the grouse populations.Grouse bag records were used as a proxy for grouse abundance becauseresources were not available to monitor all sites in detail. The relationshipbetween density estimated on 1 km2 areas and numbers harvested at a muchlarger scale (20 km2) is reasonably good (see figure 6.1).
6.5.2 Results
The overall effect of treating grouse with an anthelmintic was to reduce thecollapse of the population from its peak (figure 6.6). Note that the ampli-tude of the cycle was suppressed on all treated plots, as predicted by themodel (figure 6.5a); fewer grouse were harvested from the site where a lowerproportion of grouse were treated, but this was expected from the model. Ingeneral, the removal of parasites reduced the amplitude of the oscillationsimplying that, on these sites and at these times, parasitism was responsiblefor the observed population fluctuations. Of course, our results do notprove that other factors could not be involved, on other sites or at othertimes, but leaves little doubt that parasites were the principal cause ofpopulation cycles on our study sites. We are now testing the hypothesison other populations where parasites are not thought to be involved inthe population cycles.
6.5.3 Criticisms
Proponents of the spacing hypothesis have criticized our experiment, parti-cularly our contention that ‘‘these results show parasites were both sufficientand necessary in causing cycles in these populations’’ (chap. 9, Lambin et al.
[08:51 20/5/02 n:/3896 BERRYMAN.751/3896-AllText.3d] Ref: 3896 Auth: Berryman Title: Population Cycle All Chapters Page: 118 1-188
118 Population Cycles

[08:51 20/5/02 n:/3896 BERRYMAN.751/3896-AllText.3d] Ref: 3896 Auth: Berryman Title: Population Cycle All Chapters Page: 119 1-188
Figure 6.6 Experimental treatment of grouse with anthelmintic just prior to the
population crash reduces the severity of the crash (numbers of grouse shot are
expressed in logarithms of numbersþ 1). The experiment was conducted on four
treated populations, two treated once in 1989 and two treated twice, once in 1989
and once in 1993 (after Hudson et al. 1998).

1999; but see Hudson et al. 1999). To some degree this is an argument overthe semantics of the terms ‘‘sufficient and necessary,’’ but there are twospecific criticisms. First, bag records were used in the analysis and thesemay overestimate the variance in population size because hunters tend notto harvest at low densities. Thus, during our experiment, the control popula-tions were not harvested when the populations were very low. A superficialexamination of the data (figure 6.1) confirms that the variance does in factincrease when grouse densities are below 100 birds/km2. However, a moredetailed analysis of the count data from our main study area shows that thevariance falls with the mean, such that at low densities there was more varia-tion between count areas than recorded at high densities. In this respect thevariance is really in the count data rather than the bag records since, whengrouse numbers fall, the population becomes aggregated in certain areas andis not so evenly distributed throughout the available habitat. As such, bagrecords may well provide a better reflection of what is happening at thepopulation level than the more precise counts conducted over a small area.Of course, a full population count across the whole area would have been thebest answer, but was clearly impractical.
The second criticism is that the oscillations are only reduced, and aresidual oscillation remains that could be caused by some other mechanism.Again, this is somewhat semantic because the residual oscillation cannot bedetected statically. Either way, our model predicts a residual oscillationeven in populations where 20% of the birds are treated (see figure 6.5a).In other words, we expected the oscillations to be reduced not eliminated,and so the experimental results are in complete agreement with thehypothesized effect.
A third criticism is that the treatment would have killed the whole com-munity of gut helminths and not just T. tenuis. Of course this is true.However, analysis of birds at the time of treatment indicated that otherparasites were rarely present and, when they were, their numbers were low.Tapeworms, for example, are relatively rare in spring compared with autumn.Thus, although all gut helminths would have been killed by the treatment, thedominant parasite is without doubt T. tenuis. Even if there were synergisticinteractions between parasites, this would tend to support rather than refutethe parasite hypothesis.
In reviewing this paper Robert Moss raised another criticism, that theexperimental results could also be explained by the kin-selection/spacing-behavior hypothesis. He argued that this hypothesis would predict moreyoung per adult in the summer following treatment, which would be followedby enhanced recruitment the next spring, resulting in larger kin clusters and,thereby, enhanced recruitment in the following spring as well. Thus, he feelsthat our experiment cannot distinguish between the predictions of the parasitehypothesis and the kin-selection hypothesis. However, we feel that thisscenario is irrelevant, since the parasites are the actual cause of these popula-tion changes. Interestingly, this interpretation was part of the original kin-selection hypothesis proposed by Hudson et al. (1985).
[08:51 20/5/02 n:/3896 BERRYMAN.751/3896-AllText.3d] Ref: 3896 Auth: Berryman Title: Population Cycle All Chapters Page: 120 1-188
120 Population Cycles
6.6 Noncyclic Populations
In many species, including red grouse, the tendency for populations to cyclevaries from place to place and, indeed, from time to time. Understanding thedifferences between cyclic and noncyclic populations by comparative studyprovides a natural way of exploring alternative hypotheses. Some grousepopulations, particularly those inhabiting small moors and the eastern sideof the United Kingdom, where rainfall is low, are less likely to exhibit cyclichunting records (Hudson et al. 1985, Hudson 1992). These drier easternmoors tend to be freely drained heath dominated by pure stands of heather,with little Sphagnum moss and, consequently, a shallow peat layer. In con-trast, moors in wetter areas have a mixture of heather and grasses, a thicklayer of Sphagnum moss, and a deep peat layer that may be up to severalmeters thick.
The free-living stages of trichostrongyle worms require moisture for devel-opment to the third-stage infective larvae. A film of moisture is also requiredto aid worm movement up the vegetation to where it can be ingested by itshost (Saunders et al. 2000). As moisture levels decline, fewer infective stagesare available to infect grouse (Saunders et al. 1999, 2000). Hudson et al.(1985) recorded significantly lower worm intensities from non-cyclic popula-tions, where only 4% of the birds had harmful infections compared with 24%from cyclic populations. As there was no difference in the densities of birds inthe two regions, we concluded that the differences in infection levels probablyreflected differences in survival of free-living nematodes and the exposure ofbirds to the infective stages. Thus, the absence of grouse cycles on many freelydrained heather moors is explained by, and provides support for, the parasite-interaction hypothesis.
It is interesting that grouse populations in parts of Scotland have shown areduced tendency to oscillate in recent years (Hudson 1992), a tendency thatdoes not appear to be associated with large-scale changes in habitat. Theexplanation of this phenomenon requires consideration of other naturalenemies, particularly birds of prey and the louping ill virus (see below).
6.7 Louping Ill Virus
Red grouse are killed by a variety of natural enemies besides the strongyleworm, and some of these may have a profound impact on the dynamics ofgrouse and nematode populations. The louping ill virus is transmittedbetween sheep and grouse by the sheep tick, Ixodes ricinus. The virus cancause 80% mortality in exposed grouse, whereas mortality in sheep is variableand depends on breed and history of exposure (Reid et al. 1978). Only sheepand red grouse are viraemic hosts, and permit the amplification of the viruswithin the host to a concentration that leads to subsequent infection of otheruninfected ticks. In most moorland areas where sheep suffer from the virus,shepherds vaccinate their sheep and treat them with acaricides so, in reality,
[08:51 20/5/02 n:/3896 BERRYMAN.751/3896-AllText.3d] Ref: 3896 Auth: Berryman Title: Population Cycle All Chapters Page: 121 1-188
Parasitic Worms and Population Cycles of Red Grouse 121
sheep play no role in the amplification of the virus. Grouse alone are unableto maintain the virus so a large mammalian host is required for female ticksto complete their lifecycle. As no vertical transmission occurs between femaleticks and their eggs, the larval stage must first acquire the virus and then passit on to the grouse in the subsequent nymphal stage. While grouse and sheepare the only viraemic hosts, others can play an important role in the ticklifecycle and amplify the virus (Hudson et al.). One of these is the mountainhare, Lepus timidus, which not only provides a suitable host for the femaletick, but also allows nonviraemic transmission of the virus between cofeedingticks (Jones et al. 1997). Thus, the level of exposure of grouse to the louping illvirus depends on the density of mountain hares in the region. Theoretically, itis possible for the virus to persist in the hare population alone in the totalabsence of grouse (Norman et al. 1999).
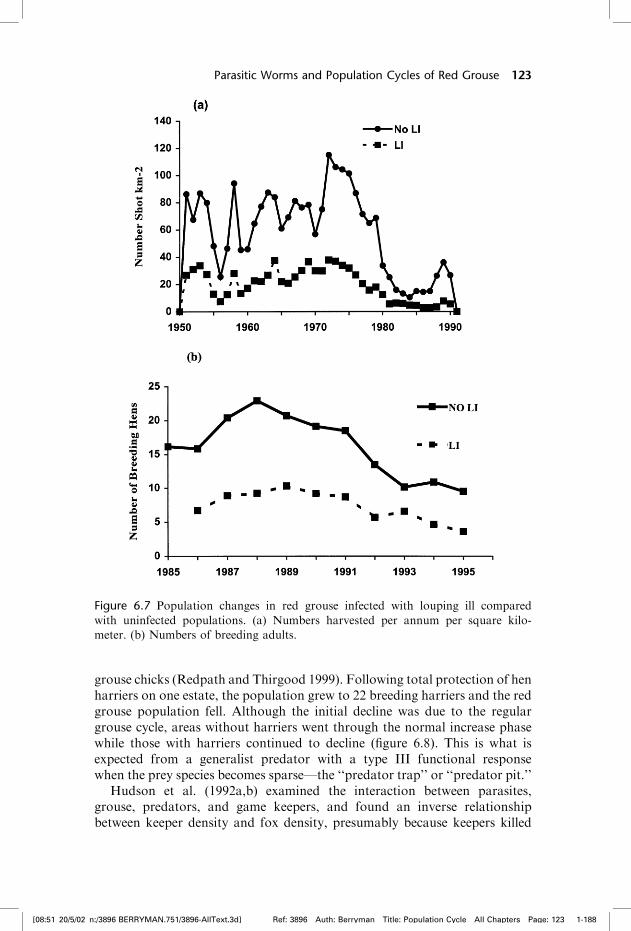
Louping ill mortality in red grouse occurs soon after the emergence of ticksin late spring and coincides with the production of young grouse, leading tosignificant mortality in young birds during early June. This, in turn, results ininfected grouse having lower breeding success, lower bag records, and lowerbreeding densities of grouse (figure 6.7). Reduction in the production ofyoung leads to a population growth rate that can be negative and, in somepopulations, numbers are only maintained by the immigration of grouse inthe following winter (Hudson 1992). Not surprisingly, this heavy mortalityand resultant low population density is followed by lower levels of nematodeinfection and, consequently, by a reduced tendency to cycle. In passing itshould be noted that not all populations of grouse are exposed to ticks andnot all tick populations carry the louping ill virus.
6.8 Predators
Grouse moor keepers are employed by the majority of privately owned estatesto remove predators that take red grouse, principally the fox, Vulpes vulpes,and the carrion crow, Corvus corone (Hudson and Newborn 1995).Historically, this has included all predator species, although birds of preyand some of the threatened mammalian predators are now legally protected.Nevertheless, most keepers believe that birds of prey have a significant impacton grouse populations, so illegal killing of species like hen harriers, Circuscyaneus, still occurs.
An intensive and extensive investigation has recently been completed on therelationship between grouse and hen harriers. While there is no clear numer-ical response of harriers to grouse populations, they do exhibit a type IIIfunctional response when feeding on grouse and, as is well known, thiscould have a stabilizing effect on grouse population dynamics (Redpath andThirgood 1999). The settlement of breeding harriers in relation to prey avail-ability is positively related to the density of meadow pipits, indicating theybreed in areas where pipits are abundant. Meadow pipits are a major food forthe smaller males but, once established, the larger females tend to feed on red
[08:51 20/5/02 n:/3896 BERRYMAN.751/3896-AllText.3d] Ref: 3896 Auth: Berryman Title: Population Cycle All Chapters Page: 122 1-188
122 Population Cycles
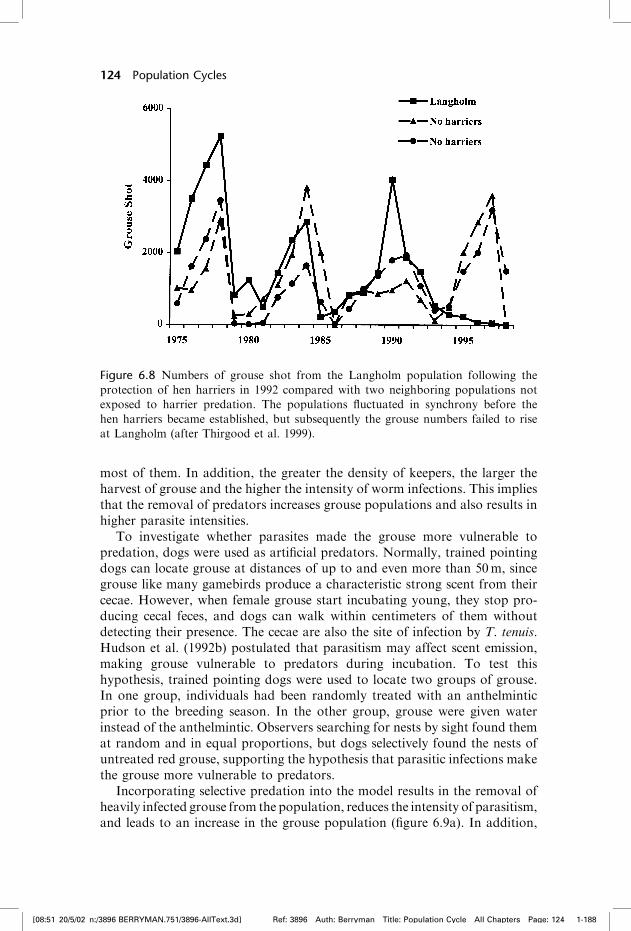
grouse chicks (Redpath and Thirgood 1999). Following total protection of henharriers on one estate, the population grew to 22 breeding harriers and the redgrouse population fell. Although the initial decline was due to the regulargrouse cycle, areas without harriers went through the normal increase phasewhile those with harriers continued to decline (figure 6.8). This is what isexpected from a generalist predator with a type III functional responsewhen the prey species becomes sparse—the ‘‘predator trap’’ or ‘‘predator pit.’’
Hudson et al. (1992a,b) examined the interaction between parasites,grouse, predators, and game keepers, and found an inverse relationshipbetween keeper density and fox density, presumably because keepers killed
[08:51 20/5/02 n:/3896 BERRYMAN.751/3896-AllText.3d] Ref: 3896 Auth: Berryman Title: Population Cycle All Chapters Page: 123 1-188
Parasitic Worms and Population Cycles of Red Grouse 123
Figure 6.7 Population changes in red grouse infected with louping ill compared
with uninfected populations. (a) Numbers harvested per annum per square kilo-
meter. (b) Numbers of breeding adults.
most of them. In addition, the greater the density of keepers, the larger theharvest of grouse and the higher the intensity of worm infections. This impliesthat the removal of predators increases grouse populations and also results inhigher parasite intensities.
To investigate whether parasites made the grouse more vulnerable topredation, dogs were used as artificial predators. Normally, trained pointingdogs can locate grouse at distances of up to and even more than 50m, sincegrouse like many gamebirds produce a characteristic strong scent from theircecae. However, when female grouse start incubating young, they stop pro-ducing cecal feces, and dogs can walk within centimeters of them withoutdetecting their presence. The cecae are also the site of infection by T. tenuis.Hudson et al. (1992b) postulated that parasitism may affect scent emission,making grouse vulnerable to predators during incubation. To test thishypothesis, trained pointing dogs were used to locate two groups of grouse.In one group, individuals had been randomly treated with an anthelminticprior to the breeding season. In the other group, grouse were given waterinstead of the anthelmintic. Observers searching for nests by sight found themat random and in equal proportions, but dogs selectively found the nests ofuntreated red grouse, supporting the hypothesis that parasitic infections makethe grouse more vulnerable to predators.
Incorporating selective predation into the model results in the removal ofheavily infected grouse from the population, reduces the intensity of parasitism,and leads to an increase in the grouse population (figure 6.9a). In addition,
[08:51 20/5/02 n:/3896 BERRYMAN.751/3896-AllText.3d] Ref: 3896 Auth: Berryman Title: Population Cycle All Chapters Page: 124 1-188
124 Population Cycles
Figure 6.8 Numbers of grouse shot from the Langholm population following the
protection of hen harriers in 1992 compared with two neighboring populations not
exposed to harrier predation. The populations fluctuated in synchrony before the
hen harriers became established, but subsequently the grouse numbers failed to rise
at Langholm (after Thirgood et al. 1999).
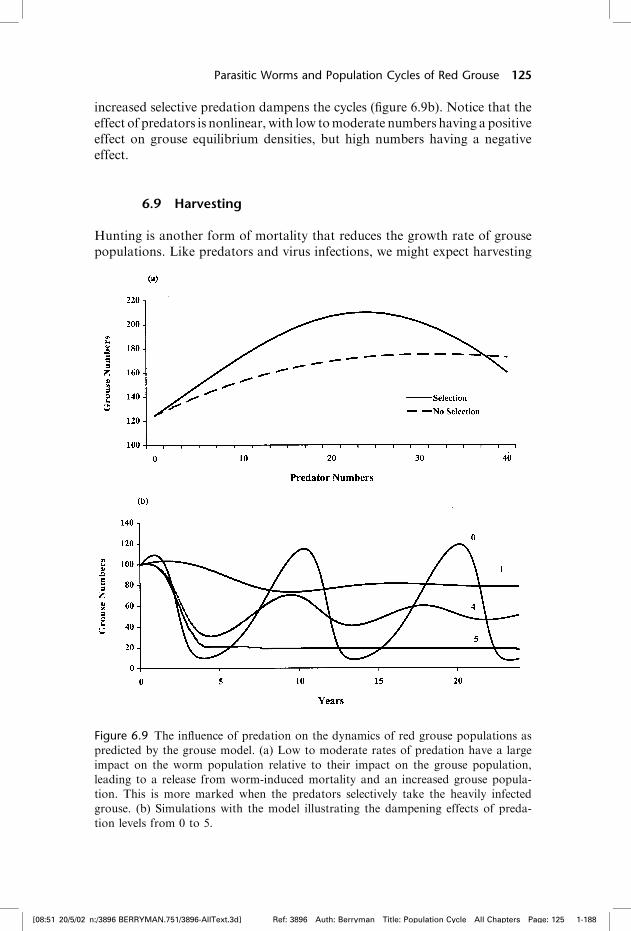
increased selective predation dampens the cycles (figure 6.9b). Notice that theeffect of predators is nonlinear, with low tomoderate numbers having a positiveeffect on grouse equilibrium densities, but high numbers having a negativeeffect.
6.9 Harvesting
Hunting is another form of mortality that reduces the growth rate of grousepopulations. Like predators and virus infections, we might expect harvesting
[08:51 20/5/02 n:/3896 BERRYMAN.751/3896-AllText.3d] Ref: 3896 Auth: Berryman Title: Population Cycle All Chapters Page: 125 1-188
Parasitic Worms and Population Cycles of Red Grouse 125
Figure 6.9 The influence of predation on the dynamics of red grouse populations as
predicted by the grouse model. (a) Low to moderate rates of predation have a large
impact on the worm population relative to their impact on the grouse population,
leading to a release from worm-induced mortality and an increased grouse popula-
tion. This is more marked when the predators selectively take the heavily infected
grouse. (b) Simulations with the model illustrating the dampening effects of preda-
tion levels from 0 to 5.
to also have a stabilizing effect on grouse dynamics. The fact is, however, thatgrouse population fluctuations occur in the presence of hunting. The probablereason for this is that worm recruitment generally occurs just prior to theshooting season, so that hunting has little effect on the density-inducednegative feedback responsible for the grouse cycle (Hudson 1986b).
6.10 Discussion and Summary
Populations of harvested red grouse exhibit cyclic fluctuations in abundancethat vary in period and amplitude. We examined the hypothesis that theparasitic nematode T. tenuis increases numerically in response to grouse den-sity, reduces the breeding success of female grouse and, through this delayednegative feedback loop, generates the cycles of abundance in grouse popula-tions. Experimental studies of individual grouse confirmed that parasitesreduce brood production. Realistic models of the parasite–host interactiongenerate cycles of similar period and amplitude to those observed in the field.Large-scale experiments conducted at the population level show that suppres-sion of parasite infections greatly reduces the amplitude of the populationcycle. Noncyclic populations were found to have lower infection levels, prob-ably because habitat conditions reduced infection rates. Moderate levels ofselective predation on heavily infected grouse dampens the cycles andincreases the overall abundance of grouse. Natural enemies such as henharriers and the tick-borne virus that causes louping ill disease reduce thesurvival of young grouse and tend to dampen oscillations. Harvesting doesnot seem to have this effect, probably because the period of worm recruitmentoccurs after chick mortality and before harvesting. None of the evidencediscussed above is inconsistent with the hypothesis that population cyclesin the red grouse are caused by delayed negative feedback between grouseand nematode parasite populations.
The significant role of parasites in causing red grouse cycles may well be adirect consequence of the activity of keepers protecting grouse from predators;that is, once predators are removed, the increasing population is subject toincreasing levels of worm infection, which then cause reduced breeding pro-duction and a cyclic decline. Some workers consider this to be a rather excep-tional case. However, there are a number of other cases where parasites arethought to play some role in population cycles. For example, there is increas-ing evidence that food quality interacting with parasitic nematodes is respon-sible for Soay sheep oscillations on St. Kilda (Gulland 1992); rock partridgesexhibit unstable dynamics in northern Italy (Cattadori et al. 1999) that appearto be associated with infection by parasitic geohelminths (Rizzoli et al. 2000);population cycles of willow ptarmigan in Norway seem to be associated withthe community of parasites that infect them (Holmstad and Skorping 1998);and, finally, unstable dynamics in Svalbard reindeer appear to be caused by theeffects of gut helminths (Halvorsen and Bye 1999). The general pattern thatemerges from all these examples is that there is a single host–parasite interac-
[08:51 20/5/02 n:/3896 BERRYMAN.751/3896-AllText.3d] Ref: 3896 Auth: Berryman Title: Population Cycle All Chapters Page: 126 1-188
126 Population Cycles
tion where the parasite induces reduced breeding production. However, whereother hosts play a significant role in the parasite lifecycle, the dynamicsbecome more stable (Hudson and Greenman 1998).
This is not to say that red grouse cycles, or indeed cycles in any grousespecies, are always caused by parasites. Such an extrapolation is risky at best.Unfortunately, there is currently no sound experimental evidence from otherareas to test the hypotheses. There is, however, evidence that predators mayplay a significant role in some cyclic populations. For example, detailedstudies over 16 years strongly suggest that the dynamics of rock ptarmiganin Iceland are destabilized by gyrfalcon predation (Nielsen 1999). What wecan probably say with confidence is that one type of natural enemy, theparasites, can have an important destabilizing effect on some grouse popula-tions some of the time. Other natural enemies and resources, together withdemographic features like spatial social structuring and age structure, caninteract with stochastic and seasonal variations to influence the final patternof fluctuation.
ACKNOWLEDGMENTS
We would like to thank all our scientific colleagues for their support and stimulating
discussion on the subject of red grouse population cycles, especially Steve Redpath,
Simon Thirgood, Bryan Grenfell, and Francois Mougeot. We also extend our grati-
tude to the landowners and keepers who allowed us to work on their land, and our
warmest admiration to the dogs that actually did the fieldwork with enthusiasm and
dedication. Finally we would also like to thank Robert Moss and Alan Berryman for
their constructive comments and editorial suggestions.
REFERENCES
Anderson, R. M. and R. M. May. 1978. Regulation and stability of host–parasite
interactions. I. Regulatory processes. J. Anim. Ecol. 47: 219–249.
Cattadori, I. M. C., P. J. Hudson, S. Merler, and A. P. Rizzoli. 1999. Temporal and
spatial dynamics of rock partridge populations (Alectoris graecae) in northern
Italy. J. Anim. Ecol. 68: 540–549.
Cobbold, T. S. 1873. The grouse disease. The Field, London. p. 15.
Dobson, A. P. and P. J. Hudson. 1992. Regulation and stability of a free-living host–
parasite system, Trichostrongylus tenuis in red grouse. II. Population models. J.
Anim. Ecol. 61: 487–498.
Dobson, A. P. and P. J. Hudson. The interaction between the parasites and predators
of red grouse Lagopus lagopus scoticus. Ibis 137 (Suppl. 1): 87–96.
Gulland, F. M. D. 1992. The role of parasites in Soay sheep (Ovis aries) mortality
during a population crash. Parasitol. 105: 493–503.
Gurney, W. S. C. and R. M. Nisbett. 1998. Ecological dynamics. Oxford University
Press, Oxford.
Halvorsen, O. and K. Bye. 1999. Parasites, biodiversity and population dynamics in an
ecosytem in the High Arctic. Vet. Parasit. 84: 205–227.
[08:51 20/5/02 n:/3896 BERRYMAN.751/3896-AllText.3d] Ref: 3896 Auth: Berryman Title: Population Cycle All Chapters Page: 127 1-188
Parasitic Worms and Population Cycles of Red Grouse 127

Holmstad, P.R. and A. Skorping. 1998. Covariation of parasite intensities in willow
ptarmigan, Lagopus lagopus L. Can. J. Zool. 76: 1581–1588.
Hudson, P. J. 1986a. The effect of a parasitic nematode on the breeding production of
red grouse. J. Anim. Ecol. 55: 85–94.
Hudson, P. J. 1986b. The red grouse, the biology and management of a wild gamebird.
The Game Conservancy Trust, Fordingbridge, 250 pp.
Hudson, P. J. 1992. Grouse in space and time. The Game Conservancy Trust,
Fordingbridge, 250 pp.
Hudson, P. J. and A. P. Dobson. 1996. Transmission dynamics and host–parasite
interactions of Trichostrongylus tenuis in red grouse. J. Parasitol. 83: 194–202.
Hudson, P. J. and J. V. Greenman. 1998. Parasite mediated competition. Biological
and theoretical progress. Trends Ecol. Evol. 13: 387–390.
Hudson, P. J. and D. Newborn. 1995. A handbook of grouse and moorland manage-
ment. The Game Conservancy Trust, Fordingbridge, 169 pp.
Hudson, P. J., A. P. Dobson, and D. Newborn. 1985. Cyclic and non-cyclic popula-
tions of red grouse: a role for parasitism? In D. Rollinson and R. M. Anderson
(Eds.) Ecology and genetics of host–parasite interactions. Academic Press,
London, pp 79–89.
Hudson, P. J., A. P. Dobson, and D. Newborn. 1992a. Do parasites make prey
vulnerable to predation? Red grouse and parasites. J. Anim. Ecol. 61: 681–692.
Hudson, P. J., D. Newborn, and A. P. Dobson. 1992b. Regulation and stability of a
free-living host–parasite system, Trichostrongylus tenuis in red grouse. I.
Monitoring and parasite reduction experiments. J. Anim. Ecol. 61: 477–486.
Hudson, P. J., R. Norman, M. K. Laurenson, D. Newborn, M. Gaunt, H. Reid, E.
Gould, R. Bowers, and A. P. Dobson. 1995. Persistence and transmission of tick-
borne viruses: Ixodes ricinus and louping-ill virus in red grouse populations.
Parasitol. 111: S49–S58.
Hudson, P. J., E. A. Gould, M. K. Laurenson, M. Gaunt, H. W. Reid, J. D. Jones, R.
Norman, K. MacGuire, and D. Newborn. 1997. The epidemiology of louping-ill,
a tick borne viral infection of grouse and sheep. Parasitologia 39: 319–323.
Hudson, P. J., A. P. Dobson, and D. Newborn. 1998. Prevention of population cycles
by parasite removal. Science 282: 2256–2258.
Hudson, P. J., A. P. Dobson, and D. Newborn. 1999. Population cycles and parasit-
ism. Science 286: 2425.
Jenkins, D., A. Watson, and R. G. Miller. 1963. Population studies on red grouse,
Lagopus lagopus scoticus (Lath.) in north-east Scotland. J. Anim. Ecol. 32: 317–
376.
Jones, L. D., M. Gaunt, R. S. Hails, K. Laurenson, P. J. Hudson, H. Reid, P. Henbest,
and E. A. Gould. 1997. Efficient transfer of louping ill virus between infected and
uninfected ticks cofeeding on mountain hares (Lepus timidus).Med. Vet. Entomol.
11: 172–176.
Lack, D. 1954. The natural regulation of animal numbers. Oxford University Press,
Oxford.
Lambin, X., C. J. Krebs, R. Moss, N. C. Stenseth, and N. G. Yoccoz. 1999.
Population cycles and parasitism. Science 286: 2425.
Laurenson, M. K., P. J. Hudson, K McGuire. S. J. Thirgood, and H. W. Reid. 1998.
Efficacy of acaricidal tags and pour-on as prophylaxis against ticks and louping-
ill in red grouse. Med. Vet. Entomol. 11: 389–393.
Lovat, L. 1911. The grouse in health and disease. Smith, Elder and Co., London, p. 512.
[08:51 20/5/02 n:/3896 BERRYMAN.751/3896-AllText.3d] Ref: 3896 Auth: Berryman Title: Population Cycle All Chapters Page: 128 1-188
128 Population Cycles
MacDonald, D. G. F. 1883. Grouse disease: its causes and remedies. W. H. Allen and
Co., London, p. 189.
Mackenzie, J. M. D. 1952. Fluctuations in the numbers of Tetraonidae. J. Anim. Ecol.
21: 128–153.
May, R. M. 1976. Theoretical ecology. Principles and applications. Blackwell Scientific,
Oxford.
May, R. M. and R. M. Anderson. 1978. Regulation and stability of host–parasite
interactions. II. Destabilizing. J. Anim. Ecol. 47: 249–268.
Moran, P. A. P. 1952. The statistical analysis of gamebird records. J. Anim. Ecol. 21:
154–158
Moss, R. and A. Watson. 1991. Population cycles and kin selection in red grouse
Lagopus lagopus scoticus. Ibis Suppl. 1: 113–120.
Nielsen, O. K. 1999. Gyrfalcon predation on ptarmigan: numerical and functional
responses. J. Anim. Ecol. 68: 1034–1050.
Norman, R., R. G. Bowers, M. E. Begon, and P. J. Hudson. 1999. Persistence of tick
borne virus in the presence of multiple host species: tick reservoirs and parasite
mediated competition. J. Theor. Popul. Biol. 200: 111–118.
Potts, G. R., S. C. Tapper, and P. J. Hudson. 1984. Population fluctuations in red
grouse: analysis of bag records and a simulation model. J. Anim. Ecol. 53: 21–36
Redpath, S. M. and S. J. Thirgood. 1999. Numerical and functional responses of
generalist predators: harriers and peregerines on grouse moors. J. Anim. Ecol.
68: 879–892.
Reid, H. W., J. S. Duncan, J. D. P. Phillips, R. Moss, and A. Watson. 1978. Studies of
louping ill virus in wild red grouse (Lagopus lagopus scoticus). J. Hygiene 81: 321–
329
Ricklefs, R. E. 1979. Ecology. Thomas Nelson, Melbourne.
Rizzoli, A., P. J. Hudson, M. T. Manfredi, F. Rosso, and I. M. C. Cattadori. 2000.
Intensity of nematode infections in cyclic and non-cyclic rock partridge popula-
tions. Parasitologia 41: 561–565.
Saunders, L. M., D. Tompkins, and P. J. Hudson. 1999. Investigating the dynamics of
nematode transmission to the red grouse (Lagopus lagopus scoticus): studies on
the recovery of Trichostrongylus tenuis larvae from vegetation. J. Helminthol. 73:
171–175.
Saunders, L. M., D. Tompkins, and P. J. Hudson. 2000. Spatial aggregation and
temporal migration of free-living stages of the parasitic nematode
Trichostrongylus tenuis. Funct. Ecol. 14: 468–473.
Shaw, J. L. 1988. Arrested development in Trichostrongylus tenuis as third stage larvae
in red grouse. Res. Vet. Sci. 48: 256–258.
Shaw, D. J. and A. P. Dobson. 1995. Patterns of macroparasite abundance and
aggregation in wildlife populations: a quantitative review. Parasitol. 111: 111–
134.
Thirgood, S. J., D. Haydon, P. Rothery, P. Redpath, I. Newton, and P. J. Hudson.
1999. Habitat loss and raptor predation: disentangling long- and short-term
causes of red grouse declines. Proc. Roy. Soc. 267: 651–656.
Watson, H., D. L. Lee, and P. J. Hudson. 1987. The effect of Trichostrongylus tenuis
on the caecal mucosa of young, old and anthelmintic treated wild red grouse
Lagopus lagopus scoticus. Parasitol. 94: 405–411.
Wynne-Edwards, V. C. 1986. Groups selection. Blackwell Scientific, Oxford.
[08:51 20/5/02 n:/3896 BERRYMAN.751/3896-AllText.3d] Ref: 3896 Auth: Berryman Title: Population Cycle All Chapters Page: 129 1-188
Parasitic Worms and Population Cycles of Red Grouse 129