parametric studies on the formation of diesel particulate matter via nucleation and coagulation...
TRANSCRIPT

Aerosol Science 33 (2002) 1609–1621www.elsevier.com/locate/jaerosci
Parametric studies on the formation of diesel particulate mattervia nucleation and coagulation modes
Donghee Kima;b, Mridul Gautama, Dinesh Gerac;∗
aDepartment of Mechanical and Aerospace Engineering, West Virginia University, Morgantown, WV 26506, USAbREM Engineering Services, 3537, Collins Ferry Road, Morgantown, WV 26505, USA
cFluent Inc., 3647 Collins Ferry Road, Morgantown, WV 26505, USA
Received 27 May 2002; received in revised form 30 July 2002; accepted 1 August 2002
Abstract
The objective of this study is to develop a physical model that accurately accounts for the nucleation,coagulation, and condensation processes in the formation of particulate matter (PM) inside the exhaust plumeof the diesel-fueled vehicles. The PM concentration has been predicted based on the fuel sulfur content,fuel-to-air ratio, exhaust 1ow rate, and the ambient conditions. It was predicted that the critical nucleusdiameter of the particles decreased by approximately 30% and the number concentration increased by afactor of 6 with the increase in relative humidity from 10% to 90% for a fuel with 50 ppm sulfur content.The parametric studies suggested that the condensation e5ects are very important near the stack. Ignoring thecontribution from condensation term decreased PM count median diameter from 52 to 10 nm. A fair agreementis observed between the numerically predicted PM size distribution and concentration and the experimentallymeasured values.? 2002 Elsevier Science Ltd. All rights reserved.
Keywords: Nucleation; Coagulation; Condensation; Plume; Diesel particulate matter
1. Introduction
In recent years, automobile industries have met stringent particulate matter (PM) emission stan-dards primarily through advances in engine and control technologies (Kirchstetter, Harley, Kreisberg,Stolzenburgh, & Hering, 1999). Particulate matter emissions, based on mass concentrations, have
∗ Corresponding author. Tel.: +1-304-598-7934; fax: +1-304-598-7185.E-mail address: [email protected] (D. Gera).
0021-8502/02/$ - see front matter ? 2002 Elsevier Science Ltd. All rights reserved.PII: S0021-8502(02)00119-2
1610 D. Kim et al. / Aerosol Science 33 (2002) 1609–1621
been reduced due to improvements in the fuel injection system, control of fuel injection rate, andelectronic control for precise timing of fuel injection (Sawyer et al., 1998). This is due to the fact thatcurrent emissions and air quality standards are based on the assumption that mass concentration is thecritical indicator, but this assumption is no longer deEnitive. An example of the inadequacy of currenttechnological advancements is that, even as the levels of total particulate mass concentrations aredecreasing, the total number concentration levels of Ene particulates remain unchanged or increase.Recent technical solutions aimed at reductions in total particle emissions do not necessarily resultin concomitant reductions in ultra Ene particle (¡ 100 nm) emissions; in some cases, in fact theopposite e5ect is observed, resulting in increased emissions of Ene particles (Brown, Calyton, Harris,& King, 2000). An example of this is demonstrated by the fact that the reduction of the total massemissions of motor vehicles in the US was by a factor of about 10, but at the same time the numberof Ene particles emitted increased by a factor of about 20 (Sawyer & Johnson, 1995). In recentyears, the aspect of particle size that is attracting the greatest attention is the in1uence of Ene andultra Ene particles’ number concentration on human health (Kim, 2002). The knowledge of particlenumber concentration, which is strongly in1uenced by particulate matter formation during dilutionof exhaust gases with the ambient air, however is very limited. The objective of this paper is topresent the e5ect of local dilution of the diesel engine’s exhaust with the ambient, relative humidityof the ambient, and the SO2 concentration of diesel on the formation of nuclei particles, and growthof these ultra Ene particles via coagulation process.
This study is important because a signiEcant proportion of diesel emission particulates have aero-dynamic diameters smaller than 1 �m. Small airborne particles less than 1 �m in diameter have ahigh probability of deposition in the respiratory tract, and are likely to trigger or exacerbate res-piratory diseases. Small particles have also higher burdens of toxins, which when absorbed in thebody can result in health consequences other than respiratory health e5ects (Dockery et al., 1993;Pope et al., 1995). These particles are primarily elemental carbon, but contain also adsorbed orcondensed hydrocarbons, hydrocarbon derivatives, sulfur compounds, and other materials. Solventextractable organic components of diesel aerosols represent 5–40% of the particle mass dependingon the fuel and the operating conditions, e.g., engine speed, power, torque, and temperature of thevehicle (Morawska, BoEnger, Kocis, & Nwankwoala, 1998).
It is well known for some time that diesel exhaust contains large quantities of small nano-particles(Kittelson, Dolan, & Verrant, 1978), which are formed in part due to the continuation of in-stackcoagulation and adsorption, along with the condensation of signiEcant quantities of organics andinorganics present in diesel exhaust. Sulfur, found in the diesel fuels, is oxidized in the com-bustion chamber to give sulfur dioxide vapors, and as the exhaust gases cool in the ambientcondenses to form H2SO4 droplets or nuclei particles (Baumgard & Johnson, 1996; Bessagnet& Rosset, 2001). The driving force for this gas-to-particle conversion process is the saturationratio (S). For materials like the constituents of the soluble organic fraction (SOF) or sulfuric acid,the maximum saturation is achieved during dilution and cooling of the exhaust (Kittelson, 1998).The relative rates of nucleation are an extremely nonlinear function of saturation ratio (Kim, 2002;Baumgard & Johnson, 1996). From a recent comparison of an old technology and new technol-ogy engine (Kittelson, 1998), it was seen that the old technology engines take up supersaturatedvapor quickly and prevent saturation ratio from rising high enough to produce nucleation, but emit-ted a lot of unburned carbon or soot. On the other hand, in modern low emission engines thereis little surface area available to adsorb supersaturated vapors making nucleation more likely to
D. Kim et al. / Aerosol Science 33 (2002) 1609–1621 1611
occur. These observations were primarily qualitative, and were used to evaluate the e5ect of thesesmall particles on the environment. However, the current state-of-the-art models allow computa-tional 1uid dynamics (CFD) analysts to predict the size and concentration of these small nanosizedparticles.
Condensation is similar to the nucleation process, which occurs when the saturation ratio is greaterthan unity, except in condensation—material condenses onto the surface of the existing particlesinstead of forming new particles (Hinds, 1982). Ahlvik, Ntxiachristos, Keskinen, and Virtanen (1998)reported that both condensation and nucleation are dependent upon dilution ratio. It was found thatlower dilution ratios lead to an increase in the saturation pressure itself, because of the respectiveincrease in the dilution temperature.
Lushnikov and Kulmala (2000) analyzed the source-enhanced formation of disperse particles.It was inferred that the nucleation-generated particles grew as a result of the condensation andcoagulation of a low volatile vapor on the particles’ surfaces. Their results showed that the vaporand newly formed particles concentrations decreased with time after a short nucleation burst. Particleformation and growth was in1uenced by the ratio of vapor mass converted to newly formed particlesand the source productivity.
It should be mentioned here that the combustion-generated particles are typically agglomeratesof primary particles or “spherules” that have diameters of around 15–40 nm (Steiner, Burtscher, &Gross, 1992). The agglomeration takes place due to the relative movement and coagulation of thespherules, resulting in the formation of small clusters. Coagulation is induced by the Brownian motionof particles and also due to 1uid turbulence along with various inter-particle forces. Theoreticalstudies have shown, however, that over the size range of the current study (20–1000 nm), neitherthe inter-particle forces nor turbulence are very e5ective (Seinfeld & Pandis, 1997). Kerminen et al.(1997) in fact, concluded that the dominating mechanism producing agglomerates in diesel exhaustis likely to be the particle Brownian movement.
There are numerous mathematical models available in the literature examining the dynamics ofa wide range of particulate matter, for example, J-space transformations (Tsang & Brock, 1983),asymptotic representation (Pilinis & Seinfeld, 1987), moment methods (Williams & Loyalka, 1991;McGraw, 1997), Monte Carlo probabilistic collision algorithm (Kruis, Maisels, & Fissan, 2000;Maisels, Kruis, & Fissan, 1999; Lee & Hong, 1998), and parameterized representation (Whitby,1981), among others. However there are a very limited number of studies available in the literature,if any, which take into account the detailed structure of the plume. The current study takes intoaccount the detailed structure of the plume, formed by emission of exhaust gases coming out of adiesel power truck, and it is described in the next section.
2. Governing equations
An accurate and useful plume dispersion model must include the e5ects of turbulent mixing,convection, di5usion, temperature variations, and species transport among others. To this end, thegoverning transport equations for the mean 1uid motion, species, and enthalpy are solved insidethe wind-tunnel space using the commercial computational 1uid dynamics package FLUENTTM (fordetails, see Kim, 2002; Kim, Gautam, & Gera, 2001).
1612 D. Kim et al. / Aerosol Science 33 (2002) 1609–1621
3. Discrete particle dynamics
The evolution of the particle size distribution due to coagulation, nucleation and coagulation isrepresented by the following discrete dynamical equation (Seinfeld & Pandis, 1997):
@Ck
@t=
12
k−1∑j=1
k−j; jCk−jCj − Ck
∞∑j=1
k;jCj
︸ ︷︷ ︸Coagulation
+ J (t)�(k)+︸ ︷︷ ︸Nucleation
1; k−1C1Ck−1 − 1; kC1Ck︸ ︷︷ ︸Condensation
; (1)
where Ck is time (t)-dependent number concentration (No cm−3) of particles of volume vk (cm3), is the coagulation kernel (cm3 No−1 s−1) of two colliding particles, J(t) is the nucleation rate and� is the Kronecker’s delta with the value equal to 1 for the kth bin of volume vk ; and 0 otherwise.The Erst term on the right-hand side of Eq. (1) indicates that a particle of volume vk can only comeinto existence if two particles with volumes vj and vk−j collide. The one-half is required so thateach combination is counted only once.
In the present simulation, to present Brownian coagulation, the Fuchs form of the coagulationkernel i; j is used; and it is expressed in terms of the two particle diameter Dp1 and Dp2 as(Fuchs, 1964)
12 = 2�(D1 + D2)(Dp1 + Dp2)(
Dp1 + Dp2
Dp1 + Dp2 + 2(g21 + g2
2)1=2+
8(Dp1 + Dp2)( Qc2
1 + Qc22)1=2(Dp1 + Dp2)
)−1
;
(2)
where
Kni =2�air
Dpi;
Qci =(
8kT�mi
)1=2
;
li =8Di
� Qci; (3a)
gi =1
3Dpili[(Dpi + li)3 − (D2
pi + l2i )3=2] − Dpi
and
Di =kT
3��tDpi
(5 + 4Kni + 6Kn2
i + 18Kn3i
5 − Kni + (8 + �)Kn2i
); (3b)
where D1 and D2 are the individual Brownian di5usion coeTcients, Dp1 and Dp2 are the diameterof each particle, Kni is the Knudsen number, � is the mean-free-path of suspending gas, k is theBoltzman constant, T is the temperature, m is the mass of particle, and �t is the turbulent viscositycoeTcient. There are various coagulation kernels available elsewhere in the literature (Tambour &Seinfeld, 1980), which are evaluated and reported elsewhere (Kim, 2002).

D. Kim et al. / Aerosol Science 33 (2002) 1609–1621 1613
The H2SO4 hydrate (embryo) formation rate is predicted by the following nucleation equation(Kulmala, Laaksonene, & Pirjola, 1998):
J = C exp(−UG∗=kT ); (4)
where C is the frequency factor, k is Boltzmann’s constant, T is the temperature and UG∗ is theminimum free energy required to form an embryo. The hydration correction for the acid activitiesused in this research used the model suggested by Shi and Harrison (1999). Additional details onthe nucleation model may be viewed elsewhere (Kim, 2002; Kim, Gautam, & Gera, 2002).
The equations arising from the various submodels described in this section are discretized usingthe semi-implicit Enite di5erence scheme. Applying the volume fractions of intermediate particles,the general formula for volume-conserving equation for particle concentration can be written as(Kim et al., 2002; Jacobson, Turco, Jensen, & Toon, 1994)
vkCt+1k
=
vkCt
k + Ut∑k
j=1
{∑k−1i=1 fi;j; ki; jviCt+1
i Ctj
}+ UtJvk(t)�(k) + Utvk1; k−1Ct+1
1 Ct+1k−1
1 + Ut∑NB
j=1 (1 − fi;j; k)k;jCtj + Ut1; k−1Ct
1
:
(5)
The e5ect of local mixing is determined by the turbulent kinetic energy of the 1ow and thetransfer of that energy from the large-scale turbulent structures down the cascading process. Thenumber concentration rate is a5ected because the partial pressure is inversely proportional to dilutionratio. Thus, the e5ect occurs through the saturation ratio. This e5ect is incorporated by dividingthe right-hand side of Eq. (4) with the local dilution ratio at any given spatial location, that is(Kim, 2002)
vkCt+1k
=
vkCt
k + Ut∑k
j=1
{∑k−1i=1 fi;j; ki; jviCt+1
i Ctj
}+ UtvkJ (t)�(k) + Utvk1; k−1Ct+1
1 Ct+1k−1
1 + Ut∑NB
j=1 (1 − fi;j; k)k;jCtj + Ut1; k−1Ct
1
× 1Dilution Ratio
: (6)
The above equation is solved to predict the concentration variation of particulate matter in theexhaust plume of a diesel truck operating at highway speeds. In the following section, the resultsare compared with the measured values of particle concentrations in a wind tunnel. It is also worthmentioning that the coagulation process, manifested in the form of the beta kernel, is governedby the rate of di5usion of particles to the surface of each particle. The process is enhanced whensmall particles with their high di5usion coeTcients di5use to a large particle with its large surface.A 10-fold di5erence in particle size produces a three-fold increase in coagulation, and a 100-folddi5erence results in a more than 25-fold increase in coagulation rate (Willeke & Baron, 1992).
The equations arising from the various submodels described in this section are discretized using thesemi-implicit Enite di5erence scheme. The numerical prediction of particulate matter size distributionand concentration using the above sub-models is presented and discussed in the next section.
1614 D. Kim et al. / Aerosol Science 33 (2002) 1609–1621
4. Simulation conditions
In recent years, considerable attention has been focused on the physical and chemical characteristicsof PM emissions from internal combustion engines. It is imperative that the exhaust plume structure,and its response to the local 1ow and temperature Eelds be known under representative speedand load conditions to accurately predict the PM size and concentration from the diesel poweredheavy duty vehicles. The time and spatial scales associated with the gas-to-particle transformationsand particle growth are small, hence a near-Eeld plume study becomes important. To this end, anEulerian advection–di5usion equation with the k– turbulence closure (for details see Kim et al.,2001) is solved using a commercially available CFD software FluentTM, to accurately predict theplume structure from an exhaust of a diesel engine truck inside the wind tunnel.
The geometry of the heavy-duty on-road tractor truck powered by a diesel engine rated at 330 hp,which was used during a NASA Langley wind tunnel has been discretized using approximately500,000 hexahedral and tetrahedral control volumes (cells) as shown in Fig. 1. The dimensions ofthe truck were 28 ft (8:4 m) long, 8 ft (2:44 m) wide and 13 ft (4 m) high, and the dimensions ofthe wind-tunnel test section used in the current simulation were 90 ft (27:4 m) × 60 ft (18:3 m) ×30 ft (9:1 m). The air velocity provided by fans in the wind tunnel was approximately 24:6 m=s,which simulated the situation of a truck traveling at 55 mph on a highway. The exhaust was emit-ted out at 29:8 m=s through a 5′′ (0:13 m) diameter stack behind the truck’s cabin (more detaileddiscussion of the experimental conditions may be found in Boyce, Mehta, Gautam, & Clark, 2000;Gautam, Xu, Ayala, & Mehta, 2000). The CO2 concentration in the raw exhaust (undiluted exhaust)was 6% under the steady state operation of 55 mph. The gas 1ow in the above conEguration isdescribed by the time-averaged equations of global mass, momentum, enthalpy and species massfractions. The standard k– turbulence closure and Enite rate chemistry/eddy dissipation has beenused in the current CFD simulation.
5. Results and discussion
To test the model, simulation results were compared to measurements of relative CO2 concen-tration, temperature variations, and dilution ratios inside a dispersing plume emanating from thetruck’s exhaust pipe inside the Langley wind tunnel. These variations were averaged concentrationand temperature values obtained at a predetermined sampling rate and time. Data were collected atthe several locations perpendicular to the direction of 1ow inside the plume, and at certain distancesdownstream of the source along the centerline of the plume. The dilution ratio (DR), an importantparameter for the current simulation, was measured from the ratio of the raw CO2 concentration(C0) to the value of CO2 at a given location C(x; y; z) as
DR =C0 − Background Concentration
C(x; y; z) − Background Concentration: (7)
The DR predicted from the CFD model is compared with the experimental data measured alongthe centerline of the plume elsewhere (Kim et al., 2001). The curve Et for the dilution ratio as a

D. Kim et al. / Aerosol Science 33 (2002) 1609–1621 1615
Fig. 1. Computational grid of truck inside the wind tunnel. (Locations A, B, C and D are 20′′ (0:5 m); 80′′ (2:0 m);200′′ (5:0 m), and 337′′ (8:6 m), respectively, from the source.)
function of the distance (x), measured in meters is found to be of the form (Kim, 2002)
DR = 16:1x1:36: (8)
In order to determine the nucleation rate, it is necessary to convert the fuel sulfur to the H2SO4
vapor pressure in dilution tunnel as done previously by Baumgard and Johnson (1996). First, theexhaust SO4 concentration can be determined from the following relation:
[SO4] = (F=A)(% fuel sulfur)(%S to SO4 conv:)(MSO4=Mexhaust)(1 − F=A) density); (9)
where (F=A = 0:035) is the fuel-to-air ratio, MSO4 is the molecular weight of SO4; Mexhaust is theapparent molecular weight of the exhaust stream, %S to SO4 is assumed to be 0.04 (Baumgard &Johnson, 1996; Shi & Harrison, 1999), and the density of air is assumed to be 1:186 kg=m3. Thenext step is to convert the actual dilution tunnel SO4 concentration to H2SO4 vapor pressure. Notingthat m=V is the H2SO4 concentration, the vapor pressure PH2SO4 can be determined by using theideal gas equation:
PH2SO4 = (m=V )RT=M; (10)
where V is the volume (m3); R is the universe gas constant, M is the molecular weight of exhaust,and T is the temperature.
The PM size distribution and concentration obtained from Eq. (6) with the contribution from nucle-ation, coagulation and condensation terms at location A (20′′ from the stack outlet; seeFig. 1 for location) is shown in Fig. 2. The PM size distribution at location A is presented at200 ms. The elapse of 200 ms is calculated by assuming that location A is approximately 5 m fromthe exhaust valves of the diesel engine where the nucleation process is Erst initiated, and the exhaustis coming out at the rate of 25 m=s. In the present case, geometric ratios of 1.4, 1.2, and 1.05 weretried to check the grid-independent solutions. It was found that there was no signiEcant di5erencein the results obtained from the geometric ratio of 1.2 and 1.05. Hence, the geometric ratio of 1.05is used for the discretization of bin sizes in the current computations. It may also be seen fromFig. 2 that if the contribution from condensation term is included then the PM count median diame-ter (CMD: inferred from the peak diameter) shifts to the right from approximately 10–52 nm. This

1616 D. Kim et al. / Aerosol Science 33 (2002) 1609–1621
1.0E+04
1.0E+05
1.0E+06
1.0E+07
1.0E+08
1 10 100 1000
Location Ax=20 ′′
nucleation+coagulation+condensation
nucleation+coagulation
1.0E+04
1.0E+05
1.0E+06
1.0E+07
1.0E+08
1 10 100 1000
Location A
nucleation+coagulation+condensation
nucleation+coagulation
1.0E+04
1.0E+05
1.0E+06
1.0E+07
1.0E+08
1 10 100 1000
Location A
nucleation+coagulation+condensation
nucleation+coagulation
Diameter Dp (nm)
dN
/dlo
g (
Dp)
(No
. cm
-3)
Fig. 2. Particle concentration variation with diameter at a location 0:5 m (20′′) from the stack outlet by considering (a)nucleation+coagulation, and (b) nucleation+coagulation+condensation e5ects; (—) numerical model; (�) experimentaldata.
0
1
0 60 8040
Nuc
leus
Siz
e (n
m)
Relative Humdity (%)90 1007050302010
1.2
0.8
0.6
0.4
0.2
Fig. 3. E5ect of critical nucleation diameter as a function of relative humidity.
shift may be attributed to the fact that the condensation essentially increases the nucleus radius. Aslight asymmetry in the curve around CMD may be attributed to the di5erence in the rate of pro-duction of new particles by nucleation and the rate of coagulation of these particles to form biggerparticles from the existing particles via collisions. In the beginning, nucleation rate is high and thecoagulation rate is small. As the time progresses the nucleation rate does not change signiEcantlybut the nucleus size increases, consequently, the coagulation/agglomeration process is enhanced be-cause these nuclei particles with their high di5usion coeTcients di5use to large particles with largesurface area. The collision of small particles with large particles increases the particle size but re-duces the total number of particles at any given instant, and causes the CMD to skew to its right.It is worth mentioning that near the stack outlet, where the rapid dilution of PM concentration withthe ambient air is taking place, condensation e5ects are very important. Additionally, the dip near10 nm in Fig. 2 indicate that the nucleation mode (typically less than 10 nm) is dominant, and thecoagulation/agglomeration of particles is causing the particle diameter to increase.
The e5ect of relative humidity on critical nucleation particle diameter (stable diameter) at tem-perature 25◦C is shown in Fig. 3. Higher the relative humidity, smaller the particle diameter is

D. Kim et al. / Aerosol Science 33 (2002) 1609–1621 1617
040 70
Nu
clea
tio
n R
ate
(No
. cm
-3s-1
)
Relative Humidity (%)
0 10 20 30 50 60 80 90 100
1E+11
2E+11
3E+11
4E+11
5E+11
6E+11
Fig. 4. E5ect of relative humidity on nucleation rate at 25◦C.
8.80E-01
9.00E-01
9.20E-01
9.40E-01
9.60E-01
9.80E-01
1.00E+00
1.02E+00
0 100 200 300 400 500 600 700
Time (milli-sec)
Dia
met
er (
nm
)
300 ppm
125 ppm
13.1 ppm8.80E-01
9.00E-01
9.20E-01
9.40E-01
9.60E-01
9.80E-01
1.00E+00
1.02E+00
0 100 200 300 400 500 600 700
Time (milli-sec)
Dia
met
er (
nm
)
300 ppm
125 ppm
13.1 ppm
Fig. 5. E5ect of fuel sulfur content on nucleus diameter with time for 35% relative humidity.
necessary to become a stable particle. At the lower relative humidity, it requires more energy toget over the saddle point and, therefore, more molecules are necessary to obtain this energy andconsequently the particle diameter is large.
The e5ect of relative humidity on nucleation rate at temperature 25◦C is shown in Fig. 4. Thetrend indicates that the higher relative humidity enhances nucleation. At the higher relative humidity,the bulk phase density of the water molecules also increases, leading to more molecules collidingpre unit time. Therefore, nucleation rate increases with the increasing relative humidity.
Fig. 5 shows the temporal variation of nucleus diameter with time in fuels with di5erent fuelsulfur content at a constant relative humidity 35%. As the sulfur fuel content increases, the nucleusdiameter also decreases. The nucleus diameter increases more rapidly with time at sulfur fuel content300 ppm compared with the sulfur fuel content of 125 ppm or 13:1 ppm.
These current computations have been tested for di5erent fuel sulfur level. The e5ects of di5erentsulfur level (13.1 and 125 ppm) on particle diameter and concentration for the constant relativehumidity (30%) are shown in Figs. 6 and 7, respectively. It may be seen that the model predictionsagree well qualitatively with the experimentally measured values at 0.14 and 0:17 s. The part of thediscrepancy in the comparison of particle number concentration from the numerical model may be

1618 D. Kim et al. / Aerosol Science 33 (2002) 1609–1621
1
Diameter (nm)
dN
/dlo
g (
Dp)
(N
o. c
m-3
)
1.00E+04
1.00E+05
1.00E+06
1.00E+07
1.00E+08
10 100 1000
Experimental Data
Model
Fig. 6. Comparison with experimental data of particle concentration variation with diameter (sulfur fuel level = 13:1 ppm,relative humidity = 30%, dilution ratio = 10).
1
M
Experimental Data
10 100
Diameter (nm)1000
1.00E+02
1.00E+03
1.00E+04
1.00E+05
1.00E+06
1.00E+07
1.00E+08
dN
/dlo
g (
Dp)
(N
o. c
m-3
)
Model
Experimental Data
Fig. 7. Comparison with experimental data of particle concentration variation with diameter (sulfur fuel level = 125 ppm,relative humidity = 30%, dilution ratio = 5).
due to the fact that the interaction of volatile organic compounds, ash in lubricating oil, and theunburned carbon from the fuel droplets is not considered in the present numerical models. Also,volatile organic species are not considered here, though there is evidence that for low sulfur fuelthey are dominant. Additionally, in low sulfur fuels the precursor to nucleation may actually bethe simultaneous presence of NOx and SOx, which may transform to HNO3 and H2SO4 vapors,respectively. Both of these gases have aTnity to saturate water vapors.
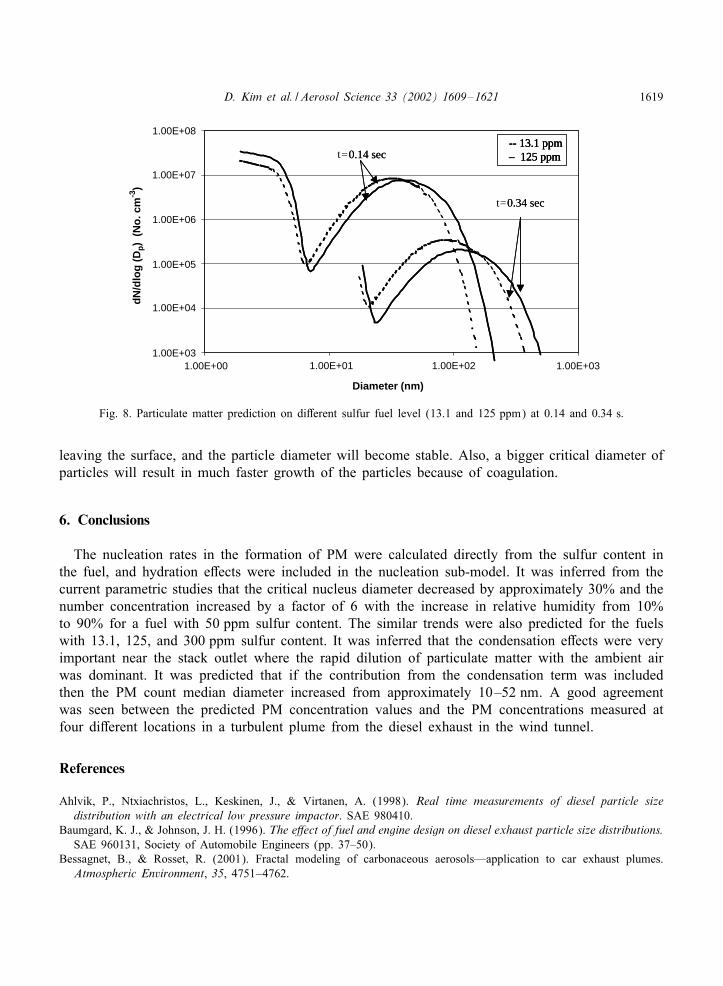
Fig. 8 presents the e5ect of di5erent sulfur fuel content (13.1 and 125 ppm) on particle diameterand concentration at 0.14 and 0:34 s, respectively. It is worth mentioning that the count mediandiameter (CMD) for fuel with sulfur content of 125 ppm shifted to the right more quickly than fuelwith sulfur content of 13:1 ppm. This may be due to the fact that higher fuel–sulfur concentrationresults in higher SO4 concentration in the exhaust. As particles grow, the H2SO4 particle molarfraction decreases due to the addition of H2O molecules, and the vapor pressure above the particlessurface decreases. When the particle’s H2SO4 or H2O vapor pressure equals the species atmosphericvapor pressure, the number of molecules striking the particles surface equals the number of molecules
D. Kim et al. / Aerosol Science 33 (2002) 1609–1621 1619
-- 13.1 ppm– 125 ppmt=0.14 sec
t=0.34 sec
-- 13.1 ppm– 125 ppm-- 13.1 ppm– 125 ppm0.14 sec
0.34 sec
Diameter (nm)
dN
/dlo
g (
Dp)
(N
o. c
m-3
)
1.00E+03
1.00E+04
1.00E+05
1.00E+06
1.00E+07
1.00E+08
1.00E+00 1.00E+01 1.00E+02 1.00E+03
Fig. 8. Particulate matter prediction on di5erent sulfur fuel level (13.1 and 125 ppm) at 0.14 and 0:34 s:
leaving the surface, and the particle diameter will become stable. Also, a bigger critical diameter ofparticles will result in much faster growth of the particles because of coagulation.
6. Conclusions
The nucleation rates in the formation of PM were calculated directly from the sulfur content inthe fuel, and hydration e5ects were included in the nucleation sub-model. It was inferred from thecurrent parametric studies that the critical nucleus diameter decreased by approximately 30% and thenumber concentration increased by a factor of 6 with the increase in relative humidity from 10%to 90% for a fuel with 50 ppm sulfur content. The similar trends were also predicted for the fuelswith 13.1, 125, and 300 ppm sulfur content. It was inferred that the condensation e5ects were veryimportant near the stack outlet where the rapid dilution of particulate matter with the ambient airwas dominant. It was predicted that if the contribution from the condensation term was includedthen the PM count median diameter increased from approximately 10–52 nm. A good agreementwas seen between the predicted PM concentration values and the PM concentrations measured atfour di5erent locations in a turbulent plume from the diesel exhaust in the wind tunnel.
References
Ahlvik, P., Ntxiachristos, L., Keskinen, J., & Virtanen, A. (1998). Real time measurements of diesel particle sizedistribution with an electrical low pressure impactor. SAE 980410.
Baumgard, K. J., & Johnson, J. H. (1996). The e6ect of fuel and engine design on diesel exhaust particle size distributions.SAE 960131, Society of Automobile Engineers (pp. 37–50).
Bessagnet, B., & Rosset, R. (2001). Fractal modeling of carbonaceous aerosols—application to car exhaust plumes.Atmospheric Environment, 35, 4751–4762.

1620 D. Kim et al. / Aerosol Science 33 (2002) 1609–1621
Boyce, J., Mehta, S., Gautam, M., & Clark, N. N. (2000). Heavy duty diesel truck research in the ODU/Langley windtunnel (CRC E-43). 10th CRC on-road vehicle emissions workshop, San Diego, CA, March 27–29, 2000.
Brown, J. E., Calyton, M. J., Harris, D. B., & King Jr., F. G. (2000). Comparison of the particle size distribution ofheavy-duty diesel exhaust using a dilution tailpipe sampler and an in-plume sampler during on-road operation. Journalof Air & Waste Management Association, 50, 1407–1416.
Dockery, D. W., Pope, C. A., Xu, X., Spengler, J. D., Ware, J. H., Fay, M. E., Ferris, B. G., & Seizer, F. E. (1993). Anassociation between air pollution and mortality in six U.S. cities. Massachusetts Medical Society Journal of Medicine,329, 1753–1759.
Fuchs, N. (1964). The mechanics of aerosols. New York: The Macmillan Company.Gautam, M., Xu, Z., Ayala, A., & Mehta, S. (2000). Diesel exhaust plume studies. Wind tunnel experiments and modeling.
Fourth ETH nanoparticle measurement workshop, Zurich, August 7–9, 2000.Hinds, W. (1982). Aerosol technology-properties, behavior, and measurement of airborne particles. New York: Wiley.Jacobson, M. Z., Turco, R. P., Jensen, E. J., & Toon, O. B. (1994). Modeling coagulation among particles of di5erent
composition and size. Atmospheric Environment, 28, 1327–1338.Kerminen, V.-M., Mkel, T. E., Ojanen, C. H., Hillamo, R. E., Vilhunen, J. K., Rantanen, L., Havers, N., Bohlen, A. V.,
& Klockow, D. (1997). Characterization of the particulate phase in the exhaust from a diesel car. EnvironmentalScience and Technology, 31, 1883–1889.
Kim, D. (2002). Nucleation and coagulation modes in the formation of particulate matter inside the exhaust of a dieselvehicle. Ph.D. dissertation, West Virginia University, Morgantown, WV. [Electronically available from the followingweb site: http://etd.wvu.edu/templates/showETD.cfm?recnum=2305.]
Kim, D., Gautam, M., & Gera, D. (2001). On the prediction of concentration variations in a dispersing heavy-duty truckexhaust plume using k– turbulent closure. Atmospheric Environment, 35, 5267–5275.
Kim, D., Gautam, M., & Gera, D. (2002). Modeling nucleation and coagulation modes in the formation of particulatematter inside a turbulent exhaust plume of a diesel engine. Journal of Colloid and Interface Science, 249, 96–103.
Kittelson, D. B. (1998). Engines and nanoparticles: A review. Journal of Aerosol Science, 29, 575–588.Kittelson, D. B., Dolan, D. E., & Verrant, J. A. (1978). Investigation of a diesel exhaust aerosol. Society of Automobile
Engineers, SAE 780109.Kirchstetter, T. W., Harley, R. A., Kreisberg, N. M., Stolzenburgh, M. R., & Hering, S. V. (1999). On-road measurement
of Ene particle and nitrogen oxide emissions from light- and heavy-duty motor vehicles. Atmospheric Environment,33, 2955–2968.
Kruis, F. E., Maisels, A., & Fissan, H. (2000). Direct simulation Monte-Carlo method for particle coagulation andaggregation. A.I.Ch.E. Journal, 46, 1735–1742.
Kulmala, M., Laaksonene, A., & Pirjola, L. (1998). Parameterizations for sulfuric acid/water nucleation rates. Journal ofGeophysical Research, 103, 8301–8307.
Lee, J. W., & Hong, B. H. (1998). Monte Carlo studies on three-species two-particle di5usion-limited reactions. PhysicaA, 256, 351–358.
Lushnikov, A. A., & Kulmala, M. (2000). Foreign aerosol in nucleating vapor. Journal of Aerosol Science, 31, 651–672.Maisels, A., Kruis, F. E., & Fissan, H. (1999). Direct Monte Carlo simulations of coagulation and aggregation. Journal
of Aerosol Science, 30, S417–S418.McGraw, R. (1997). Description of aerosol dynamics by the quadrature method of moments. Aerosol Science and
Technology, 27, 255–265.Morawska, L., BoEnger, N. D., Kocis, L., & Nwankwoala, A. (1998). Submicrometer and supermicrometer particles from
diesel vehicle emissions. Environmental Science and Technology, 32, 2033–2042.Pilinis, C., & Seinfeld, J. H. (1987). Continued development of a general equilibrium model for inorganic multicomponent
atmospheric aerosols. Atmospheric Environment, 21, 2453–2466.Pope, C. A., Thun, M. J., Namboodriri, M. M., Dockery, D. W., Evans, J. S., Speizer, F. E., & Heath, C. W. (1995).
Particulate air pollution as a predictor of mortality in a prospective study of U.S. adults. American Journal ofRespiratory Critical Care Medicine, 151, 669–674.
Sawyer, R. F., Harley, R. A., Cadle, S. H., Norbeck, J. M., Slott, R., & Bravo, H. A. (1998). Mobile sources criticalreview. 1998 NARSTO Assessment, Report to Coordinating Research Council, Atlanta, GA.

D. Kim et al. / Aerosol Science 33 (2002) 1609–1621 1621
Sawyer, R. F., & Johnson, J. H. (1995). Diesel emissions and control technology, chapter in diesel exhaust: A criticalanalysis of emissions, exposure and heath e6ects. A Special Report of the Institute’s Diesel Working Group, HealthE5ects Institute (pp. 65–81).
Seinfeld, J. H., & Pandis, S. N. (1997). Atmospheric chemistry and physics: From air pollution to climate change.New York: Wiley.
Shi, J. P., & Harrison, R. M. (1999). Investigation of ultraEne particle formation during diesel exhaust dilution.Environmental Science and Technology, 33, 3730–3736.
Steiner, D., Burtscher, H., & Gross, H. (1992). Structure and disposition of particles from a spark-ignition engine.Atmospheric Environment, 26A, 997–1003.
Tambour, Y., & Seinfeld, J. H. (1980). Solution of the discrete coagulation equation. Journal of Colloid Interface Science,74, 260–272.
Tsang, T. H., & Brock, J. R. (1983). Simulation of condensation aerosol growth by condensation and evaporation. AerosolScience and Technology, 2, 311–320.
Whitby, K. T. (1981). Determination of aerosol growth rates in the atmosphere using lumped aerosol dynamics. Journalof Aerosol Science, 12, 174–178.
Willeke, K., & Baron, P. A. (1992). Aerosol measurement: Principles techniques and applications. New York, NY:Van Nostrand Reinhold.
Williams, M. M. R., & Loyalka, S. K. (1991). Aerosol science, theory and practice. Oxford: Pergamon Press.