parallel and perpendicular lines - buffalo state...
TRANSCRIPT
Parallel LinesWeek 6 Day 1
Kevin ClelandShannon TrimperJulianna Zippirloi
Title: Parallel & Perpendicular LinesGrade: 9th
Section 5.6 – Parallel & Perpendicular LinesMaterials: graphing calculators, worksheets, chalkboard/whiteboard, chalk/markers**ALL WORKSHEETS WILL BE PROVIDED
Lesson Overview: Students will understand the concept of parallel lines. They will also connect this to their prior knowledge of slope developed in their graphing lessons. They will do this by graphing equations and dissecting their properties to determine what it is that makes a line parallel to another.
Lesson Objectives:– [Comprehension] Students will be able to identify lines as parallel or not. – [Analysis] Students will break down equations into their component parts,
examining them for the characteristics that determine what it is that makes a line parallel to another.
– [Application] They will also connect this to their prior knowledge of slope developed in their graphing lessons to help with this task.
– [Synthesis] Students will construct parallel lines and lines parallel to a given line passing through a given point. Ex.: Construct a line parallel to 4y – 8x = 12. Give its equation and explain why it is parallel.
NYS Standards:– Key Idea 3: Operations- Use addition, subtraction, multiplication, and division
with real numbers, algebraic expressions and functions.– Key Idea 5: Measurement- Relate the slope of a line to the coordinate plane and
given lines.– Key Idea 7: Patterns and Functions- Represent and analyze functions, using
verbal descriptions, equations, and graphs.
Anticipatory Set: (5 minutes) 1. Ask students for examples of lines that never touch each other and are always the same distance apart. Common examples are highway roads, yardage markers on a football field, lines on an ice rink, stripes on a shirt, etc. (this should only take a minute).2. Go over the first page of the attached packet titled Parallel & Perpendicular Lines having a different student read aloud each box. Have the students figure out the answers to the two fill in the blanks together.
Developmental Activity: (30 minutes)1. On the next page, titled Parallel Lines, the students are asked to find any lines
already on the graph that are parallel. The idea is that they should see lines such as y = 5 and y = 7 when looking at a graph, not just a bunch of squares and four arrows. Have them draw at least one example of vertical and horizontal parallel lines each.
2. Next, the students will graph given equations and determine which are parallel. Help them to make inferences by focusing on the parts of the equations they’re now familiar without actually telling them that the key is equivalent slopes. Mention the idea of “rise over run” and the idea the y-intercept as a starting point or central point of each line if no one understands what you’re asking them here. Try to get your class to make at least one guess and explain why they think so.
- Since the students have already studied graphing, this should not be the focus. Try to make the actual graphing go as smoothly as possibly by either going through the process with them, using the graphing calculators as a guide, and/or simply sketching the lines.
3. Help the students work through the rest of the packet.
Closure: (5 minutes) Write an equation on the board and have the students supply one equation that is parallel and one that isn’t. Ask why the one is and the other isn’t. What was their process?
Assessment: Hand out the exit ticket sheets. Collect them if they’re completed when class ends. If they aren’t assign them as homework.
Name: Answer Key________________ Date: _____________
Parallel & Perpendicular Lines
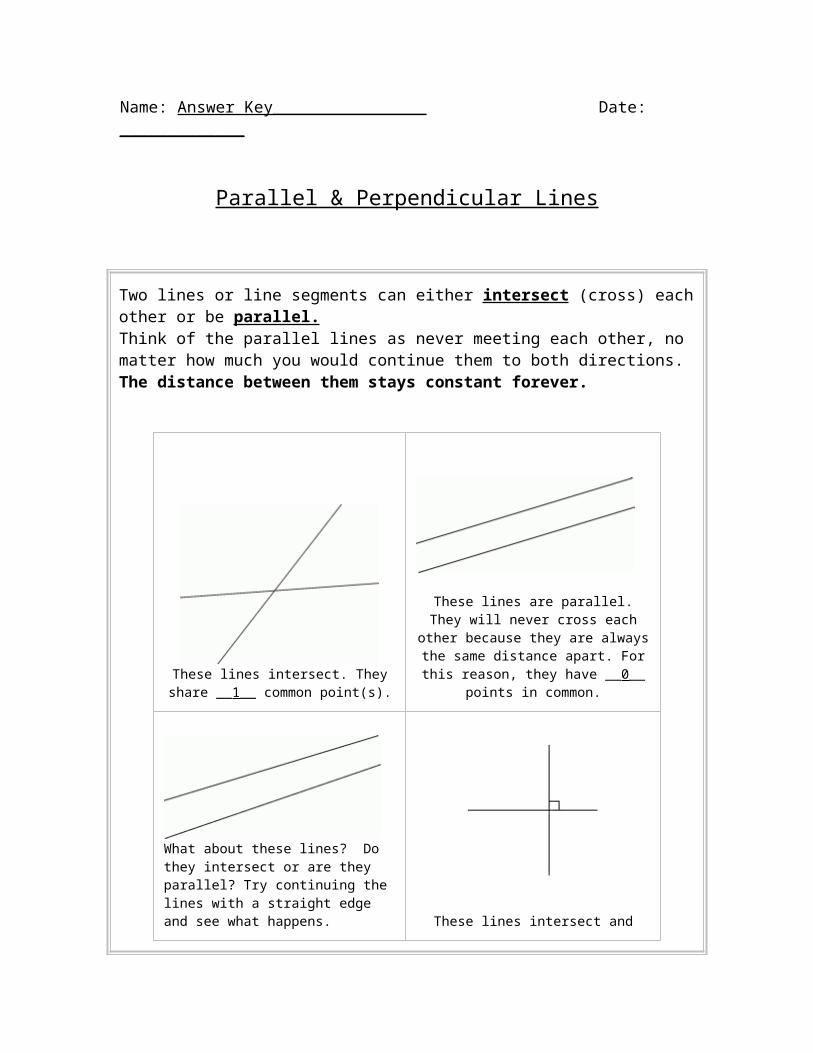
Two lines or line segments can either intersect (cross) each other or be parallel. Think of the parallel lines as never meeting each other, no matter how much you would continue them to both directions. The distance between them stays constant forever.
These lines intersect. They share __1__ common point(s).
These lines are parallel. They will never cross each other because they are
always the same distance apart. For this reason, they have __0__ points in
common.
What about these lines? Do they intersect or are they parallel? Try continuing the lines with a straight edge and see what happens.
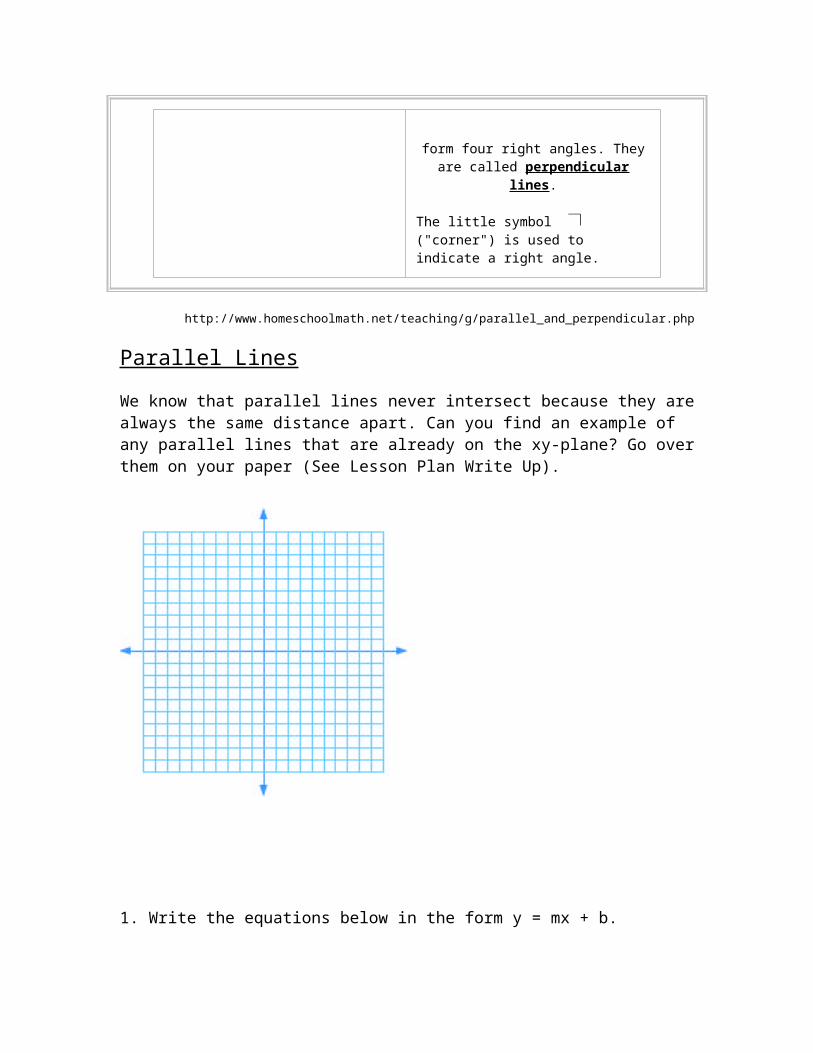
These lines intersect and form four right angles. They are called perpendicular
lines.
The little symbol ("corner") is used to indicate a right angle.
http://www.homeschoolmath.net/teaching/g/parallel_and_perpendicular.php
Parallel Lines
We know that parallel lines never intersect because they are always the same distance apart. Can you find an example of any parallel lines that are already on the xy-plane? Go over them on your paper (See Lesson Plan Write Up).
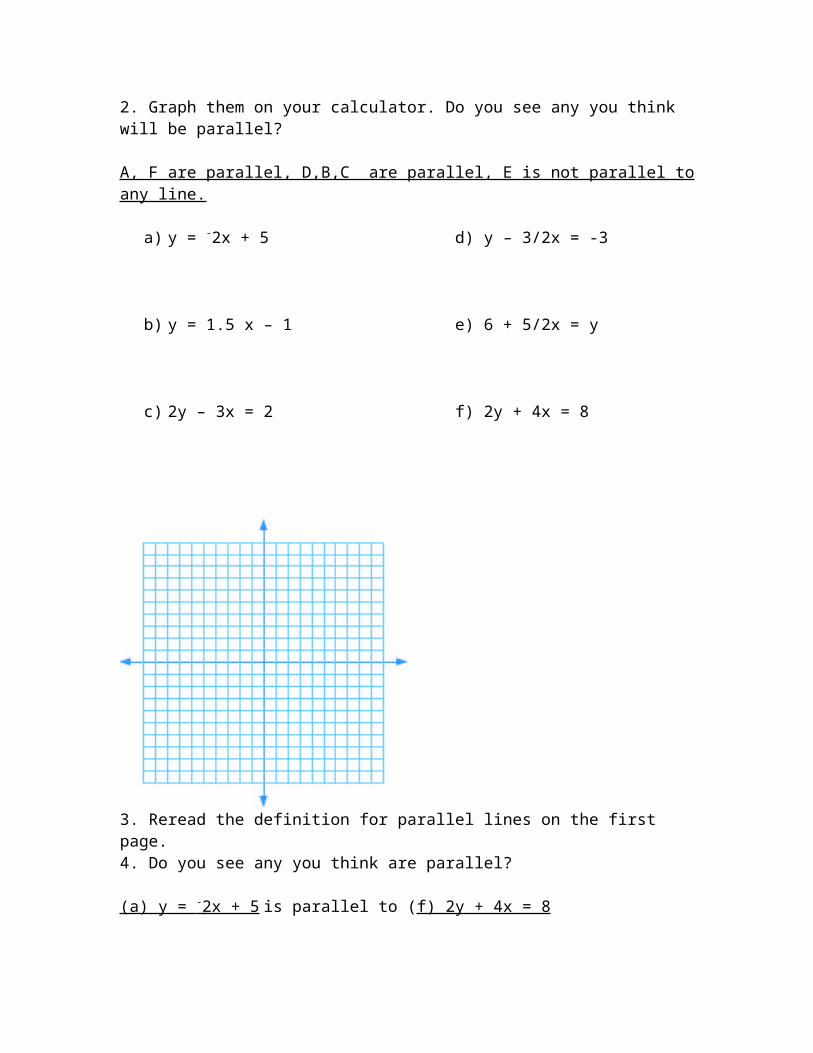
1. Write the equations below in the form y = mx + b. 2. Graph them on your calculator. Do you see any you think will be parallel?
A, F are parallel, D,B,C are parallel, E is not parallel to any line.
a) y = -2x + 5 d) y – 3/2x = -3
b) y = 1.5 x – 1 e) 6 + 5/2x = y
c) 2y – 3x = 2 f) 2y + 4x = 8
3. Reread the definition for parallel lines on the first page.4. Do you see any you think are parallel?
(a) y = - 2x + 5 is parallel to (f) 2y + 4x = 8
d) y – 3/2x = -3 is parallel to (b) y = 1.5 x – 1 AND (c) 2y – 3x = 2 Note: The AND is not provided on purpose. Use this to establish the idea that a
line has more than one parallel lines.
(e) 6 + 5/2x = y is not parallel to any of the lines
5. Look at the equations you wrote above. Circle the part (m or b) of each that is equal to that same part in the parallel equation. Underline the part (m or b) that is different.
You can find the equation of a line parallel to a given line if you know a point on the line and the equation of the given line.
Try this using the slope-intercept formula, write the equation of a line that passes through the point (-1, -2) and is parallel to the line y = 3x – 2.
Point-slope formula: (y – y1) = m(x – x1)
A line parallel to y = 3x – 2 will have the same slope. What is the slope of this line?
m = _3_
y - _-2_ = _3_(x - _-1_ )
Simplify this equation and write it in slope-intercept form.
y + 2 = 3(x + 1)
y + 2 = 3x + 3
y = 3x + 1
To check this, graph your new equation with the given equation on your calculator.
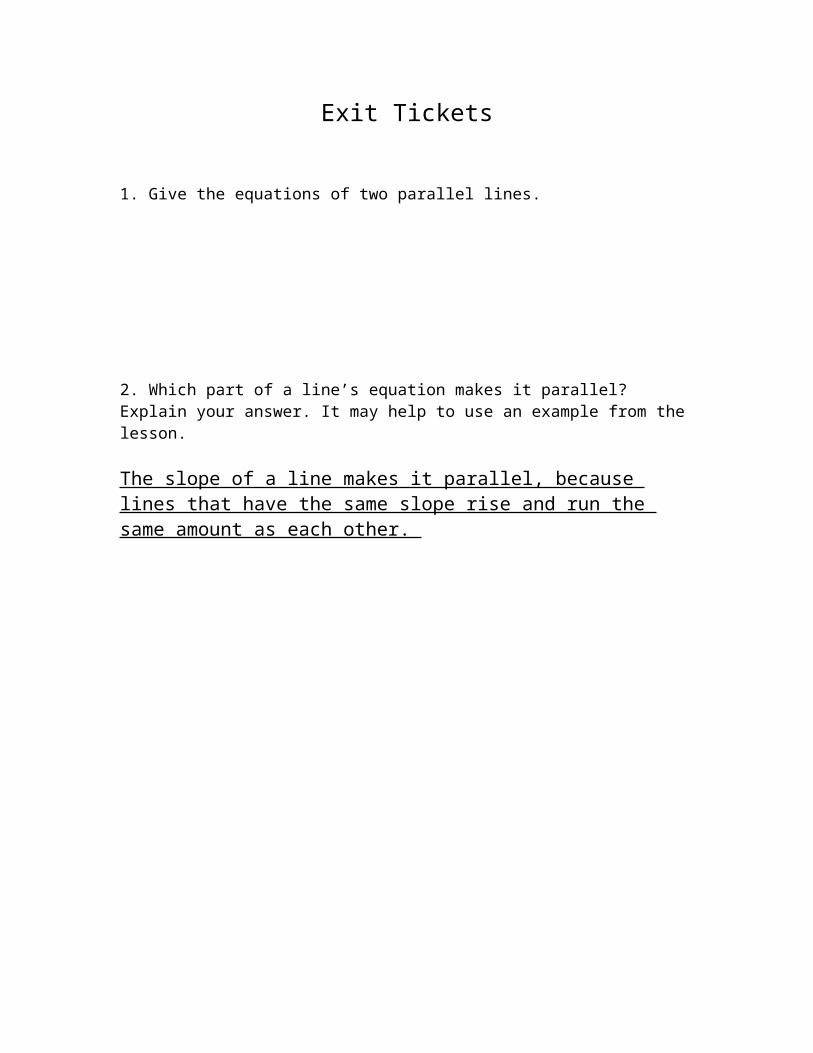
Exit Tickets
1. Give the equations of two parallel lines.
2. Which part of a line’s equation makes it parallel? Explain your answer. It may help to use an example from the lesson.
The slope of a line makes it parallel, because lines that have the same slope rise and run the same amount as each other.
Perpendicular LinesWeek 6 Day 2
Kevin ClelandShannon TrimperJulianna Zippirloi
Title: Perpendicular LinesGrade: 9th
Section 5.6 – Parallel & Perpendicular LinesMaterials: graphing calculators, worksheets, chalkboard/whiteboard, chalk/markers**ALL WORKSHEETS WILL BE PROVIDED
Lesson Overview: Students will understand the concepts of parallel and perpendicular lines. They will also connect this to their prior knowledge of slope developed in their graphing lessons. Lastly, they will understand the concept of corresponding angles created by a line intersecting parallel lines. They will do this by graphing equations and dissecting their properties to determine what it is that makes a line parallel to another.
Lesson Objectives:– [Comprehension] Students will be able to identify lines as perpendicular or
not. – [Analysis] Students will break down equations into their component parts,
examining them for the characteristics that determine what it is that makes a line perpendicular to another.
– [Application] They will also connect this to their prior knowledge of slope developed in their graphing lessons to help with this task.
– [Synthesis] Students will construct perpendicular lines and lines perpendicular to a given line passing through a given point. Ex.: Construct a line perpendicular to 4y – 8x = 12. Give its equation and explain why it is perpendicular.
NYS Standards:– Key Idea 3: Operations- Use addition, subtraction, multiplication, and division
with real numbers, algebraic expressions and functions.– Key Idea 5: Measurement- Relate the slope of a line to the coordinate plane and
given lines.– Key Idea 7: Patterns and Functions- Represent and analyze functions, using
verbal descriptions, equations, and graphs.
Anticipatory Set: (5 minutes) 1. Ask students for examples of lines that intersect each other. Then ask for examples of lines that are perpendicular to each other. Ask if anyone knows the difference. Common examples are street intersections (Lafayette and Bayne), the red cross symbol, plaid shirts, the sides of a square, tile floors, etc. (this should only take a minute).2. Go over the first page of the attached packet titled Parallel & Perpendicular Lines, Part 2, having a different student read aloud each box. Have the students figure out the answers to the two fill in the blanks together.
Developmental Activity: (30 minutes)1. On the next page, titled Perpendicular Lines, the students are asked to find any already on the graph that are perpendicular. The idea is that they will see the axes as a perpendicular example.
2. Next, the students will learn the concept of negative reciprocals. The book calls these opposite reciprocals, so I used this term instead. I was going to use both but I worried that it would only create unnecessary confusion.- Since the students have already studied graphing, this should not be the focus. Try to make the actual graphing go as smoothly as possibly by going through the process with them and using the graphing calculators as a guide.
3. Help the students work through the rest of the packet.
Closure: (5 minutes) Write an equation on the board and have the students supply one equation that is perpendicular and one that isn’t. Ask why the one is and the other isn’t. What was their process?
Assessment: Hand out the exit ticket sheets. Collect them if they’re completed when class ends. If they aren’t assign them as homework.
Name: ____________________________ Date: _____________
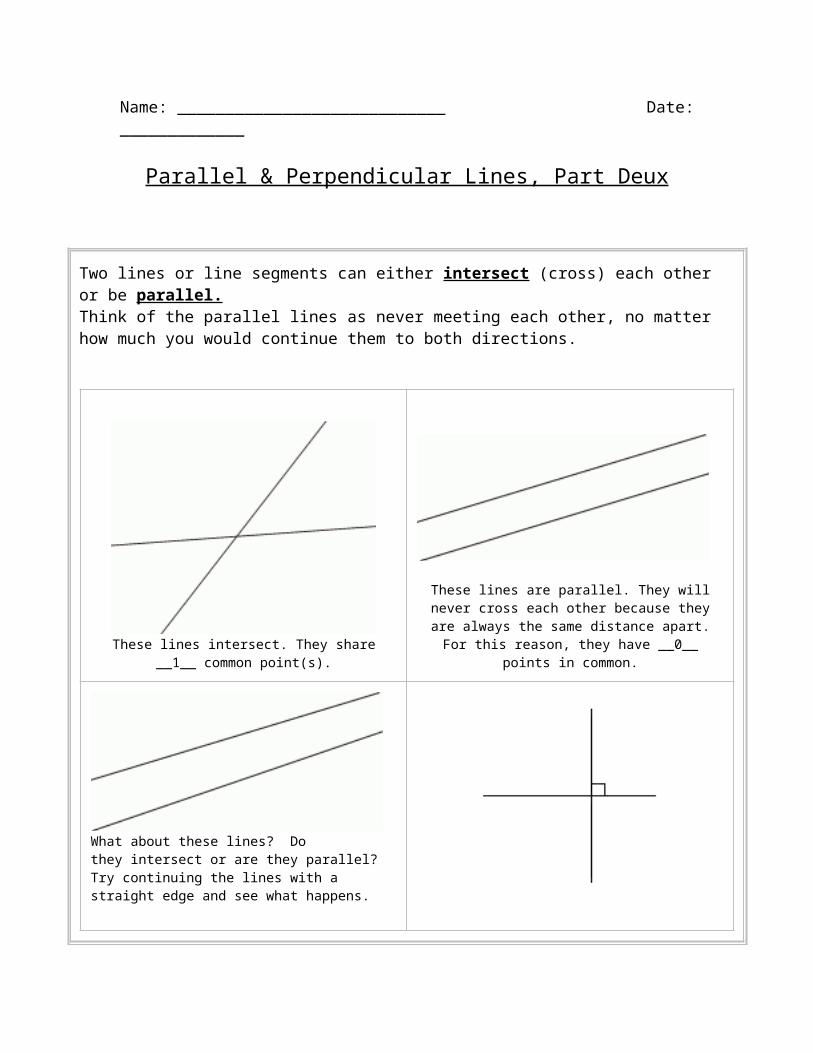
Parallel & Perpendicular Lines, Part Deux
Two lines or line segments can either intersect (cross) each other or be parallel. Think of the parallel lines as never meeting each other, no matter how much you would continue them to both directions.
These lines intersect. They share __1__ common point(s).
These lines are parallel. They will never cross each other because they are always the same distance apart. For this reason, they have __0__ points in
common.
What about these lines? Do they intersect or are they parallel? Try continuing the lines with a straight edge and see what happens.
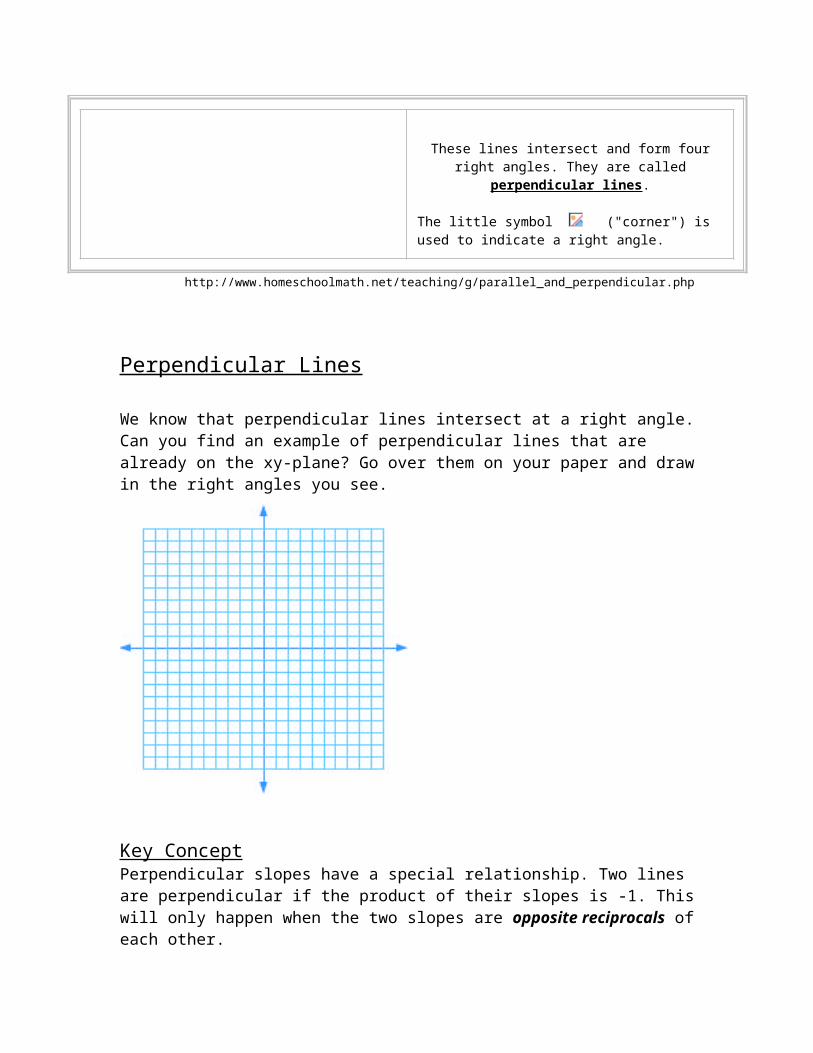
These lines intersect and form four right angles. They are called perpendicular lines.
The little symbol ("corner") is used to indicate a right angle.
http://www.homeschoolmath.net/teaching/g/parallel_and_perpendicular.php
Perpendicular Lines
We know that perpendicular lines intersect at a right angle. Can you find an example of perpendicular lines that are already on the xy-plane? Go over them on your paper and draw in the right angles you see.
Key ConceptPerpendicular slopes have a special relationship. Two lines are perpendicular if the product of their slopes is -1. This will only happen when the two slopes are opposite reciprocals of each other.
One example of perpendicular lines are the lines y1 = 2x and y2 = - ½ x + 3.
Look at the slopes of these equations
m1 = _2_ m2 = _- ½_ Two more lines that are perpendicular to each other are y1 = ¼ x – 1 and y2 = -4x + 2.(Note: these lines are perpendicular to each other, not the lines above.)
Look at the slopes of these equations
m1 = _¼_ m2 = _-4_
Reread the key concept above and write a sentence explaining opposite reciprocals in your own words.
Opposite reciprocals have their numerator & denominator flip-flopped. Also, one must be negative and one must be positive.
Write a general representation of opposite reciprocals using the variables a and b.
The opposite reciprocal of a/b = _-b/a_
You can find the equation of a line perpendicular to a given line if you know a point on the line and the equation of the given line.
Try this using the slope-intercept formula, write the equation of a line that passes through the point (3, 4) and is perpendicular to the line y = 5x + 3.
Point-slope formula: (y – y1) = m(x – x1)
The slope of a line perpendicular to y = 5x + 3 will be the opposite reciprocal of that line’s slope. What is the slope of the given line?
m = _5_
What is the opposite reciprocal of this value? -1/5
So, what is the slope of a line perpendicular to the line y = 5x + 3??
m = -1/5
y – 4 = -1/5(x – 3)
Simplify this equation and write it in slope-intercept form.
y – 4 = - 1/5x + 3/5
y = -1/5x + 3/5 + 4 = -1/5x + 3/5 + 20/5
y = -1/5x + 23/5
To check this, graph your new equation with the given equation on your calculator.
Practice Problems
1. Graph the given equations.
2. Give the equation of two lines perpendicular to each of the lines given below. If you’re unsure where to get started, return to the previous page for ideas.
3. Graph all the equations in the graphs provided.
a) y = 6x - 4 (Ask students what the slope must be, they can chose any y-intercepts they wish).
b) y – 2x = 5 (Same as above).
Exit Tickets
1a. Are the lines y = 3x – 1 and y = 2/3 x + 2 perpendicular? How can you tell?
________________________________________________________________________________________________________________________________________________________________________________________________________________________________________________________________________________________________
2. Give the equation of a line perpendicular to the line y = x. Sketch the graph of both lines.
Lesson #2: (5-7) Statistics: Scatter plots and Lines of Fit
Materials: Survey (hand out before the lesson)Table of Data (create before lesson) Will you?Graphing CalculatorsGraphing Calculator WorksheetPen/ PencilIntroduction to Scatter Plots WorksheetScatter Plots WorksheetEnlarged copy of scatter plots or overhead copy?Spaghetti Will you supply this?Self Evaluation WorksheetQuiz
This is very good but I think you have a week’s worth of material here. Just graphing the data on their calculators will take a whole period – since they might not know how to input data into L1and L2.
Well, the above comment was for the data you collected but it is not used in this lesson. When will the data from the surveys be used? Why collect the data if you aren’t using it?
Overview:
Students will inquire and scaffold prior knowledge to predict relationships on paired data sets. Students will develop an understanding of correlations and lines of fit among different scatter plots by plotting data sets using their graphing calculator.
Objectives:
Students will be able to distinguish correlations among different scatter plots. (Analysis)
Students will be able to construct a scatter plot on paper and on their graphing calculator. (Synthesis)
Students will be able to predict trends (lines of best fit) of scatter plots. (Evaluation)
Standards:
Key Idea #5 – Measurement: Students use measurement in both metric and English measure to provide a major link between the abstractions of mathematics and the real world in order to describe and compare objects and data.
I plan on handing these out on Monday and Tuesday (I expect our class (MED 308) to fill out the surveys too)
(5D) Use statistical methods including the measures of central tendency to describe and compare data.
Key Idea #7 – Patterns and Functions:Students use patterns and functions to develop mathematical power, appreciate the true beauty of mathematics, and construct generalizations that describe patterns simply and efficiently.
(7C) Translate among the verbal descriptions, tables, equations, and graphic forms of functions.
Vocabulary: Scatter plot - a graph in which two sets of data are plotted as ordered pairs in
a coordinate plane. Scatter plots are used to investigate relationships between two quantities.
Correlation - shows a relationship between two sets of data Causation - shows how one thing causes something else to happen Positive Correlation - (aka a direct relationship) is between x and y: as x
increases, y increases. Negative Correlation - (aka an indirect relationship) is between x and y: as
x increases, y decreases. No Correlation - x and y are NOT related Lines of fit - is an approximation of points that describes the trend of the
data
Anticipatory Set: (5 minutes)
Check list: Writing Equations (algebraically and verbally)Undoing OperationsWorking Backwards with Word ProblemsSolving Multi-Step EquationsSolving Equations with the Variable on each sideSolving Equations and FormulasUsing Ratios and ProportionsPercent of ChangeIdentifying Functions (vertical line test)Function Values Slope and Direct VariationSlope Intercept FormWriting Equations in Slope Intercept FormWriting Equations in Point Slope FormParallel LinesPerpendicular LinesWhat are theses for? Will the instructors use these in some
way?
Give students sets of paired data and have students predict if each set is related to the other. (where are these?) Divide students up into groups giving each group one set of paired data. Teacher’s role should be engaged: walking around and asking questions to trigger prior knowledge and develop higher level of thinking. Have students discuss with each other their predictions. Make sure students can explain and support their predictions. Let them know it does not matter if they are right, as long as they can support their predictions. We want to know what they are thinking about the subject matter. (Inquiry/Info phase from the VanHiele model. This is only used in relation to geometrical understanding.) If students are having trouble, give them the introduction to scatter plots worksheet and see if they can match each set of paired data to the correct graph. (Similar to our activity in MED 308 on interpreting graphs.)
a. The number of letters in your first name and your age. (not related)b. The amount of food made by the cafeteria staff on a given day and
the number of students who bought lunch that day. (related)
c. The amount of air in oxygen tanks for a scuba divers and the amount of time it took them to use up all of their oxygen. (related)
d. The number of past years and the average temperature of the month of August. (not related)
Development Activity: (25 minutes)
1. Section #1: Read the first paragraph about scatter plots. Discuss with students what they think it means. Write on the board what the students tell you (in their own words) or have the students write it on the board. Have the students write the definition in their own words in their notes.
2. Section #2: Discuss different types of correlations of graphs. Make the connection between past lessons on slope (in particular lesson #3 of week 4) and positive and negative correlations. (This would be a good transition into lines of fit)
3. Section #3: Tape the enlarged copies of the scatter plots to the board or show on over head and let students come up to the board with the spaghetti to draw lines of fit. Explain to them it is an approximation so there can be more than one right answer. Then have the students draw lines of fit on their scatter plots on introduction to scatter plots worksheet.
4. Guide students through Practice Worksheet. Do the first problem with the students to get them familiar with graphing scatter plots. Then have the students work in groups of individually on the second problem. (Explication phase of Van Hiele Model)
5. Think about: Have students discuss and inquire about causation. Note that correlation does NOT imply causation.
Closure: (5 minutes)
Self Evaluation: Read questions out loud and have students discuss with each other or work independently to summarize what they have learned.
Assessment: (5 minutes)
Quiz for next class period
When is Scatter Plot Exercises used? That will take a long time for the students to complete.
Resources:
Self Evaluation Worksheet:http://www.glencoe.com/sec/math/studytools/cgi-bin/msgQuiz.php4?isbn=0-07-860390-0&chapter=5&lesson=7&headerFile=6&state=na
Scatter Plot Exercises Worksheet:http://lhs.lexingtonma.org/Teachers/Shea/scatterplotsassignment2.pdf
Graphing Calculator Worksheet: http://mathbits.com/MathBits/TISection/statistics1/LineFit.htm
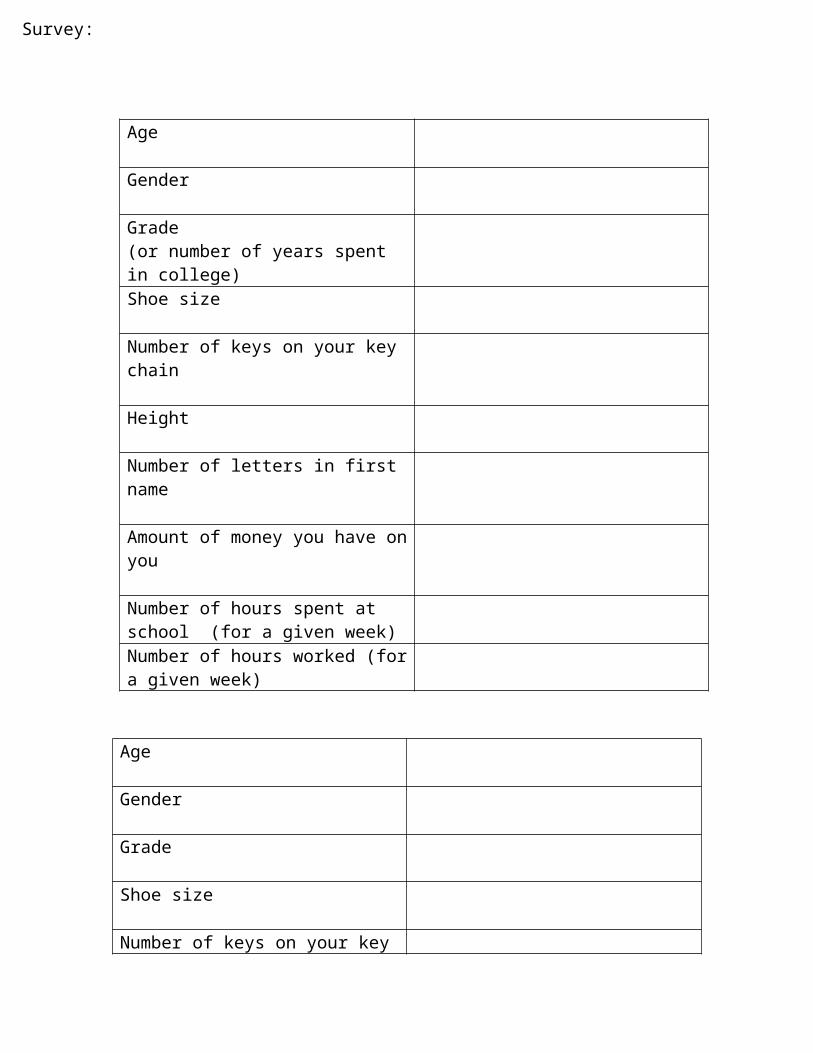
Age
Gender
Grade(or number of years spent in college)Shoe size
Number of keys on your key chain
Height
Number of letters in first name
Amount of money you have on you
Number of hours spent at school (for a given week)Number of hours worked (for a given week)
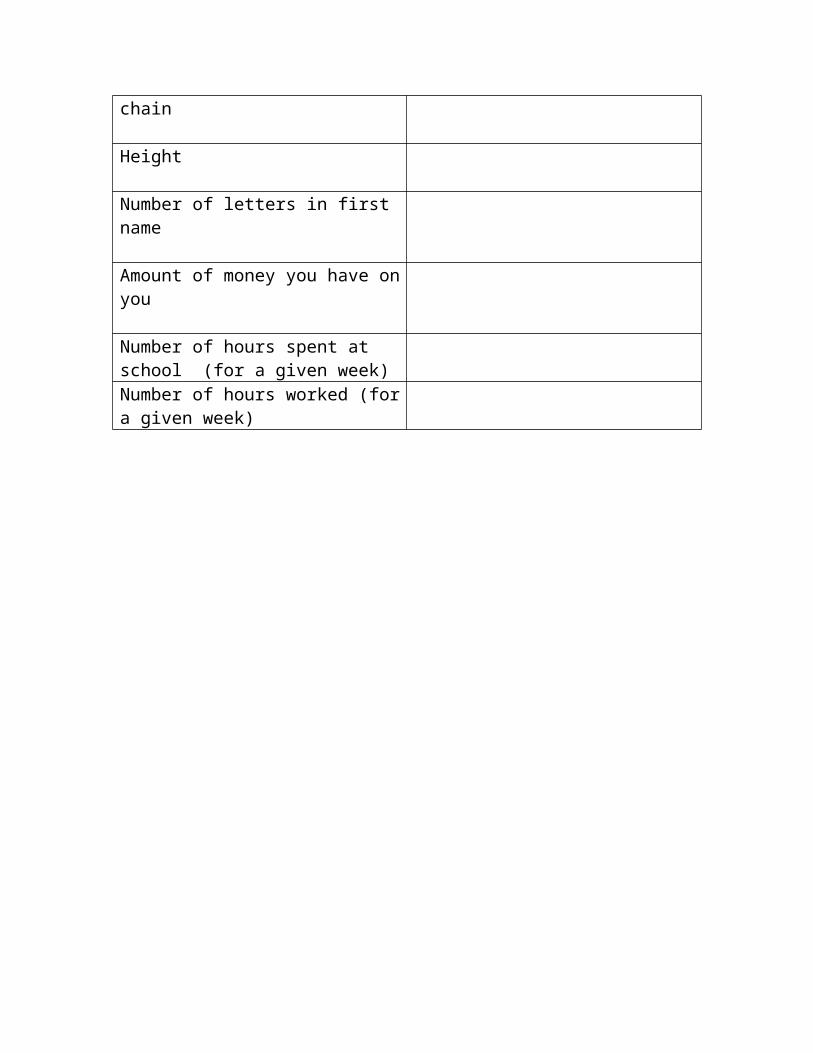
Age
Gender
Grade
Shoe size
Number of keys on your key chain
Height
Number of letters in first name
Amount of money you have on you
Number of hours spent at school (for a given week)Number of hours worked (for a given
Survey:
week)
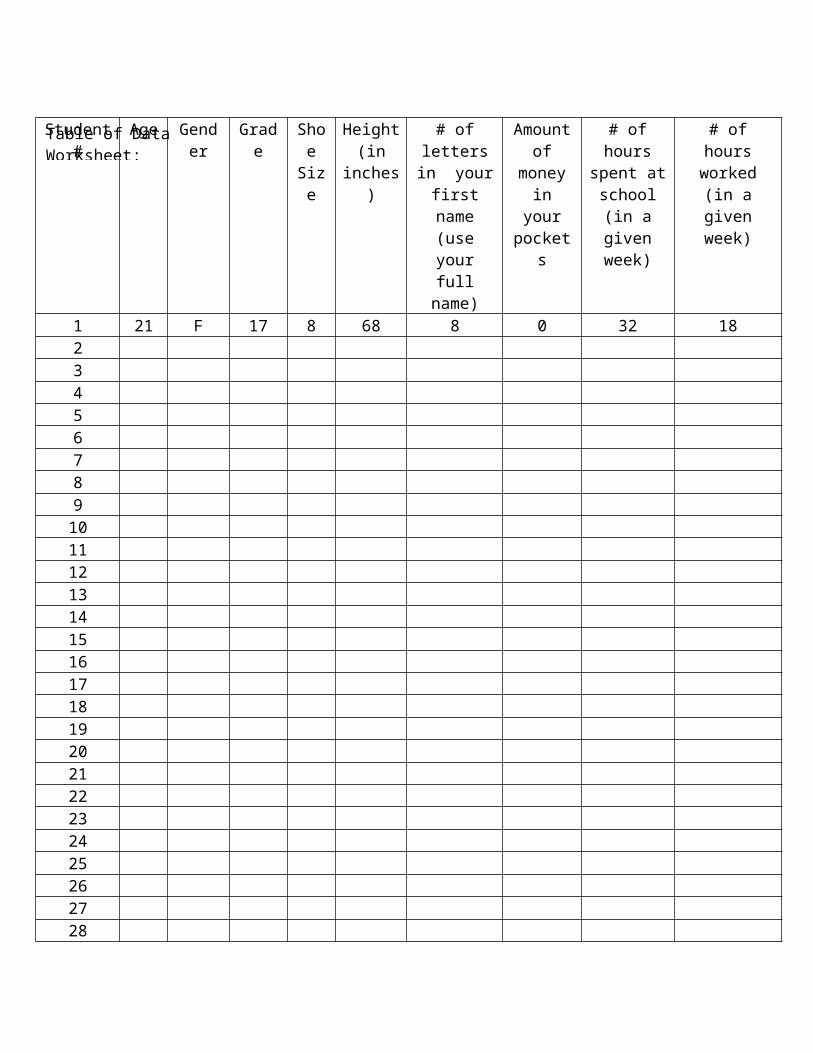
Student # Age Gender Grade Shoe Size
Height (in
inches)
# of letters in your first name (use your full name)
Amount of money in your pockets
# of hours spent at
school (in a given week)
# of hours worked (in a given week)
1 21 F 17 8 68 8 0 32 1823456789101112131415161718192021222324252627282930313233343536373839
Table of Data Worksheet:
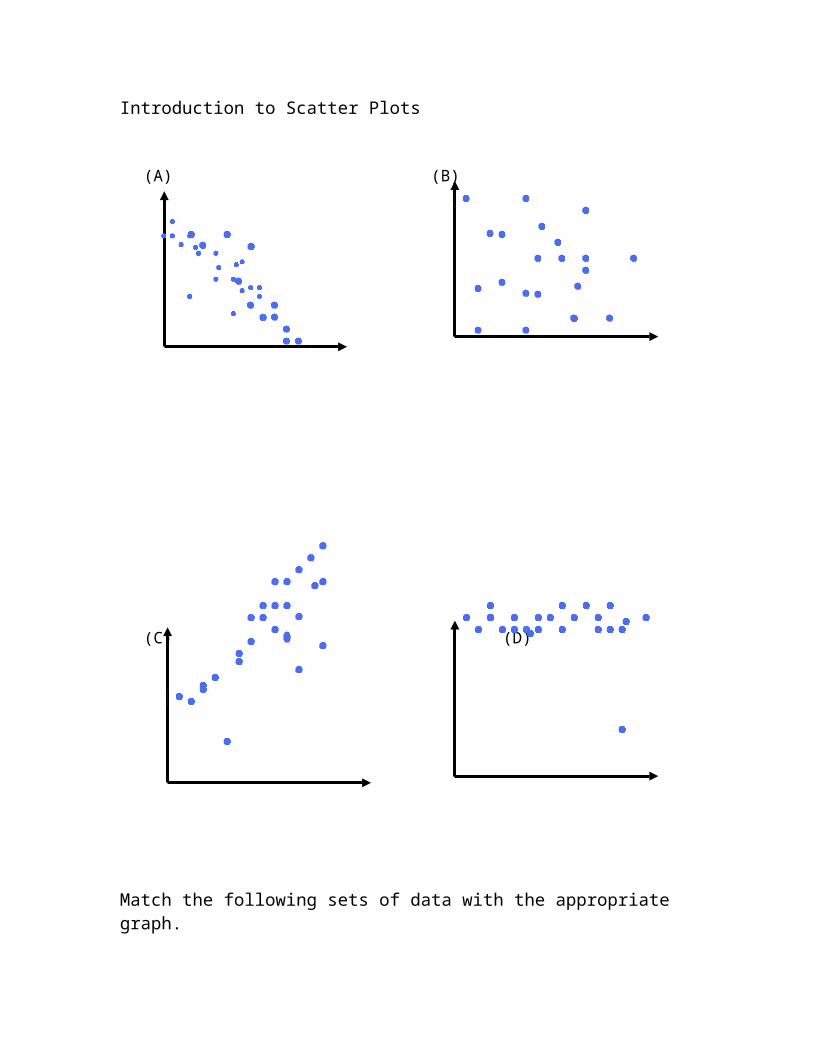
Introduction to Scatter Plots
(A) (B)
(C) (D)
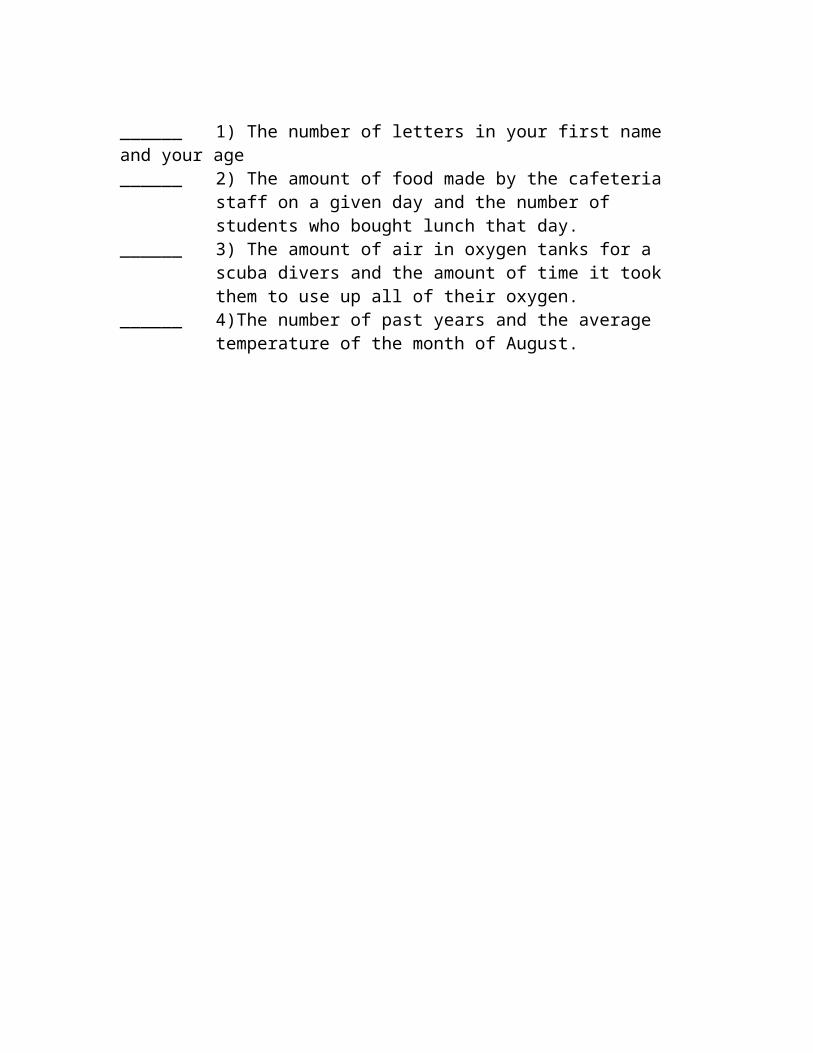
Match the following sets of data with the appropriate graph.
______ 1) The number of letters in your first name and your age______ 2) The amount of food made by the cafeteria staff on a given day
and the number of students who bought lunch that day. ______ 3) The amount of air in oxygen tanks for a scuba divers and the
amount of time it took them to use up all of their oxygen. ______ 4)The number of past years and the average temperature of the
month of August.
Name __________________________________ Date ______________________Scatter Plots Worksheet
Section #1:
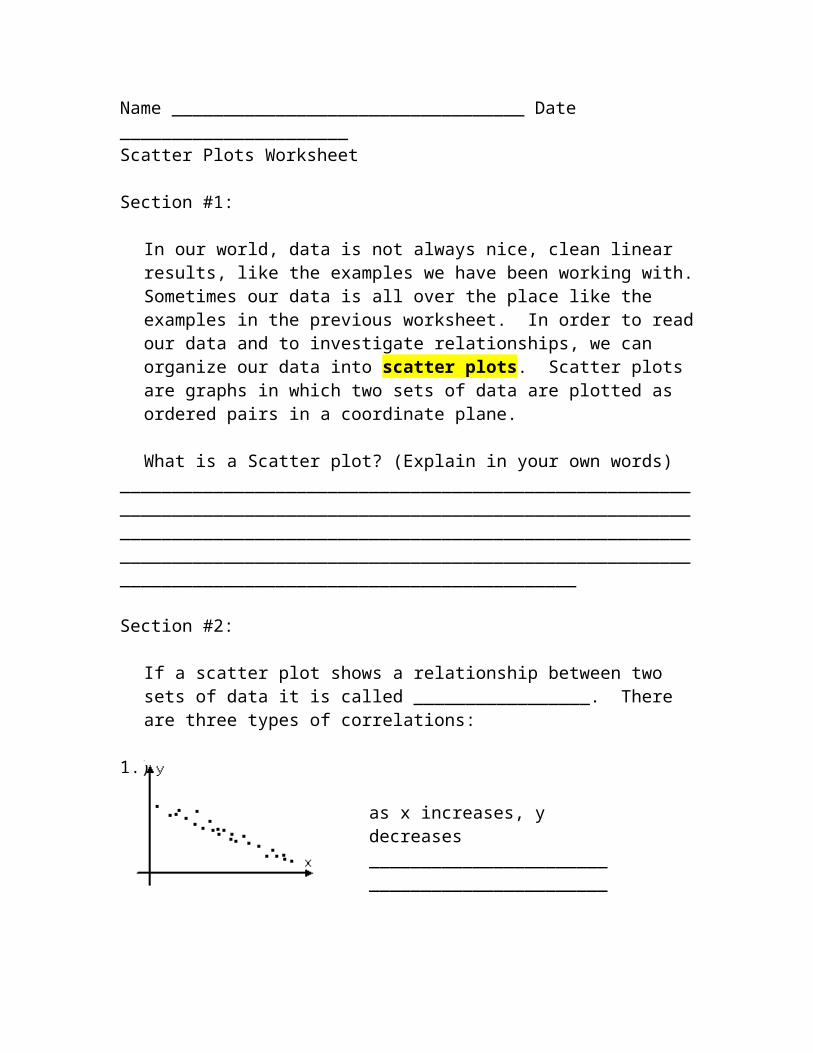
In our world, data is not always nice, clean linear results, like the examples we have been working with. Sometimes our data is all over the place like the examples in the previous worksheet. In order to read our data and to investigate relationships, we can organize our data into scatter plots. Scatter plots are graphs in which two sets of data are plotted as ordered pairs in a coordinate plane.
What is a Scatter plot? (Explain in your own words) ________________________________________________________________________________________________________________________________________________________________________________________________________________________________________________________________________
Section #2:
If a scatter plot shows a relationship between two sets of data it is called _________________. There are three types of correlations:
1.)
2.)
3.)
as x increases, y decreases______________________________________________
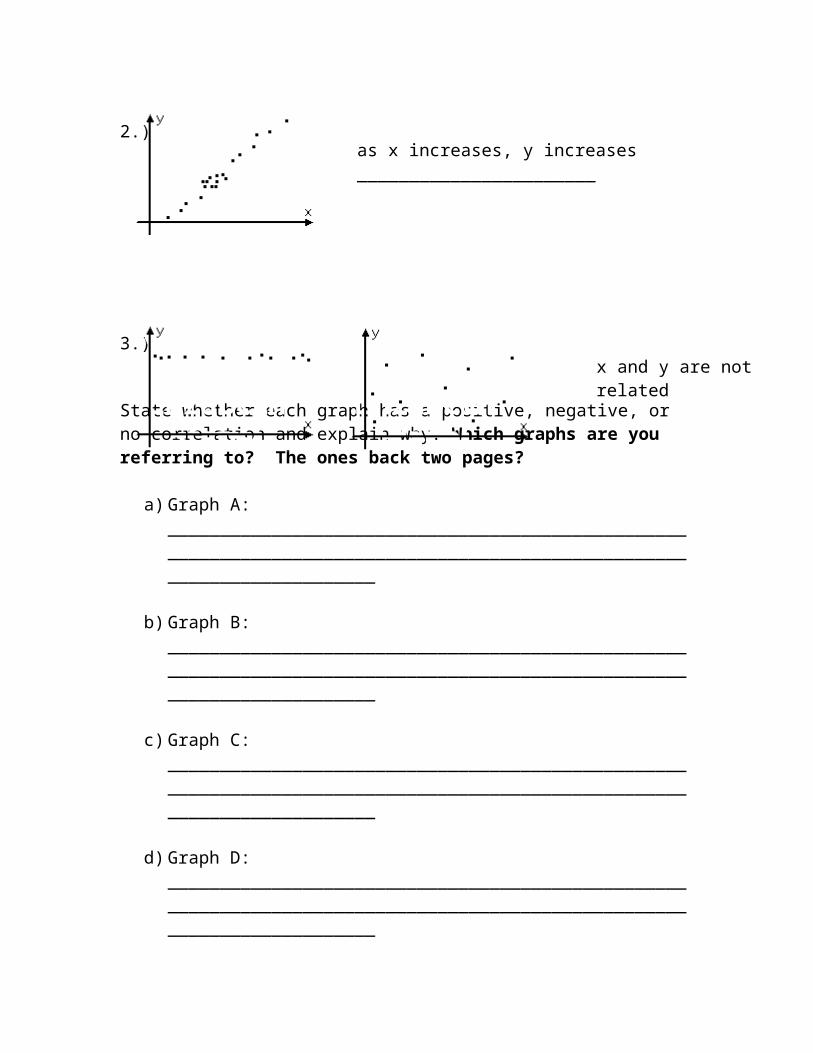
as x increases, y increases______________________________________________
x and y are not related____________________
State whether each graph has a positive, negative, or no correlation and explain why. Which graphs are you referring to? The ones back two pages?
a) Graph A:________________________________________________________________________________________________________________________
b) Graph B: ________________________________________________________________________________________________________________________
c) Graph C:________________________________________________________________________________________________________________________
d) Graph D:________________________________________________________________________________________________________________________
Section #3:
Scatter plots’ data points do not all lie on a line, but if there is a correlation they are close to a line, so we can draw a line of fit as an approximation. The line of fit describes the trend of the data. When using our calculator it will give us the best fit line.
Draw the lines of fit on the graphs on the first page of the packet.
Name ____________________________________ Date ________________Self Evaluation
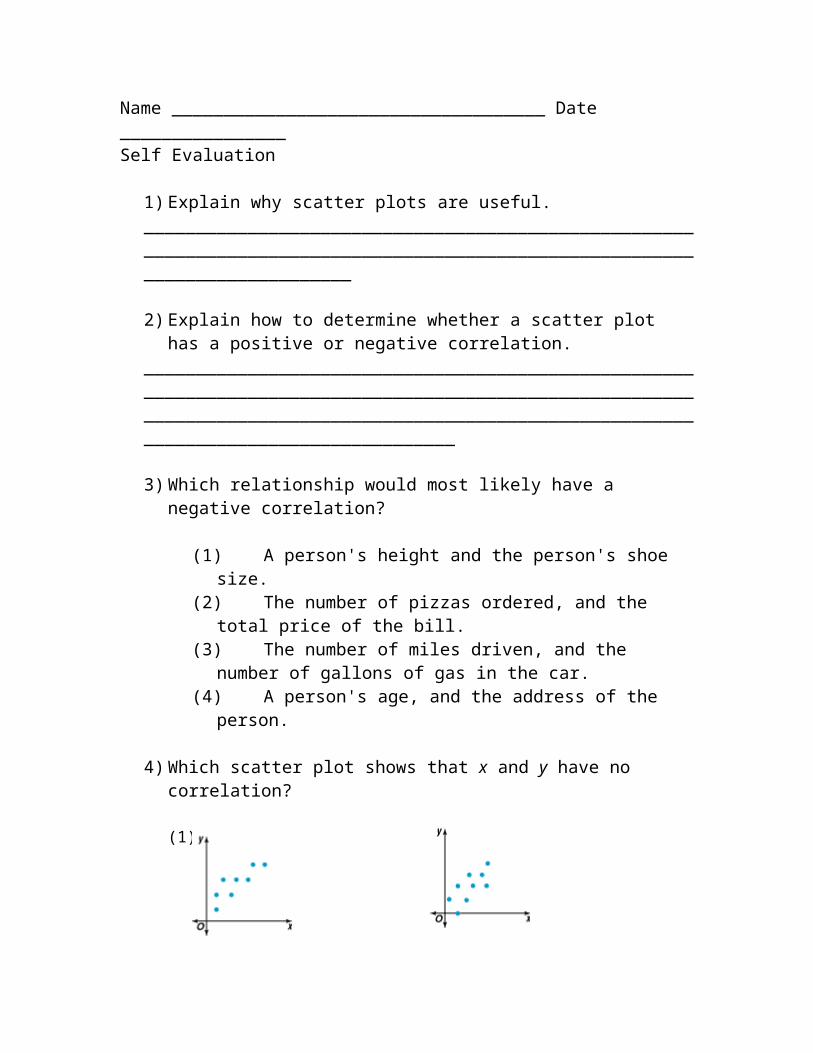
1) Explain why scatter plots are useful.______________________________________________________________________________________________________________________________
2) Explain how to determine whether a scatter plot has a positive or negative correlation.
_____________________________________________________________________________________________________________________________________________________________________________________________
3) Which relationship would most likely have a negative correlation?
(1) A person's height and the person's shoe size.(2) The number of pizzas ordered, and the total price of the bill.(3) The number of miles driven, and the number of gallons of gas in the
car.(4) A person's age, and the address of the person.
4) Which scatter plot shows that x and y have no correlation?
(1) (2)
(3) (4)
Name _____________________________________ Date_________________Scatter Plots Exercises
Problem #1: The data in the table compare fat grams to the number of calories for some fast-food hamburgers.
Burger Total Fat (g) CaloriesWendy’s Single with Everything 20 420
Burger King Whopper Jr. 24 420Mc Donald’s Big Mac 28 530
Wendy’s Big Bacon Classic 30 580Hardee’s The Works 30 530
Mc Donald’s Arch Deluxe with Bacon 34 610Burger King Double Cheeseburger with Bacon 39 640
In-n-Out Double Cheeseburger 40 650Burger King Big King 43 660
Burger King Whopper with Cheese 46 730
Step #1: Predict if there is a correlation between the two variables.______________________________________________________________________________________________________________________________
Step #2: Construct a scatter plot using graph paper.
a) What is our independent variable? Dependent variable?
b) Was your prediction correct? Explain the type of correlation between the two variables.
________________________________________________________________________________________________________________________
Step #3: Draw a line of fit that crosses two data points. Write the equation of the line of fit either using point slope form or slope intercept form.
Step #4: Create a scatter plot using your graphing calculator
Step #5: Draw the line of best fit using your graphing calculator. What is the equation of the best fit line?
Step #6: If a Burger has 0 grams of fat, how many calories does your equation predict? Does this make sense? Why or why not?
Problem #2: The table below provides data of the population of 10 states and the number of representatives in the United States’ House of Representatives.
State Approximate Population (in millions)
Number of Representatives
Oregon 3.2 5Indiana 5.8 10
North Carolina 7.3 12Mississippi 2.7 5Alabama 4.3 7
Oklahoma 3.3 6Utah 2 3
West Virginia 1.8 3Michigan 9.6 16Tennessee 5.3 9
Step #1: What is our independent variable? Dependent variable?
Step #2: Create a scatter plot in your calculator of the data (Population, House of Representatives)
Step #3: Write the equation of the best fit line.
a) What is the slope of the best fit line? ________________
b) What does the slope mean?____________________________________________________________________________________________________________________
c) What is the y-intercept of the best fit line? ________________
d) What does the y-intercept mean?____________________________________________________________________________________________________________________
Step #4: Use your equation from the previous step to approximate the number of representatives you would expect in New York State, knowing that the population of New York is 19 million people.
Think about:
True or False? If there is a correlation between the independent variable (x) and the dependent variable (y) does this mean that causation occurred. Causation shows how one thing causes something else to happen. For example, the independent variable caused the dependent variable to occur. Explain your answer.________________________________________________________________________________________________________________________________________________________________________________________________________________________________________________________________________
Name _________________________________________ Date _______________
Graphing Calculator Worksheet: Scatter Plots
A scatter plot is a graph used to determine whether there is a relationship between paired data.
In many real-life situations, scatter plots follow patterns that are approximately linear. If y tends to increase as x increases, then the paired data are said to be a positive correlation. If y tends to decrease as x increases, the paired data are said to be a negative correlation. If the points show no linear pattern, the paired data are said to have relatively no correlation.
To set up a scatter plot:Clear (or deactivate) any entries in Y= before you begin.
1. Enter the X data values in L1. Enter the Y data values in L2, being careful that each X data value and its matching Y data value are entered on the same horizontal line.
2. Activate the scatter plot. Press 2nd STATPLOT and choose #1 PLOT 1. You will see the screen at the right. Be sure the plot is ON, the scatter plot icon is highlighted, and that the list of the X data values are next to Xlist, and the list of the Y data values are next to Ylist. Choose any of the three marks.
1. To see the scatter plot, press ZOOM and #9 ZoomStat. Hitting TRACE and right arrow will move along the data points.
4. To determine the line of best fit. Press STAT → CALC #4 LinReg(ax+b). Include the parameters L1, L2, Y1. (Y1 comes from VARS → YVARS, #Function, Y1) You now have the values of a and b needed to write the equation of the actual line of best fit.
5. Graph the line of best fit. Simply hit GRAPH. To get a predicted value within the window, hit TRACE, up arrow, and type the desired value.
6. To turn the scatter plot off, when you are finished with this problem:Method 1: Go to the Y= screen. Arrow up onto the PLOT highlighted at the top of the screen. Press ENTER to turn it off.Method 2: Go to STAT PLOT (above Y=). Choose your PLOT location. Arrow to OFF. Press ENTER to turn it off.
Name ____________________________________________ Date ____________Quiz
Pick two data sets from the Table of Data worksheet that are related to one another. Make a scatter plot using your calculator. (SHOW YOUR WORK!)
a) What data set did you use for L1? L2?
b) What type of correlation is the scatter plot? Explain why.
(1) positive correlation (2) negative correlation (3) no correlation______________________________________________________________________________________________________________________________
c) What is the equation of the best fit line?
Shannon TrimperMED308Dr. Cushman
Lesson Plan
Topic: Math A Review
Grade Level: 9th grade
Materials: pencils, paper, worksheets
Lesson Overview: The students will brainstorm any vocabulary terms they can think of that we have covered (since we have been here) and we will discuss them or redefine them as a class. The students will continue to practice problems from previous Math A exams. The problems will consist of what the students have already learned since we began teaching them.
Objectives: The students will apply their previous knowledge from
learning to more practice problems from the Math A exam. (still more to list)
New York State Standards:Use the KEY IDEAS from Math A.
A.N.1 – Identify and apply the properties of real numbers (closure, commutative, associative, distributive, identity, inverse)
A.CN.6 – Recognize and apply mathematics to situations in the outside world.
(still more to list)
Anticipatory Set: Have the students take out a sheet of paper and ask them to write down any vocabulary terms that they can remember that we have gone over recently. If they cannot think of any right away you may want to ask them what the different number properties are.
Developmental Activity:
Closure:
Assessment:
Get the rest to me ASAP so that I can check the problems and the answers!