"paradise lost: an introduction to the geography of … lost.pdf · paradise lost 1333 (a)...
TRANSCRIPT
Pergamon 0277-9536(94)00255-X Soc. Sci. Med. Vol. 40, No. 10, pp. 1331-1355, 1995
Copyright © 1995 Elsevier Science Ltd Printed in Great Britain. All rights reserved
0277-9536/95 $9.50+0.00
PARADISE LOST: AN INTRODUCTION TO THE GEOGRAPHY OF WATER POLLUTION IN PUERTO RICO
JOHN M. HUNTER ~ and SONIA I. ARBONA 2 l Department of Geography, Institute of International Health, Michigan State University, East Lansing, MI 48824, U.S.A. and 2Department of Geography and Earth Sciences, Shippensburg University, Shippensburg,
PA 17257, U.S.A.
Abstract--Rapid industrialization has transformed the agricultural economy of Puerto Rico, creating employment opportunities and raising standards of living. Success, however, is marred by widespread pollution that outstrips the infrastructural capacity necessary for the preservation of environmental quality and of human health. The result today is a landfill crisis, a heritage of toxic dumps, and an advancing tide of pollution• Rivers and reservoirs are nearly ubiquitously affected and groundwaters, long thought to be naturally protected, show evidence of increasing contamination. Limestone aquifers are at particular risk. Public awareness and inter-sectoral political leadership are urgently needed to reverse the trend towards environmental deterioration.
Key words--water pollution, environmental quality, gastroenteritis, health, industrialization, urbanization, development, Puerto Rico
INTRODUCTION
• .our angel guest.. Beholding shall confess that here on earth God has dispensed his bounties as in heav'n [1]
With golden beaches, ample fishing, beautiful mountains, tropical warmth, rainfall and fruitful abundance, Puerto Rico has long enjoyed its rich natural endowments. But if Milton's 'guest' were to visit today, the angel would be deeply perturbed by the reckless environmental abuse of an Eden-like heritage.
The Caribbean island of Puerto Rico, at latitude 18015 , north and longitude 66o30 , west, is relatively small. Excluding the two offshore possessions of Culebra and Vieques, it covers 8700 km 2 and its dimensions are about 160 km east-west and 55 km north-south. The main island is divided into 76 local government areas known as municipios, with four metropolitan statistical areas: Mayaguez, Arecibo, Ponce and Aguadilla; and one consolidated metropoli- tan statistical area: San J u a n ~ a g u a s (Fig. 1).
Population has risen by 86% since 1940; the total population in 1990 was 3.5 million, giving a mean density of 404 persons per kmL Puerto Rico is obviously crowded in relation to its resources. Population pressure is traditionally relieved by emigration to the United States with which country Puerto Rico stands in a commonwealth relationship.
However, beginning in the 1950s, government programs of tax exemption were successfully introduced to encourage industrialization and to change the basis of the island's economy from agriculture (such as sugar cane, pineapples, coffee and
tobacco) to manufacturing. One consequence of this change has been heavy rural-to-urban migration, especially to the area of the capital city, San Juan. In turn, increasing congestion in the metropolitan region has necessitated population diversion to smaller towns with accompanying decentralization of industry. Whereas 30% of the population of Puerto Rico lived in towns in 1940, by 1980 the proportion was 67%; and, by 1990, 79% of the population lived within metropolitan areas. Furthermore, many rural resi- dents commute daily to urban employment so that very few areas escape the permeating influences of urbanization. Opinions may differ as to the range and quality of the outcomes, but there is little doubt that the structure of the Puerto Rican economy has undergone a very rapid transformation from its centuries-old rural roots to its present highly developed, modern, industrial, manufacturing and urbanized expression [2].
Our purpose here is to review the impact of this successful economic development on the quality of surface water, ground water and the public water supply; to explore the relationships between develop- ment and water contamination; and to contribute to the debate on the policy and operational aspects of water quality [3]. Although human health effects are directly implicated in water pollution [4, 5] we do not consider them here because of a lack of epidemiolog- ical evidence in Puerto Rico. We focus instead on the pre-conditions of negative health effects, namely water contamination, in relation to the processes of economic development.
SSM 40/10~8 1331

1332 John M. Hunter and Sonia I. Arbona
Puerto Rico Municipios
°' " I Consolidated metropolitan statistical area (SCSA)
Primary metropolitan statistical area (PMSA) and metropolitan statistical area (MSA)
20 J
Kilometers
Fig. I. There are 76 municipios in an area approx. 160 km by 55 km holding a population of circa 3.5 million (After U.S. Census 1990 [2]).
THE WATER BUDGET AND NATIONAL WATER DEVELOPMENT
The Puerto Rican central mountain chain exceeds 600 m above sea level and has 63 peaks ranging between 800 and 1338 m [6]. It forms a barrier to the northeast trade winds casting a rain shadow over most of the southern coast which receives < 1140 mm of rain annually, whereas the northern areas average about 2030 mm. With an estimated average rainfall of 1780 mm, Puerto Rico enjoys a well endowed supply of water. Its water budget is 11,600 million gallons per day (mgd) [7].
Geologically the central core of Puerto Rico consists primarily of volcanic and intrusive rocks of Late Cretaceous and Early Tertiary age. The core is flanked on the north and south by elastic sediments of gravels and sands and by limestones of Oligocene and Miocene age [8]. Solutional activity on the north coast limestone has resulted in mature karst topography [9]. The north coast and south coast limestone formations rank as Puerto Rico's principal aquifers: daily withdrawals in 1980 amounted to 210 mgd or 43% of the water consumed in the area (Fig. 2) [8].
The mountainous zone lying between the two limestone provinces is drained by about 100 streams and rivers, and it has been extensively modified for water storage for power, irrigation and the public supply. The first hydroelectric station was opened in 1907 followed by two more in 1913 including Carite [Fig. 3 (a)]. In 1913-14 four irrigation dams were completed including Guayabal, Coamo and Patillas, and a complex series of canals was developed to irrigate the sugar cane. Additional agricultural dams were built at Guajataca in 1928, Ana Maria in 1939 and the last one in 1951 at Loco [Fig. 3 (a)]. Altogether there are eight irrigation reservoirs
serving the rainshadow areas of Puerto Rico [7, 10, 11].
Agencies of government promoting water develop- ment, with the assistance of the U.S. Army Corps of Engineers, are the Land Authority (for irrigation), the Electricity Authority (hydro power) and the Water Authority (the public supply). Of the island's total of 29 impoundments, 15 generate power and 6 support the public water supply. The largest hydroelectric reservoirs are Caonillas and Dos Bocas at 46,000 and 30,420 acre-feet respectively. Toa Vaca, 56,000 acre-feet, Loiza, 24,000 acre-feet, and La Plata, 23,000 acre-feet are the largest Water Authority reservoirs
Principal Aquifers and Withdrawal Zones
~ North and South Provinces
milllan gels. per day 1980 Percentage of Aquifers Ground-water TotatWater Groundwater
withdrawal Use North COl l t Province Zone
A West coast to Rio Grande de Arecibo 5 45 11. t
B Rio Grande de Arecibo to 60 65 92.3 Rio de la Plata
C Rio de la Plata to Rio 10 160 6.3 Espintu Santo
South Coaat Province Zone
D PatiHas to Ponce 115 215 53.5 E TaHai0oa-Guayanilla- 20 100.0
Yauca-Guanica
TOtals 210 485 43.3
Fig. 2. Dependence on groundwater averages 43% and is greatest in aquifer zones B and E (After Ref. [8]).

Paradise lost 1333
(a) Major Reservoirs of Puerto Rico
Nodh and South Aquifers
~ Major Irrigation Areas o, 20
Kilometers '
(b) Saltwater Encroachment
Dissolved-solids concentration larger 0 , 20 than 2,000 milligrams per liter Kilometers
Fig. 3. (a) Rainfall ranges from 2000 mm annually in the north to 1000 mm in the south where irrigation is extensively practised. A policy of hydrological development has created 29 reservoirs for hydroelectric power and the public water supply, leaving few remaining good exploitable sites. Siltation and eutrophication are major problems. Star indicates new reservoir complex (after Refs [10,11]). (b) Saltwater
encroachment (after Ref. [14]).
[Fig. 3 (a)]. Reflective of the rapid pace of economic development in Puerto Rico, no fewer than 20 dams were constructed over a 29-year period, 1928-1956, giving an average of one completed dam every 17.2 months. Reservoirs supporting the public supply were completed in 1943 (Garzas), 1946 (Cidra, Las Cutlas) and 1954 (Loiza also known as Carraizo). Twenty years then lapsed before the building of Toa Vaca in 1972 and La Plata in 1974. The newest addition, the Cerrillos-Portugues two-dam complex, now ap- proaching completion (1994), will bring flood relief, hydroelectric power, and drinking water to Ponce [12] [Figs 1 and 3 (a)]. Excluding Cerrillos-Portuges, total storage capacity for all reservoirs combined stood at
44,000 acre-feet in 1914; it was enlarged to 240,000 acre-feet in the 1928-1956 growth period, a 5.5-fold increase; rising to 319,000 acre-feet with the completion of the last two reservoirs in 1972-74 [7, 11]. Estimates of 1987 indicate total withdrawals of surface and ground water of 598 mgd of which 391 mgd or 65% go to the public supply. Domestic and commercial uses account for 66% of withdrawals followed by agricultural uses at 28% (Table 1) [7]. With the density of reservoirs on the island approaching saturation, and the best hydrological sites already occupied, the demand for water continues to increase to the extent that supplies are no longer sufficient.

1334 John M. Hunter and Sonia I. Arbona
Puerto Rico's industrial success, with its accompa- nying municipal expansions, has also increasingly driven an insatiable utilization of its groundwaters. Island-wide, the number of ground water wells rose from 2282 in 1964 to 4215 in 1986 of which 1556 were located on north coast limestone [13]. Even including abandoned and destroyed wells, this inventory speaks eloquently for the heavy dependency of economic development upon groundwater re- sources.
But, like the reservoirs, aquifer withdrawals are also declining; due to contamination and closings of wells. Limestone aquifers produced 210 mgd in 1980 (Fig. 2) compared with only 175 mgd seven years later in 1987 from a larger area including both limestone and alluvial aquifers--a decline of 17 % (Table 1). Ground water withdrawals, as a proportion of total water use by zone, range from a low value of 6.3% in Zone C (Fig. 2) where industrial-urban contamination has caused numerous well closings to a high of 92% in Zone B. An added factor in aquifer loss is sea-water penetration due to heavy pumping in coastal areas [14] [Fig. 3 (b)]. These and other influences in water loss are considered later.
Poor land conservation, short-sighted farming practices, and continuing construction of watershed housing cause heavy siltation of the reservoirs thus seriously reducing their storage capacity. The capacity of Dos Bocas (Fig. 3), for example, declined from 30,420 acre-feet in 1942, when it was completed to produce hydro-electricity, to 19,620 acre-feet in 1985--a 35% reduction. Sedimentation averages 0.83% per year of the original capacity, but the rate is increasing and, at the loss rate of the past six years (600 acre-feet per year) estimates of remaining usable life have been revised from 78 years down to 32 years [15]. The situation at Loiza (Fig. 3), the public water supply reservoir, is even more serious. Storage capacity has declined from 21,700 acre-feet in 1953 to 10,100 acre-feet in 1985--a reduction of 53%. The average sedimentation rate is 1.8% per year of the original capacity. Under optimal conditions, the remaining usable life is calculated to be 23 years. However, storm events, flooding and increasing agricultural and urban development, with accelerated sedimentation, are
further shortening the reservoir's life [16]. The effects of Hurricane Hugo in 1989 have not been estimated but they are undoubtedly severe.
Conveyance losses due to maintenance problems are also a major source of stress on the public water supply. In 1987, 391 mgd were withdrawn from the public supply but only 221 mgd were 'furnished' to consumers representing a loss of 43%. Water losses from the public supply system in Puerto Rico were estimated to be 41% of the production in 1960, and about 50% in 1985 [7]. Public supply systems delivered 10% less water in 1985 than in 1980 notwithstanding the population increase. Apart from delivery losses, total water production is also declining. Latest statistics show a reduction of 4.3% from 415 mgd in 1987-88 to 397 mgd in 1989-90 [17].
The agricultural sector uses 28% of the water supply (Table 1). Irrigation is greatest along the drier southern coast (Fig. 3) for sugarcane, vegetables and rice. Specifically, sugarcane production has dropped from 10,501 million tons in 1951 to 1271 million tons in 1985 and, in the last 25 years water use for irrigation has declined by 42% [7]. But the water savings, thus effected, have been more than offset by increasing urbanization and industrial consumption.
The abundance of water resources originally was one of the attractions used by the Government of Puerto Rico to promote new industries on the island. Yet today's water supplies are insufficient, and they continue to diminish in the face of increasing need. The greatest problem, however, is not the quantity of water but its quality. Ironically the success of the island's policy of industrialization and urbanization produces serious deterioration of the environment, and water pollution now threatens human health.
1NFRASTRUCTURAL LAG, SEWAGE AND BACTERIOLOGICAL CONTAMINATION
In its survey of the 1984 water year of Puerto Rico, the USGS reported that 54 of 67 river sampling stations (81%) exceeded maximum microbiological contaminant levels (MCL) for recreational waters: 1000 colonies of fecal coliforms per 100 ml of raw water [18]. In the following year, 72 stations were
Table 1. Source and use of water in Puerto Rico, 1987
Million gallons/day (mgd) %
Source Surface water 423 70.7 Ground water 175 29.3 Total 598 100%
Use
Public supply
Domestic, commercial 396 66.1 Industrial 31 5.1 Thermoelectric 6 1.1 Agricultural 165 27.6 Total 598 100%
From surface 307 78.5 From ground 84 21.5 Total 391 100%
Source: USGS National Water Summary, 1987 [7].
P a r a d i s e lost 1335
(a) M a x i m u m C o n c e n t r a t i o n s o f F e c a l C o . f o r m s Sur face Water 1984-85
< 1,000 1 , 0 0 0 -
Colonies per 100 ml raw water at sample site. 10,000 - - 100,000 - -
> 1 ,ooo,ooo
(b) M a x i m u m C o n c e n t r a t i o n s of F e c a l S t r e p t o c o c c i Sur face Water 1984-85
Colonies per 100 ml raw water at sample site. 10,000 - - > 100,000
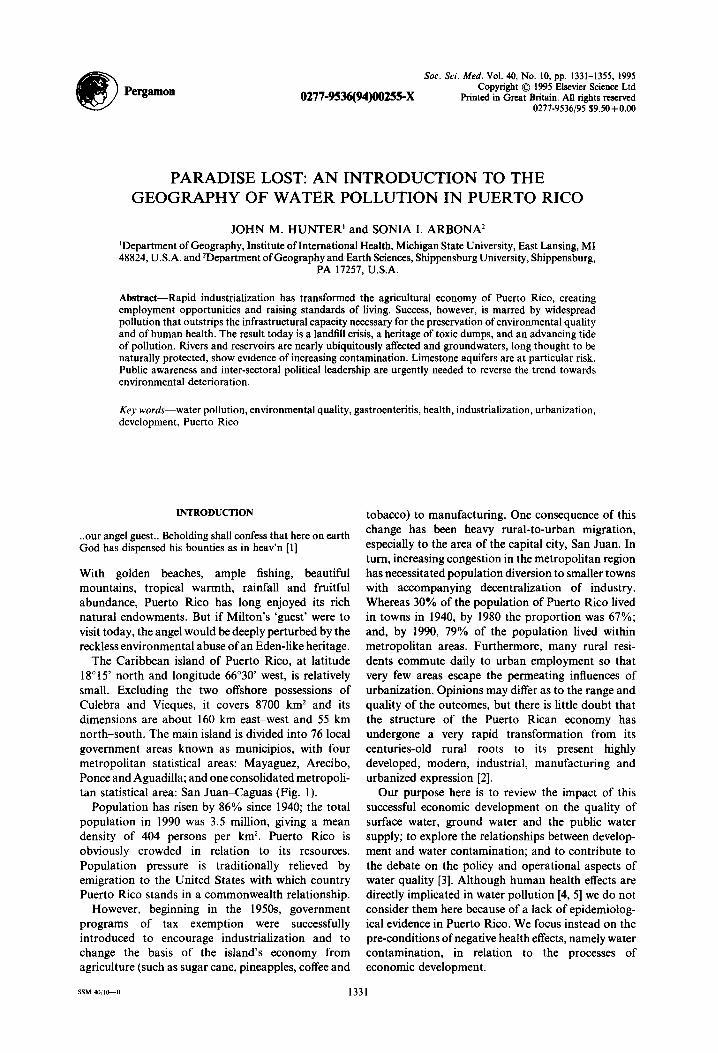
Fig. 4. Surface streams are extensively contaminated especially in urban areas; the worst site rising to 5.7 million coliform colonies. Fecal streptococci counts are usually about 20% of fecal coliform counts. Four
of every five tested sites are too polluted for recreational use by EPA standards (after Ref. [10]).
tested for fecal coliforms and fecal streptococci, and the results were virtually identical: 82% of the stations exceeded the recreational standard, 88% exceeded the surface water standard (200 colonies) and 100% were in violation of drinking water standards (Fig. 4, Table 2) [10].
Since coliforms are recognized in the U.S. as the standard indicator of recent fecal contamination, the sampled waters are thus believed to be grossly contaminated by human waste. In this context it may be noted that recent research in Puerto Rico and elsewhere reveals that tropical ambient temperatures and humidity can promote high coliform counts (including Escherichia coli) in primary forest unsullied by human occupation. E. coli are even found among epiphytes growing 10 m above the forest floor. (May
we suspect primate sources?). Further suggestive evidence is also found in the Ivory Coast, Hawaii and Brazil. Thus, coliform bacteria counts, which are used for evaluations in temperate latitudes, must be interpreted with some caution in the tropics [19-21]. At the same time, in one of the Puerto Rican field studies, bacterial densities were positively correlated with water nutrient levels particularly nitrates and phosphates, common indicators of human activity; and indeed the highest bacterial densities were found at a sewage outfall, again implicating human influence [19]. Overall, we feel that bacteria levels in water may be recognized as valid environmental indicators of human contamination, particularly where the counts are high.
In 1984-85, the mean fecal coliform and fecal

1336 John M. Hunter and Sonia I. Arbona
streptococcal counts for 72 stations on the island were 259,000 and 50,000 colonies, respectively (Table 2). Station by station, the latter parameter was regularly 20% of the former. We calculate that the statistical relationship between the pairs of readings at the 72 sites is: Y = O . 6 0 1 + O . 7 8 3 x ( R = O . 8 7 4 , R 2 = 0 . 7 6 4 ,
P--0.000) where y = log coli and x = log streptcocci. This strong connection suggests the utility of fecal streptococci being used as a measure of contami- nation, although official water quality standards have not been established.
Geographical patterns of bacteriological pollution strongly favor urban areas (Fig. 1). The maximum fecal coliform count of 5.7 million colonies per 100 ml raw water is found in the Rio Chico basin in PatiUas [Fig. 4 (a)]. Three other sites, each exceeding one million colonies, are all located in the San Juan metropolitan region at:
(1) Rio Hondo, Catano, 1.5 million colonies; (2) the Quebrada Blasina, Carolina, 1.7 million; and (3) the notorious San Jose creek an open sewer
draining into San Juan Bay, 3.3 million.
Moving to the next order of magnitude (over 100,000 colonies and below one million) the urban influence can be seen equally clearly. Of the 11 stations in this category, six are located in metropolitan areas: Bayamon (two), San Juan (two), Caguas and Ponce, and the rest are close to smaller urban centers [Fig. 4 (a)].
The pattern of fecal streptococcal contamination shows an even stronger urban influence [Fig. 4 (b)]. A total of seven stations exceeded counts of 100,000 and another 16 stations reported more than 10,000 colonies and below 100,000. Among these 23 highly contaminated sites, 12 are in the metropolitan areas, with three more lying west of the capital area in the urbanized municipios of Vega Alta, Vega Baja and Manati (Fig. 1).
The general pattern of fecal pollution in Puerto Rico is evident: the worst sites are located close to urban
zones, industrial parks and residential suburbs not served by local sewerage systems. The latter in particular are seen as the major culprit. Urbanization with industrialization has been so rapid as to create a serious lag in the provision of infrastructural services: unauthorized domestic hookups always exceed already-saturated plant capacities. Thus at the majority of sewage facilities, the supply of human waste outstrips treatment capacity and raw sewage is consequently discharged into streams. The risk to human health is obvious.
For a number of years, because of operational deficiencies, the Puerto Rico Aqueduct and Sewer Authority (PRASA) has been subject to legal action initiated by the Environmental Protection Agency (EPA), and many of its treatment facilities operate only under Federal court order. In 1987, for instance, 32 of 66 of the PRASA sewage plants (48%) were subject to court order [22]. By 1990, 54 plants (82%) were under court jurisdiction [23]. Multiple violations, in the form of illegal discharges of raw sewage, result in heavy fines. Over a 30-month period, in 1989-91, these exceeded $3 million or $100,000 per month [24].
The problems are manifold but essentially reflect a lack of infrastructural planning and investment. The rapid growth of urban complexes and industrial parks in the 1960s and 1970s lacked uniformity in their sewerage systems and an absence of effective Federal and local government regulations. In central urban areas, pipe diameters were quickly rendered narrow and obsolete in relation to demand, yet remain too costly to replace. The Condado beach sewers of San Juan, built in 1955 before the construction of large tourist casino hotels, are now overloaded so that recreational use of the beach is bacteriologically hazardous [22]. With endless additional sewer hookups in the suburbs, plants receive more effluents than they can process. Even larger treatment plants, such as Dorado and Bayamon (Fig. 1), operate at only one-third capacity because of a lack of resources.
A court order forbids new connections to the system
Table 2. Surface water contamination by fecal bacteria in Puerto Rico, 1984-85 Maximum concentration of Fecal coliform Fecal streptococci colonies per 100 ml Sample stations Sample stations raw water N= % N= %
Number of colonies Mean 258,676 50,495 ± SD 817,7 I0 150,434 Max 5,700,000 920,000 Min 4 12 Source: Calculated from USGS Water Year 1985 [10]. Standards: Drinking water: 1-4 colonies of fecal
coliform; mean 1 per month. Surface water: geometric mean of fecal coliform not exceeding 200 colonies, or 400 colonies if not more than 20% of samples. Recreational water: < 1000 colonies of fecal coliform. No standards for fecal streptococci.
Below 100 7 9.7 10 13.9 100- 6 8.3 18 25 1000- 21 29.2 21 29.2 10,000- 23 31.9 16 22.2 100,000- 11 15.3 7 9.7 1,000,000 and over 4 5.6 0 0.0 Total 72 100% 72 100%

Paradise lost 1337
and thus puts a damper on further industrial and residential growth. In Aguas Buenas (Fig. 1), for example, there have been no new housing projects over the last 14 years. With a 30% unemployment rate, according to the mayor, the municipio is stagnating. Inadequate sewerage is also often associated with insufficiency in the public water supply. The Agnas Buenas water supply meets only an estimated one tenth of need, and some rural barrios lack water for 15 days at a time. Originally named for their pure waters, the mountain streams of Aguas Buenas are now polluted, and inhabitants resort to collecting rainwater [25].
Federal government bacteriological monitoring of sewage treatments indicates that 54% were less than 'satisfactory' in 1991 compared with 97%, as given in the first Federal monitor's report in 1981 [24]. This improvement has been effected by the closure of 48% of the treatment facilities from 88 to 46 at present [24]. The 42 closed plants are mostly small, and PRASA is focusing its efforts on the renovation and refurbishing of the larger treatment centers. Some improvements have been made but, by October 1991, 44 are still under Federal monitor jurisdiction and, in the Humacao region, only four of 16 sewage plants passed inspection [26]. By 1994, 41 sewage plants stay under court order, and most of the other 37 self-operating plants are tacitly recognized to be out of regulatory compliance (Rafael Rios, EPA Monitor, personal communication, 5-2-94). Financial support is lacking for a speedy overhaul of the system. Its obsolescence is now a barrier to sound growth and development. The price of past infrastructural neglect is ubiquitous water pollution, as evident in river sampling (Fig. 4).
EPIDEMIC GASTROENTERITIS
The reported occurrence of 7800 cases in Comerio (Fig. 1) in 1977 first drew public attention to the phenomenon of epidemic outbreaks of fever with acute gastroenteritis [19]. It was concluded that illness in the community was due to improper chlorination and general bacteriological contamination of surface waters. In the same year, some 14,000 cases were reported island-wide by the Department of Public Health; and to these may be added many cases treated by private physicians but not reported.
Similar outbreaks have occurred from time to time since, in various municipios, the latest affecting 9000 persons in Las Piedras (Fig. 1) in August 1991 [27]. Reported cases of acute gastroenteritis, island-wide, increased annually from 24,000 in 1983 to 62,000 in 1987 [28]. The rapid rise in reporting may be an artifact of heightened community concern and political consciousness about water pollution. Transmission can be effected by consumption of food or drinks, or by person-to-person contact, but it seems clear that contaminated water is creating the generalized outbreaks; and that sewage treatment plants are heavily implicated.
A Health Department pilot study of 1471 reported cases, in the 11 munlcipios of the Bayamon health region in 1987, ascertained that only 18% of the cases were of public health significance [20]. In this invest igat ion, the definition o f a case was 'tightened', and clinical judgment alone was discarded and replaced by two criteria: three liquid stools in 24 hr and a temperature of 37.7°C (100°F) or higher. Conse- quent reduction of official reporting may serve to dampen community alarm over a concern that has become politically sensitive. For instance, when the Puerto Rico Chemists' Association advises people to boil their drinking water, the Government rejoinder is that the public is being unnecessarily alarmed [29].
In the Bayamon outbreak, 66% of the cases were in children below the age of 10. Laboratory findings revealed salmonella, shigella, Staphylococcus aureus, E. coli, rotavirus, campylobacter and protozoan etiological agents [30].
Another water-related disease outbreak occurred in 1987 when the Coxsackie virus (A24 variant) entered Puerto Rico from the neighboring islands of Trinidad, St. Croix and Jamaica where it had caused epidemics in the previous year [31, 32]. It subsequently went on to invade Mexico and Panama. With a short incubation period of one to two days, this virus causes explosive outbreaks of acute hemorrhagic conjunctivi- tis (AHC), a disease of the eye. It results in redness, tearing, foreign-body sensation, subconjunctival hemorrhage, palpebral (eyelid) folliculitis and palpe- bral swelling. The illness is acute but recovery is usually complete in seven days [31].
Transmission is by person to person spread, from hand to eye, and through contact with fomites (e.g. contaminated towels). Low socioeconomic areas are the worst affected. Public health measures emphasize prevention by good handwashing practices. A total of 31,772 cases were officially reported island-wide in Puerto Rico, in five-months, June-October 1987 [31]. A particularly acute outbreak of over 2000 cases was reported in the small municipio of Aguada (Fig. 1) [29]. With only 1% of the island's total population, Aguada suffered over 6% of the reported cases. Subsequent investigation revealed that ruptures of water supply pipes in the community led to a lack of potable water for a period of six days, thus promoting spread of the disease.
In the same year, an outbreak of acute gastroenteri- tis in Yauco (Fig. 1) resulted in 800 reported cases in three rural barrios. E. coli was identified as the prime pathogen, and inspection revealed the existence of 30 pipe ruptures and other faults in the water delivery system [33]. Lacking confidence in public water, some people in Puerto Rico consume mineral water imported from France and Argentina; and many more purchase bottled spring water from Ponce (Fig. 1) at $0.98 per gallon (3.785 1).
In the sectoral, infrastructural debate that has arisen over community gastroenteritis, the water authority (PRASA) denies culpability and challenges the

1338 John M. Hunter and Sonia I. Arbona
(a) Reported Gastroenteritis Outbreaks, 1987
Cata~o
[
.?
North coast limestone aquifer 2 2 Persons per 1,000
30 kilometers m Metropolitan area (over limestone)
(b) Sewage Treatment Facilities
~¢ Primary ~ Secondary (advancea) treatment plant 1~' Sea discharge
Fig. 5. Reported rates of acute gastroenteritis are lowest in the metropolitan area which is supplied by distant reservoirs, and highest in rural areas using local aquifers. The evidence suggests fecal contamination of groundwater through the limestone. Discharge of raw sewage into sinkholes is one known mechanism. Data
from Refs [17, 37].
evidence of the Health Department. The latter's field investigators in the Las Piedras (Fig. 1) outbreak of 1991 concluded that sickness was positively associated with the amount of piped water consumed. However, the water authority claimed that its adjoining Humacao (Fig. 1) filtration plant had tested bacteriologically negative throughout the year. The mayor of Las Piedras, it was countered, had released water from contaminated storage tanks during a recent drought experience [24, 27, 34]. Whatever the resolution, the reality of continuing outbreaks cannot be denied.
Even the deep and pure aquifers of the north coast limestones are not immune from fecal bacteriological contamination. The small municipio of Florida (Fig. 1) offers an illustration of the process. During a community outbreak of acute gastroenteritis in 1985, the source of infection was discovered to be the Florida public water supply pumping station which tapped the limestone aquifer. When the well was closed, the epidemic subsided (Echoes of John Snow! [35]). Of course, the question still remained as to where the fecal pollutants were originating. The answer was found to be the local sewage treatment facility. Given the municipio's rapid population growth, the supply of human waste exceeded the plant's capacity. Built in 1964 with a biofiltration capacity of 0.167 mgd, the actual daily flow of 0.400 mgd was 2.4 times greater than the capacity of the existing infrastructure [17]. Thus raw sewage was periodically discharged by the treatment plant into a conveniently adjoining limestone sink hole and thence to the supply of
underground drinking water. The public well, a little over 1 km distant and 61 m below the surface, was closed in 1985, its water unfit for human consumption. Other wells may be threatened. The offending sewage plant was closed in 1989 by the Health Department, under court jurisdiction, and will probably not be re-opened under the new regional plans.
Vega Alta (Fig. 1) provides a good example of infrastructural inadequacy or shortfall of services under conditions of rapid growth. According to the mayor, Manuel Chinera Marrero, its sewage plant, was built in the 1950s for 3000 people when Vega Alta was a small farm town. The plant, subsequently enlarged, now supports a population of 10,000. However, even this increased capacity can serve only a fraction of total need and, inevitably, raw sewage is routinely discharged into the river [36]. Existing sewer connections, even if fully maintained, would cover only 27% of the municipio's 1990 population. Hence, beyond the risk of overflowing plants, there is a greater risk of bacteriological pollution from the unconnected residences.
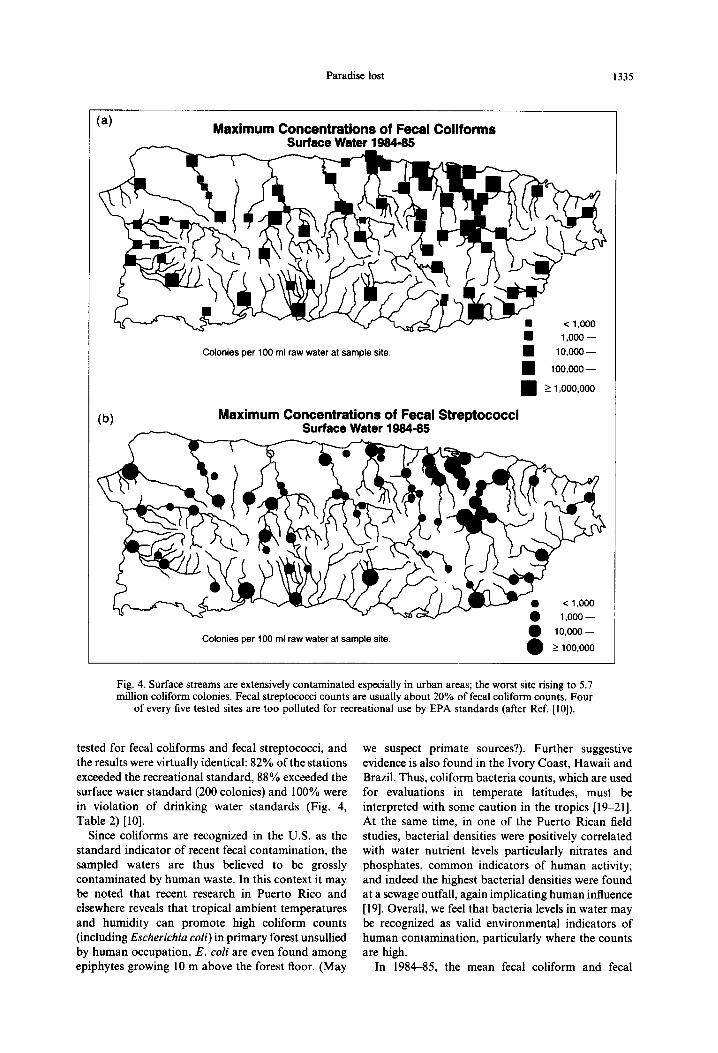
Based upon a total of 61,791 cases of acute gastroenteritis reported by municipio by the Health Department in 1987 [37], we estimate a crude rate of 19 per 1000 population for the island but only seven for the San Juan Metropolitan area (Table 3). We conclude that the metro area has the best protected water supplies, with gastroenteritis rates ranging between 2 and 13, except for Loiza with 27 [Fig. 5 (a)]. The mean rate for the nonmetropolitan northern limestone region is 25 (Table 3). This is equal to the rest
Paradise lost
Table 3. Outbreaks of acute gastroenteritis in Puerto Rico, 1987
1339
Region Reported cases Population Rate per 1000 San Juan Metro Area 7317 1,034,987 7.07 Rest of Northern Limestone 12,825 509,513 25.17 Rest of Puerto Rico 41,649 1,652,020 25.21 Total for Puerto Rico 61,791 3,196,520 19.33 Source: Calculated by authors from cases reported by municipio in 1987. Data courtesy Department of
Health [37].
of Puerto Rico and suggests a lack of aquifer protection against biological contamination. Signifi- cantly, the metropolitan area, with the lowest rates of gastroenteritis, uses supplies of piped water from reservoirs rather than local groundwater; its aquifer consumption is only 6% compared with 92% in the Arecibo-Manati area (Zones B and C, Fig. 2).
Westward, over the north coast limestones, high rates of acute gastroenteritis are seen in: Dorado, 60; Manati, 49; and Hatillo, 81; despite naturally protected groundwater supplies [Fig. 5 (a)]. Any statistical correspondence that may be suspected between the attack rate and sewage treatment facilities cannot be accurately determined because of a lack of technical information on sewer hookups and plant capacities. However, population over-loading on facilities may still be recognized as a disease factor, especially outside of San Juan. The metropolitan region, with 21 treatment plants, has better protected water supplies [Fig. 5 (b)]. If Arecibo and Isabela are excluded because of sea discharges, and the populations of Camuy and Hatillo are aggregated because they are served by one treatment facility, a total of 12 nonmetropolitan limestone municipios remains (Table 4). When sorted by population size into two groups, below 20,000 and above 20,000, the latter showed a higher disease rate suggestive of overloaded treatment facilities. The larger (and most rapidly growing) population groups had an average rate of acute gastroenteritis 61% higher than that of the smaller municipios: 18-29 per 1000 (Table 4). However, the statistical significance is very weak and, obviously, in addition to the overflow of sewage treatment plants, many different factors can be involved in a community outbreak of gastroenteritis.
Since 1987 two notable outbreaks were reported in Puerto Rico, both in August 1991, one of 202 cases in a penitentiary, the other of 9847 cases in a community water system. Together, these outbreaks amounted to 78% of all U.S. cases reported in 1991 [38]. Partial explanations include the resumption of water supply following interruption by drought, discharges of waste into the source river, lack of chlorination and filtering,
and insufficient flushing of old water from pipes and tanks. Other possible distribution system faults include cross-connections, back siphonage and contamination of the mains during repairs and construction. Etiological agents were not identified, but it was reported that water-borne protozoal parasites, bacteria and viruses variously result in gastroenteritis, meningoencephalitis, otitis, conjunc- tivitis, pharnyngitis and other acute illness [38].
THE LANDFILL CRISIS
With its economic growth and high standard of living (for the Caribbean) Puerto Rico generates large quantities of solid waste: paper, cardboard, plastic, glass bottles, metals, vegetables and foodstuffs, typical of the so-called consumer society. As estimated by the Government's Solid Waste Management Authority (SWMA) in 1988, this amounted to 5700 tons/day [39, 40]. Projected to the year 2000, the total burden of solid waste will be 6684 tons/day of which 59% will come from 12 or 16% of the municipios (in order of tonnage): San Juan, Bayamon, Ponce, Carolina, Caguas, Mayaguez, Guayanabo, Arecibo, Toa Baja, Vega Baja, Aguadilla and Humacao. Only the last three lie outside of standard metropolitan statistical areas (Fig. 1). Solid waste generation will range from 2.4 lb/per~on/day in the smaller municipios, and 4.6 lb in larger municipios, up to 4.9 lb in San Juan with an island-wide mean of 4.143 lb/person/day [41].
Historically, each of the 76 municipios had its own designated areas for discarding refuse. Some, such as Comerio, had little more than burning dumps (crematorios) now abandoned. Others, like Caguas, developed a large solid waste site which is now filled and sealed, so that local refuse must be transported elsewhere. By 1988, 15 municipios lacked solid waste land fills, and the remaining 61 municipios with dumps faced a crisis of life expectancy. The demise of many is imminent: 49% will be at full capacity within 0°5 years; 63% will expire in 0-10 years; and for only 5% does the time horizon exceed 20 years (Table 5, Fig. 6).
The San Juan landfill, conspicuous on the flat land
Table 4. Sewage treatment facilities and reported outbreaks ofgastroenteritis on north coast limestones in 1987 (excluding metrnpofitan area)
Population per Municipio Reported gastroenteritis cases per Sewage Treatment Facility N= Municipios 1000 population Below 20,000 4 18.275 + 8.403 (range 6.2-24.2) 20,000 and over 8 29.538 4" 19.756 (range 1 I. 1-58.9) Note: Independent samples t-test P=0.200.

1340 John M. Hunter and Sonia I. Arbona
Table 5. Life expectancy of municipal landfills, 1988
N= %
Munieipios without a landfill 15 19.7 Municipios with a landfill 61 80.3 Total 76 100%
Life expectancy of landfills 0-5 yr 37 48.7 6-10 yr 11 14.5 11-15 yr 4 5.3 1 6-20 yr 5 6.6 Over 20 yr 4 5.3 Total 61 100%
Notes: 1, Source: Puerto Rico Solid Waste Management Authority, Document, April 19, 1988 [47]. See Fig. 6 Upper. 2, Since these life expectancies were estimated, Ceiba landfill has been closed (1991) and now sends solid waste to neighboring Fajardo, thus modifying the 1988 analysis given above.
which used to be a coastal marsh, is illustrative. Lacking space for horizontal extension, it continues to grow vertically. It has reached its maximum allowable height of 22 m in several places, yet still receives over 1000 tons of refuse each day. The city's main water supply pipe runs underneath this dump and there is fear that toxic leachates will contaminate the water [42]. The situation is fast approaching an impasse. At this site alone, rehabilitation will cost an estimated $29.7 million. A proposed incinerator is opposed by environmental groups and by the wealthier neighbor- hoods. The economics of producing thermal electric- ity, using solid waste, a-e also unresolved. The city estimates a selling price of 6 cents per kW/hr as against the Electric Energy Authority's purchasing price of 4.3 cents [40]. Garbage, the product of modernization, becomes increasingly costly to process, and it now impedes new development.
The saturation and closure of municipal landfills has produced a pattern of regional flows of solid waste mostly based upon proximity [Fig. 6 (b)]. We assumed (as if often the case with U.S. townships, and in waste consignments to the Third World) that wealthier municipios would send their solid waste to poorer neighbors. However in Puerto Rico the opposite is true: solid waste moves against both income and population gradients. More populous and industrial- ized communities have seemingly developed better infrastructural arrangements for solid waste. Allowing for infrastructural lead time (data for 1970 and 1988), municipios receiving regional waste, paired against the 'sending' municipios, had 139% more population and 41% more income per family (Table 6). Poorer municipios pay richer neighbors $20-35 per ton to receive their solid waste.
An alternative form of waste disposal, clandestine and illegal dumping, is found everywhere in rural Puerto Rico. Poorer families may be expected to resort to this behavior but we suspect that it is not strongly income-related. Plastic bags of noxious household refuse, washing machines, refrigerators and derelict motor cars can be seen abandoned on mountain roadsides, in ravines, pushed down limestone sinkholes, or tipped off bridges into rivers. We have
even seen a dead horse abandoned on the bank of an intra-urban stream.
The success of Puerto Rico's programs of economic development has outstripped local infrastructural capacity to handle solid waste. As is evident in the life-expectancy analysis, time is fast running out on extant storage capacity [Table 5, Fig. 6 (a)]. Furthermore, landfill laissez faire now faces the emergence of stricter regulation, including Federal supervision. Municipal landfills may eventually be placed under Federal court jurisdiction, as are sewage treatment plants. Voluntary or enforced landfill closures reflect infrastructural shortfalls in the face of rapid economic development and, in the short run, augment the solid waste crisis.
Informal opinion suggested in 1988 that 62 of 64 landfills were not in compliance with environment and health regulations [43]. Possibly 80% of the municipal landfills have no construction permit and 90% are without an up-to-date license to operate [44]. The Chair of the Environmental Quality Board (EQB) has reported that only two landfills (Ponce and Mayaguez) are well operated, six to nine are marginal and some 57-60 (80-88%) are "a disaster". The Board, he explained, was "trying to shut down 17 municipal landfills before the Federal government steps in" [45].
The risk of court-ordered interventions is real. A preferred policy alternative of the EQB has been to seek Federal assistance for mayors of municipios to upgrade their landfills rather than to threaten closure [42]. Closures however seem inevitable and may, indeed, be appropriate. The newly constituted Solid Waste Management Authority (SWMA), which comes under the jurisdiction of the EQB, has developed extensive plans that will close all landfills except 15 to be designated 'regional' landfills. In addition, using new technologies, 20 transfer stations will be created, together with three resource-recovery incinerators and two landfills for ashes [41]. Ideally the plans would be reinforceable by:
(1) citizen education to reduce waste generation at source; and
(2) the creation of new market extensions for recycling (e.g. 40-60% of aluminum in Puerto Rico is recycled because the market is good).
The opening of the proposed waste incinerators for power generation (in the metro area and Arecibo) will be important. Enabling funding has not been identified to complete the system changes, but so far a Federal block grant of $30 million has been secured to begin the reform with land acquisitions and the purchase of heavy equipment [46]. Landfill life will be extended, but much more financial support will have to be raised to complete the regionalization plans. A total of 61 municipal landfills are still in operation [47]. At the same time, the question of the toxic waste which in the past has been incorporated within municipal landfills (as a heritage of past industrialization and, to a

Paradise lost 1341
significant extent, continuing today) must be ad- dressed.
HERITAGE OF TOXIC DUMPS
It is clear that virtually all of Puerto Rico's land-fills have in the past received toxic wastes; that rising industrialization of the 1950s onwards was ac- companied by uncontrolled dumping of industrial wastes into the nearest landfill. Much of these deposits were toxic. Even today there is continuing illegal dumping of hazardous materials in 'safe' municipal landfills. The general effect, when added to clandestine roadside and ravine dumping, seriously threatens the quality of surface water supplies and of the aquifers.
The emergence of heightened public awareness of environmental issues was accompanied by two important legislative triggers, the Resource Conserva-
tion and Recovery Act (RCRA) of 1976, and the Comprehensive Environmental Response, Compen- sation, and Liability Information System (CERCLIS) of 1980. These acts have energized Puerto Rico's response to the crisis of environmental deterioration. Ongoing surveys by the Environmental Protection Agency (EPA) and Environmental Quality Board (EQB) have resulted in a national inventory of toxic sites and a national priority list (NPL) as yet incomplete [43, 44]. 'The polluter pays' principle is adhered to; and, where liability is not established, the Federal government contributes 90% of the site clean-up costs, with the Commonwealth adding 10%. This is popularly known as the Superfund arrange- ment. Already the polluters of eight NPL sites have been identified and negotiations have commenced for cleaning and restoration. Another ten NPL sites are identified among which six are municipal landfills.
(a) Life Expectancy of Municipal Landfills, 1988
Remaining Life 0-5 years (37) ! 11-20 years (9)
6-10 years (t l ) ~ 20+ years (4) No open landfill (15)
(b) Licensed Regional Flows of Municipal Waste to Landfills, 1988
Municipios without landfill / Municipios licensed to receive solid waste ~ Flow of waste
Fig. 6. (a) Some 20% of the municipios do not have an operating landfill and illegal dumping is common. A crisis of landfill planning is evident in life expectancies of 10 years or less for 63% of present landfills. Data from Ref. [47]. (b) Contrary to US practice whereby solid waste flows from high to low income areas,
the reverse is true in Puerto Rico. Data from Ref, [47].
1342 John M. Hunter and Sonia I. Arbona
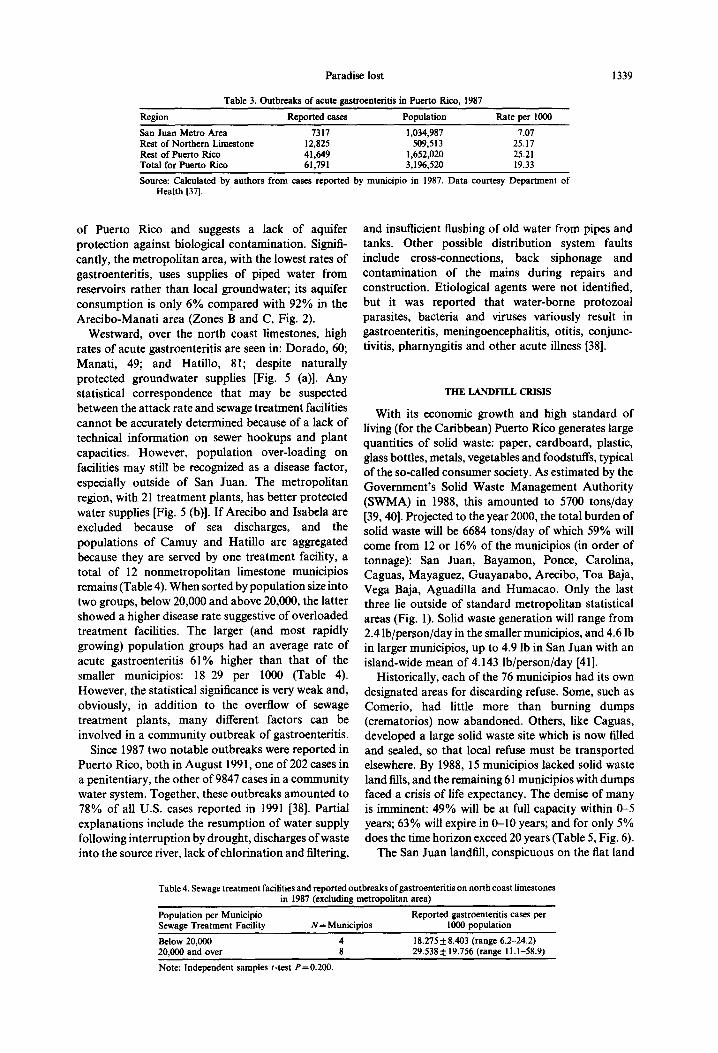
Table 6. Flow of municipal solid waste in 1988 by population-income gradients of 1970 Municipio population Municipios sending landfill in Municipios receiving landfill and income 1988 in 1988
Part 1. Population in 1970 Cases 14 14 Min 7,479 13,033 Max 31,583 107,643 Mean 21,841 52,129 SD 6,767 37,933 Paired samples t-test on receiver pop P= 0.010
Part 2. Median family income $ 1970 Cases 14 14 Min 1,634 1,653 Max 3,569 5,392 Mean 2,435 3,444 SD 530 1,366 Paired samples t-test on receiver income P = 0.003 Source: Authors' calculations based on Census data and Fig. 6 lower.
However, because of the openness of municipal landfills, individual polluter culpability is more difficult to prove.
The problem is compounded by the sheer number of known and suspected sites. The EPA list, which is incomplete, covers 169 sites of which only 47 have been reviewed in some detail [48]. Hypothetically evenly spread, a total of 169 sites would represent 51 km 2 per site, which is interstitially equivalent to one site every 7.2 km (4.5 ml). Such an abundance of sites is a measure of the environmental price ultimately to be paid for 'cheap' industrialization.
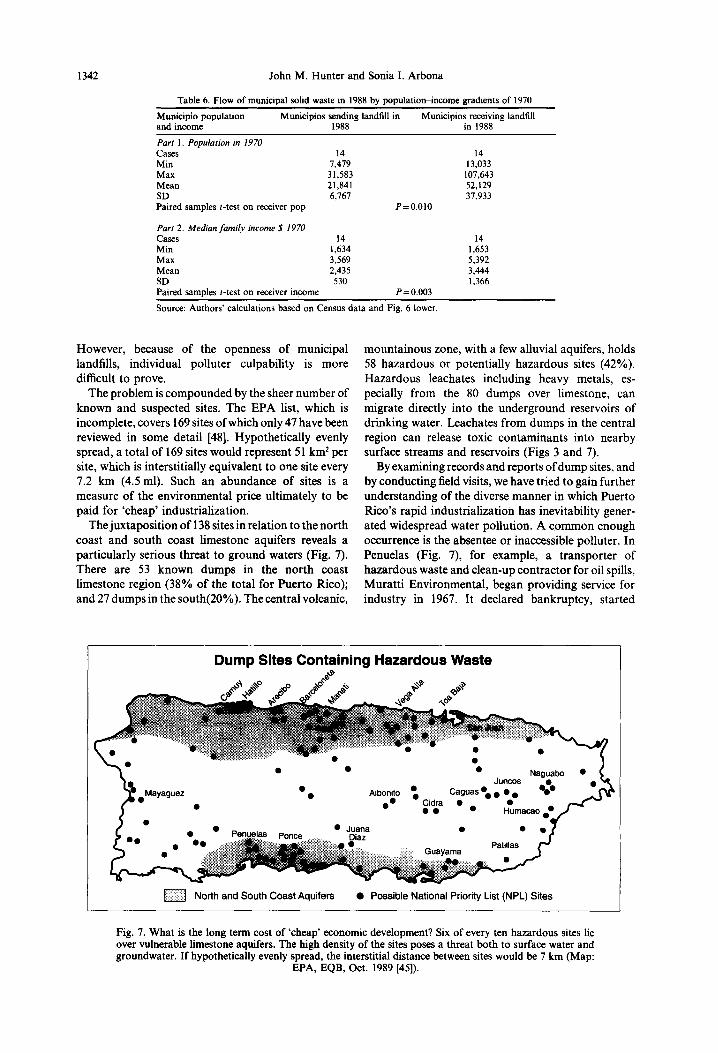
The juxtaposit ion of 138 sites in relation to the nor th coast and south coast limestone aquifers reveals a particularly serious threat to ground waters (Fig. 7). There are 53 known dumps in the nor th coast limestone region (38% of the total for Puerto Rico); and 27 dumps in the south(20%). The central volcanic,
mounta inous zone, with a few alluvial aquifers, holds 58 hazardous or potentially hazardous sites (42%). Hazardous leachates including heavy metals, es- pecially from the 80 dumps over limestone, can migrate directly into the underground reservoirs of drinking water. Leachates from dumps in the central region can release toxic contaminants into nearby surface streams and reservoirs (Figs 3 and 7).
By examining records and reports of dump sites, and by conducting field visits, we have tried to gain further understanding of the diverse manner in which Puerto Rico's rapid industrialization has inevitability gener- ated widespread water pollution. A common enough occurrence is the absentee or inaccessible polluter. In Penuelas (Fig. 7), for example, a transporter of hazardous waste and clean-up contractor for oil spills, Murat t i Environmental , began providing service for industry in 1967. It declared bankruptcy, started
Dump Sites Containing Hazardous Waste
North and South Coast Aquifers • Possible National Priority List (NPL) Sites
Fig. 7. What is the long term cost of 'cheap' economic development? Six of every ten hazardous sites lie over vulnerable limestone aquifers. The high density of the sites poses a threat both to surface water and groundwater. If hypothetically evenly spread, the interstitial distance between sites would be 7 km (Map:
EPA, EQB, Oct. 1989 [45]).
Paradise lost 1343
another company, and left a collection of drums and surface storage tanks full of dangerous chemicals on the abandoned site. The new tenant, a company that steam cleans industrial equipment, cannot meet the costs of removing heavy metals, solvents and organic chemicals left behind [49]. In the same municipio of Penuelas, in a similar situation, companies of the now defunct CORCO petrochemical complex are fighting in court to avoid multimillion dollar clean-up charges [45].
In the town of Juana Diaz (Fig. 7), a now inactive open dump containing mercury, lies 365 m from a public water supply well. The source of the pollution is a company making mercury light switches (parent company: General Electric, CT) [50]. In the municipio of Patillas (population 20,000) a company that is manufacturing electric vehicle controls buried its oily wastes and solvents down a manhole; its toxic sludge beds also periodically overflowed. The town ground- water and surface streams are contaminated by solvents, heavy metals, oily waste, organic chemicals and pesticides [51]. Further east, Frontera Creek in Humacao (Fig. 7) receives industrial waste containing mercury that threatens fin fish, shell fish, and the endangered brown pelican in two connecting lagoons, and at Ciudad Christiana, a settlement of 500 houses [45, 52]. The identified responsible party is a company manufacturing semi-conductors and electronic mod- ules (parent: Revlon, NY).
The municipio of Guayama is extensively polluted (Fig. 7). Four of the town's five stand-by public water supply wells are closed because of halogenated solvents. Industrial effluents were discharged into holding lagoons only 46 m upgradient of the affected Fibers Well Field [53]. Consent orders for remediation have been signed by Phillips Petroleum and Chevron Chemical, who successively operated the industrial site on a lease from the Puerto Rico Development Corporation (PRIDCO) in 1966-- 1976 and 1976-1980, respectively. Other PRIDCO tenants, Whitehall Laboratories and Ayerst Wyeth, have used the site since 1984. They manufacture pharmaceuticals: antihypertensives, analgesics, coronary vasodilators, Advil, Anacin and Dristan [parent: American Home Products (AHP), NYC] [54]. Settling ponds have been converted into a storm water retention basin, but there is a risk of seepage through breeched liners, and AHP has agreed to conduct soil samples. Successive tenants generally add to a site's history of cumulative pollution. Soils on the site contain chromium, zinc, arsenic, copper, lead, nickel, thallium, phenols, PCB, tetrachloroethylene, trichloroethylene and other con- taminants at high levels [53].
Guayama's municipal landfill at Jobos was closed in 1977 after only nine years of operation. The site, which covers 2 ha, is now sealed by 2 m of soil, illuminated at night, and serves as a community baseball field. The Jobos landfill, however, was once extensively used as an industrial and petrochemical waste dump and it remains highly contaminated [45,55]. With a
population of 43,000, the municipio of Guayama serves as a microcosm of Puerto Rico's industrial development. Extensive outside investment has created a total of 19 manufacturing plants. Products include bulk pharmaceuticals (parent company: ICI, London, U.K.), other pharmaceuticals (parent companies: BOC Holding, London; AHP, NYC; Smith Kline, Philadelphia, PA), soaps and detergents (Colgate-Palmolive, NYC), petroleum refining (Phillips, OK) plastic bottles (ALPLA, Austria), aluminum cans (Reynolds, VA), women's dresswear (Champaigne, NYC), brassieres (Bestform, Long Island, NY) and juice concentrates [54]. Unfortu- nately, given the intensity of the industrial constella- tion and the laxity of controls over waste dumping, it is not surprising to discover that the local well-field for drinking water is closed, and that surface streams are contaminated. The pattern is repeated all over the island.
The Jobos dump in Guayama (Fig. 7) lies a little over 1 km from the Caribbean village of Puerto de Jobos (population 800) in Jobos Bay, a popular surfing and fishing area. Migration of contaminants from Jobos into the bay is feared. Furthermore, an industrial spill of mercury at Pozuelo dock in Jobos bay in 1985 has never been cleaned. The pier was ordered closed but mercury contamination of fish is suspected. Since the mercury accident, the area has been illegally used as a garbage dump [45].
The Cidra municipal landfill (Fig. 7) in the central mountains is a repository for both domestic and industrial wastes. Refuse has been dumped into an unlined ravine since 1974 and covered daily by highly permeable material of volcanic origin. Pharmaceutical wastes and illegal chemical waste (e.g. paint thinners) from nearby industrial plants produce hazardous leachates that have contaminated public wells in Barrio Rincon, 2.4 km downstream [56]. Domestic animals have died in the stream below the dump and several fish kills have occurred in La Plata river [57]. A diversionary pumping scheme is in operation pumping 5 mgd from La Plata river into the Lake Cidra reservoir which is depleted and fast losing capacity (Fig. 3). However, the water used for flushing is itself potentially a source of contamination. In the past year, 1990-199 I, several large fish kills have been observed in the reservoir. Oxygen loss through extreme eutrophication, together with high levels of selenium, are implicated [25]. Apart from the landfill, and industrial and pharmaceutical plants upstream, the sewage treatment plant at Cidra town also adds toxic emissions to Lake Cidra.
It is believed that some thousands of mercury- charged thermometers were dumped in the Juncos municipal landfill (Fig. 7). With 1790 mm of rainfall/ year, and a covering of highly permeable local sand, the potential for leachate discharge downstream is considerable [58]. The dump is now closed and a consent order was arranged in 1984 with a surgical and medical instrument manufacturer (parent: Becton

1344 John M. Hunter and Sonia I. Arbona
Dickinson, N J). Owner-built houses are now encroaching on the dump, together with vegetable gardens and clusters of fruit trees. Concern is expressed about elemental mercury contamination of shoes and clothing, especially among children, and methyl mercury vapors. Streams draining the dump are sometimes rainbow-colored [57]. The site remains uncleaned and no epidemiological studies of health effects have been conducted. Some local home owners are reputedly confident that the site is not toxic but residents with whom we spoke complained of smoke and fumes emanating from the long-sealed dump, especially at night, and of the impossibility of finding buyers for their houses. We inspected smoking fissures on the dump and noted too an adjoining 'ghost' town of low-income housing that has never been occupied since construction. Undesir- able, unsaleable and barely habitable properties remain part of the environmental costs of the mercury dumping.
The demise of the first landfill now known as 'Old Juncos' was followed by the opening of 'New Juncos' landfill in Barrio Las Pinas in 1981. Its history, if anything, is even more discouraging. Only 3.2 ha in size, it has faced intensive use by industrial waste removal companies from nearby Caguas. There are serious compliance problems and, after only 10 years, the landfill is rapidly running out of capacity. Heavy metals and volatile and semi-volatile com- pounds are migrating offsite. Several herds of cattle graze in the area drinking from puddles of muddy water and their milk may be contaminated. In one incident 15 cows suddenly died, and cyanide was indicated [57, 59]. Toxic dumps, lying within the catchment areas, raise concern for the quality of San Juan's reservoirs, Lake Loiza and Lake Cidra (Figs 3 and 7).
In Aibonito, in the heart of the central mountains, both household garbage and pharmaceutical wastes are exposed on the surface and on the working faces of the municipal landfill (Fig. 7). Pressure on the small dump (2.4 ha) comes from a municipio population of 26,000 and a cluster of 10 manufacturing plants producing yarns, military uniforms, robes, night- gowns, pillows, electrical and medical plastic equipment [54]. Parent companies are headquartered in Illinois, Pennsylvania and New York City. One major industry throughout the Aibonito valley is poultry raising by farmers contracted with a large-scale processing plant, To-Ricos (parent: Conagra, Omaha, NE) [54]. The farms discharge high levels of nitrate-rich animal waste, whilst the main processing plant has been cited for heavy metals discharge [60]. Carcinogenic polycyclic hydrocarbons are found in streams around Aibonito dump. Typical of the landfill crisis, the municipio has never obtained a permit to operate the dump; it has many operational deficiencies and was issued five 'show cause' orders in a period of four months [61]. Environmentally sound resolution is still awaited.
ABUSE OF THE NORTH COAST LIMESTONES
Because of San Juan's sheltered harbor, and the historical accident of Spanish colonial history in locating Puerto Rico's capital, the die was inexorably cast for subsequent abuse of the north coast aquifers. The successful industrialization of greater San Juan, beginning in the 1950s, led in turn to considerable overspill growth in small towns of rural municipios elsewhere in the island; and notwithstanding the vulnerability of the limestone aquifer, the 23 municipios of the north coast have shared fully in this process. In fact, the north coast limestone region, which occupies 20% of the island's surface area, holds 48% of its total population and 55% of the manufacturing plants (Table 7, Part 1) [54].
As previously noted, the northern limestone aquifers supply 75 mgd (Fig. 2). Their quality and abundance were part of the initial attraction for industrial corporations locating in Puerto Rico, but today, as a result of industrial growth, the aquifers suffer extensively from industrial discharges, pollution by landfills, pumping stress, dewatering and drainage, and saltwater encroachment (Fig. 8) [8]. Drainage for rice farming has reversed the hydraulic gradient with the ocean, seawater enters the aquifers, and sodium chloride accumulates in the soil. This compounds the soil shrinkage and land subsidence which follow soil dessication by drainage [62].
With progressive contamination, the once-safe public supply wells tapping the northern aquifers are now being closed in order to protect human health. When one well is 'condemned', a replacement well is sunk nearby, but the supply of potential new sites is not inexhaustible; and subterranean migration of contaminants, although poorly understood, contin- ues. Analysis of well closings thus provides a sensitive indicator of environmental maladjustment. By collating USGS data [63], we can see that 111 of 273 (or 41%) had been closed by 1987 [Fig. 9 (a)]. Of course, more wells have been closed since, but the prevailing geographical pattern is clear: in the metropolitan quadrangles (of Bayamon, San Juan and Carolina) 73% of the public supply wells are closed compared with 29 % closure in the middle quadrangles (Vega Alta, Manati and Barceloneta) and 20% in the west (Fig. 9). Dependence on groundwater, as indicated earlier, is down to 6% in the metropolitan area compared with 92% in the central region despite well closings (Fig. 2).
Pollution causes well closings but the process is driven by increasing population, urbanization and industrialization. Statistical parameters by quadran- gles are only approximate but show clearly that total population and the total number of manufacturers are positively correlated with well closings over the limestone: population R = 0.771, P = 0.003; manufac- turers R=0.773, P=0.003 [Fig. 9 (b)]. The two variables are closely inter-related and either predicts environmental pressures.

Paradise lost 1345
Table 7. Population and manufacturing plants in Puerto Rico with reference to North Coast Limestone Aquifers, 1989-1990
Part I regions North Coast
Total Puerto R i c o Limestone % Rest of Puerto Rico %
Area km: 8860 1813 20 7047 80 Municipio N= 76 23 30 53 70 Population 1990 3,599,258 1,734,157 48 1,865,101 52 Mfrg Plants 1989 N= 1,739 954 55 785 45
Part 2 selected industries Manufacturing plants
Selected industries Total Puerto Rico North Limestone %
Primary metals and fabrications 141 104 74
Plastics and rubber 94 52 55 Electronic equipment 117 57 49 Pharmaceuticals 72 36 50 Chemicals 69 38 55 Total 493 287 58
Part 3 San Juan Metro Area 1989 Mfrg plants
Limestone area Municipios Pop. 1990 % N = %
SMSA--San Juan 8 1,133,902 65 692 73 Rest of limestone 15 600,255 35 262 27
Total north coast 23 1,734,157 100% 954 100
Notes: 1, Numbers of plants from: Puerto Rico Government: Ref.[54]; 2, region statistically approximated by whole municipio; 3, Trujillo Alto in SMSA but excluded here because not on limestone; 4, N= 23 municipios principally located on north coast limestone: Aguadilla, Arecibo, Barceloneta, Bayamon, Camuy, Canovanas, Carolina, Catano, Dorado, Florida, Guaynabo, Hatillo, lsabela, Loiza, Manati, Moca, Quebradillas, Rio Grande, San Juan, San Sebastian, Toa Baja, Vega Alta, Vega Baja.
Evidence points to unrestricted use of the limestone area for industrial sites. A total of 954 manufacturing plants are located on the northern aquifers, of which 73 % are to be found in the metropol i tan area (Table 7, Part 3). Among selected categories of manufacturing, the northern limestone region predominates in primary metals and fabrications (with 74% of the Puerto Rican total), chemicals (55%), plastics and rubber (55%), electronic equipment (49%) and pharmaceuticals (50%) (Table 7, Part 2).
A tendency can be recognized for the older industries to be clustered in the metropoli tan area, with younger industries selecting newer sites in the west (Fig. 10). Thus, areas west o f the metropoli tan region hold only 9% of the 104 metals and metal fabrication plants, in contrast with 21% of the 52 plastics and rubber manufacturing plants. Electronics, an even newer category, is 44% concentrated in the
west, However, in the modern growth area of pharmaceuticals, 67% of 36 plants are located at newer sites in the western municipios (Fig. 10).
Indeed, there is a remarkable concentrat ion o f 26 pharmaceutical manufacturing plants over a linear distance of about 15 km (9ml) in the adjoining municipios of Manati and Barceloneta. The wide range of parent companies illustrates Puerto Rico's success in attracting investment. Five of the company headquarters are located in New Jersey and three in New York City; others are found in Illinois, Delaware, Ohio, Pennsylvania, Michigan, Nor th Carolina and Switzerland. Plants in Barceloneta include Abbott , Bristol Myers, Merck Sharp and Dohme, Pfizer and Sterling. Those in Manati include Schering, Dupont , American Cyanamid, Proctor and Gamble, Johnson and Johnson, Rorer, Upjohn and Hoffman-Laroche.
Whilst the concentration in Manati-Barceloneta is
Environmental Threats to North Coast Aquifer
gao
Soltwat . . . . . . . . chment into aquifer [~ Pumping st . . . . ~ Limesf . . . . quifer
, ~ Major dewatoring drainage projects ( ~ Municipal landfill
Fig. 8. Drainage for rice farming causes soil salination and seawater encroachment into the aquifers. Pumping stress, industrial discharges, landfills, and raw sewage present a combined threat to ground water
quality. After Ref. [8].

1346 John M. Hunter and Sonia I. Arbona
(a) Well Closings on North Coast Limestone Aquifer
~ ~ ~ ~ i i i : ~ : : ~ ; i : : i i ~ : : : ~i ., ...... ~ i /~~'~ ~ ~ ~ q~:e¢" 't'~l
(b) Numbers indicate wel ls over l imestone in the two quadrangles directly above.
Y = 2 2 . 1 8 7 X - 2 1 0 . 9 2 9 Y = 19.558X - 30.494
o o
/ o
R = .771 P = .003 R = .773 P = .003
1~) 1~1 1~ 1'3 14 2 3 4 log pop. log mfrs.
Fig. 9. Contamination has forced the closing of 111 or 41% of the wells, and closure rises to 73% in the metropolitan quadrangles. Regression diagrams (lower) show that population pressure or industrialization
equally lead to well closings. Authors' calculations from Refs [54,63].
geographically unique in Puerto Rico, other inter- national companies manufacture pharmaceuticals in a wide scatter of municipios across the island in Humacao (Nestle, Switzerland; Sandoz, Switzerland; Squibb, N J), Carolina (Eli Lilly, IN; Imperial Chemicals, U.K.), Ponce (Boehringer, Germany), Jajuya (Boots, U.K.), Santa Isabel (Rotho, Japan), Caguas (Monsanto, MO), Fajardo (Warner Lambert, N J) and Hormigueros (Smithkline Beckman, PA). Some of the companies have constructed multiple plants.
The mere presence of almost 1000 manufacturing plants, together with employee housing and service establishments, generates a great threat to the groundwaters of the north coast (Table 7, Part 1; Fig. 10). Safe disposal of chemical waste is critically important but, as we have seen in the history of well closing, all trends fatefully lead towards increasing contamination.
NORTHERN L I M E S T O N E SINK H O L E S AS P O L L U T I O N CONDUITS
We now turn to limestone permeability, sink holes and water pollution. The sink hole, a vertical solution pipe in limestone, commonly 30-50 m deep along the north coast, is widely used for garbage disposal, both officially by municipio landfill authorities and by private clandestine dumpers. Barceloneta municipal landfill is a spectacular example (Fig. 8). Covering 8 ha in Florida Afuera, the site is underlain by limestone, and has long accepted both industrial and municipal
waste [64]. Mixed including toxic waste is placed in sink holes which are about 30 m deep. Rainfall is 1780 ram/year, the depth to the water table is 90 m, and the underlying geology promotes rapid transport of contaminants. Consequently, the aquifers, which are used as the prime source for public drinking water, are continuously contaminated.
Holding lagoons for industrial-waste are also less effective over limestone because of solubility. In the case of one company that manufactures aperture masks for television tubes in Barceloneta (RCA del Caribe), its four lagoons holding chemical waste spontaneously drained down into the aquifers [65]. Ruptured lining, with leaks or acid discharges, caused the sudden formation of a sink hole. Public supply wells are located 2.4 km downgradient from the condemned site. With regard to remediation by the responsible party (General Electric, Plainville, CT), the EPA reports that "many issues remain unre- solved."
In the same category of industrial accidents, on-site holding tanks built on permeable strata also pose an environmental risk. The Upjohn Barceloneta plant (in Barrio Sabana Hoyos, Arecibo) which manufactures antibiotics was the scene of a major toxic spill in September 1982 when 57,0001 seeped into the soil and groundwater. The mixture was 65% carbon tetrachlo- ride and 35% acetonitrile [66]. Pollution plumes for carbon tetrachloride have subsequently been defined at 50 ppb, 20 ppb and 1 ppb in the aquifers around the site. A nearby public water supply well was forced to close. Under a consent decree, Upjohn has undertaken

Paradise lost 1347
extensive remedial measures including vacuum extraction wells to remove the contamination, and the provision of new, safe, public water (PRASA) connections for Garrochales, the local community, for a neighboring motel and also for an adjoining pharmaceutical manufacturing plant whose water supply had been lost.
Given the existence of a large industrial complex over the limestones, there are no easy solutions for waste disposal. The Arecibo waste disposal site, covering 39 ha in Barrio Factor, has continuously received mixed residential, industrial, commercial and
agricultural solid waste since the mid-1970s. These include metallic sludge, pharmaceutical sludge, toxics, corrosives and sewage [67]. The dump lies 3 km from the ocean on the edge of the coastal marshes or wetlands of Cienaga Tiburones ('Shark Swamp'). Its permeable sandy soils cannot consolidate the daily waste consignments, and strong sea breezes widely scatter lighter waste materials. Management problems aside, solvents and heavy metals are detectable in local surface waters which are presently used for both cattle and irrigation.
In the same municipio, on-site wells of a Puerto Rico
M a n u f a c t u r i n g P lan ts on Nor th C o a s t L i m e s t o n e Aqui fe r , 1989 Southern boundary north coast aquifer
San Juan SMSA
(a) Primary Metal Industry and Fabrication N = 104 plants
(b) Plastic and Rubber Manufacturing N = 52 plants
(c) Electronic Equipment Manufacturing N = 57 plants
Pharmaceuticals and Industrial Chemicals ( d ) N = 83 plants
2 A~c,.o
R~,a l
Fig. 10. Nearly 1000 manufacturing plants are located on north coast limestones. Of the five industrial categories shown here, the older plants (metals and fabrications) lie in the east, while newer plants (pharmaceuticals) are located to the west. Manati and Barceloneta show a remarkable concentration of 26
internationally owned pharmaceutical plants in a small area. Data from Ref. [54].
S S M 4 0 / 1 0 ~ C

1348 John M. Hunter and Sonia I. Arbona
Industrial Development Corporation (PRIDCO) property show vinyl chloride, TCE and other solvents. The current PRIDCO tenant, Hooker Chemical and Plastics, manufacturers of phthalic anhydride, deny responsibility because of prior, multiple, successive site occupancies by other tenants. The question of who pays for site remediation is disputed [68].
Nonindustrial rural landuse can also threaten ground water quality. In the Cambalache National Forest, Arecibo, treatment of harvested wooden posts with preservatives and hardeners has contaminated soils and ground water with pentachlorophenol, ethylbenzenes and other chemicals, in scattered hazardous sites [69]. Similar lumber treatment in Barrio Candelaria, ofToa Baja, also affects the ground water. Pressurized 'wolmanizing' tanks of the Boricua wood processing plant, using chromic acid, cupric acid and arsenic pentoxide since 1957, generate over two tons of toxic sludge per year [70]. This dangerous site borders upon an urban area.
Manufacturers along the north coast variously discharge pollutants by fugitive air emissions, stack or point air emissions, releases into water, underground injection, or dumping on land. Air releases are predominant but numerous chemical and pharmaceu- tical plants with permission legally discharge amounts of toxic waste by underground injection into the limestone aquifers. Examples include:
(1) a paint manufacturing company (Harris Paints) in Bayamon that releases ethylene glycol, toluene, xylene, cobalt and ammonia by underground injection;
(2) a veterinary product company (American Cyanamid) in Manati releasing aniline, toluene, hydrochloric acid, phosphoric acid and sulfuric acid by underground injection; and
(3) a pharmaceuticals manufacturing plant (Merck Sharp and Dohme) in Barceloneta that releases cyanide compounds, nickel compounds, methanol, acetone, chloromethane, dichloromethane, toluene, chlorobenzene, cyclohexane, hydrochloric acid, am- monia, sulfuric acid and ammonium sulfate [71].
The volumes of discharge are said to be small, and many of the compounds are volatile or semi-volatile but, even with stringent regulations faithfully observed, a cumulative impact upon ground water quality can be expected.
The process of continuing industrialization in- evitably dictates advancing contamination, particu- larly where individual polluter responsibilities are overlapping and ambiguous. A case in point is nitrate pollution of the Manati-area well field [23, 72, 73]. In 1989 three public water supply wells were ordered closed by the Department of Health, and indeed the whole 20-well field is thought to be in jeopardy (Wells 18-20, Fig. 11). Two substitute wells have been opened, but they do not wholly replace the lost water supplies so that relative scarcity of water in the barrios has increased. Altogether 13 of the 20 wells exceed a
nitrate contamination level of 5 mg/l and, among these, 8 wells lie on or exceed the official human health threshold level of 10 mg/l NOr-N that should trigger closure of drinking water wells. The peak level of 16.2 mg/l was found at the Land Authority Almacen well (No. 11) next to a fertilizer depot (Fig. 11). Nitrates are feared because they can metabolize in the gastrointestinal tract to produce nitrites giving hemoglobin disorders including the blue-baby syn- drome; and stomach cancer is suspected.
The primary source of nitrate pollution is thought to be potassium nitrate fertilizer applications to pineapple fields owned by the Puerto Rico Lands Authority. This commercially successful venture is supported by extension services for mechanical assistance and the distribution of fertilizers, pesticides and herbicides (indicated on Fig. l l). The local producing area, which covers 650 ha, has been intensively cultivated for the past 50 years, necessitat- ing 3500 tons of fertilizer applications every 26-28 months. With more than 200 sinkholes in the area, the fertilizer run-off is directly channelled underground, hence the nitrate problem and well closings. The La Roche corporation, which produces tranquillizers, unwittingly contributed to the nitrate problem by applying two tons of fertilizer to further beautify its verdant 26 ha plant site (well 7).
Another element seen on the nitrate map is the influence of local periurban communities that either lack sewer pipes, or they are served by inefficient overflowing septic tanks, or merely by outhouses, for example, Parcelo Marquez, El Polvorin and Combate (Fig. 11). Run-off to the sink holes also transports sewage to the water table from these low-income suburban settlements. Radioisotope probes (N-14 and N-15) reveal that, in at least one well, nitrogen pollution is of fecal origin (Well 18). Three of the industrial wells (Wells 8,9 10, Fig. 11) have high nitrate levels. These are inimicable to pharmaceutical production and, ironically, it was complaints from the manufacturers (Eaton, Ortho and Owens) to the water authority that first exposed the public health problem.
The threat to limestone ground waters is multidi- mensional: it includes pesticides, herbicides, fertilizers, fecal and, undoubtedly, industrial pollution, including semi-volatile organics and heavy metals. Careful monitoring within the framework of a comprehensive plan is needed to manage the well field as a safe source of drinking water. The Manati aquifer provides a clear example of the problem and its dynamics. The mixture of industries and agricultural land use over vulnerable limestones will result in continuing deterioration of the aquifer.
GROUND WATER QUALITY AS A BAROMETER OF ENVIRONMENTAL HEALTH
The purity of ground-water, possibly the last bastion of the uncorrupted environment, has long been held as sacrosanct. Having discussed above the

Paradise lost 1349
Nitrate Contamination of Limestone Aquifers at Manati
• 1 h |
] 1( e
/
" ° a:c !o i • L / I s Marouez I ........ :~
A e r /w 670 !!~i ~::i~':" :~ ~i ~:!~ i:
6 t 118 ¢" * 20 ................... Combate
~ , ° m ea e Hwy 670 Palo > c
• 12 Alto P i " ~ P l o | o /
I e o
° I ° • Well Polvorin "* ~ o nitrate 1-4 rag/liter -I , / • Well nitrate 5-7 rag/liter ~ . Well nitrate 8-16 mg/liter ~ ~i~ ~ '~
Community lacking sewerage
• Illegal clump . _.
"~ ~ ~ ' one kilometer ' Land Authority fertilizer and pesticide warehouse • Land Authority mechanical support unit
Private Industrial Wells: (1) Dupont 4, 1.1 mgL; (2) Davis & Geck 2, 1.1 mgk; (3) Davis & Geck 1, 1.2 mgk; (4) Schering 1, 2.1 mgL; (5) Schering 2, 2.5 mgL; (6) LaRoche 2, 1.7 mgL; (7) LaRoche 1, 6.7 mgL; (8) Eaton, 9.2 mgL; (9) Ortho, 9.8 mgL; (10) Owens, 8.7 mgL. Land Authority Well: (11) Almacen, 16.2 mgL. Public Water Supply Wells: (12) Vocacional 2.1 mgL; (13) Coto Norte 3, 6.5 mgL; (14) Sobrino, 6.3 mgL; (15) Coto Sur 1, 11.3 mgL; (16) Coto Sur 6, 6.5 mgL; (17) Coto Sur 5, 7.3 mgL; (18) Coto Sur 3, 10.1 mgL; (19) Coto Sur 2, 12.8 mgL; (20) Pugnado 3, 11.0 mgL.
Fig. 11. High-yield pineapple production, an economically successful enterprise, requires heavy applications of fertilizers which are associated with nitrate contamination of well water. Fecal nitrogen contamination is also involved at Parcelo Marquez. Three wells are on the toxic threshold (8,9,10) and five wells exceed drinking water standards for nitrate (! 1, 15, 18, 19, 20). The 20-well field in the limestone aquifers is in
jeopardy. Data from Refs [72,73], and field visits.
broad geographical features of environmental pol- lution, we now report briefly on official assessments of ground water quality in Puerto Rico. To what extent is the history of urbanization and industrialization leaving a mark on ground-water?
A USGS reconnaissance survey of September- October 1981, sampled 57 wells and springs across the island, and found several problems including:
(1) high salinity in coastal aquifers; (2) the presence of bacteria in wells and springs; and (3) contamination with trace organic compounds
[74].
About 95 % of the tested 26 northern wells exceeded drinking water standards for chloride (0.3 mg/1) and sodium (20 rag/l). High salinity is a problem in ground water throughout the island. Chloride and sodium levels peaked at 1200 mg/1 and 620 mg/l respectively in
a north coast well in Hatillo. Salination from irrigation practices and sea water incursion, due to overpumping and drainage operations, are major influences. About one third of the sampled wells and springs were positive for fecal coliform bacteria, indicative of fecal contamination. Therefore domestic waste infiltrates or is directly discharged into the aquifers and migrates into areas tapped by the public supply wells.
Detection of trace organics indicates serious contamination of the aquifers. Standards for phenol (1 mcg/1) were exceeded at 13 of the 57 test sites (23%). One well in Barceloneta contained base neutral extracts of Furan, Diazinon and Diethyl phthalate-- the latter being a designated priority pollutant. A second well in Barceloneta was contaminated by organochlorinated and organophosphorus pesticides, polychlorinated biphenyls (PCBs), polychlorinated naphtalenes (PCNs), DDD, DDT, Dieldrin and

1350 John M. Hunter and Sonia I. Arbona
Toxaphene. Pollutant levels ranged from 600 to 10,000 times above the standard.
In 1982-83 a follow-up study was made that focused upon the 17 principal springs of Puerto Rico [75]. Assays were made of common ions and trace elements. Three springs were discovered to have lead (Pb) levels of 10-20 /~g/l. Fourteen springs (82%) showed the presence of phosphates (as P: peak.05 rag/l) and 11 or 65% showed nitrogen (as N: peak 5.9 rag/l). The image of the crystal-pure mountain spring was further tarnished by the presence of fecal coliform bacteria at 94% of the sites. Only one site did not exceed the standard of one colony per 100 ml raw water. Indeed 13 or 76% of the springs exceeded 100 colonies. The worst polluted sites were Pozo de la Virgen, Rio Guanajibo near Sabana Grande (1900 colonies) and Aguas Frias, Rio Grande de Manati, near Ciales (1800 colonies). Springs are an important water resource and can be used to supplement surface and well supplies. Aguas Frias, for example, discharges 6-7 mgd, and several other springs discharge 4-7 mgd. Contami- nation of these sources by fecal coliform bacteria and fecal streptococci should be a matter of concern.
Further surveys of ground water quality were conducted at 59 wells and springs in 1982-1983 [76]. At each of eight wells in Dorado, Vega Alta, Vega Baja, Barceloneta, Ponce and Guayama, in June-July 1982, concentrations were found of several trace- organic compounds designated as 'priority pollutants' (i.e. recognized as harmful): benzene, dieldrin, lindane, methylene chloride, trichloroethylene, 1,2-trans- dichloroethylene and 2-ethylhexylphthalate. One well in Vega Alta revealed a level of 480 meg/1 of trichloroethylene; that is 96 times above the permissible standard. Re-testing of these and other wells in the two municipios of Arecibo and Santa Isabel, a total of 17 wells in 1983, revealed ubiquitous pollution by nine trace-organic compounds. Labora- tory analyses detected 109 organic compounds in the ground water of which 76 or 70% were classified as priority pollutants.
Puerto Rico's ground waters are no longer inviolate. An immediate follow-up study of 90 wells in October 1983 confirmed the growing evidence [77]. Methylene chloride an industrial solvent, was found in 17 of the 90 tested wells (19%) and halogenated volatile organic compounds were present in 15 of the wells (17%). Two halogenated volatiles, TCE and PCE, used as solvents in metals and electronics industries, were present in very high concentrations. A total of 9 6 0 of the 51 sampled wells on the north coast limestones showed the presence of both TCE trichloroethylene and PCE [tetrachloroethylene]: 22% of the wells exceeded the promulgated standard of 5 meg/1 for TCE and 8% exceeded the same standard for PCE. At the worst wells, the level was 92 meg/1 or 18 times above the standard for TCE, and 17 meg/1 or 3.4 times above the standard for PCE.
The history of the public water supply well field of Vega Alta exemplifies the process of aquifer
contamination. Light manufacturing was introduced 30 years ago when PRIDCO opened an industrial estate on a site formerly occupied by tomato fields. Tenant manufacturing companies were quickly attracted, and many new employment opportunities were created. The field of 15 wells, situated over the limestones, supplied 5 mgd to Vega Alta and the surrounding communities. But in 1983 trace-organic compounds were found in all eight tested wells in Vega Alta [76]. Some contaminants, including TCE, were found at extremely high levels, and the area was placed on the national priority pollution list (NPL).
Potential sources of aquifer pollution are the municipal landfill, the sewage treatment plant and the PRIDCO industrial estate, all lying 1.2-1.4 km of each other. Altogether, there are 25 manufacturing plants in the area. By 1990, identified responsible parties were listed by EPA as:
(1) General Electric, magnet contractor (Plainville, CT);
(2) West, plastic containers for pharmaceuticals (Phoenixville, PA);
(3) Motorola, radio communications (Schaumburg, IL);
(4) Harman, remote control mirrors (Harvard Industries, Farmingdale, N J); and
(5) Teledyne, metal tubes (Century City LA, CA) [78, 79].
In the Vega Alta quadrangle, 11 of 40 wells are closed (Fig. 9). There is one group of closings along highway 693 near the coast and the second is in Vega Alta town, in and around the industrial estate. Inordinate time, cost, and technical effort will have to be expended if the aquifers are to be cleansed and rehabilitated [80]. Aquifer cleansing and the rate of restoration of clean groundwaters will serve as a barometer of Puerto Rico's success in maintaining good environmental health.
THE ADVANCING TIDE OF POLLUTION
Because of its historical linkages and the successful program of industrialization, the Commonwealth of Puerto Rico has risen to levels of consumerism not unlike those found in the United States [81]. Even acknowledging the difficulty of statistical compari- sons, it is realistic to recognize Puerto Rico's industrial life-style as 'advanced western'.
A key attribute is the generation of waste. Using official per capita estimates of waste production and census population figures, we calculate that 6657 to 7231 tons of solid waste are produced daily, of which only 5700 tons are sent daily to the landfills (see 'landfills' above). Thus we conclude that there is a balance of 960-1530 daily additional tons that do not reach the municipal landfills [41, 46]. Illegal dumping, burning or storing may thus amount to 14-21% of all generated waste. This rough estimate would not be dissonant with our reconnaissance impressions of

Paradise lost 1351
rural backroads, and ravines around towns, which are used as ad hoc 'cost-free' opportunistic dump sites.
The accumulation of solid waste is predominantly urban-generated. Approximately 50% comes from seven areas: San Juan 978 tons per day, Bayamon 442, Ponce 425, Carolina 373, Caguas 265, Mayaguez 216 and Arecibo 125 [39]. Projections for the year 2000 show a similar concentration [41].
In comparison, toxic waste generation is very widely scattered. Among 526 toxic waste 'generators,' listed by the Environmental Quality Board, only 38% come from the leading seven areas: San Juan 48; Carolina 34; Bayamon 30; Ponce 29; Arecibo 20; Humacao 20; and Mayaguez 20 [39]. The balance of 62% of the toxic waste generators come from 91% of the municipios. This reflects the widespread geographical scatterings of small industrial plants across the island. Differences between plant locations and urban locations are remediated by the journey to work which has become a major feature of Puerto Rican life. The mule and mule-track have been totally replaced by the automobile and narrow asphalt road. Residential, industrial and commuter patterns are complexly inter-related.
Nonpoint sources of pollution are an overlooked but potent force in urban and suburban areas. There are myriad discharges, legal and illegal, including industrial and household releases. Often these are individual acts at a minor scale, such as groups of young men driving their cars into mountain streams to wash them down with detergents, a Sunday ritual, or emptying sump oil down a storm drain. An EPA list of 868 'toxic discharges' into streams revealed that 72% were industrial in origin and 28% were municipal [60]. The EQB estimated that in 1988 some 397 tons of toxic waste were discharged to streams and surface waters in Puerto Rico whereas sewers, theoretically the community safety valve, received 5265 tons of toxic waste, a difference of magnitude of 13 [23]. Sewage treatment plant effluents are a major source of toxic pollution, and thus the management system itself is, in a sense, an enemy.
Surface water quality best synthesizes the dilemma of pollution in Puerto Rico. The present status of rivers is that 51% by length are moderately to severely
contaminated and that 49% are inadvisable for fishing and swimming (Table 8) [72]. For lakes and lagoons, 68%, by surface area, are moderately to severely polluted. Estuaries are worse: 84% (by length) are contaminated and 64% inadvisable for swimming. Even the coastline does not escape advancing pollution: 33% is estimated to be moderately to severely polluted, 27% is inadvisable for fishing and 45% inadvisable for swimming (Table 8).
Toxic pollution now occurs in a number of lakes and reservoirs, even those found in distant rural areas. 'Priority pollutants', particularly organic compounds, are major contaminants [72]. Four lake reservoirs are limited by high phosphorus concentrations. They are Dos Bocas, Carite, Guajataca and Las Garzas (Fig. 3). Two reservoirs, La Plata and Loiza, both major suppliers of drinking water to metropolitan San Juan, are limited by high concentrations of nitrogen.
Reviewing the island as a whole, 12 of 18 monitored lakes are eutrophic (i.e. phosphorus exceeds 0.05 rag/l), 8 of 18 have low levels of dissolved oxygen (below 5 rag/l), and all 12 of 12 monitored lakes show traces of mercury (mean 0.23 meg/1 compared with the standard of 1.0 meg/l) [72]. Discharges from poultry and livestock enterprises, crop production areas, landfills, sewage treatment plants and urban combined sewers progressively diminish the viability of these reservoirs. Organic enrichment, pesticides, heavy metals and other contaminants from seepages, discharges and leachates collectively threaten the life-supporting water supplies.
FISH KILLS
Sudden death of large numbers of fish, known as 'fish kills' (e.g. La Plata reservoir, mentioned above), provide a sensitive biological indicator of environmen- tal quality. The causes may include natural temperature and salinity changes, and bacterial or viral epidemics. To these we must add the loss of water viability due to agricultural activities, and discharges from industrial and municipal sewers. The phenom- enon is becoming more common in Puerto Rico. One example is a fish kill in Adjuntas (Fig. 1) on Lake
Table 8. Contamination of surface water bodies of Puerto Rico, 1988-89
Level of contamination % of river length % of lake and lagoon area % of estuary length % of coastline
Minimum 38 31 8 58 Beginning threat 11 1 8 9 Moderate 23 32 57 17 Severe 28 36 27 16
100% 100% 100% 100% Total assessed 8645 km 4511 ha 284 km 698 km Evaluated 6907 km 811 ha 274 km 493 km Monitored 1738 km 3630 ha 10 km 205 km
Inadvisable for: Fishing 49% 32% 46% 27% Swimming 49% 39% 64% 45%
Notes: 1, Source: Collated from Environmental Quality Board [72]. 2, Level of contamination expressed as degree of use-support for goals of Clean Water Act (CWA): fully supporting goal, goal threatened, partially supporting goal, and not supporting goal. 3, Inadvisable indicates: not attaining CWA goal.

1352 John M. Hunter and Sonia I. Arbona
Guayo (Fig. 3) on 28 May 1989, caused by a reduction of dissolved oxygen (DO). The lake was founi:l to have a level of 2.5 mg/l DO compared with normal levels of 5.0 mg/l DO. The fish were killed by nutrient-rich waste water discharges from a nearby commercial poultry farm [72]. In another illustrative case, a fish kill on the Cano Santiago, 27 April 1989, was traced to discharges from the Yabucoa (Fig. 1) municipal sewage treatment plant [72]. On the same day, a fish kill of major proportions occurred in the San Jose lagoon of San Juan. Community wastewater dis- charges, including those into the Martin Pena channel, combined with natural conditions to produce a lethal blue-green algae bloom (Phylum cyanophyta, species anobaena). Many shell fish also died [72].
The question as to who is responsible for a toxic incident may not be pursued because of preoccupation with sectoral responsibilities. For example, on about 19 March 1990, large numbers of dead shrimp began to appear in the Culebrinas river at San Sebastian (Fig. 1). A pesticide, Aldicarb, used to kill nematodes on nearby plantain, coffee and cattle farms, was suspected. (This pesticide is derived from methyliso- cyamate, the agent of the Bhopal disaster of 2 December 1984.) San Sebastian's water filtration plant was closed as a safety measure, and a population of 50,000 had to be supplied by water trucks for several days. After the resumption of water services, no investigations of culpability were conducted. The Water Authority limited itself to the "operational phase of water distribution" and claimed "we do not have the time (for) follow up". Referral, it claimed, should be made to the Department of Health. The latter, however, considered that the Assistant Secretary for Environmental Health was the respon- sible investigatory agent. In turn, the Secretary declined to clarify the situation. Furthermore, by the time that the water samples reached the referral laboratory in Savannah, Georgia, all traces of volatile contaminants had disappeared [82].
Toxic industrial waste presents the greatest pollution threat to human health, yet little is known on the parameters of the problem. The Solid Waste Authority planning report states that "there is no published source of data on the generation of hazardous waste in Puerto Rico" [41]. An inspection of biennial report forms, prepared under the Resource Conservation and Recovery Act, showed a list of 74 large quantity generators producing a total of 540,000 tons of toxic waste [83]. However, it is believed that these manifests seriously under-report the magnitude of hazardous waste production.
For treatment, disposal and recycling of toxic waste (TDR), there are only three licensed facilities on the island. The first is Proteco, a 14 ha site, in Barrio Tallaboa, 15 km west of Ponce near Penuelas (Fig. 1). It is now closed as a TDR facility by Federal Court Order as a 'superfund' hazardous site, but is permitted to continue with limited functions, such as nontoxic waste storage on an adjoining clean site; and it
continues to ship toxic waste overseas. The condemned site holds 900 drums of toxic metals, sludges and solvents among which 40% are laboratory waste ('lab packs') [41, 84]. The second TDR facility, Safety Clean Environmental Systems occupies a 5 ha site in Manati (Fig. 1). It is licensed to store only solvents and to process raw materials for shipment to San Juan Cement Inc. It processes 48 million lb of fuel oil and solvents annually: recycling 48% and using the balance of 52% in fuel blending. The third TDR facility, Safety Kleen of Dorado (Fig. 1) operates an energy resources recovery program, receiving sludge solids from Manati for incineration at the industrial kilns of San Juan Cement Inc. Some 15,000 ton of pharmaceutical waste are thermally treated per year [41].
Thus there is no licensed toxic waste storage facility operating at present in Puerto Rico. An unknown proportion of the island's toxic waste is exported to the United States. This is informally suggested to be 40%, with the remainder staying on the island. Export to the U.S., mostly to South Carolina, is opposed by environmental activists in both areas, by the S.C. Wildlife Federation and the P.R. Society for Natural History [44]. In the meantime, illegal dumping of toxic wastes in municipal land fills continues. The question becomes one of public awareness and political will. When and how will the advancing tide of environmen- tal pollution be checked?
THE FUTURE
Throughout the industrial United States, water supplies are becoming increasingly polluted, yet water treatment techniques still primarily reflect concern with infectious diseases of the past rather than toxic pollution of the environment today [85]. Even two decades after passage of the Safe Drinking Water Act (1974), the spectrum of toxic chemicals in public water is broadening and hazards have increased rather than diminished.
We do not argue that the particular situation in Puerto Rico, although serious, is necessarily worse than situations found in many areas of the United States [86]. What we offer is a demonstration of the various circumstances that can combine to reduce the quality of the public water supply. The special features of Puerto Rico reflect the rapid economic development of a small tropical island, overcrowded, and dependent upon groundwater. In the outcome, the very success of the island's policy of industrialization has gravely diminished the supply of clean public water. The economic growth itself, followed by infrastructural lag, and the laxity of pollution control, have united to produce a crisis of water quality. Furthermore, all of the processes that lead to water contamination continue unabated.
The combined assault on water quality embraces:
(1) extensive urban non-point sources of pollution;

Paradise lost 1353
(2) raw sewage discharges; (3) solid waste municipal dump sites, including
toxic waste sites; (4) industrial dump sites; (5) discharges into rivers and sink holes; and (6) use of agricultural fertilizers, pesticides and
herbicides.
Governmental monitoring and enforcement of standards, in both the public and private industrial sectors, are poorly effective in Puerto Rico because of piecemeal programs and a lack of coordination among the multiplicity of agencies involved with water. Scores of municipal governments, the industrial development corporation, the department of health, the water and sewage authority, the department of natural resources, the planning authority, the environmental quality board, the geological survey and the national legislature--are often individually disparate in their roles. There is a lack of collective synergism. It is still unclear as to what should be the appropriate role of different levels of government in providing safe drinking water.
Equally unclear, and beyond the scope of this study, is the lack of information on the impact of water contamination on human health. The threat to human health is obvious but no epidemiological surveys have been made, and health risks are not identified or quantified. Apart from epidemic outbreaks of gastroenteritis from fecal coliform and fecal strepto- coccal contamination, there is no reported overt evidence of pathology. The threat to health of increasing levels of heavy metals, chemicals and organic compounds in the water has yet to be investigated. The absence of such epidemiological connections is a major deficit, a crucial hiatus in our knowledge of Puerto Rico. It is also an element of great uncertainty in public health planning globally [87].
Paradise has been lost in Puerto Rico---its pristine water sullied--not by evil conspiracy but by the sins of laxity, neglect and omission. Time runs out for effective remediation especially for the most vulner- able aquifers. Policies exist in place but implemen- tation is needed. Budgetary resources also exist to be tapped in the public and private sectors. What is fundamentally needed is a wider level of public awareness and a consensus to act in harnessing the political will. The voice of the environmentalist is muted and marginalized. Leadership must emerge across all sectors of the population. Water pollution constitutes the most serious environmental problem in Puerto Rico. Its challenge is yet to be adequately addressed.
Acknowledgements--We are indebted to officials of numer- ous agencies of Government concerned with the environ- ment: the Environmental Quality Board, Environmental Protection Agency, Water and Sewer Authority, Solid Waste Management Authority, Department of Natural Resources, Geological Survey and Department of Health for generously supplying us with information, reports and documents. Ellen
R. White, Head of the Cartography Laboratory, Department of Geography, Michigan State University, kindly prepared the final figures, and Marilyn Bria, also of the Department of Geography, gave secretarial support for which we are grateful.
REFERENCES
1. Milton J. Paradise Lost. Book 5, line 328-330, 2nd edn, 1674. In John Milton, Paradise Lost. An Authoritative Text Backgrounds and Sources Criticism (Edited by Elledge S.). Norton, New York, 1975.
2. Bain N. and Medina F. Development policy in Puerto Rico, 1952-1980: an example of successful industrial decentralization. Yearbook, Conference of Latin Ameri- can Geographers, 15, 79-86, 1989. Gwyrme R. Industrialization and Urbanization in Latin America. Johns Hopkins, Baltimore, 1986. Weisskoff R. Factories and Foodstamps: the Puerto Rico Model of Development. Johns Hopkins, Baltimore, 1985. Monk J. L. and Alexander C. S. Modernization and rural population movements, western Puerto Rico. J. Inter-Am. Stud. Wld Affairs 24, 523, 1979. Tata R. and Lee D. Puerto Rico: dilemma of growth. Focus (American Geographical Society) 28, 1, 1977. Taylor M. Industrial Tax Exemption in Puerto Rico. University of Wisconsin Press, Madison, 1957. For population, see U.S. Department of Commerce, Bureau of Census, 1990 Population Census, General Population Characteristics, Puerto Rico, Vol. 1. U.S. Department of Commerce, Washington, DC, 1992.
3. Detailed, small-area field studies that assay the quality of surface water and groundwater, respectively, in relation to land use, may be examined in: (1) Arbona S.I. and Hunter J.M. The Geography of Land Use and Water Quality in Puerto Rico. In CLAG Yearbook, Vol. 19 (Edited by Elbow G. S.), pp. 93-111. Conference of Latin American Geographers, University of Texas, Austin, 1993; (2) Arbona S. I. and Hunter J. M. Economic Development Threatens Ground Water Quality in Puerto Rico: Results of a Preliminary Field Study. Ms. 1994.
4. Greenberg M. R. Health and risk in urban-industrial society: an introduction. In Public Health and the Environment (Edited by Greenberg M. R.), pp. 3-24. Guilford, New York, 1987.
5. Page G. W. Water and health. In Public Health and the Environment (Edited by Greenberg M. R.), pp. 105-138. Guilford, New York, 1987.
6. Cadilla J. F., Cruz-Baez A. D. and De Moran S. D. Elementos De Geografia De Puerto Rico. Librotex, San Juan, 1988 (Edited by De Galinanes M. T. B.). Geovision de Puerto Rico. Aportaciones recientes al estudio de la Geografia. Universidad de Puerto Rico, San Juan, 1977.
7. Torres-Sierra H., Rodriguez-Alsonso T. and Aponte F. National Water Summary 1987--Water Supply and Use: Puerto Rico, pp. 441--446. Water Supply Paper 2350. USGS, 1988.
8. Gomez-Gomez F. Planning report for the Caribbean islands regional aquifer-system analysis project. Water- Resources Investigations Report 86-4074. USGS, 1987.
9. Monroe W. H. The Karst landforms of Puerto Rico: a discussion of a solution landscape formed in a tropical climate of moderately high rainfall. Professional Paper 899, USGS, 1976.
10. Colon-Dieppa E., Diaz P. L. and Garcia R. Water Resources Data, Puerto Rico and the U.S. Virgin Islands, Water Year 1985. Report WRD PR 85-1, USGS, 1987.
11. Information courtesy of Eng. Victor Cruz Colon, Head, Irrigation Services Division, Puerto Rico Electric Power Authority, 1991.
12. Portugues and Bucana Rivers, Puerto Rico, Cerrillos Dam, Design Memo No. 5. Department of the Army,

1354 John M. Hunter and Sonia I. Arbona
Jacksonville District, FL, September 1980; Cerrillos Dam, Ponce, Puerto Rico, Memo No. 19, Hydroelectric Power Plant. US Army Corps of Engineers, North Pacific Division, June 1983.
13. Veve T. D. and Troester J. W. USGS Water Resources Investigations in Puerto Rico and the US Virgin Islands, 1986-1988. Open File Report 90-122, Water Resources Division, USGS, 1990. See p. 14 Inventory of Wells in Puerto Rico and the US Virgin Islands, principal investigator, Hector M. Colon-Ramos.
14. Puerto Rico: Ground-Water Quality, pp. 437-442 in National Water Summary 1986--Ground-Water Qual- ity: Puerto Rico. Water-Supply Paper 2325, prepared by Zack A. Rodriguez-Alsono T. and Roman-Mas A. USGS, 1988.
15. Quinones F., Melendez F. and Bonnet C. Sedimentation survey of Lago Dos Bocas, Puerto Rico, June 1985. Open File Report 86-241, USGS, 1989.
16. Quinones F., Green B. and Santiago L. Sedimentation survey of Lago Loiza, Puerto Rico, July 1985. Water-Resources Investigations Report 87-4019. USGS, 1989.
17. Autoridad De Acueductos y Aicantarillados. Informe Annual Del Area De Operaciones, Ant Fiscal 1989-1990. Estado Libre Associado de Puerto Rico, San Juan, 1990.
18. Curtis R. E., Guzman-Rios S. and Diaz P. L. Water Resources Data, Puerto Rico and the U.S. Virgin Islands, Water Year 1984. Report WRD PR 84-1, USGS, 1985.
19. Carrillo M., Estrada E. and Hazen T. C. Survival and enumeration of the fecal indicators Bifidobacterinm adolescentis and Escherichia coli in a Tropical Rain Forest Watershed. Appl. Environ. Microbiol. 50, 468, 1985.
20. Hazen T. C., Santiago-Mercado J., Toranzos G. A. and Bermudez M. What does the presence of fecal coliforms indicate in the waters of Puerto Rico? A review. Bol. Asociacion Medica Puerto Rico 70, 189, 1987.
21. Lopez-Torres A. J., Hazen T. C. and Toranzos G. A. Distribution and in situ survival and activity of Klebsiella pneumoniae and Escherichia coli in a tropical rain forest. Curr. Microbiol. 15, 213, 1987.
22. El Nuevo Dia. San Juan. 8-7-87. 23. El Nuevo Dia. San Juan. 4-22-90. 24. El Nuevo Dia. San Juan. 8-22-91. 25. El Nuevo Dia. San Juan. 3-19-90. 26. El Nuevo Dia. San Juan. 11-29-91. 27. El Nuevo Dia. San Juan. 8-23-91. 28. El Nuevo Dia. San Juan. 10-8-88. 29. El Nuevo Dia. San Juan. 7-12-87. 30. Jimenez J. D., Rullan J. V., Villanueva J. and Rivera L.
Estudio Piloto de Gastroenteritis 1987, Region de Bayamon. Estado Libre Asociado de Puerto Rico, Departamento de Salud, Division de Epidemiologia, San Juan, 1988.
31. Centers for Disease Control (CDC). Acute hemorrhagic conjunctivitis caused by Coxsackie A24 variant, Puerto Rico. Morbidity and Mortality Weekly Report (MMWR, USDHHS) 37, 123, 124, 129, 1988.
32. Centers for Disease Control (CDC). Acute hemorrhagic conjunctivitis caused by Coxsackievirus A24, Caribbean, Morbidity and Mortality Weekly Report (MMWR, USDHHS) 36, 245, 246, 251, 1987.
33. El Nuevo Dia. San Juan. 7-25-87. 34. El Nuevo Dia. San Juan. 8-24-91. 35. Snow J. Snow on Cholera. A reprint of two papers by
John Snow (1854 epidemic). Hafner, New York, 1965. 36. The New York Times, 21 Feb. 1984. 37. Health Department data on reported cases of acute
gastroenteritis by municipio in 1987 kindly supplied by CDC epidemiologist John Vincent Rullan, MD.
38. Centers for Disease Control (CDC). Surveillance for
Waterborne Disease Outbreaks-United States, 1991- 1992. Morbidity and Mortality Weekly Report MMWR, CUSDHHS) 42, Surveillance Summary No. 5, pp. 1-22, November 1993.
39. El Mundo. San Juan. 7-25-88. 40. El Nuevo Dia. San Juan. 1-29-88. 41. Solid Waste Management Authority (SWMA). Regional
Site Facility Plan. Government of Puerto Rico, San Juan, June 1991.
42. El Mundo. San Juan. 10-3-88. 43. El Nuevo Dia. San Juan. 7-18-88. 44. El Mundo. San Juan. 4-16-89. 45. The San Juan Star. 12-17-89. 46. El Nuevo Dia. San Juan. 6-3-91. 47. Personal communication, Hildelisa Gonzalez, Infor-
mation Officer, Solid Waste Management Authority, 6-24-91.
48. El Mundo. San Juan. 5-21-90. 49. Environmental Protection Agency (EPA), Environmen-
tal Quality Board (EQB), National Priority List (NPL), Site Inspection Report/Site Evaluation Report. EPA, San Juan Muratti 12-85.
50. Environmental Protection Agency (EPA), Environmen- tal Quality Board (EQB), National Priority List (NPL), Site Inspection Report/Site Evaluation Report. EPA, San Juan Caribe General Electric 10-87.
51. Environmental Protection Agency (EPA), Environmen- tal Quality Board (EQB), National Priority List (NPL), Site Inspection Report/Site Evaluation Report. EPA, San Juan Industrial Control 9-86.
52. Environmental Protection Agency (EPA), Environmen- tal Quality Board (EQB), National Priority List (NPL), Site Inspection Report/Site Evaluation Report. EPA, San Juan Frontera Creek 10-87.
53. Environmental Protection Agency (EPA), Environmen- tal Quality Board (EQB), National Priority List (NPL), Site Inspection Report/Site Evaluation Report. EPA, San Juan Fibers 10-87.
54. Office of Economic Research. Directory of Plants. Economic Development Administration, Government of Puerto Rico, San Juan, August, 1989 (Also titled Puerto Rico Directory of Manufacturers).
55. Environmental Protection Agency (EPA), Environmen- tal Quality Board (EQB), National Priority List (NPL), Site Inspection Report/Site Evaluation Report. EPA, San Juan Jobos 1-86.
56. Environmental Protection Agency (EPA), Environmen- tal Quality Board (EQB), National Priority List (NPL), Site Inspection Report/Site Evaluation Report. EPA, San Juan Cidra Landfill 1-86.
57. The San Juan Star. 12-18-89. 58. Environmental Protection Agency (EPA), Environmen-
tal Quality Board (EQB), National Priority List (NPL), Site Inspection Report/Site Evaluation Report. EPA, San Juan Old Juncos 10-87.
59. Environmental Protection Agency (EPA), Environmen- tal Quality Board (EQB), National Priority List (NPL), Site Inspection Report/Site Evaluation Report. EPA, San Juan New Juncos 9-86.
60. El Nuevo Dia. San Juan. 6-14-89. 61. Environmental Protection Agency (EPA), Environmen-
tal Quality Board (EQB), National Priority List (NPL), Site Inspection Report/Site Evaluation Report. EPA, San Juan Aibonito Landfill nd.
62. Zack A. L. and Class-Cacho A. Restoration of fresh water in the Cant Tiburones area, Puerto Rico. Water-Resources Investigations Report 83-407 !. USGS, 1984.
63. Roman-Mas A. and Ramos-Gines O. Compilation of water-quality data for the north coast limestone aquifers, Puerto Rico, 1951-1987. Open File Data Report 87-533, USGS, 1988.
64. Environmental Protection Agency (EPA), Environmen-
Paradise lost 1355
tal Quality Board (EQB), National Priority List (NPL), Site Inspection Report/Site Evaluation Report. EPA, San Juan Barceloneta Landfill 10-87.
65. Environmental Protection Agency (EPA), Environ- mental Quality Board (EQB), National Priority List (NPL), Site Inspection Report/Site Evaluation Report. EPA, San Juan Barceloneta RCA del Caribe 10-87.
66. Environmental Protection Agency (EPA), Environmen- tal Quality Board (EQB), National Priority List 0'ffPL), Site Inspection Report/Site Evaluation Report. EPA, San Juan Barceloneta Upjohn 10-87.
67. Environmental Protection Agency (EPA), Environmen- tal Quality Board (EQB), National Priority List (NPL), Site Inspection Report/Site Evaluation Report. EPA, San Juan Arecibo Waste Disposal 10-85.
68. Environmental Protection Agency (EPA), Environmen- tal Quality Board (EQB), National Priority List (NPL), Site Inspection Report/Site Evaluation Report. EPA, San Juan Hooker Chemical 10-87.
69. Environmental Protection Agency (EPA), Environmen- tal Quality Board (EQB), National Priority List (NPL), Site Inspection Report/Site Evaluation Report. EPA, San Juan Cambalache nd.
70. Environmental Protection Agency (EPA), Environmen- tal Quality Board (EQB), National Priority List (NPL), Site Inspection Report/Site Evaluation Report. EPA, San Juan Boricua 5-85.
71. United States Environmental Protection Agency Toxic Release Inventory System. Geographic Location/ Chemical Profile Report for Puerto Rico, 1989 (on-line 4-29-91). USEPA, Washington D.C., 1991.
72. Environmental Quality Board (EQB). Goals and Progress of Statewide Water Quality Management Planning, Puerto Rico 1988-1989. Government of Puerto Rico, San Juan, May 1990 [also referred to as the 305(b) report].
73. Junta De Calidad Ambiental (EQB). Informe de la situacion prevaleciente en pozos contaminados en el Municipio De Manati. Documento, San Juan Octubre, 1990.
74. Gomez-Gomez F. and Guzman-Rios S. Reconnaissance of ground-water quality throughout Puerto Rico,
Sep-Oct 1981. Open File Report 82-332, Water Resources Division, USGS, 1982.
75. Guzman-Rios S. Reconnaissance of the principal springs of Puerto Rico, 1982-1983. Open File Data Report 83-683, Water Resources Division, USGS, 1983.
76. Guzman-Rios S. and Quinones-Marquez F. Ground- water quality at selected sites throughout Puerto Rico, Sept. 1982-July 1983. Open File Data Report 84-058, Water Resources Division, USGS, 1984.
77. Guzman-Rios S. and Quinones-Marquez F. Reconnai- sance of trace organic compounds in ground water throughout Puerto Rico, Oct. 1983. Open File Data Report 84-810, Water Resources Division, USGS, 1985.
78. Environmental Protection Agency (EPA), Environmen- tal Quality Board (EQB), National Priority List (NPL), Site Inspection Report/Site Evaluation Report. EPA, San Juan Vega Alta 10-87.
79. The San Juan Star. 5-7-90. 80. Devinny J. S., Everett L. G., Lu J. C. S. and Stollar R. L.
Subsurface Migration of Hazardous Wastes. Van Nostrand Reinhold, New York, 1990.
81. Wells B. B. Restrictions Imposed on Contaminated Sites: a status of state actions. National Governors' Associ- ation, Washington DC, 1990.
82. El Nuevo Dia. San Juan. 3-22-90; 3-23-90; and 3-24-90. 83. United States Environmental Protection Agency
(USEPA), Biennial Reporting System, Resource Conser- vation and Recovery Act (RCRA), Treatment, Disposal and Recovery (TDR) Facilities, Large Quantity Generators, Quantities of Hazardous Waste Generated, List for Puerto Rico (on line 7-16-91). USEPA, Washington DC, 1991.
84. El Nuevo Dia. San Juan. 5-19-90. 85. Conacher D. and associates. Troubled waters on tap:
organic chemicals in public drinking water systems and the failure of regulation. Center for Study of Responsive Law, Washington, DC, January, 1988.
86. D'Itri F. M. and Wolfson L. G.(Eds) Rural Groundwater Contamination. (Conference Proceedings). Lewis, Chelsea, MI, 1987.
87. Greenberg M. R. and Page G. W. Planning with great uncertainty: a review and case study of the safe drinking water controversy. Socio-Econ. Plan. Sci. 15, 65, 1981.