parabolas for profit - amazon...
TRANSCRIPT

Algebra Project | Grade 9 | 20 hoursPARABOLAS FOR PROFIT

2 3
PARABOLAS FOR PROFIT: PROJECT OVERVIEWFINAL PRODUCTStudents create and present a market research analysis report.
AREA OF STUDYAlgebra
TIMEFRAME20 hours
AGE GROUPGrade 9
KEY STANDARDS ASSESSEDCCSS.MATH.CONTENT.HSS.ID.B.6 >>CCSS.MATH.CONTENT.HSF.IF.B.4 >>CCSS.MATH.CONTENT.HSF.BF.A.1 >>
See APPENDIX 1 >> for the full list of standards.
RUBRICSProject Rubric >>BIE Presentation Rubric >>
PLANNING TOOLS AND TEMPLATESProject Design Companion >>Student-Facing Planning Sheet >>
WHY PARABOLAS FOR PROFIT?Entrepreneurial spirit is strong in young people, and many will appreciate learning the business strategy behind the cost of local goods and services. As teens develop their buying power, it is also important for them to understand how businesses turn a profit and the role consumers play in a company’s success.
As market research analysts working for locally owned companies, students will determine the most profitable price point for one of their goods or services. They will gather and analyze data to establish suggested prices and develop and present their reports to the company’s owners.
DRIVING QUESTION
PROJECT DESCRIPTION
CRITIQUE & REVISIONStudents participate in scheduled group and individual teacher check-ins, peer and expert feedback sessions, and rubric reviews to provide the necessary supports for meaningful revisions.
STUDENT VOICE AND CHOICEStudents have the opportunity to choose which locally owned business to “consult” for and which of the company’s products to analyze. Throughout the project, the “what” is teacher-driven, but in many places, the “how” is determined by the students. For instance, students develop and administer a survey, but it is up to each student or student team to determine how that will happen.
REFLECTIONDaily student reflection journals encourage students’ contemplation of the content and the success skill development.
KEY KNOWLEDGE, UNDERSTANDING, AND SUCCESS SKILLSThe project requires that students design and administer a survey to gather accurate data, evaluate two-variable statistical data, and represent and analyze real-world relationships, all central to the Common Core Standards for Mathematics. Furthermore, students develop problem solving, critical thinking, communication, and collaboration skills as they work together to answer the driving question.
PUBLIC PRODUCTThe project’s final product is a market research report presented to the selected locally owned businesses. In their report, students make a pricing recommendation and explain how their team arrived at their recommendation. The format of the report is not set: it could be written or visual, and could include a presentation.
AUTHENTICITYLocally owned businesses will gain insights into their customers’ willingness to buy their goods or services at different price points and be able to use this information to determine the optimal selling price for a product. Including local business owners and a market research analyst in this project will highlight the legitimacy of the investigation and process.
WHAT MAKES THIS PROJECT GOLD-STANDARD PBL?SUSTAINED INQUIRYThroughout this 20-hour project, students ask questions that lead them deeper into the investigation. The answers to their questions will be found by surveying potential customers and analyzing the results, learning from experts, and developing and applying a range of math concepts and skills to unique situations. This spiraling inquiry process will allow students to explore the driving question in depth.
CHALLENGING PROBLEM OR QUESTIONDetermining the selling price for a product or service that will generate the greatest profit for a company is a complex endeavor. Each choice that a company makes influences the profit. Gathering data to determine the impact that selling price has on the number of units sold, substituting that information into a profit function, and analyzing the results is a challenging multi-step and multi-faceted math problem.
How can we, as market research analysts, help a local business make the most money?

4 5
EXPLORING MARKET RESEARCH ANALYSIS EXPLORING THE MATHEMATICS BEHIND PROFIT
WHAT DO MARKET RESEARCH ANALYSTS DO?Market researchers gather information about what people think. They help companies understand what types of products people want and at what price. They also help companies market their products to the people most likely to buy them. Gathering statistical data on competitors and examining prices, sales, and methods of marketing and distribution, they analyze data on past sales to predict future sales.
Market research analysts use math every day as they perform the following tasks: • Analyze statistical data on past sales to predict future sales. • Gather data on competitors and analyze prices, sales, and methods of marketing and distribution.• Devise methods and procedures for collecting data. • Evaluate product and consumer data, and make recommendations to the firm’s management or client so that
decisions can be made on the promotion, distribution, design, and pricing of goods and services.
WHAT IS THE RELATIONSHIP BETWEEN WHAT A COMPANY CHARGES FOR A PRODUCT AND THE PROFIT IT EARNS FROM SALES OF THE PRODUCT?As complicated as economics can seem, many of the concepts are intuitive if you take a step back from the dense vocabulary and complex theories. (Gross) profit is one of those concepts. It’s logical that as a company charges more for its product, the amount the company sells (its sales) would drop. Would more people want to buy the company’s yo-yo if the cost was $3 or $10? But as the company sells more items at the lower sales price, its profit on each item shrinks. If the yo-yo costs $2 to produce, selling lots of yo-yos for only $1 profit each could be as bad as selling only a few yo-yos for a profit of $8 each. Somewhere in between these two costs is where the profit will be best. Can you feel the parabola of the profit function yet?
click to explore:click to explore:
RESOURCE #1Market Research Analyst: What’s
Next?
>>
RESOURCE #2Occupational Outlook Handbook
>>
RESOURCE #3Market Research Fails
>>
RESOURCE #1Gross Profit: Definition and Formula
>>
RESOURCE #2Profit: Who Cares?
>>
RESOURCE #3Monterey Institute: Applications of
Quadratic Functions
>>

6
THE PROJECT PATH AND KEY MILESTONESThe Project Path illustrates the learning process in a project-based, competency-based setting.
Project Milestones help clarify the path from Launch to Present, as learners move through an iterative process of building new knowledge and skills, and applying their new knowledge and skills to develop, critique, and refine their products in collaboration with peers.
The Project Path and the Project Milestones provide a concrete but flexible structure for project design and implementation.
The Project Milestones are color coded in this Project Path and throughout the document.
1
Student teams share market research with owners of local businesses.
5LAUNCH
BUILD KNOWLEDGE
DEVELOP AND CRITIQUE
Student explores the project and develops a set of need to know questions (NTKs).
PRESENT
2 Student analyzes the linear relationship between cost and number of items sold.
3 Student analyzes the quadratic relationship of total profit given selling price.
Student teams develop a market research report for local businesses.4
7

8
PROJECT MILESTONES AND STEPPING STONES
ENTRY EVENT PREVIEW THE PROJECT EXPLORE THE DRIVING QUESTIONCOLLECT DATA RELATING COST AND NUMBER OF ITEMS SOLD
GENERATE AND ANALYZE SCATTER PLOTS AND LINES OF BEST FIT
PREPARE PRESENT REFLECT
Student hears from local businesses about the current pricing of a product or service that will be analyzed to improve profit.
Student is introduced to expectations for the final project.
Student experiments with pricing and generates questions about the importance of profit and pricing challenges of business owners.
Student learns how market research analysts gather and use data about product pricing by creating and distributing surveys to collect pricing data.
Student learns to create scatter plots and draw and interpret lines of best fit in order to analyze data.
Student teams practice presentations with peers.
Student teams present their market research analysis to local businesses.
Student teams reflect on the created product and the presentation.
MILESTONE #1: Student explores the project and develops a set of need to know questions (NTKs).
MILESTONE #2: Student analyzes the linear relationship be-tween cost and number of items sold.
MILESTONE #5: Student teams share market research analysis with owners of local busi-nesses.
EXPLORE REPRESENTATIONS AND FEATURES OF QUADRATIC FUNCTIONS IMPROVE THE PLAN PRACTICE & PREPARE PRESENT REFLECT
Student learns to use tables, graphs, and equations to represent quadratic relationships and interpret key elements of quadratic functions.
Student analyzes the function that relates total profit and unit price to find the price that generates the greatest total profit.
Student teams revisit and reflect on the process used to arrive at a recommended selling price.
Student teams create an outline and draft a market research report on pricing for a client.
Student teams revise and edit reports, after receiving feedback.
MILESTONE #3: Student analyzes the quadratic relationship of total profit given selling price.
MILESTONE #4: Student teams develop market research report for local businesses.

10
What will the product and/or performance include?
Begin with the end in mind! It’s time to tee up a few significant decisions you’ll need to make about the final project. As you make decisions, reflect on what you believe will work best with your students and your community, as well as time constraints, budgets, and your own skills and comfort level.
PRESENT
LAUNCH
DEVELOP AND CRITIQUE
BUILD KNOWLEDGESYNTHESIZE
INQUIRY
1. Review the three decision points below.2. After weighing your options, make your decision and document them in your Project Design Planning Companion >>.
A few simple tables and graphs that visually display the impact of the sales price on profit. Materials are shared with local business electronically.
WHAT TO DO:
A visual and/or written portrayal of pricing analysis, accompanied by a meeting with the local business.
Market research report accompanied by a formal presentation to stakeholders with the business, or a session with members from several businesses.
CUSTOMIZING THE PRODUCT OR PERFORMANCE
Who will the audience be, and how will you ensure an audience?
How much decision-making power will students have regarding the topic, audience, and final product?
Student teams present their findings to the class and send reports to the companies.
Student teams present their findings to the class and send reports to the companies. Companies are invited to attend the class presentations.
Student teams present their findings and recommendations to the local businesses and collaborating market research analyst.
Teacher identifies local businesses, assigns students, and sets up the initial meetings.
Teacher identifies local businesses and has students choose the business and set up the initial meeting.
Students undertake the full process of reaching out to businesses, meeting with them, and learning their needs.
Low Complexity Medium Complexity High ComplexityDECISION POINTS:
1
Student teams share their solutions with an audience.6
LAUNCH
BUILD KNOWLEDGE
DEVELOP AND CRITIQUE
Student explores the project and develops a set of need to know questions (NTKs).
PRESENT
2 Student explores the history of space travel and the inventions that have made this exploration possible for humans.
3 Student explores the challenges of space travel, the environment of Mars, and the effect of both on humans.
Student teams ideate and develop a proposed solution to their selectedproblem.
4
12
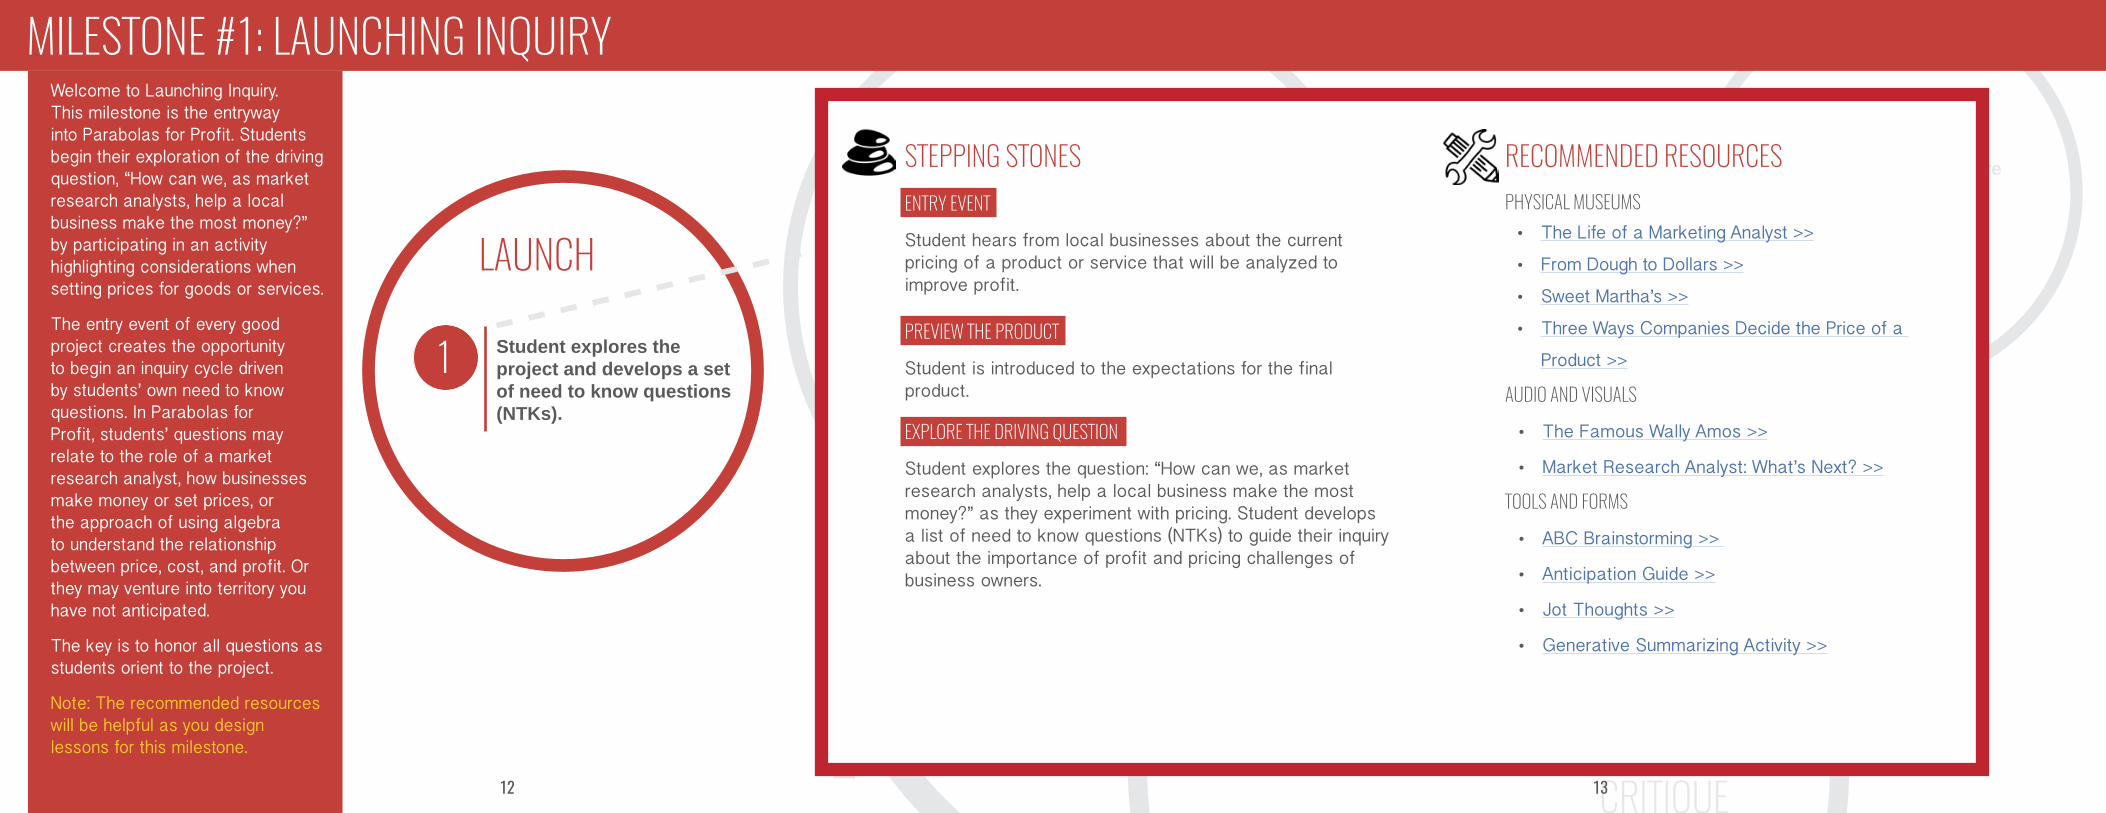
MILESTONE #1: LAUNCHING INQUIRYWelcome to Launching Inquiry. This milestone is the entryway into Parabolas for Profit. Students begin their exploration of the driving question, “How can we, as market research analysts, help a local business make the most money?” by participating in an activity highlighting considerations when setting prices for goods or services.
The entry event of every good project creates the opportunity to begin an inquiry cycle driven by students’ own need to know questions. In Parabolas for Profit, students’ questions may relate to the role of a market research analyst, how businesses make money or set prices, or the approach of using algebra to understand the relationship between price, cost, and profit. Or they may venture into territory you have not anticipated.
The key is to honor all questions as students orient to the project.
Note: The recommended resources will be helpful as you design lessons for this milestone.
STEPPING STONESENTRY EVENTStudent hears from local businesses about the current pricing of a product or service that will be analyzed to improve profit.
PREVIEW THE PRODUCTStudent is introduced to the expectations for the final product.
EXPLORE THE DRIVING QUESTIONStudent explores the question: “How can we, as market research analysts, help a local business make the most money?” as they experiment with pricing. Student develops a list of need to know questions (NTKs) to guide their inquiry about the importance of profit and pricing challenges of business owners.
RECOMMENDED RESOURCESPHYSICAL MUSEUMS
• The Life of a Marketing Analyst >>
• From Dough to Dollars >>
• Sweet Martha’s >>
• Three Ways Companies Decide the Price of a
Product >>
AUDIO AND VISUALS• The Famous Wally Amos >>
• Market Research Analyst: What’s Next? >>
TOOLS AND FORMS• ABC Brainstorming >>
• Anticipation Guide >>
• Jot Thoughts >>
• Generative Summarizing Activity >>
13

14 15
Structure of a Launch...
As you design your launch, consider this three-part structure to help guide your efforts: Entry Event, Project Preview, and Driving Question Exploration. The launch may be only one lesson, but these three key segments each involve careful decision-making, planning, and materials development. Let’s take a closer look.
MATCH, LIT.Students participate in an engaging shared experience that generates excitement about Parabolas for Profit.
PROJECT, LINKED.The connection between the provocation or entry event and the final project is totally clear; basic project expectations are communicated upfront.
INQUIRY, LAUNCHED.Opportunities for students to generate their own need to know questions (NTKs) pique their innate curiosity as they begin to connect with the challenge, “How can we, as market research analysts, help a local business make the most money?”
ENTRY EVENTCaptivating experiences create buzz, provide context, access prior knowledge, and tap student interests, curiosities, and values.
PREVIEW THE PROJECTStudent is introduced to the expectations for the final product.
EXPLORE THE CHALLENGE QUESTIONStudent accesses and assesses prior knowledge, and asks their own questions. Student uses their questions to frame inquiry into issues central to the project.
1)
2)
3)
MIGHT LOOK LIKE...• Students have a local bakery owner
(or their teacher) bring in cookies. Students discuss possible selling prices, then explore articles and videos about how businesses price their products.
• Students review the elements of the final project, the Student Planning Sheet >>, and the Project Rubric >>.
• Students engage in ABC Brainstorming >> or jump into an Anticipation Guide >>.
• Students use a graphic organizer to capture their questions and identify their need to knows.
DESIRED OUTCOMES
EXAMPLES OF INITIAL STUDENT NEED TO KNOWS
To support your planning, these questions are examples of what students may ask for this project.
• Can the owner of a company just keep all the profit for her/himself?• Why doesn’t the owner just make all the products really expensive to
make the most money?• What is the difference between goods and services?• How does a business decide the selling price of its products?• Why does a business charge its customers more than what the
business paid for a product?
QUESTIONS ABOUT OPERATING A BUSINESSNTK
QUESTIONS ABOUT THE MATHEMATICS OF THE PROFIT FUNCTION
• How do revenue, cost, and profit relate to each other?• What math can I use to create a survey and analyze its results?• How does algebra help me find a profit to recommend?• How will I use tables, graphs, and equations to investigate the driving
question?
The need to know process is essential to the project. It helps students activate their prior knowledge and identify their own questions for exploration.

16 17
SAMPLE LAUNCH: STUDENT VIEW
THE ENTRY EVENTBehold the simple chocolate chip cookie. Otis Spunkmeyer, The Keebler Elves, Mrs. Fields, Famous Amos, and Mr. Chip Ahoy! (OK, maybe he’s not real) have become world famous for chocolate chip cookies. They come in all shapes and sizes. You can buy a generic pack for a dollar or spend (according to an well-worn urban legend) $250 dollars for Neiman-Marcus’ secret recipe.
As you enjoy a cookie, think like an entrepreneur, and jot down your thoughts on the following questions: If you were to sell a cookie, how much would you sell it for? What factors would you consider to determine its price? How would you determine how much is too little or too much? How much profit would you want to make on each? How did you determine what makes it the “right” amount of profit?
LESSON LAUNCHChocolate chip cookies aren’t the only way to launch the project. Some alternatives:
• Partnering businesses bring in products to discuss possible pricing decisions.
• Student visit an e-tailer or brick-and-mortar store and collect data on product prices, comparing costs by brand and retailer.
• Students work in teams to make and price their own trail mix, considering the cost and ratios of ingredients and potential consumer response to their formula.
Key Business Understandings: Are students identifying the need to have a higher selling price than production cost? Are they trying to balance the desire to get the greatest profit with the need to set a price that people are willing to pay? If not, give them some examples of the “extremes.” Why don’t companies give things away for free? Why don’t they charge $20 for a cookie?
INVESTIGATEPREVIEW PROJECT EXPECTATIONSYour project is to recommend the most profitable price for a local business’ product or service by using algebra to analyze your market research. Your final product will be a market research analysis report.
Over the course of the project, you will first become familiar with a local business’ request for support and then will gather and analyze data to establish a suggested price for a product or service offered. Finally, you will develop and present your report, including your pricing recommendation, to the business owner.
As you explore the expectations and the Student Planning Sheet >>, complete a Jot Thoughts >> activity with a small group of your peers.
INVESTIGATE (CONT’D)
SYNTHESIZE AND REFLECT
INVESTIGATEThe need to know process is essential to the project. It helps students activate their prior knowledge and identify their own questions for exploration.
Check out this BIE resource on need to knows >> for more information!
SYNTHESIZE AND REFLECTAfter the conversation about pricing, have students work in small groups to undertake a Generative Summarizing >> activity, identifying key ideas, concepts, and most importantly, questions and need to knows.
EXPLORE THE DRIVING QUESTIONLet’s think more deeply about those chocolate chip cookies and how we can generalize what we think about pricing cookies to pricing any product or service. Look at your list of factors to determine the selling price of your cookie. Group similar factors and organize them by identifying categories for them. What questions can you now ask to help you decide what would be the “best” price to ask for the cookie?
Setting the right price can be the difference between a successful business and a struggling one, so business owners and market research analysts ask these types of questions daily.
INITIATE THE NEED TO KNOW PROCESSDrawing from the discussions you’ve just had, let’s organize our shared knowledge. What do you already know about market research analysis, small business ownership, price setting, and profit? What do we need to know or learn in order to be able to recommend and justify a price point for a local business’ product or service?
CLOSING THE LAUNCHIs there a product or service you have been thinking about buying? What does it cost, and how much more would you have been willing to pay for it? What would it need to have cost for you to have already made that purchase? Turn and discuss your thinking with a partner, and then talk about how the company selling that item could use that information. Are you ready to get into consumers’ heads to help your local business community?
MILESTONE #1: LAUNCHING INQUIRY

Student teams share market research with owners of local businesses.
5LAUNCH
BUILD KNOWLEDGE
Student explores the project and develops a set of need to know questions (NTKs).
PRESENT
2 Student analyzes the linear relationship between cost and number of items sold.
3 Student analyzes the quadratic relationship of total profit given selling price.
Student teams develop a market research report for local businesses.4
18
MILESTONE #2: RELATIONSHIP BETWEEN COST AND ITEMS SOLD
STEPPING STONES RECOMMENDED RESOURCESTEXTS AND DATA
• The Life of a Marketing Analyst >>
• 5 Common Survey Question Mistakes That’ll Ruin Your Data >>
• 10 Examples of Biased Survey Questions >>
• Random(ish) Sampling: Balancing the Ideal and the Real >>
• 7 Pros and Cons of Convenience Sampling >>
AUDIO AND VISUALS• Examples of Bias in Surveys >>
• Line of Best Fit >>
• Scatterplots >>
• The Barbie Bungee Jump >>
TOOLS AND FORMS• Attribute Sorts >>
• Quote & Comment Gallery Walk >>
• KWL-KWHLAQ Chart >>
• Concept Maps >>
• One-Sentence Summaries >>
Welcome to the Relationship Between Cost and Items Sold milestone! This milestone immerses students in the role of market analysts as they focus on the relationship between a product’s selling price and its demand (or the amount a company can expect to sell).
Data gathering and analysis are essential for market research analysts. Students will experience this firsthand as they create and distribute surveys to collect data for their partnering company about the impact of an item’s price on demand. Students need to learn how to create scatter plots and make and interpret lines of best fit in order to analyze this key data relating cost and demand.
Note: The recommended resources will be helpful as you design lessons for this milestone.
19
COLLECT DATA RELATING COST AND NUMBER OF ITEMS SOLD
Student learns how market research analysts gather and use data about product pricing by creating and distributing surveys to collect pricing data.
GENERATE AND ANALYZE SCATTER PLOTS AND LINES OF BEST FIT
Student learns to create scatter plots and draw and interpret lines of best fit in order to analyze data.
20 21
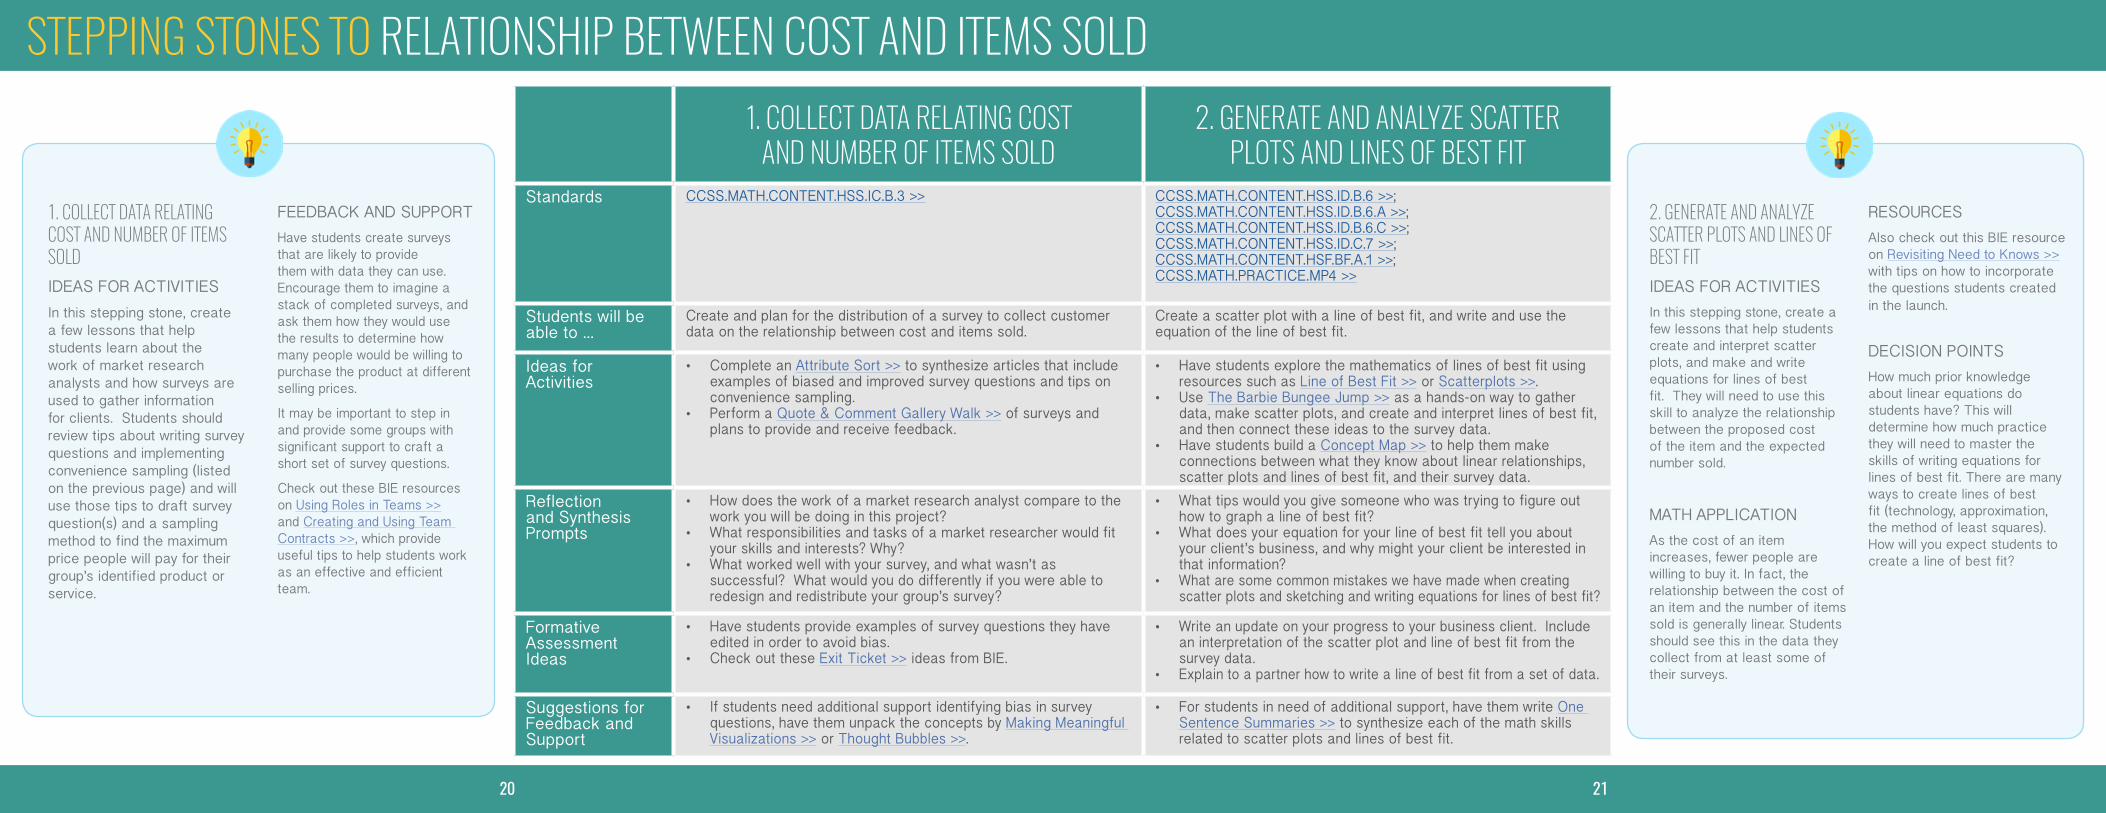
1. COLLECT DATA RELATING COST AND NUMBER OF ITEMS SOLDIDEAS FOR ACTIVITIESIn this stepping stone, create a few lessons that help students learn about the work of market research analysts and how surveys are used to gather information for clients. Students should review tips about writing survey questions and implementing convenience sampling (listed on the previous page) and will use those tips to draft survey question(s) and a sampling method to find the maximum price people will pay for their group’s identified product or service.
STEPPING STONES TO RELATIONSHIP BETWEEN COST AND ITEMS SOLD
FEEDBACK AND SUPPORTHave students create surveys that are likely to provide them with data they can use. Encourage them to imagine a stack of completed surveys, and ask them how they would use the results to determine how many people would be willing to purchase the product at different selling prices.
It may be important to step in and provide some groups with significant support to craft a short set of survey questions.
Check out these BIE resources on Using Roles in Teams >> and Creating and Using Team Contracts >>, which provide useful tips to help students work as an effective and efficient team.
2. GENERATE AND ANALYZE SCATTER PLOTS AND LINES OF BEST FITIDEAS FOR ACTIVITIESIn this stepping stone, create a few lessons that help students create and interpret scatter plots, and make and write equations for lines of best fit. They will need to use this skill to analyze the relationship between the proposed cost of the item and the expected number sold.
MATH APPLICATIONAs the cost of an item increases, fewer people are willing to buy it. In fact, the relationship between the cost of an item and the number of items sold is generally linear. Students should see this in the data they collect from at least some of their surveys.
RESOURCES
Also check out this BIE resource on Revisiting Need to Knows >> with tips on how to incorporate the questions students created in the launch.
DECISION POINTSHow much prior knowledge about linear equations do students have? This will determine how much practice they will need to master the skills of writing equations for lines of best fit. There are many ways to create lines of best fit (technology, approximation, the method of least squares). How will you expect students to create a line of best fit?
1. COLLECT DATA RELATING COST AND NUMBER OF ITEMS SOLD
2. GENERATE AND ANALYZE SCATTER PLOTS AND LINES OF BEST FIT
Standards CCSS.MATH.CONTENT.HSS.IC.B.3 >> CCSS.MATH.CONTENT.HSS.ID.B.6 >>;CCSS.MATH.CONTENT.HSS.ID.B.6.A >>;CCSS.MATH.CONTENT.HSS.ID.B.6.C >>;CCSS.MATH.CONTENT.HSS.ID.C.7 >>;CCSS.MATH.CONTENT.HSF.BF.A.1 >>;CCSS.MATH.PRACTICE.MP4 >>
Students will be able to ...
Create and plan for the distribution of a survey to collect customer data on the relationship between cost and items sold.
Create a scatter plot with a line of best fit, and write and use the equation of the line of best fit.
Ideas for Activities
• Complete an Attribute Sort >> to synthesize articles that include examples of biased and improved survey questions and tips on convenience sampling.
• Perform a Quote & Comment Gallery Walk >> of surveys and plans to provide and receive feedback.
• Have students explore the mathematics of lines of best fit using resources such as Line of Best Fit >> or Scatterplots >>.
• Use The Barbie Bungee Jump >> as a hands-on way to gather data, make scatter plots, and create and interpret lines of best fit, and then connect these ideas to the survey data.
• Have students build a Concept Map >> to help them make connections between what they know about linear relationships, scatter plots and lines of best fit, and their survey data.
Reflection and Synthesis Prompts
• How does the work of a market research analyst compare to the work you will be doing in this project?
• What responsibilities and tasks of a market researcher would fit your skills and interests? Why?
• What worked well with your survey, and what wasn’t as successful? What would you do differently if you were able to redesign and redistribute your group’s survey?
• What tips would you give someone who was trying to figure out how to graph a line of best fit?
• What does your equation for your line of best fit tell you about your client’s business, and why might your client be interested in that information?
• What are some common mistakes we have made when creating scatter plots and sketching and writing equations for lines of best fit?
Formative Assessment Ideas
• Have students provide examples of survey questions they have edited in order to avoid bias.
• Check out these Exit Ticket >> ideas from BIE.
• Write an update on your progress to your business client. Include an interpretation of the scatter plot and line of best fit from the survey data.
• Explain to a partner how to write a line of best fit from a set of data.
Suggestions for Feedback and Support
• If students need additional support identifying bias in survey questions, have them unpack the concepts by Making Meaningful Visualizations >> or Thought Bubbles >>.
• For students in need of additional support, have them write One Sentence Summaries >> to synthesize each of the math skills related to scatter plots and lines of best fit.

Student teams share market research with owners of local businesses.
5LAUNCH
BUILD KNOWLEDGE
Student explores the project and develops a set of need to know questions (NTKs).
PRESENT
2 Student analyzes the linear relationship between cost and number of items sold.
3 Student analyzes the quadratic relationship of total profit given selling price.
Student teams develop a market research report for local businesses.4
22
MILESTONE #3: RELATIONSHIP BETWEEN TOTAL PROFIT AND PRICE
STEPPING STONES RECOMMENDED RESOURCESTEXTS AND DATA
• Applications of Quadratic Functions >>
• Graphing Quadratics in Factored Form >>
• Quadratic Word Problems >>
• Area Models of Quadratics >>
• Areas of Rectangles >>
• Colorful Growing Sequences >>
AUDIO AND VISUALS• Quadratic Model: Revenue >>
• Tickets to a Soccer Stadium >>
TOOLS AND FORMS• Math Process Logs >>
• Detect and Articulate Patterns >>
• Analyze the Numerical Data >>
• Problem-Solving Via Analogy >>
• Drawing Conclusions Thinking Guide >>
• Cornell Notes >>
Welcome to the Relationship Between Total Profit and Price milestone! This milestone explores the quadratic relationship between the selling price of a product and the total profit generated by its sales.
To analyze this important economic relationship, students must learn to both represent quadratic equations and analyze their key features. Additionally, students will continue to build their facility with the language and concepts of small-business finances, including the concepts of total profit, demand, revenue, and costs.
Check out the recommended resources related to representing and analyzing quadratics, and understanding the relationship between total profit and price.
Note: The recommended resources will be helpful as you design lessons for this milestone.
23
EXPLORE REPRESENTATIONS AND FEATURES OF QUADRATIC FUNCTIONS
Student learns to use tables, graphs, and equations to represent quadratic relationships, and interpret key elements of quadratic functions.
ANALYZE PROFIT FUNCTION
Student analyzes the function that relates total profit and unit price to find the price that generates the greatest total profit.

24 25
1. EXPLORE REPRESENTATIONS AND FEATURES OF QUADRATIC FUNCTIONSIDEAS FOR ACTIVITIESIn this stepping stone, create three to five lessons that help students model real-world quadratic situations using tables, graphs, and equations.
Quadratic functions are a significant focus in algebra, but for this investigation, students should focus on using algebra to express a quadratic pattern in order to model the relationship between the small business’ total profit for an item and its price. Be sure to check out how this is approached in the third problem of Applications of Quadratic Functions >>.
STEPPING STONES TO RELATIONSHIP BETWEEN TOTAL PROFIT AND PRICE
DECISION POINTWhat skills related to quadratic functions will students be expected to master? It’s possible to have students create the quadratic equation to model the profit parabola by observing the pattern related to the product of linear expressions as is shown in Applications of Quadratic Functions >>. Are there other skills you want to include in this stepping stone?
Check out these resource from BIE on Learning Logs >> that can help students stay organized as they draft their report.
Remember the power of Conferencing >> as well!
2. ANALYZE THE PROFIT FUNCTIONIDEAS FOR ACTIVITIESIn this stepping stone, you’ll create a few lessons that develop students’ abilities to interpret key features of quadratic relationships, including maxima, minima, and zeroes. Students will use these skills to analyze the relationship between total profit and unit price to find the price that generates the greatest total profit.
REFLECTION & SYNTHESISUse reflections to help students make connections between the abstract and quantitative aspects of the quadratic relationships, and among the different methods that can be used to determine important features of the functions.
DECISION POINT
Determining zeroes, maxima, and minima can be as simple as using technology to graph a quadratic equation and interpreting the result, or it can involve factoring, completing the square, transforming equations to vertex form, and using the binomial theorem. It will be important to have a minimum threshold of skills and extensions for students ready to learn or apply more complex ones.
FOCUS ON STUDENTS’ NTKsThis is a good time to revisit the NTKs and the driving question. Check out this BIE resource on Revisiting Need to Knows >> with tips on how to incorporate the questions students created in the launch.
1. EXPLORE REPRESENTATIONS AND FEATURES OF QUADRATIC FUNCTIONS
2. ANALYZE THE PROFIT FUNCTION
Standards CCSS.MATH.CONTENT.HSA.CED.A.2 >>;CCSS.MATH.CONTENT.HSF.IF.C.7.A >>;CCSS.MATH.CONTENT.HSF.BF.A.1 >>;CCSS.MATH.CONTENT.HSF.BF.A.1.A >>;CCSS.MATH.CONTENT.HSF.BF.A.1.B >>;CCSS.MATH.PRACTICE.MP4 >>
CCSS.MATH.CONTENT.HSF.IF.B.4 >>;CCSS.MATH.CONTENT.HSF.IF.C.7.A >>;CCSS.MATH.PRACTICE.MP2 >>;CCSS.MATH.PRACTICE.MP4 >>
Students will be able to ...
Represent quadratic functions using tables, graphs, and equations. Interpret key features of quadratic relationships.
Ideas for Activities
• Detect and Articulate Patterns >>• Analyze the Numerical Data >>
• Problem-Solving Via Analogy >>• Drawing Conclusions Thinking Guide >>
Reflection and Synthesis Prompts
• How can creating tables about the selling price, number of items sold, and total profit help you write an equation to generalize the relationship?
• How can you recognize a quadratic relationship from a table? From a graph? From an equation?
• Give a real-world situation that is quadratic, and describe how the zeroes and vertex can help you analyze the situation.
• Compare the different ways to find the zeroes of a quadratic function. Which method(s) do you prefer, and why?
Formative Assessment Ideas
• Have students respond daily to questions prompting them to reflect on the math and business concepts learned in class and how their learning will help them serve their business clients.
• Identify a subset of key math tasks that students must submit, including problems that demonstrate their ability to represent quadratic situations as a table, a graph, and an equation.
• Check out these Exit Ticket >> ideas from BIE.
• Have students submit a summary of the math skills they learned in this milestone and how they are used to determine the price at which their client earns the greatest profit.
Suggestions for Feedback and Support
• Using Math Process Logs >> can help students keep track of the different steps and skills involved in finding the relationship between total profit and price.
• Cornell Notes >> can help students to independently apply their new math skills and concepts by supporting them with a structured reference guide.

Student teams share market research with owners of local businesses.
5
DEVELOP AND CRITIQUE
2 Student analyzes the linear relationship between cost and number of items sold.
3 Student analyzes the quadratic relationship of total profit given selling price.
Student teams develop a market research report for local businesses.4
26 27
MILESTONE #4: DEVELOP MARKET RESEARCH REPORT FOR LOCAL BUSINESS
STEPPING STONES RECOMMENDED RESOURCESTEXTS AND DATA
• Market Analysis Report Sample >>
• Sample Market Research Report >>
AUDIO AND VISUALS• Desmos >>
TOOLS AND FORMS• Generative Summarizing >>
• Math Process Logs >>
• Math: Making an Argument >>
• Take a Position: Mathematical Modeling >>
• Give and Receive Feedback: Mathematical Modeling >>
Welcome to the milestone where students consolidate their research and analysis into a market research report for their client.
This milestone is designed to support students as they retrace their mathematical steps that enabled them to recommend to their clients selling prices that will result in the greatest total profit for their businesses. Students use these summaries and reflections to draft their market research reports. The final stepping stone will provide the structure and guidance for students to review and revise the market research analysis reports.
Note: Check out the recommended resources for prototyping suggestions.
SUMMARIZE
Student teams revisit and reflect on the process used to arrive at a recommended selling price.
DRAFT REPORT
Student teams create an outline and draft a market research report on pricing for a client.
REVISE AND EDIT
Student teams revise and edit reports after receiving feedback

28 29
1. SUMMARIZE IDEAS FOR ACTIVITIESDevelop a lesson or two that will help students revisit the mathematical steps that resulted in the recommended selling price. Choose an activity like Generative Summarizing >> or Math Process Logs >> to help students understand how each element of their research is needed to arrive at a recommended price.
FEEDBACK AND SUPPORTIf students are struggling to see how each of the different activities helped them arrive at their recommendation, have them use a graphic organizer like Math: Making an Argument >>.
STEPPING STONES TO DEVELOP MARKET RESEARCH REPORT FOR LOCAL BUSINESS
IMPORTANT MATH NOTEStudents may identify other important “aha” moments along the way but should at least identify the following steps:
• Finding customers’ willingness to pay different prices by writing and distributing surveys
• Finding the linear relationship between selling price and number of items sold by creating a scatter plot and line of best fit from the survey data
• Finding the quadratic relationship between selling price and total profit by (at least) creating a table and generalizing the process
• Finding the selling price that gives the maximum profit by (at least) examining the graph of the total profit function
2. DRAFT REPORTIDEAS FOR ACTIVITIESCreate a couple lessons that provide the structure and support students will need to plan and draft their market research reports. Market research reports are much more technical and formal than most high school writing. Students should focus on writing the key sections of the report: the Objective, Conclusions, and Methodology. After students complete an activity like Generative Summarizing >> from the previous stepping stone, they should have enough direction to draft these elements. Providing exemplars and a template for their reports can help to clarify expectations and provide guidance.
MATH REPRESENTATIONSGraphs and tables are useful tools to see the relationships between the variables, and you should encourage students to include them in their report. Desmos is a free, intuitive online calculator that will allow students to quickly create graphs of their equations to use in their reports.
QUESTIONS TO CONSIDERHow can you best support students as they use the writing process in your class? It may be useful to collaborate with ELA teachers (or possibly science teachers due to experience with lab reports) to build on current models of drafting, revising, and editing that are already familiar to students.
1. SUMMARIZE 2. DRAFT REPORTStandards CCSS.MATH.PRACTICE.MP1 >> CCSS.ELA-LITERACY.WHST.9-10.1 >>;
CCSS.ELA-LITERACY.WHST.9-10.2 >>;CCSS.ELA-LITERACY.WHST.9-10.4 >>
Students will be able to ...
Summarize and reflect on the mathematical processes used to arrive at a recommended selling price.
Create an outline and draft a market research report on pric-ing for a client.
Ideas for Activities
• Generative Summarizing >> • Math Process Logs >>
• Take a Position: Mathematical Modeling >>• Connection Graphic Organizer >>
Reflection and Synthesis Prompts
• Which part of your research will be most challenging to ex-plain, and what can you do to make it clear to your client?
• How can you present the research to your client so it’s in-formative and engaging?
• How did hearing and revising my peers’ summaries affect my learning?
• How will you convince your client that your conclusions are supported by data?
• What new techniques or tools did you use as you drafted your report? How did you choose them? What was your experience using them?
• How will you use visuals (including tables and graphs) to help your client understand your recommendation?
Formative Assessment Ideas
• Create a flowchart that shows the different steps you used to arrive at your recommendation.
• Have students submit an outline and draft of their market research analysis.
Suggestions for Feedback and Support
• Math: Making an Argument >>• The Math Process Log >> is a useful tool to help students
review their thinking and identify areas of confusion.• The Work Time >> resource from BIE is a useful tool for
structuring conferences.

3. REVISE AND EDITIDEAS FOR ACTIVITIESIdentify a few activities that help students focus on giving and receiving feedback on the drafts of their market research reports and using that input to improve their reports.
Ask students to use rubrics or checklists to self-assess their work and develop a plan for further revision or editing.
Check out these two BIE resources, Using Rubrics >> and Critique Protocols >>, for ideas on how students can use rubrics and protocols to reflect and refine their work.
STEPPING STONES TO DEVELOP MARKET RESEARCH REPORT FOR LOCAL BUSINESS
3. REVISE AND EDITStandards CCSS.ELA-LITERACY.WHST.9-10.5 >>
Students will be able to ... Revise and edit reports after receiving feedback.
Ideas for Activities • Give and Receive Feedback: Mathematical Modeling >>
Reflection and Synthesis Prompts
• What questions do you have about your draft?• What feedback did you receive on your market research that you are going to use? How will these changes
improve your report?
Formative Assessment Ideas
• Conference >> with each student using the rubric for the project.
Suggestions for Feedback and Support
• The use of Generative Summarizing >> can help students integrate the feedback on their reports into a few focused, actionable ideas.
30 31
NOTE ON TIME MANAGEMENT This stage of the project is very fluid and can become challenging to manage. While fluidity is essential, students will likely need help remaining productive. Think about creating checkpoints that help you ensure that the project continues to move forward effectively.
LEARN FROM THE EXPERTSIncluding a market research analyst in the feedback process can provide the authenticity needed for students to act on suggestions and critique. Check out this BIE resource on Working with Outside Experts >>.
As you design lessons, make sure to help students understand the benefits of engaging in an iterative process, even when it can feel frustrating. This is an essential learning moment for students regarding perseverance.
RECONNECT TO THE DRIVING QUESTION This is a good time to revisit the driving question and any NTKs that remain.
Remember the power of Conferencing >> as well!
Student teams share market research with owners of local businesses.
5BUILD KNOWLEDGE PRESENT
Student analyzes the linear relationship between cost and number of items sold.
Student analyzes the quadratic relationship of total profit given selling price.
Student teams develop a market research report for local businesses.4
32 33
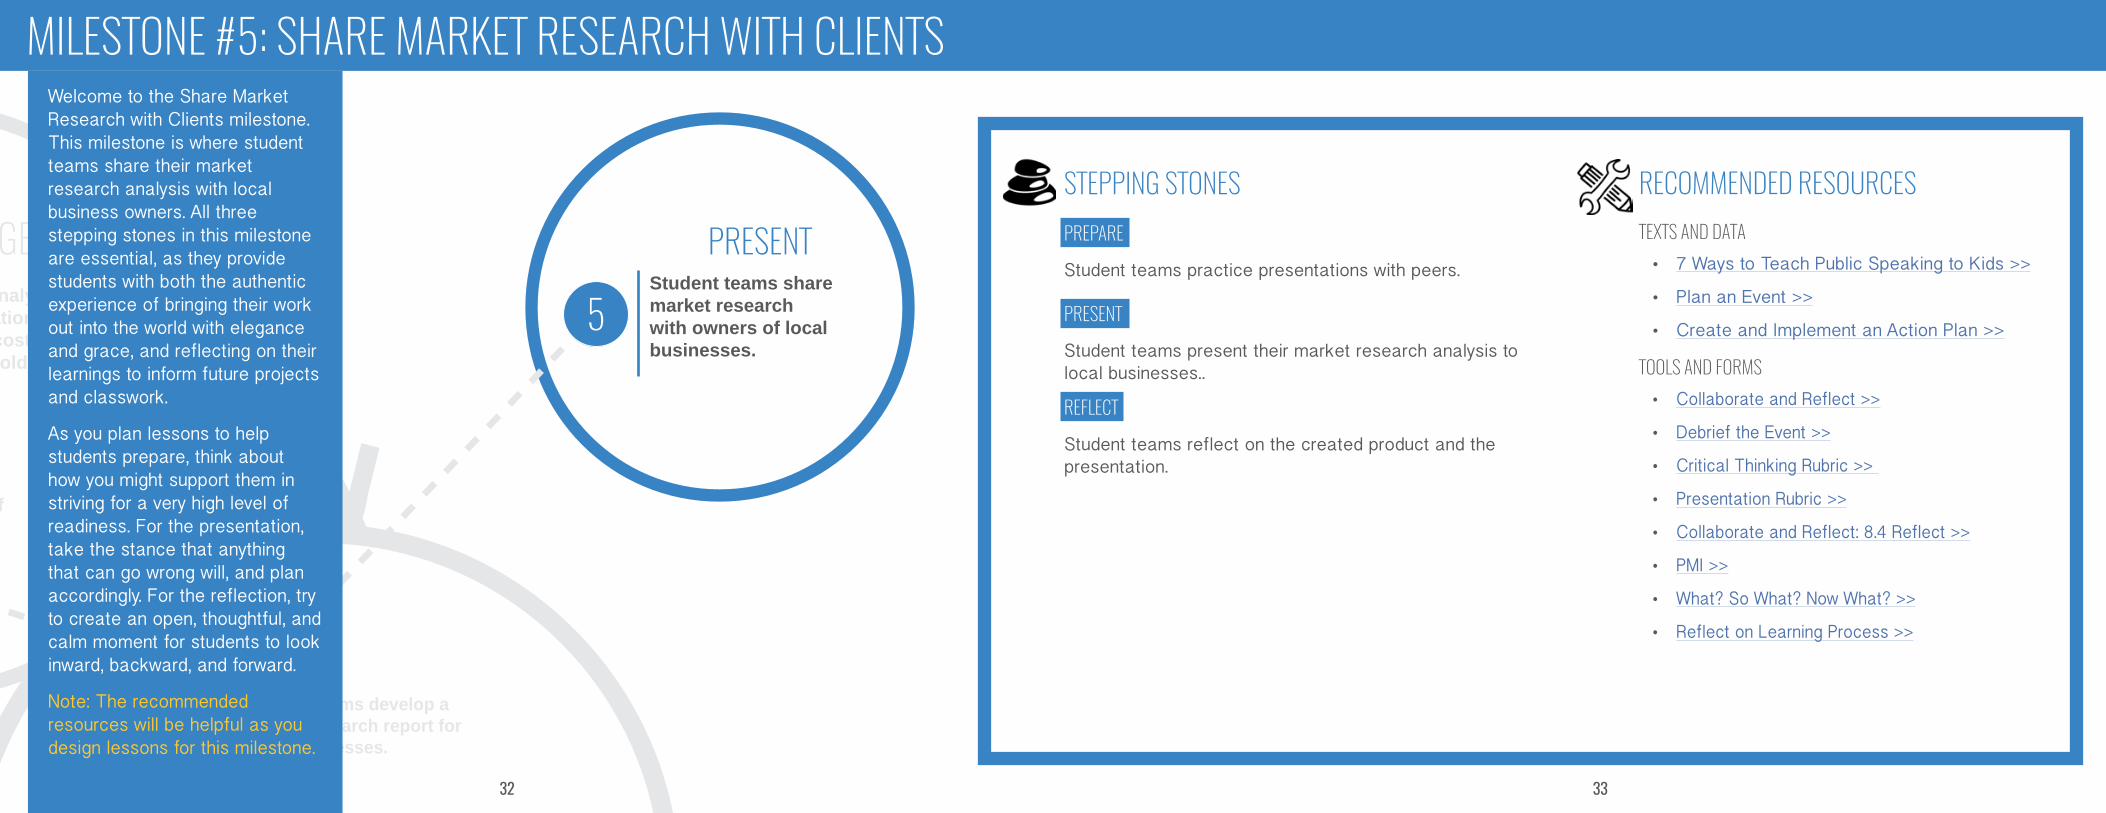
RECOMMENDED RESOURCESTEXTS AND DATA
• 7 Ways to Teach Public Speaking to Kids >>
• Plan an Event >>
• Create and Implement an Action Plan >>
TOOLS AND FORMS• Collaborate and Reflect >>
• Debrief the Event >>
• Critical Thinking Rubric >>
• Presentation Rubric >>
• Collaborate and Reflect: 8.4 Reflect >>
• PMI >>
• What? So What? Now What? >>
• Reflect on Learning Process >>
MILESTONE #5: SHARE MARKET RESEARCH WITH CLIENTSWelcome to the Share Market Research with Clients milestone. This milestone is where student teams share their market research analysis with local business owners. All three stepping stones in this milestone are essential, as they provide students with both the authentic experience of bringing their work out into the world with elegance and grace, and reflecting on their learnings to inform future projects and classwork.
As you plan lessons to help students prepare, think about how you might support them in striving for a very high level of readiness. For the presentation, take the stance that anything that can go wrong will, and plan accordingly. For the reflection, try to create an open, thoughtful, and calm moment for students to look inward, backward, and forward.
Note: The recommended resources will be helpful as you design lessons for this milestone.
STEPPING STONESPREPAREStudent teams practice presentations with peers.
PRESENTStudent teams present their market research analysis to local businesses..
REFLECTStudent teams reflect on the created product and the presentation.

34
DECISION-MAKING TIPS AND GUIDANCE
1. PREPARE DECISION POINTSPreparations will vary depending on whether students will share their market research and recommendations in school or in the community and whether each group will present to all the business clients or schedule their presentations individually.
STEPPING STONES TO SHARING THE EXHIBIT
1. PREPARE 2. PRESENT 3. REFLECTStandards CCSS.ELA-LITERACY.SL.9-10.4 >> CCSS.ELA-LITERACY.SL.9-10.4 >> Standards
Students will be able to...
Make final preparations for sharing their mar-ket research with their clients.
Present the results of their market research analysis to their clients.
Reflect on their original NTKs, their learning of new skills and knowledge, and their market research analysis.
Students will be able to...
DecisionPoints
• With whom will the market research anal-ysis reports be shared? Will the presen-tations occur in the school or at the local businesses? What materials will students need for their presentations?
• How can the experience be structured so that business owners, market research analysts, and others can give meaningful feedback on the students’ analysis?
• Collaborate and Reflect: 8.4 Reflect >>• Plus, Minus, Interesting (PMI) >>
Ideas forReflection on Work Productand Process
Ideas forActivities
• Use the rubrics to self-assess, and ask peers to assess the market research re-ports >> and presentations >>.
• Write a presentation script, and rehearse with a partner group.
• The event • What? So What? Now What? >> Reflection on Presentation
Logistics• Identify the space, guests, format for the
event, technology needs, schedule for the event, parking, refreshments, feedback sheets, etc.
• Leave time to set up and break down the event.
• Decide how guests will be invited to en-gage and how students will organize them-selves so people don’t have to hear every team’s full presentation in order to provide meaningful feedback to students.
• Reflect on Learning Process >>Ideas forReflection on NTKs and KeyKnowledge
2. PRESENTWhen you plan an in-person event, it’s important to anticipate and plan for all the logistical details and potential complications.
As you plan for the event, imagine all that can go wrong, and think of a way to address it: What if a student doesn’t attend the presentation? What if the internet goes down? The guests won’t engage? The weather is prohibitive? Students aren’t prepared or have too much anxiety?
Check out this BIE resource, Audience Feedback Form >> for additional ideas on eliciting feedback from the audience.
3. REFLECTION & SYNTHESISThe reflection process is both essential and more complex than one might first imagine. Reflecting on the project as a whole should take students on a journey of thinking about their new learning of content and skills, the quality of their final products, and their presentations.
This BIE resource Post Project Reflection and Feedback From Students >> is a useful tool for teachers to reflect on the project as a whole.
35

36
BUILD KNOWLEDGE (MILESTONES 2-5) ContinuedMathematicsCCSS.MATH.CONTENT.HSF.BF.A.1 >>Write a function that describes a relationship between two quantities.
CCSS.MATH.CONTENT.HSF.BF.A.1.A >>Determine an explicit expression, a recursive process, or steps for calculation from a context.
CCSS.MATH.CONTENT.HSF.BF.A.1.B >>Combine standard function types using arithmetic operations.
CCSS.MATH.CONTENT.HSF.IF.B.4 >> For a function that models a relationship between two quantities, interpret key features of graphs and tables in terms of the quantities, and sketch graphs showing key features given a verbal description of the relationship.
CCSS.MATH.CONTENT.HSS.ID.B.6 >> Represent data on two quantitative variables on a scatter plot, and describe how the variables are related.
CCSS.MATH.CONTENT.HSF.IF.C.7.A >> Graph linear and quadratic functions and show intercepts, maxima, and minima.
CCSS.MATH.CONTENT.HSA.CED.A.2 >> Create equations in two or more variables to represent relationships between quantities; graph equations on coordinate axes with labels and scales.
PRESENT (MILESTONE 5)CCSS.ELA-LITERACY.SL.9-10.4 >> Present information, findings, and supporting evidence clearly, concisely, and logically such that listeners can follow the line of reasoning and the organization, development, substance, and style are appropriate to purpose, audience, and task.
CCSS.ELA-LITERACY.SL.9-10.5 >> Make strategic use of digital media (e.g., textual, graphical, audio, visual, and interactive elements) in presentations to enhance understanding of findings, reasoning, and evidence, and to add interest.
APPENDIX I: STANDARDSBUILD KNOWLEDGE (MILESTONES 2-5)MathematicsCCSS.MATH.PRACTICE.MP1 >>Make sense of problems, and persevere in solving them.CCSS.MATH.PRACTICE.MP2 >> Reason abstractly and quantitatively.CCSS.MATH.PRACTICE.MP4 >> Model with mathematics.CCSS.MATH.CONTENT.HSS.IC.B.3 >>Recognize the purposes of and differences among sample surveys, experiments, and observational studies; explain how randomization relates to each.CCSS.MATH.CONTENT.HSS.ID.B.6 >>Represent data on two quantitative variables on a scatter plot, and describe how the variables are related.CCSS.MATH.CONTENT.HSS.ID.B.6.A >>Fit a function to the data; use functions fitted to data to solve problems in the context of the data. Use given functions or choose a function suggested by the context. Emphasize linear, quadratic, and exponential models.CCSS.MATH.CONTENT.HSS.ID.B.6.C >>Fit a linear function for a scatter plot that suggests a linear association.CCSS.MATH.CONTENT.HSS.ID.C.7 >>Interpret the slope (rate of change) and the intercept (constant term) of a linear model in the context of the data.
DEVELOP & CRITIQUE (MILESTONES 2-5)WritingCCSS.ELA-LITERACY.W.9-10.4 >> Produce clear and coherent writing in which the development, organization, and style are appropriate to task, purpose, and audience. CCSS.ELA-LITERACY.WHST.9-10.1 >> Write arguments focused on discipline-specific content.CCSS.ELA-LITERACY.WHST.9-10.2 >> Write informative/explanatory texts, including the narration of historical events, scientific procedures/experiments, or technical processes.CCSS.ELA-LITERACY.WHST.9-10.4 >> Produce clear and coherent writing in which the development, organization, and style are appropriate to task, purpose, and audience.CCSS.ELA-LITERACY.WHST.9-10.5 >> Develop and strengthen writing as needed by planning, revising, editing, rewriting, or trying a new approach, focusing on addressing what is most significant for a specific purpose and audience..
37
acknowledgementsHelen Keller said it best, “Alone we can do so little; together we can do so much.”
This project was designed and developed as a collaboration between Buck Institute for Education >> and reDesign, LLC >>.
Special thanks to the following reDesign colleagues for developing this project frame:
Michelle AllmanAntonia Rudenstine
got more?Yes, in fact!Come find more great projects and resources to support your PBL adventures at:
www.bie.org >>
and
www.redesignu.org >>