para divulgação imediata · for more details, see note no. 35 of our itrs. 2. income statement...
TRANSCRIPT

1Q12 Results
Curitiba, Brazil, May 15, 2012 – Companhia Paranaense de Energia - COPEL (BM&FBOVESPA:
CPLE3, CPLE5, CPLE6 / NYSE: ELP / LATIBEX: XCOP), a company that generates, transmits, distributes
and sells power to the State of Paraná, announces its results for the first quarter of 2012 (1Q12).
Copel’s consolidated balance sheet presents, in addition to the figures of its wholly owned
subsidiaries (Copel Geração e Transmissão, Copel Distribuição and Copel Telecomunicações), those
of Compagas, Elejor, UEG Araucária, Caiuá Transmissora, Centrais Eólicas do Paraná, Costa Oeste
Transmissora, Integração Maranhense Transmissora, Marumbi Transmissora, Transmissora Sul
Brasileira, Cutia Empreendimentos Eólicos and Dominó Holdings. The consolidated financial
statements were prepared in accordance with International Financial Reporting Standards (IFRS)
issued by the International Accounting Standards Board (IASB), and with accounting practices
adopted in Brazil.
Highlights
Net Operating Revenue: R$ 2,025 million.
Operating Income: R$ 476 million.
Net Income: R$ 320 million.
EPS (Earnings per Share): R$ 1.17.
EBITDA (Earnings Before Interest, Taxes, Depreciation And Amortization): R$ 585.4 million.
Return on Shareholders’ Equity: 2.7% in the period.
Growth in Power Supply: 7.3% (captive market plus free consumers).
The Company’s shares and main indexes presented the following variations in the period:
Price Var. % Points Var. %03/31/2012 year 03/31/2012 year
CPLE3 (common/ BM&FBovespa) R$ 35.00 6.0
CPLE6 (preferred B/ BM&FBovespa) R$ 42.75 9.9
ELP (ADS/ Nyse) US$ 23.51 12.1 DOW JONES 13,212 8.1
XCOP (preferred B/ Latibex) € 17.32 6.9 LATIBEX 3,072 5.7
Ibovespa 64,510 13.7
Ticker Index
Para Divulgação Imediata

2
Earnings Release – 1Q12
LIST OF CONTENTS
1. General Information _________________________________________ 3
1.1 Audit Committee ______________________________________________________________________ 3
1.2 Provisions, Revaluation of Financial Assets and CVA effects _______________________________________ 3
2. Income Statement ___________________________________________ 3
2.1 Net Operating Revenue _________________________________________________________________ 3
2.2 Operating Costs and Expenses ____________________________________________________________ 5
2.3 EBITDA _____________________________________________________________________________ 7
2.4 Equity in Results of Investees _____________________________________________________________ 7
2.5 Financial Results ______________________________________________________________________ 7
2.6 Net Income __________________________________________________________________________ 7
3. Balance Sheet and Investment Program _________________________ 7
3.1 Assets ______________________________________________________________________________ 7
3.2 Liabilities and Controller’s Shareholders’ Equity ________________________________________________ 8
3.3 CAPEX_____________________________________________________________________________ 10
4. Shareholding Structure ______________________________________ 11
5. Consolidated Financial Statements ____________________________ 12
5.1 Assets _____________________________________________________________________________ 12
5.2 Liabilities __________________________________________________________________________ 13
5.3 Income Statement ____________________________________________________________________ 14
5.4 Cash Flow __________________________________________________________________________ 15
6.1 Assets _____________________________________________________________________________ 16
6.2 Liabilities __________________________________________________________________________ 17
6.3 Income Statement ____________________________________________________________________ 18
7. Power Market _____________________________________________ 19
7.1 Captive Market ______________________________________________________________________ 19
7.2 Copel Distribuição’s Grid Market – TUSD ____________________________________________________ 20
7.3 Energy Flow ________________________________________________________________________ 20
8. Supplementary Information __________________________________ 22
8.1 Tariffs _____________________________________________________________________________ 22
8.2 Main Operational and Financial Indicators ___________________________________________________ 24
8.3 1Q12 Results Conference Call ____________________________________________________________ 25
3
Earnings Release – 1Q12
1. General Information
1.1 Audit Committee
The contents of COPEL’s financial statements are monitored by the Company’s Board of Directors through the Audit
Committee. To ensure the accuracy of these statements, the Audit Committee directly receives any reports or concerns
about them.
1.2 Provisions, Revaluation of Financial Assets and CVA effects
The quarter’s provisions and reversals include: (i) provisions of R$ 52.0 million for litigation involving the Company, in
accordance with internal legal counsel’s opinion; (ii) provisions of R$ 7.1 million for the adhesion of 42 employees to the
Succession and Voluntary Redundancy Program; and (iii) the appropriation of R$ 42.6 million as financial expenses due to the
remeasurement of the fair value of COPEL Distribuição’s financial assets as a result of new useful life estimates established by
ANEEL Resolution 474/12. If the regulatory assets and liabilities were accounted for, the net effect of Compensation Account
for Variations in Items from “Portion A” (CVA) over COPEL 1Q12 results would be negative in $ 4.2 million (compared to
R$ 50.7 million negative in 1Q11). For more details, see Note No. 35 of our ITRs.
2. Income Statement
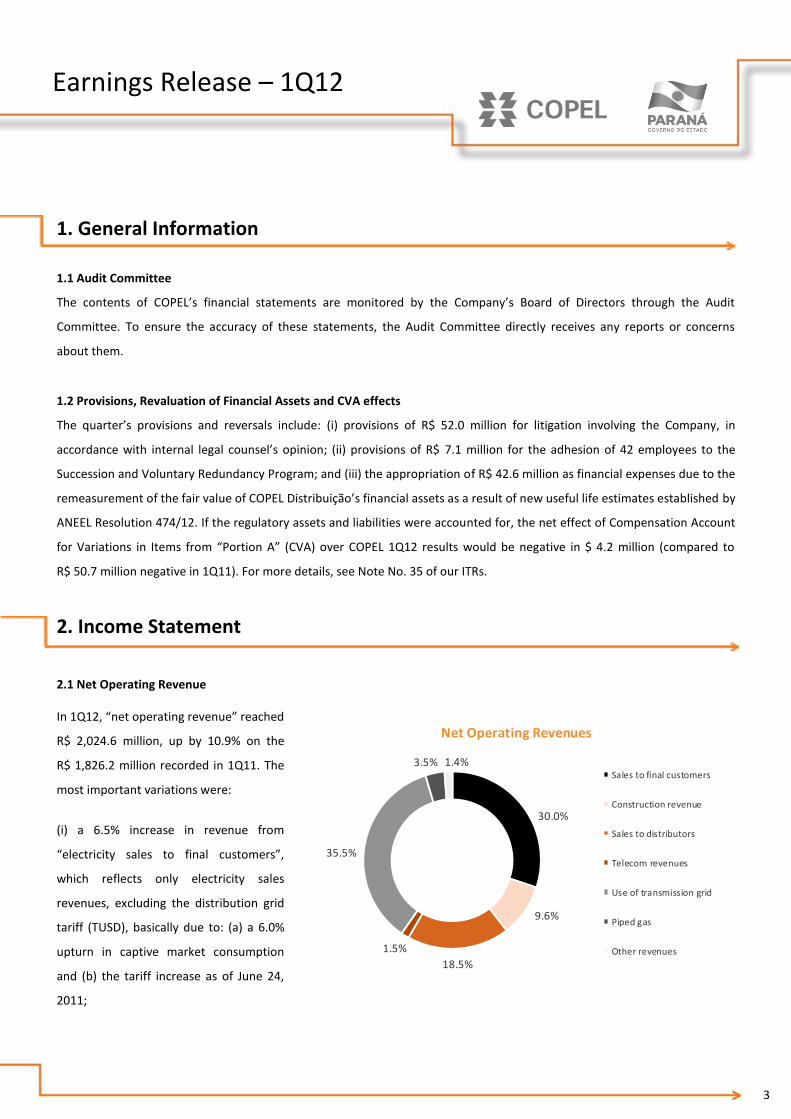
2.1 Net Operating Revenue
In 1Q12, “net operating revenue” reached
R$ 2,024.6 million, up by 10.9% on the
R$ 1,826.2 million recorded in 1Q11. The
most important variations were:
(i) a 6.5% increase in revenue from
“electricity sales to final customers”,
which reflects only electricity sales
revenues, excluding the distribution grid
tariff (TUSD), basically due to: (a) a 6.0%
upturn in captive market consumption
and (b) the tariff increase as of June 24,
2011;
30.0%
9.6%
18.5%
1.5%
35.5%
3.5% 1.4%
Net Operating Revenues
Sales to final customers
Construction revenue
Sales to distributors
Telecom revenues
Use of transmission grid
Piped gas
Other revenues

4
Earnings Release – 1Q12
(ii) a 16.5% increase in revenue from “electricity sales to distributors”, due to (a) increased prices under power purchase
agreements in the regulated market (CCEAR) and bilateral agreements and (b) higher revenue from the spot market (CCEE);
(iii) a 13,5% upturn in “use of the main transmission grid” item (TUSD and TUST revenue), due to: (a) market growth, (b)
Copel Distribuição's period tariff adjustments, and (c) higher interest revenue from transmission assets;
(iv) a 12.7% decline in “construction revenue”, due to the booking of investments in construction services and improvements
to electricity distribution and transmission infrastructure;
(v) a 9.2% upturn in “telecommunications revenue”, thanks to new customers – the customer base increased from 1,088 in
March 2011 to 1,569 in March 2012;
(vi) a 22.6% increase in “distribution of piped gas” (supplied by Compagas), following tariff adjustments (8.5% as of August
2011 and 4.50% as of March 2012) and higher gas sales (7.9% volume increase in the first quarter), mainly to the industrial
segment, which accounted for 49.4% of sales volume; and
(viii) a 43.3% increase in “other operating revenues”, mainly caused by higher revenue from the lease of the Araucária
thermal plant, following contractual adjustments with Petrobras and its dispatch as of March 2012.
R$'000
1Q12 1Q11 Var%
(1) (2) (1/2)
Electricity sales to final customers 608,182 571,175 6.5
Electricity sales to distributors 421,031 361,254 16.5
Use of main transmission grid (TUSD/ TUST) 749,078 659,793 13.5
Construction revenue 105,194 120,566 (12.7)
Telecommunications revenues 30,845 28,239 9.2
Distribution of piped gas 69,833 56,954 22.6
Other operating revenues 40,475 28,249 43.3
Net operating revenues 2,024,638 1,826,230 10.9
Income Statement

5
Earnings Release – 1Q12
2.2 Operating Costs and Expenses
In the first quarter of 2012, operating costs
and expenses totaled R$ 1,580.6 million, an
15.1% increase over the R$ 1,373.1 million
recorded in 1Q11. The main highlights
were:
(I) a 10.8% increase in “electricity
purchased for resale” on account of higher
costs of energy from auctions (CCEAR) and
the spot market (CCEE);
R$'000
Electricity Purchased for Resale1Q12
(1)
1Q11
(2)
Var. %
(1/2)
Itaipu 120,520 110,116 9.4 CCEAR (Auction) 409,639 376,676 8.8 CCEE 49,840 17,312 187.9 Itiquira 33,560 36,803 (8.8)Dona Francisca 16,443 15,905 3.4 Proinfa 33,235 25,661 29.5 (-) Pis/Pasep and Cofins (59,688) (37,652) 58.5
TOTAL 603,549 544,821 10.8
(ii) an 11.8% upturn in “charges for the use of the main transmission grid”, due to the start-up of new assets in the system;
(iii) a 22.7% rise in “personnel and management”, to R$ 227.2 million, driven by: a 4.4% headcount increase, (b) a 7.4% pay
rise as of October 2011, (c) Succession and Voluntary Redundancy Program severance pay (R$ 7.1 million in 1Q12, versus
R$ 1.8 million in 1Q11), and (d) the career structure and compensation revision as of June 1, 2011;
37.2%
14.8%10.6%
16.5%
5.8%
8.7%
6.4%
Operating Costs and Expenses
Electricity purchased
Material and other
Charges for use of grid
Payroll and pension plan
Third-party services
Depreciation
Construction cost

6
Earnings Release – 1Q12
(iv) the balance of “pension and healthcare plans” reflects the accrual of liabilities pursuant to the 2012 actuarial report on
the Healthcare Plan, calculated according to the criteria set by CVM Resolution 600/2009, and the monthly installments of
the two plans; For further details, see Note 20 “post-employment benefits" in our Standardized Financial Statements;
(v) a 26.8% decline in “material and supplies”, mainly reflecting lower purchases of material for the power system;
(vi) “raw material and supplies for electricity production” include expenses with the acquisition of coal for the Figueira
thermal power plant;
(vii) a 44.4% upturn in “natural gas and supplies for the gas business", following the volume increase (7.9% up in 1Q12),
higher prices for the natural gas acquired by Compagas to supply third parties, adjusted mainly due to the effects of the
recent depreciation of the real, and the adjustment of the oil basket, which determines the gas acquisition price;
(viii) a 12.9% increase in “third-party services”, largely due to contractual adjustments and higher expenses with expansion
services (metering, bill delivery, tree pruning, telephony, data processing and transmission, right of way cleaning and other
services);
(ix) the variation in “provisions and reversals” was mainly caused by the reappraisal of the amounts provisioned for litigation
involving the Company, in accordance with legal counsel’s opinion; and
(x) a 14.0% decline in "construction costs”, as a result of investments in power distribution and transmission.
1Q12 1Q11 Var.%
(1) (2) (1/2)
Electricity purchased for resale 603,549 544,821 10.8
Charges for the use of main transmission grid 172,317 154,184 11.8
Personnel and management 227,244 185,269 22.7
Pension and healthcare plans 39,832 31,452 26.6
Material and supplies 15,263 20,864 (26.8)
Raw material and supplies for electricity generation 5,070 6,633 (23.6)
Natural gas and supplies for the gas business 49,801 34,499 44.4
Third-party services 94,641 83,836 12.9
Depreciation and amortization 141,326 133,998 5.5
Provisions and reversals 67,744 (2,234) -
Construction cost 103,322 120,082 (14.0)
Other operating costs and expenses 60,448 59,649 1.3
TOTAL 1,580,557 1,373,053 15.1
Operating Costs and Expenses
R$ '000

7
Earnings Release – 1Q12 2.3 EBITDA
Between January and March, 2012, EBITDA (Earnings Before Interest, Taxes, Depreciation And Amortization) totaled R$ 585.4
million, a 0.3% dip over the R$ 587.2 million recorded in 1Q11.
2.4 Equity in Results of Investees
Equity in investees reflects the gains and losses on the investments in COPEL's investees. In 1Q12, this figure comprised
R$ 14.6 million from Dominó Holdings (Sanepar), R$ 2.5 million from Foz do Chopim Energética, R$ 1.9 million from Dona
Francisca Energética and R$2.1 million loss from Sercomtel Telecom.
2.5 Financial Results
Financial revenues fell by 30.3%, to R$ 128.3 million, due to the cash reduction, to lower interest and inflation in the period,
leading to reduced monetary variation on the transfer of “CRC balance” and concession financial assets, partially offset by
higher interest for late payment on overdue electricity bills.
Financial expenses totaled R$ 113.0 million in 1Q12, 53.4% higher year on year, chiefly due to the appropriation of R$ 42.6
million as a result of the remeasurement of the fair value of Copel Distribuição’s financial assets due to new useful life
estimates, pursuant to Aneel Resolution 474/12.
2.6 Net Income
COPEL recorded net income of R$319.7 million in 1Q12, 16.9% down year on year.
3. Balance Sheet and Investment Program
3.1 Assets
On March 31, 2012, COPEL’s total assets amounted to R$ 19,350.0 million, 1.2% up on the figure recorded on December 31,
2011.
3.1.1 Cash and Cash Equivalents and Financial Investments
On March 31, 2012, the cash, cash equivalents and short-term financial investments of Copel’s wholly-owned subsidiaries
and controlled companies totaled R$ 1,323.5 million and were mostly invested in Bank Deposit Certificates (CDBs),
government bonds and repo transactions. The investments earned an average yield of 101% of the Interbank Deposit
Certificate (CDI) variation in the period.

8
Earnings Release – 1Q12
3.1.2 CRC Transferred to the State of Paraná
Through the fourth addendum signed on January 21, 2005, the Company renegotiated the CRC balance on December 31,
2004 with the State of Paraná at R$ 1,197.4 million, in 244 monthly installments recalculated by the price amortization
system, updated by the IGP-DI inflation index plus annual interest of 6.65%. The first installment was due on January 30,
2005, with subsequent and consecutive maturities. The current CRC balance is R$ 1,342.3 million.
The State of Paraná has been paying the renegotiated installments pursuant to the fourth addendum.
3.1.3 Accounts Receivable related to Concession
Based on the characteristics established in the electricity distribution and transmission concession contracts, management
understands that the conditions for the adoption of Technical Interpretation ICPC-01 – Concession Agreements are met.
ICPC-01 sets forth guidelines on the recognition of public service concessions.
3.1.4 Property, Plant and Equipment
The Company adopted the deemed cost method to determine the fair value of the fixed assets of generation and
telecommunications activities. These fixed assets are depreciated on a straight-line basis, based on the annual rates
established by Aneel, practiced and accepted by the market as appropriate, limited to the concession term, when applicable.
The estimate useful life, residual values and depreciation are reviewed on the closing balance sheet date and the effect of
any changes in the estimates is prospectively recognized.
3.1.5 Intangible Assets
This line mostly comprises the intangible assets arising from Copel Distribuição’s concession agreements, consisting of
exploration rights of construction and electricity supply services, which will be recovered by billing customers.
3.2 Liabilities and Controller’s Shareholders’ Equity
COPEL’s consolidated debt totaled R$ 2,192.2 million on March 31, 2012, representing a debt/equity ratio of 18.1%.
The controller’s shareholders’ equity came to R$ 12,136.3 million in 1Q12, 2.6% higher than on December 31, 2011 and
equivalent to R$ 44.35 per share (book value per share).

9
Earnings Release – 1Q12
3.2.1 Debt Profile
The breakdown of the balances of loans and financing is shown in the table below:
R$'000
Short-term Long-term Total
National Treasury 5,016 52,400 57,416
Eletrobras 5 11 16
Total 5,021 52,411 57,432
Eletrobras - COPEL 45,925 204,571 250,496
FINEP 1,966 3,416 5,382
BNDES/ Banco do Brasil S/A - Mauá 10,328 379,103 389,431
Banco do Brasil S/A and other 10,134 1,479,346 1,489,480
Total 68,353 2,066,436 2,134,789
TOTAL 73,374 2,118,847 2,192,221
Foreign Currency
Domestic Currency
Loan and financing maturities are presented below:
R$'000
Apr/13 - Dec/13 2014 2015 2016 After 2016
Domestic Currency 68,353 696,598 406,933 564,899 58,133 339,873
Foreign Currency 5,021 2,446 1,225 - - 48,740
TOTAL 73,374 699,044 408,158 564,899 58,133 388,613
Short-Term
Apr/12 - Mar/13
Long-Term
Copel’s consolidated net debt (loans and financing less cash) trends are shown below:
1,312
912
1,193
562
51
(215) (407)
541
869
-0.5
0.0
0.5
1.0
1.5
2.0
(500)
(200)
100
400
700
1,000
1,300
2004 2005 2006 2007 2008 2009 2010 2011 1Q2
tim
es
R$
mil
lio
n
Net Debt Net Debt/EBITDA
10
Earnings Release – 1Q12
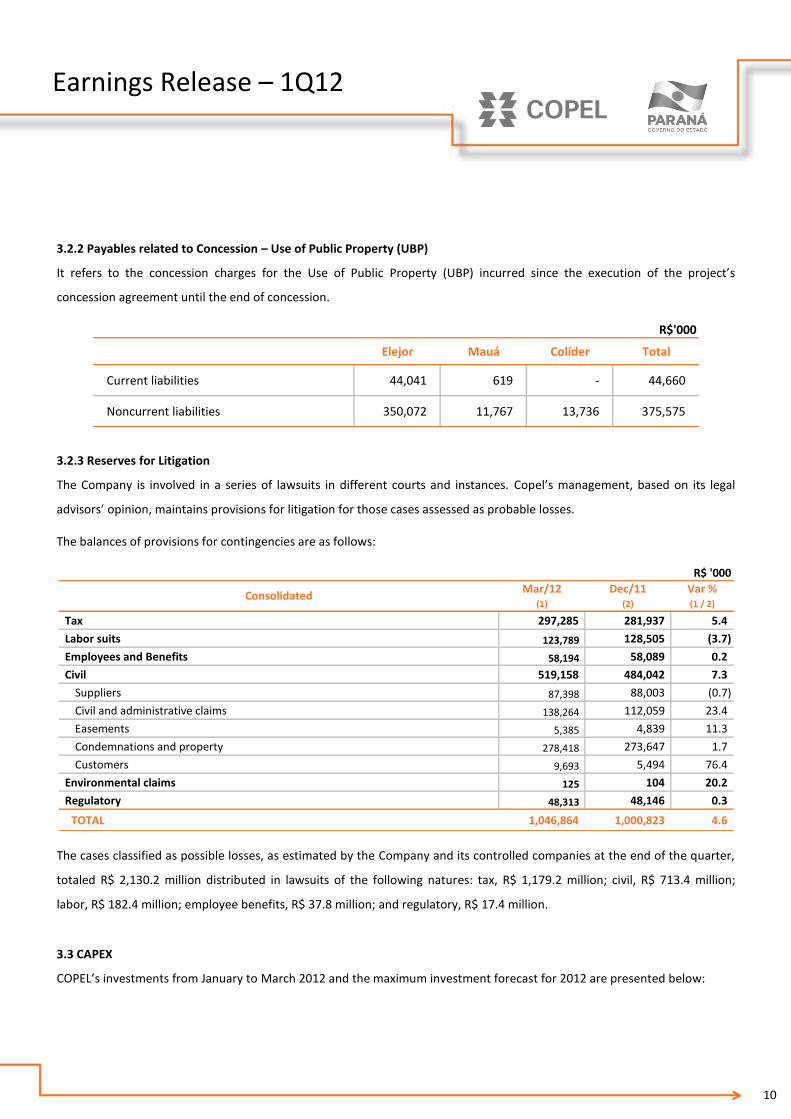
3.2.2 Payables related to Concession – Use of Public Property (UBP)
It refers to the concession charges for the Use of Public Property (UBP) incurred since the execution of the project’s
concession agreement until the end of concession.
R$'000
Elejor Mauá Colíder Total
Current liabilities 44,041 619 - 44,660
Noncurrent liabilities 350,072 11,767 13,736 375,575
3.2.3 Reserves for Litigation
The Company is involved in a series of lawsuits in different courts and instances. Copel’s management, based on its legal
advisors’ opinion, maintains provisions for litigation for those cases assessed as probable losses.
The balances of provisions for contingencies are as follows:
Mar/12 Dec/11 Var %(1) (2) (1 / 2)
Tax 297,285 281,937 5.4
Labor suits 123,789 128,505 (3.7)
Employees and Benefits 58,194 58,089 0.2
Civil 519,158 484,042 7.3
Suppliers 87,398 88,003 (0.7)
Civil and administrative claims 138,264 112,059 23.4
Easements 5,385 4,839 11.3
Condemnations and property 278,418 273,647 1.7
Customers 9,693 5,494 76.4
Environmental claims 125 104 20.2
Regulatory 48,313 48,146 0.3
TOTAL 1,046,864 1,000,823 4.6
R$ '000
Consolidated
The cases classified as possible losses, as estimated by the Company and its controlled companies at the end of the quarter,
totaled R$ 2,130.2 million distributed in lawsuits of the following natures: tax, R$ 1,179.2 million; civil, R$ 713.4 million;
labor, R$ 182.4 million; employee benefits, R$ 37.8 million; and regulatory, R$ 17.4 million.
3.3 CAPEX
COPEL’s investments from January to March 2012 and the maximum investment forecast for 2012 are presented below:

11
Earnings Release – 1Q12
Carried out Scheduled 1Q12 2012
Generation and Transmission 238.3 1,069.9
UHE Mauá 42.7 89.1
UHE Colider 151.1 562.4
PCH Cavernoso II 21.1 50.6
Other 23.4 367.8
Distribution 132.6 1,105.0
Telecommunications 7.8 82.5
TOTAL 378.7 2,257.4
R$ million
Copel’s estimated investments in new businesses in 2012 (São Bento Energia, Cutia Empreendimentos Eólicos, Costa Oeste
Transmissora, Marumbi Transmissora, Transmissora Sul Brasileira, Caiuá Transmissora and Integração Maranhense
Transmissora) total R$ 136.6 million.
4. Shareholding Structure
On March 31, 2012, paid-up capital stock totaled R$ 6,910.0 million, composed of the following shares (with no par value)
and main shareholders:
Thousand shares
State of Paraná 85,029 58.6 - - 14 - 85,043 31.1
BNDESPAR 38,299 26.4 - - 27,282 21.3 65,581 24.0
Eletrobras 1,531 1.1 - - - - 1,531 0.6
Free Floating 19,621 13.5 129 33.7 100,904 78.7 120,654 44.1
BM&FBovespa 19,502 13.4 129 33.7 58,778 45.8 78,409 28.7
NYSE 119 0.1 - - 42,042 32.8 42,161 15.4
LATIBEX - - - - 84 0.1 84 -
Other 551 0.4 255 66.3 40 - 846 0.2
TOTAL 145,031 100.0 384 100.0 128,240 100.0 273,655 100.0
% % Preferred "B" % TOTAL Shareholders Common % Preferred "A"
58.6%
26.4%
1.1%
13.5% 0.4%
Common
State of Paraná
BNDESPAR
Eletrobras
Free Floating
Other
21.2%
78.5%
0.3%
Preferred
BNDESPAR
Free Floating
Other
31.1%
24.0%0.6%
44.1%
0.2%
TOTAL
Estado do Paraná
BNDESPAR
Eletrobras
Custódia da Bolsa
Outros

12
Earnings Release – 1Q12
5. Consolidated Financial Statements
5.1 Assets
(1) (2) (1/2)
CURRENT 3,582,427 3,702,013 (3.2)
Cash and cash equivalents 820,998 1,049,125 (21.7)
Financial investments 502,544 584,687 (14.0)
Customers 1,470,130 1,368,366 7.4
Dividends receivable 17,906 17,906 -
CRC transferred to the State of Paraná 67,090 65,862 1.9
Receivables related to concession 90,455 80,626 12.2
Other receivables 223,926 161,313 38.8
Inventories 109,146 103,802 5.1
Income tax and social contribution 212,666 215,381 (1.3)
Other current taxes recoverable 52,980 50,357 5.2
Prepaid expenses 14,586 4,588 217.9
NONCURRENT 15,767,597 15,419,650 2.3
Long-Term Assets 6,148,894 5,939,512 3.5
Financial investments 114,681 100,142 14.5
Customers 34,466 32,452 6.2
CRC transferred to the State of Paraná 1,275,193 1,280,598 (0.4)
Judicial deposits 495,072 430,817 14.9
Receivables related to concession 3,329,735 3,236,474 2.9
Other receivables 33,240 17,223 93.0
Income tax and social contribution 19,568 18,714 4.6
Other current taxes recoverable 76,865 77,912 (1.3)
Deferred income tax and social contribution 770,074 745,180 3.3
Investments 571,737 549,158 4.1
Property, plant and equipment 7,342,692 7,209,123 1.9
Intangible assets 1,704,274 1,721,857 (1.0)
TOTAL 19,350,024 19,121,663 1.2
Var.%
R$'000
Assets Mar/12 Dec/11

13
Earnings Release – 1Q12
5.2 Liabilities
R$'000
Mar/12 Dec/11 Var.%
(1) (2) (1/2)
CURRENT 1,857,567 2,058,821 (9.8)
Accrued payroll costs 225,661 224,095 0.7
Suppliers 701,477 747,453 (6.2)
Income tax and social contribution 87,976 151,790 (42.0)
Other taxes payable 244,179 288,457 (15.3)
Loans and financing 73,374 116,487 (37.0)
Dividends payable 135,744 135,744 -
Post-employment benefits 21,815 36,037 (39.5)
Regulatory charges 67,201 70,511 (4.7)
Research and development and energy efficiency 157,005 156,915 0.1
Payables related to concession - use of public property 44,660 44,656 -
Other accounts payable 98,475 86,676 13.6
NON-CURRENT 5,107,654 4,993,314 2.3
Suppliers 96,976 108,462 (10.6)
Tax liabilities 34 152 (77.6)
Deferred income tax and social contribution 913,641 927,910 (1.5)
Loans and financing 2,118,847 2,057,985 3.0
Post-employment benefits 445,180 432,838 2.9
Research and development and energy efficiency 110,481 94,649 16.7
Payables related to the concession - use of public property 375,575 370,442 1.4
Other accounts payable 56 53 5.7
Reserve for litigation 1,046,864 1,000,823 4.6
SHAREHOLDERS' EQUITY 12,384,803 12,069,528 2.6
Attributed to controlling shareholders 12,136,349 11,826,694 2.6
Stock capital 6,910,000 6,910,000 -
Valuation adjustments 1,425,967 1,457,081 (2.1)
Legal reserves 536,187 536,187 -
Profit reserves 2,838,551 2,838,551 -
Proposed additional dividends 84,875 84,875 -
Accrued earnings 340,769 - -
Attributed to minority shareholders 248,454 242,834 2.3
TOTAL 19,350,024 19,121,663 1.2
Liabilities

14
Earnings Release – 1Q12
5.3 Income Statement
R$'000
OPERATING REVENUES 2,024,638 1,826,230 10.9
Electricity sales to final customers 608,182 571,175 6.5
Electricity sales to distributors 421,031 361,254 16.5
Use of main transmission grid (TUSD and TUST) 749,078 659,793 13.5
Construction revenue 105,194 120,566 (12.7)
Telecommunications revenues 30,845 28,239 9.2
Distribution of piped gas 69,833 56,954 22.6
Other operating revenues 40,475 28,249 43.3
Operating costs and expenses (1,580,557) (1,373,053) 15.1
Electricity purchased for resale (603,549) (544,821) 10.8
Use of main transmission grid (172,317) (154,184) 11.8
Personnel and management (227,244) (185,269) 22.7
Pension and healthcare plans (39,832) (31,452) 26.6
Material and supplies (15,263) (20,864) (26.8)
Raw material and supplies for electricity generation (5,070) (6,633) (23.6)
Natural gas and supplies for the gas business (49,801) (34,499) 44.4
Third-party services (94,641) (83,836) 12.9
Depreciation and amortization (141,326) (133,998) 5.5
Provisions and reversals (67,744) 2,234 -
Construction cost (103,322) (120,082) (14.0)
Other operating costs and expenses (60,448) (59,649) 1.3
EQUITY IN RESULTS OF INVESTEES 16,847 14,600 15.4
INCOME BEFORE FINANCIAL RESULTS AND TAXES 460,928 467,777 (1.5)
FINANCIAL RESULTS 15,286 110,360 (86.1)
Financial income 128,306 184,029 (30.3)
Financial expenses (113,020) (73,669) 53.4
OPERATING INCOME (EXPENSES) 476,214 578,137 (17.6)
INCOME TAX AND SOCIAL CONTRIBUTION (156,469) (193,308) (19.1)
Income tax and social contribution (193,330) (274,966) (29.7)
Deferred income tax and social contribution 36,861 81,658 (54.9)
NET INCOME (LOSS) 319,745 384,829 (16.9)
Attributed to the Company's controlling shareholders 314,125 379,481 (17.2)
Attributed to minority shareholders 5,620 5,348 5.1
EBITDA 585,407 587,175 (0.3)
Income Statementvar %
(1/2)
1Q12
(1)
1Q11
(2)

15
Earnings Release – 1Q12
5.4 Cash Flow
Consolidated Cash Flow 1Q12 1Q11
Cash flow from operating activities
Net income for the period 319,746 384,829
Adjustments to reconcile net income with the cash provided by operating activities 401,709 238,533 Depreciation 84,955 82,347 Amortization of intangible assets - concession 55,714 51,131 Amortization of intangible assets - other 474 337 Amortization of investiments - concession 183 183 Unrealized monetary and exchange variations, net 26,038 (20,863) Accounts receivable tied to the concession fair value´s update 42,569 -Remuneration of accounts receivable related to the concession (79,219) (106,771)
Equity in the results of investees (16,847) (14,600)
Income Tax and Social Contribution 193,330 274,966
Deferred Income Tax and Social Contribution (37,020) (81,658)
Provision for doubtful accounts 15,413 5,093
Provision for tax credit losses (331) -
Reserve for contingencies 52,663 (7,327)
Provisions for post-employment benefits 42,772 33,179
Provision for research and development and energy efficiency 18,999 16,415
Loss on disposal of accounts receivables related to concession 1,630 5,333
Results on disposal of property, plant, and equipment 43 388
Results on disposal of intangible 343 380
Reduction (increase) of assets (160,150) 17,192
Increase (reduction) of liabilities (502,272) (444,784)
Net cash generated by operating activities 59,033 195,770
Cash flow from investing activities
Financial investments 61,166 73,607
Loans to related parties (13,967) -
Additions in investments (6,872) (111)
Additions to property, plant, and equipment: (216,800) (123,640)
Additions to intangible assets related to concessions (147,277) (140,337)
Additions to other intangible (1,331) (2,205)
Customer contributions 2,054 18,144
Net cash generated (used) by investing activities (323,027) (174,542)
Cash flow from financing activities
Payment of capital in affiliates by noncontrolling shareholders - (9,024)
Loans and financing obtained 44,723 284
Amortization of principal amounts of loans and financing (8,856) (14,980)
Dividends and interest on capital paid - (4)
Net cash used by financing activities 35,867 (23,724)
Increase (decrease) in cash and cash equivalents (228,127) (2,496)
Cash and cash equivalents at the beginning of the period 1,049,125 1,794,416
Cash and cash equivalents at the end of the period 820,998 1,791,920
Variation in cash and cash equivalents (228,127) (2,496)
R$'000

16
Earnings Release – 1Q12
6. Financial Statements – Wholly-Owned Subsidiaries
6.1 Assets
R$'000
Assets GeT DIS TEL
CURRENT 991,795 2,165,732 47,957
Cash and cash equivalents 135,645 563,901 11,484
Financial investment 344,611 28,947 -
Customers 299,093 1,157,203 18,101
Dividends receivable 717 - -
CRC transferred to the State of Paraná - 67,090 -
Accounts receivable related to the concession 90,455 - -
Other receivables 90,680 119,849 1,988
Inventories 23,997 74,108 9,443
Income Tax and Social Contribution 2,294 95,928 3,267
Other current taxes recoverable 3,007 46,092 3,469
Prepaid expenses 1,296 12,614 205
NONCURRENT 7,849,184 5,629,472 314,800
Long-Term Assets 1,310,647 4,397,365 18,686
Financial investment 63,942 50,739 -
Customers - 34,377 89
CRC transferred to the State of Paraná - 1,275,193 -
Judicial deposits 20,122 250,252 1,024
Receivables related to concession 1,038,521 2,291,146 -
Other receivables 2,366 18,927 -
Other current taxes recoverable 1,774 62,683 8,628
Deferred Income tax and social contribution 183,922 414,048 8,945
Investments 388,450 4,012 -
Property, Plant and Equipment 6,109,960 - 279,253
Intangible Assets 40,127 1,228,095 16,861
TOTAL 8,840,979 7,795,204 362,757
GeT: COPEL Geração e Transmissão, DIS: COPEL Distribuição, TEL: COPEL Telecomunicações

17
Earnings Release – 1Q12
6.2 Liabilities
Liabilities GeT DIS TEL
CURRENT 963,520 1,687,568 47,458
Accrued payroll costs 54,228 154,379 13,487
Suppliers 201,749 497,387 8,913
Income Tax and Social Contribution 67,980 11,128 -
Other taxes payable 16,615 211,563 3,253
Loans and financing 44,890 18,566 -
Dividends payable 523,130 508,695 20,649
Post-employment benefits 5,893 15,183 739
Regulatory charges 4,535 62,666 -
Research and development and energy efficiency 13,944 141,156 -
Payables related to concession - use of public property 619 - -
Other accounts payable 29,937 66,845 417
NON-CURRENT 1,970,008 2,333,135 41,741
Intercompany receivables - 808,452 23,000
Suppliers 106,085 - -
Deferred income tax and social contribution 820,019 55,360 -
Loans, and financing 488,573 717,487 -
Post-employment benefits 121,274 304,268 18,433
Research and development and energy efficiency 37,550 72,931 -
Payables related to the concession - use of public property 25,503 - -
Reserve for litigation 371,004 374,637 308
SHAREHOLDERS' EQUITY 5,907,451 3,774,501 273,558
Attributed to controlling shareholders
Capital stock 3,505,994 2,624,841 194,755
Valuation adjustments 1,415,001 2,650 -
Legal Reserves 212,108 135,294 5,306
Profit reserves 145,364 883,575 62,685
Proposed additional dividends 435,578 13,468 1,994
Accrued earnings (losses) 193,406 114,673 8,818
TOTAL 8,840,979 7,795,204 362,757
R$'000
GeT: COPEL Geração e Transmissão, DIS: COPEL Distribuição, TEL: COPEL Telecomunicações

18
Earnings Release – 1Q12
6.3 Income Statement
Income Statement GeT DIS TEL
Operating revenues 529,608 1,426,698 41,677
Electricity sales to final customers 28,700 580,188 -
Electricity sales to distributors 389,967 55,163 -
Use of main transmission grid (TUSD/TUST) 89,121 685,116 -
Construction revenue 12,459 88,287 -
Telecommunications - - 40,535
Other operating revenues 9,361 17,944 1,142
Operating costs and expenses (289,029) (1,269,908) (28,635)
Electricity purchase for resale (25,699) (651,139) -
Use of main transmission grid (51,950) (138,727) -
Personel and management (52,242) (155,688) (12,840)
Pension and healthcare plans (9,842) (27,597) (1,956)
Material and supplies (3,618) (10,464) (859)
Raw material and supplies for electricity generation (4,552) - -
Third-party services (18,850) (75,869) (4,248)
Depreciation and amortization (65,163) (50,380) (6,655)
Provisions and reversals (11,255) (51,563) (276)
Construction cost (10,587) (88,287) -
Other operating costs and expenses (35,271) (20,194) (1,801)
Equity in results of investees 1,514 - -
Income before financial results and taxes 242,093 156,790 13,042
Financial Income (expenses) 9,063 17,547 526
Earnings before income taxes 251,156 174,337 13,568
Operating income (91,686) (82,555) (5,384)
Deferred income tax and social contribution 7,440 22,890 634
Net Income 166,910 114,672 8,818
EBITDA 305,742 207,170 19,697
R$'000
GeT: COPEL Geração e Transmissão, DIS: COPEL Distribuição, TEL: COPEL Telecomunicações

19
Earnings Release – 1Q12
7. Power Market
7.1 Captive Market
Copel’s electricity sales to final customers, composed by sales from Copel Distribuição captive market and Copel Geração e
Transmissão free market increased 7.3% between January and March of 2012. The captive market consumed 5,912 GWh,
growing by 6.0%, while Copel’s GeT free market has grown 37.8%, reaching 319 GWh in the same period.
The industrial segment consumed 1,835 GWh, growing by 4.0% year to date. This result reflected (i) the higher industrial
production in the State of Paraná, especially in the edition and printing, oil refining and production of ethanol, wood and
food sectors, and (ii) the number of customers expansion due to reclassifications made in the period. At the end of March,
this segment represented 31.0% of Copel’s captive market consumption, with the company supplying power to 82,849
captive industrial customers.
The residential segment consumed 1,654 GWh, a growth of 6.5%, fueled by the higher credit and income growth. At the end
of March 2012, this segment represented 28.0% of Copel’s captive market consumption, with the company supplying power
to 3,119,325 residential customers.
The commercial segment consumed 1,324 GWh, a growth of 7.3%, due to increasing sales from retailers in the concession
area. At the end of the period, this segment represented 22.4% of Copel’s captive market consumption, with the company
supplying power to 321,446 captive commercial customers.
The rural segment consumed 553 GWh, growing by 9.6%, due to the higher agricultural output in the State of Paraná and
reclassifications on the captive customers base in the period. This segment represented 9.4% of Copel’s captive market
consumption at the end of the period, with the company supplying power to 377,079 rural customers.
Other segments (public agencies, public lighting, public services and own consumption) consumed 546 GWh, up 4.9% in the
period. These segments represented 9.2% of Copel’s captive market consumption, totaling 52,008 customers at the end of
the period.
The following table shows captive market trends by consumption segment:
1Q12 1Q11 Var. %
(1) (2) (1/2)
Industrial 1,835 1,765 4.0
Residential 1,654 1,553 6.5
Commercial 1,324 1,234 7.3
Rural 553 505 9.6
Other 546 520 4.9
Captive Segment Total 5,912 5,577 6.0
Segment
GWh

20
Earnings Release – 1Q12
7.2 Copel Distribuição’s Grid Market – TUSD
Copel Distribuição’s grid market, comprising the captive market, concessionaires and licensees (other utilities within the
State of Paraná) and all free customers within the Company’s concession area, grew by 3.0%, as shown in the following table:
1Q12 1Q11 Var.%
(1) (2) (1/2)
Captive Market 5,912 5,577 6.0
Concession/permission holders 155 146 6.5
Free Customers (*) 652 804 (18.9)
Grid Market 6,719 6,527 3.0
* Total free customers supplied by COPEL GET and other suppliers within COPEL DIS’ concession area.
GWh
7.3 Energy Flow
Copel Consolidated
GWh
1Q12 1Q11 Var.%
Own Generation 4,780 7,470 (36.0)
Purchased energy 7,660 6,967 9.9
Itaipu 1,295 1,297 (0.2)
Auction – CCEAR 4,931 4,517 9.2
Itiquira 231 227 1.8
Dona Francisca 153 156 (1.9)
CCEE (MCP) 304 354 (14.1)
MRE 302 - -
Proinfa 148 123 20.3
Elejor 296 293 1.0
Total Available Power 12,440 14,437 (13.8)
Captive Market 5,912 5,577 6.0
Concessionaires 155 146 6.2
Free Customers 319 231 -
Bilateral Agreements 249 266 (6.4)
Auction – CCEAR 3,859 3,888 (0.7)
CCEE (MCP) 5 24 -
MRE 900 3,210 (72.0)
Losses and differences 1,041 1,095 (4.9)
Basic network losses 284 345 (17.7)
Distribution losses 690 686 0.6
CG contract allocation 67 64 4.7
Amounts subject to changes after settlement by CCEE
CCEAR: Energy Purchase Agreements in the Regulated Market
MRE: Energy Reallocation Mechanism
CCEE (MCP): Electric Pow er Trade Chamber (Short-term market)
CG: Center of gravity of the Submarket (difference betw een billed and energy received from CG)
21
Earnings Release – 1Q12
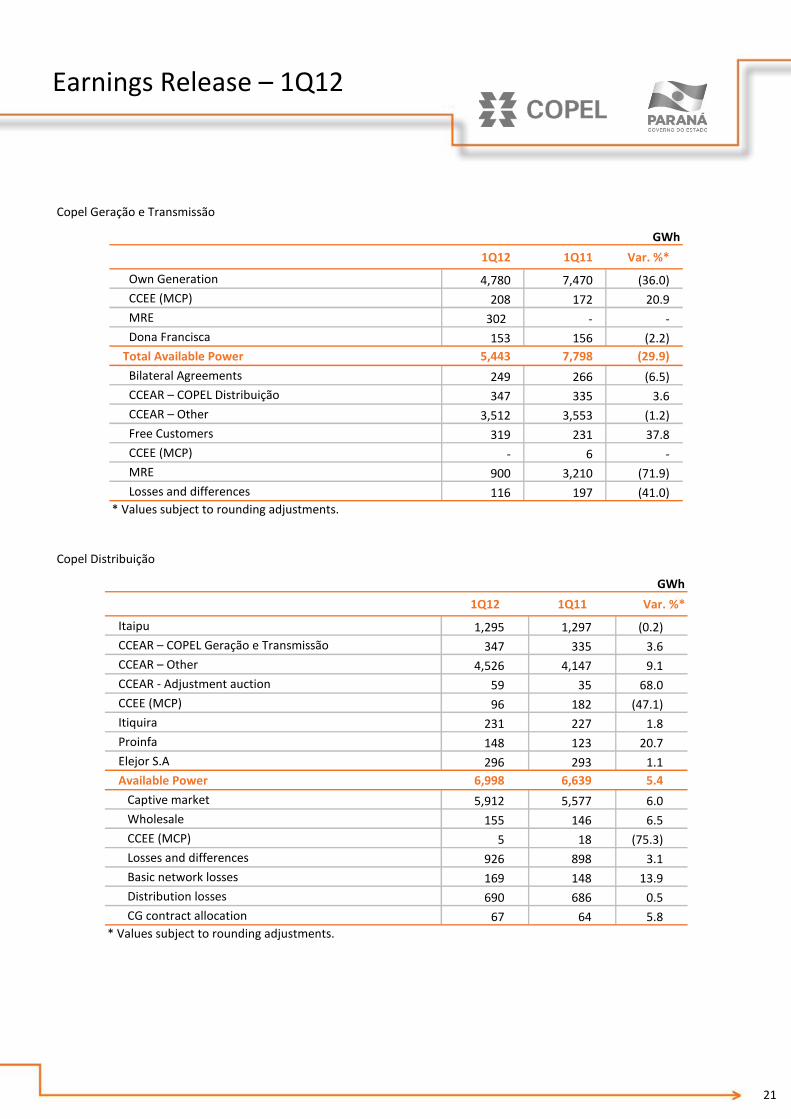
Copel Geração e Transmissão
GWh
1Q12 1Q11 Var. %*
Own Generation 4,780 7,470 (36.0)
CCEE (MCP) 208 172 20.9
MRE 302 - -
Dona Francisca 153 156 (2.2)
Total Available Power 5,443 7,798 (29.9)
Bilateral Agreements 249 266 (6.5)
CCEAR – COPEL Distribuição 347 335 3.6
CCEAR – Other 3,512 3,553 (1.2)
Free Customers 319 231 37.8
CCEE (MCP) - 6 -
MRE 900 3,210 (71.9)
Losses and differences 116 197 (41.0)
* Values subject to rounding adjustments.
Copel Distribuição
GWh
1Q12 1Q11 Var. %*
Itaipu 1,295 1,297 (0.2)
CCEAR – COPEL Geração e Transmissão 347 335 3.6
CCEAR – Other 4,526 4,147 9.1
CCEAR - Adjustment auction 59 35 68.0
CCEE (MCP) 96 182 (47.1)
Itiquira 231 227 1.8
Proinfa 148 123 20.7
Elejor S.A 296 293 1.1
Available Power 6,998 6,639 5.4
Captive market 5,912 5,577 6.0
Wholesale 155 146 6.5
CCEE (MCP) 5 18 (75.3)
Losses and differences 926 898 3.1
Basic network losses 169 148 13.9
Distribution losses 690 686 0.5
CG contract allocation 67 64 5.8
* Values subject to rounding adjustments.
22
Earnings Release – 1Q12
8. Supplementary Information
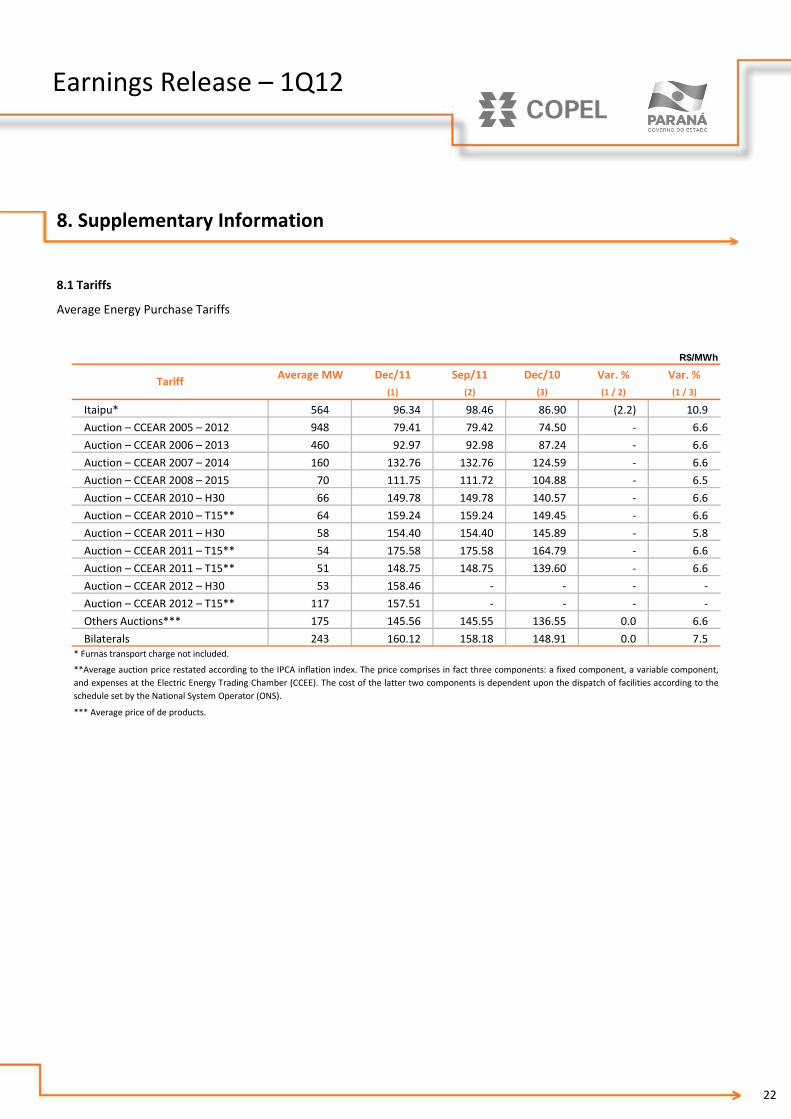
8.1 Tariffs
Average Energy Purchase Tariffs
R$/MWh
Average MW Dec/11 Sep/11 Dec/10 Var. % Var. %
(1) (2) (3) (1 / 2) (1 / 3)
Itaipu* 564 96.34 98.46 86.90 (2.2) 10.9
Auction – CCEAR 2005 – 2012 948 79.41 79.42 74.50 - 6.6
Auction – CCEAR 2006 – 2013 460 92.97 92.98 87.24 - 6.6
Auction – CCEAR 2007 – 2014 160 132.76 132.76 124.59 - 6.6
Auction – CCEAR 2008 – 2015 70 111.75 111.72 104.88 - 6.5
Auction – CCEAR 2010 – H30 66 149.78 149.78 140.57 - 6.6
Auction – CCEAR 2010 – T15** 64 159.24 159.24 149.45 - 6.6
Auction – CCEAR 2011 – H30 58 154.40 154.40 145.89 - 5.8
Auction – CCEAR 2011 – T15** 54 175.58 175.58 164.79 - 6.6
Auction – CCEAR 2011 – T15** 51 148.75 148.75 139.60 - 6.6
Auction – CCEAR 2012 – H30 53 158.46 - - - -
Auction – CCEAR 2012 – T15** 117 157.51 - - - -
Others Auctions*** 175 145.56 145.55 136.55 0.0 6.6
Bilaterals 243 160.12 158.18 148.91 0.0 7.5* Furnas transport charge not included.
Tariff
**Average auction price restated according to the IPCA inflation index. The price comprises in fact three components: a fixed component, a variable component,
and expenses at the Electric Energy Trading Chamber (CCEE). The cost of the latter two components is dependent upon the dispatch of facilities according to the
schedule set by the National System Operator (ONS).
*** Average price of de products.

23
Earnings Release – 1Q12
Average Tariffs for Electricity Sales to Final Customers
R$/MWh
Dec/11 Dec/11 Mar/11 Var. % Var. %
(1) (2) (3) (1 / 2) (1 / 3)
Industrial* 211.24 219.71 206.67 (3.9) 2.2
Residential 299.49 296.51 293.67 1.0 2.0
Commercial 263.58 267.77 256.69 (1.6) 2.7
Rural 177.02 177.98 173.65 (0.5) 1.9
Other 206.18 205.29 201.51 0.4 2.3
Retail distribution average rate 243.60 246.79 237.73 (1.3) 2.5
* Free customers not included
Tariff
Without ICMS
Average Tariffs for Electricity Sales to Distributors
R$/MWh
Average MW Dec/11 Dec/11 Mar/11 Var. % Var. %
(1) (2) (3) (1 / 2) (1 / 3)
Auction CCEAR 2005 - 2012 907 79.41 79.28 74.48 0.2 6.6
Auction CCEAR 2006 - 2013 353 93.27 93.14 87.52 0.1 6.6
Auction CCEAR 2007 - 2014 80 104.37 104.24 97.77 0.1 6.8
Auction CCEAR 2008 - 2015 81 110.66 110.46 103.81 0.2 6.6
Auction CCEAR 2009 - 2016 250 126.40 126.37 118.50 - 6.7
Concession holders in the State of Paraná 71 132.46 135.19 133.95 (2.0) (1.1)
Tariff
24
Earnings Release – 1Q12
8.2 Main Operational and Financial Indicators
March 31, 2012
Generation Copel GeT power plants 19 (17 hydro, 1 thermal and 1 wind)
Power plants in which Copel holds an interest 6 (5 hydro and 1 thermal plant)
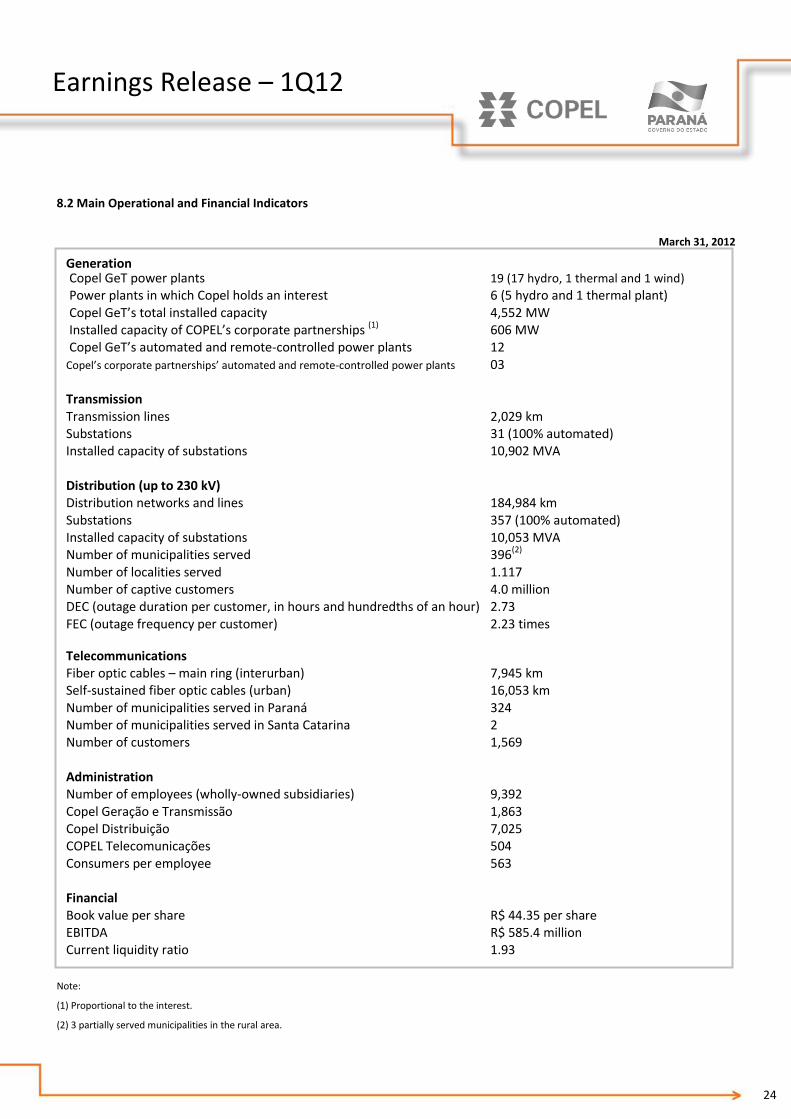
Copel GeT’s total installed capacity 4,552 MW Installed capacity of COPEL’s corporate partnerships (1) 606 MW Copel GeT’s automated and remote-controlled power plants 12 Copel’s corporate partnerships’ automated and remote-controlled power plants 03 Transmission Transmission lines 2,029 km Substations 31 (100% automated) Installed capacity of substations 10,902 MVA Distribution (up to 230 kV) Distribution networks and lines 184,984 km Substations 357 (100% automated) Installed capacity of substations 10,053 MVA Number of municipalities served 396(2) Number of localities served 1.117 Number of captive customers 4.0 million DEC (outage duration per customer, in hours and hundredths of an hour) 2.73 FEC (outage frequency per customer) 2.23 times Telecommunications Fiber optic cables – main ring (interurban) 7,945 km Self-sustained fiber optic cables (urban) 16,053 km Number of municipalities served in Paraná 324 Number of municipalities served in Santa Catarina 2 Number of customers 1,569 Administration Number of employees (wholly-owned subsidiaries) 9,392 Copel Geração e Transmissão 1,863 Copel Distribuição 7,025 COPEL Telecomunicações 504 Consumers per employee 563 Financial Book value per share R$ 44.35 per share EBITDA R$ 585.4 million Current liquidity ratio 1.93
Note:
(1) Proportional to the interest.
(2) 3 partially served municipalities in the rural area.

25
Earnings Release – 1Q12
8.3 1Q12 Results Conference Call
Copel will hold its 1Q12 results conference call on May 18, 2012, at 10:00 a.m. (US EST).
Telephone: (+1 516) 300 1066
Code: COPEL
A live webcast of the conference call will be available on www.copel.com/ir
Please connect 15 minutes before the call.
Investor Relations – COPEL
Telephone: (+55 41) 3222-2027
Fax: (+55 41) 3331-2849
The information contained in this press release may contain forward-looking statements that reflect the management’s current view and
estimates of future economic circumstances, industry conditions, company performance, and financial results. Any statements,
expectations, capabilities, plans and assumptions contained in this press release that do not describe historical facts such as statements
regarding the declaration or payment of dividends, the direction of future operations, the implementation of relevant operating and
financing strategies, the investment program, factors or trends affecting the Company’s financial condition, liquidity or results of operations
are forward-looking statements within the meaning of the U.S. Private Securities Litigation Reform Act of 1995 and involve a number of
risks and uncertainties. There is no guarantee that these results will actually occur. The statements are based on many assumptions and
factors, including general economic and market conditions, industry conditions and operating factors. Any changes in such assumptions or
factors could cause actual results to differ materially from current expectations.