paperclipsimulation:& &a&simple&system&
TRANSCRIPT

Teacher Guide 1 of 25 Paper Clip Simulation © 2011 A collaborative project between the University of New Hampshire, Charles University and the GLOBE Program Office.
Paper Clip Simulation: A Simple System
Purpose • To explore the essential components of a simple system and model by using a simulation activity in which students enact the parts of a paper clip manufacturing business.
• To collect and analyze data produced during the simulation and translate the data into a 1-‐box model that can be manipulated to produce varying outcomes.
Overview Through a simulation activity in which students act out the paper clip manufacturing system, students will take part in one part of a simple system. As a result of the simulation, students will identify and analyze the basic parts of a simple system and model including inputs, outputs, and stocks. Student Outcomes Students will be able to: • Simulate a basic system • Collect and record data in tables and graphs
• Analyze data and describe patterns using qualitative descriptions and mathematical equations
• Create a 1-‐box model to learn modeling and system terms
• Manipulate variables to obtain an expected outcome Content Question
• How does the paper clip simulation represent a simple system and model?
Time 60 to 90 minutes. Level Secondary (Middle & High School) Science Concepts Scientific Inquiry • Think critically and logically to make the relationships between evidence and explanations.
• Communicate scientific procedures and explanations
• Use technology and mathematics to improve investigations and communications.
History and Nature of Science • Scientists formulate and test their explanations of nature using observation, experiments, and theoretical and mathematical models.
Materials and Tools • 5-‐10 boxes of paper clips • Copies of Paper Clip Simulation Data Table
• Overhead projector & wet erase pens OR computer and LCD projector (with spreadsheet capability)
• White board/large paper & markers • Bell or whistle • Paper Clip Roles: factory worker (5-‐9), store worker (5), and customer (5-‐9)-‐ One copy (of any role) per student
• Open and closed sign for store • Copies of Student Worksheets Prerequisites • Recording data in tables

Teacher Guide 2 of 25 Paper Clip Simulation © 2011 A collaborative project between the University of New Hampshire, Charles University and the GLOBE Program Office.
Background All systems consist of a set of interacting components that, together, form a more unified entity. As an example, an engine, wheels, brakes, transmission and chassis interact together to form a system we identify as a car. In the environment, systems tend to be very intricate because the number of components is often large and the ways in which they interact are complex. To deal with this complexity, scientists often simplify environmental systems by lumping multiple components together and treating them as individual 'pools' and treating the transfer of materials between them as 'fluxes.'
Pools, also known as stocks or reservoirs, represent any place where a given substance can reside. In the carbon cycle, examples of individual pools might include soils, leaves, wood, whole trees and ecosystems or the entire biosphere. Note that these examples overlap and that carbon pools can be grouped together or treated separately. Carbon in trees can be considered a single pool, or it can be divided into leaves, wood and roots. If necessary, these pools can be further subdivided into sugars, starches, and other compounds. Alternatively, trees can be grouped with crops, grasses and shrubs to form a single global plant pool. How scientists make these decisions depends on the questions being asked and the scale of a particular study.
The movement of material from one pool to another is known as a flow, or flux. For example, in the global carbon cycle, carbon moves from the atmosphere to the plant pool through the process of photosynthesis. Hence, photosynthesis represents a flux and is, in fact, one of the most important fluxes in the carbon cycle. The flux of carbon out of this plant pool occurs through the transfer of leaves and other dead plant materials to
soils (a process known as litterfall) and through respiration, which releases carbon dioxide back into the atmosphere. These examples are just a few of the pools and fluxes that make up the entire global carbon cycle.
As we proceed, we should keep in mind that no system occurs in complete isolation. Because all things in the universe are in some way interconnected, scientists studying any system must draw artificial boundaries around what they believe are the most important components for a particular study. Although we can view an automobile as a discrete system, it's function relies on external inputs in the form of fuel, parts and other materials, as well as outputs in the form of exhaust and heat. Each of these is affected by processes that occur outside the normal boundaries of what we view as a car. If needed, we could capture these processes by treating cars as subsystems that act within larger systems of transportation, energy and environment. How we draw the boundaries depends on what we are trying to achieve. In the investigations we're about to embark on, we can treat the carbon cycle as a single system, a series of interacting subsystems, or as just a part of the overall Earth system (which also includes the nitrogen cycle, the energy cycle, the water cycle and more).
In order to improve their understanding of a system and its associated components, scientists often use models. Models are used in many fields of study, and can be simple or very complex. Scientists can use models to explore a system over much larger spans of space or time than is often feasible by direct observations. In addition, models can be used to understand the interactions of the numerous components of a system and to consider theoretical outcomes of particular real-‐world scenarios.

Teacher Guide 3 of 25 Paper Clip Simulation © 2011 A collaborative project between the University of New Hampshire, Charles University and the GLOBE Program Office.
For additional basic modeling and systems information see ModelingIntroduction.doc and for PowerPoint slides to present to your
class see Modeling.ppt. For more resources on the Earth system and teaching about systems thinking see the Resources section below.
Preparation • Gather all materials. • Write essential, unit, content questions somewhere visible in the classroom.
• Sketch a graph on the white board to be used to record the number of clips in the store at the end of each day. Label the x-‐axis as “days” (1-‐10) and the y-‐axis as “store inventory”.
• Set up three stations in your
classroom. The first station represents the factory and will have boxes of paper clips available. The second station represents the paper clip store and will
include an open/closed sign, medium-‐sized table to gather the factory’s delivery of clips, and a white board, overhead or LCD projector to display the data table and graph. The third station represents the customers’ home base.
• * If you plan to extend the paper clip activity with the computer-‐based model, then conduct the iSee Player Tutorial before introducing the model to your class. (see iSee Player and the Paper Clip Factory in the Resource Section)
What To Do and How To Do It
• Ask students to write a response to the following question in their science notebooks: “What is a system?” (or use the Frayer Model template with systems as the center word *See Templates file)
o As a whole class, share ideas about the definition of a system.
• Tell students that systems are found everywhere, including science, and it is important to have a common understanding of system components and language.
• Explain that the students will be simulating a paper clip business as an introduction to systems. It is critical to emphasize that this paper clip activity will be used as an analogy for a system throughout the study of the carbon unit. As the clip activity is quite simple remind students that the exercise prepares them for more complex modeling and problem solving later.
• Hand out a blank Paper Clip Simulation Data Table to each student. • Read the scenario below to set the stage for the simulation activity. Read with a sense of humor to make the activity fun (remember this kinesthetic activity is meant to act as an analogy).
EXPLORE Student Grouping: Whole Class Time: 20 minutes
ENGAGE Student Grouping: Whole Class Time: 10 minutes

Teacher Guide 4 of 25 Paper Clip Simulation © 2011 A collaborative project between the University of New Hampshire, Charles University and the GLOBE Program Office.
o “You are the proud citizens of a small town whose stability and prosperity is result of the booming paper clip factory in the center of town. It is your job to study this booming business and to record its activity for several days. [hold up the data table for everyone to see]
o Some of you will be factory-workers. At the sound of the bell every morning each factory-worker will have produced 2 paper clips, no more or no less. Paper clips are transported by factory-workers to the paper clip store. [point out the location of the store and remind them to deliver to the store in an orderly fashion]
o Some of you will be store-workers and you will carefully count the number of clips produced per worker, number of workers, and total clips produced. [point out the appropriate columns in the data table] Once you’ve made your counts you will open the store by displaying the open sign.
o Once the store is open the customers will have a chance to purchase clips. Current demand for paper clips is 1 paper clip per customer per day. [point out that in order to purchase the clips that the customers will need to line up in an orderly fashion and pick up a clip before returning to their station]
o All additional paper clips not sold by the end of the day remain in the store and are recounted by store-workers. [point out the remaining columns of the data table]. Store workers will announce the day’s activities to the public before the next round begins.”
• Divide students into 3 groups, which will each have their own role in the paper clip business. • Hand out prepared cards that indicate students’ role and the associated rules (see Paper Clip Simulation Roles).
o Make the factory and customer groups equal to each other. o You will need a minimum of five store-workers.
• Direct students to each of the three stations already set-‐up in the classroom. • Give students a few minutes to read their descriptions. Tell students to collaborate with other group members to clarify their roles.
• Make sure that the factory has a box of paper clips. • When store-workers are ready they will ring the bell to begin the activity. • (Note: On the first day the number of clips available will equal the factory delivery of clips because the store inventory is zero on day one. Perhaps students can come up with their own reason the inventory was empty (e.g., grand opening, increased demand, factory vacation).
• Students should write down the results while the store-worker displays them on the projector. • Continue in this pattern until you have completed the cycle 3 times (3 “days” worth of data).
• Gather students’ attention and facilitate a discussion to interpret the initial data: o Based on the data table and/or graph…
After several days of factory work what do you notice about the number of paper clips available in the store (ie, inventory stock) at the end of each day?
Do you see any patterns in your data? How many clips were produced per day? Did this change? Why? How many clips were purchased per day? Remain the same? Why? What is the mathematical equation that describes this pattern in the store inventory?
• Diagram and label the paperclip business as shown in Figure 1, using student input. (*Keep Figure 1 visible throughout the activity. Even use poster board so you can reference it throughout the unit).
EXPLAIN Student Grouping: Whole Class Time: 15 minutes

Teacher Guide 5 of 25 Paper Clip Simulation © 2011 A collaborative project between the University of New Hampshire, Charles University and the GLOBE Program Office.
• Direct students back to their groups. o In the second part of the simulation students will understand equilibrium (input = output). To accomplish this, circulate to each group and explain the group’s ‘new’ conditions. Only increase the customers’ purchase to 2 clips per customer (now factory production should equal customer purchases). Run simulation two more days under the new conditions.
o You may also manipulate the system using the spreadsheet version (PaperClipSimulation_datasheet.xls) if you feel it is time for students to return to their seats.
• Facilitate discussion to include the additional data. • Explain that the simulation represents the parts of any simple system. • Referring back to the schematic depicting the paper clip business (figure 1), introduce the standard box and arrow diagram (figure 2). If appropriate for your students, discuss the interchangeable terminology used in systems (figure 2). (*Again keep Figure 2 visible throughout the activity. Even use poster board so you can reference it throughout the unit).
o Interchangeable Systems and Modeling Terminology: A pool can also be referred to as a stock, box, or reservoir. Arrow, flow, flux, and transfer applies to both inputs and outputs.
• Students now use the Journal Questions below, their data table and the class graph to help solidify their understanding of how basic systems work (5 minutes). This is also a good place to use the Mathematical Equations Extension (20 minutes) if it is appropriate for your students.
• Bring the whole class together and discuss their Journal Questions (*and equations). • In conclusion discuss how models are used to understand systems (Journal Question # 5). “Mathematical equations (and graphs) are often the simplest models, but computer models (usually a group of equations) can be used to understand systems over greater periods of time
Production
Purchases
Store Inventory FIGURE 1
ELABORATE/INVESTIGATE Student Grouping: Whole class-‐ Individual Time: 10 minutes
EVALUATE/WRAP UP Student Grouping: Individual Time: 15 minutes
Input Flux Per unit time
Output Flux Per unit time
Pool, Stock
FIGURE 2: Box & Arrow Diagram

Teacher Guide 6 of 25 Paper Clip Simulation © 2011 A collaborative project between the University of New Hampshire, Charles University and the GLOBE Program Office.
and space. Models are tools to understand systems.” Use the Teacher Preparation materials: Systems&ModelingIntroduction.pdf and the ModelingSlides.ppt to assist you in your discussion.
o Explain in the context of the box and arrow diagram that the paper clip business is an example of a 1-‐box model.
• Discuss how all models have limitations and assumptions and the paper clip simulation is no different. For instance, the paperclip model assumes that each factory worker produces an equal number of clips. In addition, one limitation of the model is that we can only calculate the daily paperclip production since the time interval is measured in days. Have students brainstorm limitations and assumptions.
o Assumptions: Factory only produces and delivers paper clips that are in top condition All members of the paper clip business produce, sell, & purchase each day (no sick days or vacations)
Customers purchase the same number of paper clips All additional paper clips not sold by the store remain in the store Inventory will always be greater than number of purchases Changes in inventory are always linear. Output is not influenced by inventory size.
o Limitations: The other essential parts of the paper clip system are not accounted for (e.g., availability of and shipment of steel for production, number of factories, number of stores).
In our model we have a 1-box inventory. In reality there may be multiple boxes. In fact, the factory could be a box.
• Students can proceed by answering the Follow-up Questions or participating in the Computer Model Extension.

Teacher Guide 7 of 25 Paper Clip Simulation © 2011 A collaborative project between the University of New Hampshire, Charles University and the GLOBE Program Office.
Assessment • See Paper Clip Simulation: Follow-‐Up • Have students work in small groups to share their labeled diagrams, definitions, and thinking. Bring class together and discuss the main ideas from their discussions. (*Opportunity to refine their original definitions of: “What is a system?”)
Adaptations • Upper elementary school students (5th and 6th grades) can conduct this activity if it is adjusted to their abilities. One 5th grade class had the students working at the factory actually creating the paper clips out of previously unbent paper clips in order to make the lesson more active. The customer group has the most lag time during this activity. We suggest giving them an extra challenge, such as a word search that relates to the activity and/or the carbon cycle, in order to help maintain their focus. (Paper Clip Simulation Word Search)
• For students who would benefit from a continued kinesthetic experience run the simulation for varying days using varying inputs, stocks, and outputs. To see clear results we suggest that you alter one variable at a time.
Extensions
• Mathematical Equations: Have students develop the mathematical equations behind the paper clip simulation. This is helpful in demonstrating that many systems and models only involve determination of all the variables and basic arithmetic.
• Fractional Flux/Logarithmic Growth: During the simulation students found that the paper clip system was controlled by a constant flux where store inventory growth was linear. For more advanced students you could introduce the idea that linear growth is NOT typically observed in nature, and is
NOT what we will see later in this systems unit or throughout the year. What is more typical are systems controlled by a fractional flux instead of a constant/linear flux. To demonstrate this concept change the output flux to be a fraction of available store inventory (e.g. 0.4xStoreInventoryday-‐1). In cases where the output number of paper clips is fractional, round to the nearest paper clip. Stop the class for a discussion when a logarithmic curve has clearly developed and equilibrium is reached (Do this in place of increasing customer purchases to 2).
• Computer Model: Use the iSee Player and Paper Clip Computer Model to show students how useful computer models are in helping to process information and to prepare them for later modeling activities.
• Expanding 1-Box Models: You may challenge students to expand their 1-‐box models (Follow-up: Question 4) into several boxes, describe the math behind their models, or build their models in STELLA (if your school has selected to purchase the software). This may turn into an engaging introduction into systems thinking, so let students run with their ideas.
Resources GLOBE Earth System Activities – GLOBE Website, Teacher Resources, Earth System: http://www.globe.gov/fsl/html/templ.cgi?earth_system&lang=en
Dr. Art’s Guide to Planet Earth – Book and Website: http://www.planetguide.net/index.html
TheCreative Learning Exchange: http://www.clexchange.org/
A Waters Foundation Project – Systems Thinking in Schools: http://www.watersfoundation.org/
iSee Systems – Systems Thinking Software: http://iseesystems.com

Teacher Guide 8 of 25 Paper Clip Simulation © 2011 A collaborative project between the University of New Hampshire, Charles University and the GLOBE Program Office.
TEACHER VERSION (Suggested student responses included)
Student Worksheet: Paper Clip Simulation Journal Questions
1. When the clip inventory was initially increasing how did clip production (input) compare to customer purchases (output)?
Input > Output by 2:1
2. How did clip production (input) compare to customer purchases (output) when simulation conditions changed?
Input = Output
3. Can you explain why the number of clips remains the same after simulation conditions changed?
Input = Output and the system is at equilibrium. (KEY POINT: Equilibrium does not mean that there are zero inputs and outputs but rather that there is no net gain in clips over time.)
4. Based on your experience graphing the class scenario, describe a new scenario. First select new input and output values, then graph Store Inventory Stock for 6 days. Make sure to record what values you selected and that your graph is labeled correctly.
Input: Factory Workers 2 x Paperclips per Worker 3 = 6 Paperclips Produced per Day
Output: Customers 2 x Paperclips per Customer 2 = 4 Paperclips Purchased per Day
Input – Output = Stock 6 – 4 = 2 Left in the Stock per Day
Sketch Graph Here.

Teacher Guide 9 of 25 Paper Clip Simulation © 2011 A collaborative project between the University of New Hampshire, Charles University and the GLOBE Program Office.
5. We represented this system over a very short period of time (a few days). If the system was returned to Day 1 conditions and if we wanted to investigate how the business was doing in 30, 60, or 100 days how might we be able to calculate production for day 30, 60, or 100 without necessarily running the simulation day-‐by-‐day?
Mathematical equations (and graphs) are often the simplest models, and when equations (usually a group of equations) are turned into computer models they can be used to understand systems over greater periods of time and space. *This links well with the Extension Activities or other Carbon Activities.

Teacher Guide 10 of 25 Paper Clip Simulation © 2011 A collaborative project between the University of New Hampshire, Charles University and the GLOBE Program Office.
TEACHER VERSION (Suggested student responses included)
Student Worksheet: Paper Clip Simulation Follow-‐up
1. Draw a 1-‐box model in standard box and arrow format (see below) and label the input, output, and stock with terms that illustrate the factory system you just simulated.
2. Answer the following question in a few sentences: In what ways does the paper clip factory simulation represent a simple system and model?
The student responses will vary. However, make sure they are addressing that all systems have components that interact and models have input fluxes, output fluxes, and stocks such as represented by the clip factory simulation. In addition, students are expected to mention that the inputs or outputs can be manipulated or changed. Some students may mention that when inputs and outputs are equal the system and model is at equilibrium.
Input Flux
Per unit time
Output Flux
Per unit time
Pool, Stock
Clip production
Clip purchases
Clip Inventory
Teacher Guide 11 of 25 Paper Clip Simulation © 2011 A collaborative project between the University of New Hampshire, Charles University and the GLOBE Program Office.
3. Based on your knowledge of systems and that models are used to understand systems, record in your own words the definitions of a system and a model.
The GLOBE definition of a system is: A group of components that interact to produce a whole (in the case of the Earth system) or a specific result (in the case of a machine).
Models are tools and concepts that help us understand, explain, and predict systems that are too complex or difficult to observe, or to comprehend on our own. Models are simplifications of reality.
4. Create a 1-‐box model using a system you are familiar with. a. Diagram and label your model using the standard box and arrow format. b. Run a model simulation similar to the paper clip business. Provide 3 cycles
worth of data.

Teacher Guide 12 of 25 Paper Clip Simulation © 2011 A collaborative project between the University of New Hampshire, Charles University and the GLOBE Program Office.
TEACHER VERSION (Suggested student responses included)
Student Worksheet: Paper Clip Simulation Extension -‐ Math Equations
1. Scientists include equations in simple models to calculate the value of inputs, outputs, and stocks. The incorporation of equations can make life easier! Instead of counting all the clips one at a time you can calculate the factory production of clips each day based on an equation. Develop an equation that would determine the number of clips produced by the factory each day. Make sure your equation is general enough to explain any day of the factory scenario. Check the accuracy of your equation by testing it with actual data collected during the simulation and against the data displayed on the data table. Please show all of your math thinking.
Factory Production
(# clips produced per worker) x (# factory workers this day) = # clips produced this day
Factory Productionworker x Workersday n = Factory Productiontotal day n
FPworker x Wday n = FPtotal day n
Check: (exact values will vary depending on your class) Students should show their work
Mock Example: (2 clips producedworker ) * (5 Workersday 1) = 10 clips produced on day 1 and this matches with value recorded on class data table
2. Develop an equation that would determine the number of clips purchased by the customers each day. Make sure your equation is general enough to explain any day of the factory scenario. Check the accuracy of your equation by testing it with actual data collected during the simulation and against the data displayed on the data table. Please show all of your math thinking.
Customer Purchases
Teacher Guide 13 of 25 Paper Clip Simulation © 2011 A collaborative project between the University of New Hampshire, Charles University and the GLOBE Program Office.
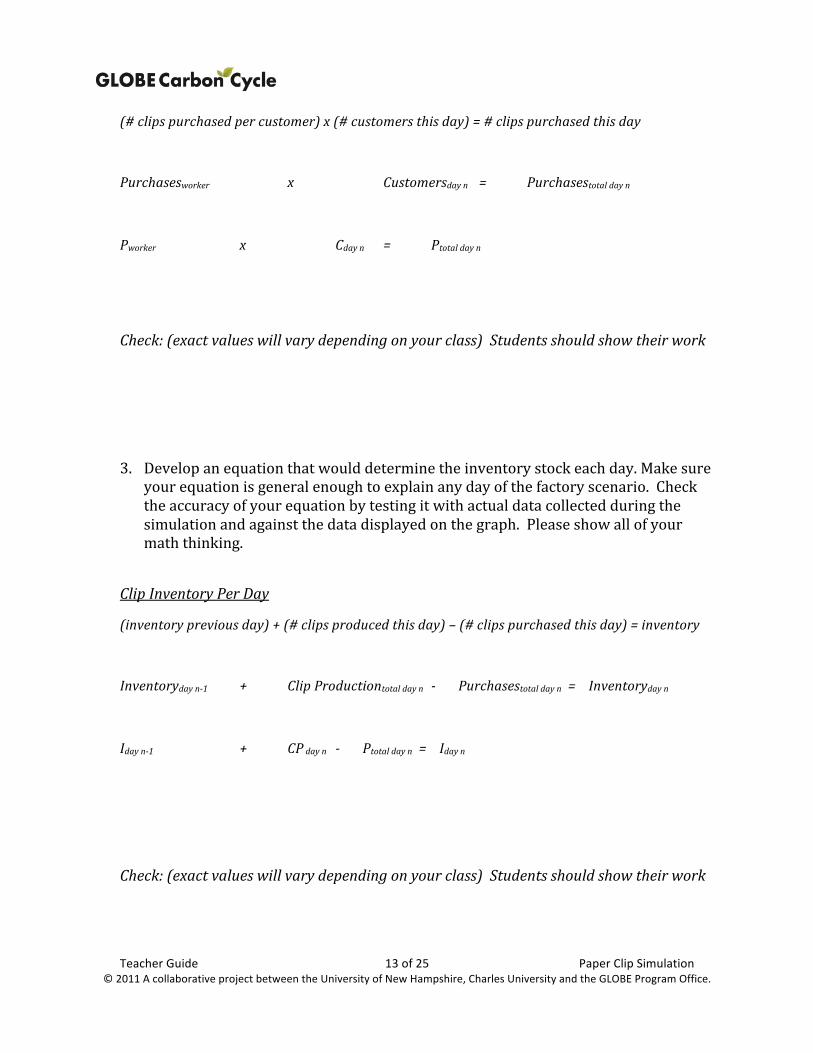
(# clips purchased per customer) x (# customers this day) = # clips purchased this day
Purchasesworker x Customersday n = Purchasestotal day n
Pworker x Cday n = Ptotal day n
Check: (exact values will vary depending on your class) Students should show their work
3. Develop an equation that would determine the inventory stock each day. Make sure your equation is general enough to explain any day of the factory scenario. Check the accuracy of your equation by testing it with actual data collected during the simulation and against the data displayed on the graph. Please show all of your math thinking.
Clip Inventory Per Day
(inventory previous day) + (# clips produced this day) – (# clips purchased this day) = inventory
Inventoryday n-1 + Clip Productiontotal day n - Purchasestotal day n = Inventoryday n
Iday n-1 + CP day n - Ptotal day n = Iday n
Check: (exact values will vary depending on your class) Students should show their work

Teacher Guide 14 of 25 Paper Clip Simulation © 2011 A collaborative project between the University of New Hampshire, Charles University and the GLOBE Program Office.
4. Determine a way to maintain the stock of paper clips at 25 per day by the end of the day over several days. Feel free to use the backside of your data table to check your strategy. Be able to explain your strategy to the class. Draw another diagram to help you illustrate your new strategy and model.
Students’ responses will vary and they should show their work to provide evidence for their solution.

Student Worksheet 15 of 25 Paper Clip Simulation © 2011 A collaborative project between the University of New Hampshire, Charles University and the GLOBE Program Office.
Name: Date:
Student Worksheet: Paper Clip Simulation Journal Questions
1. When the clip inventory was initially increasing how did clip production (input) compare to customer purchases (output)?
2. How did clip production (input) compare to customer purchases (output) when simulation conditions changed?
3. Can you explain why the number of clips remains the same after simulation conditions changed?
4. Based on your experience graphing the class scenario, describe a new scenario. First select new input and output values, then graph Store Inventory Stock for 6 days. Make sure to record what values you selected and that your graph is labeled correctly.
Student Worksheet 16 of 25 Paper Clip Simulation © 2011 A collaborative project between the University of New Hampshire, Charles University and the GLOBE Program Office.
5. We represented this system over a very short period of time (a few days). If the system was returned to Day 1 conditions and if we wanted to investigate how the business was doing in 30, 60, or 100 days how might we be able to calculate production for day 30, 60, or 100 without necessarily running the simulation day-‐by-‐day? What tools or approaches could be used?

Student Worksheet 17 of 25 Paper Clip Simulation © 2011 A collaborative project between the University of New Hampshire, Charles University and the GLOBE Program Office.
Name: Date:
Student Worksheet: Paper Clip Simulation Follow-‐up
1. Draw a 1-‐box model in standard box and arrow format as discussed in class and label the input, output, and stock with terms that illustrate the paper clip system you just simulated.
2. Answer the following question in a few sentences: In what ways does the paper clip simulation represent a simple system and model?
Student Worksheet 18 of 25 Paper Clip Simulation © 2011 A collaborative project between the University of New Hampshire, Charles University and the GLOBE Program Office.
3. Based on your knowledge of systems and that models are used to understand systems, record in your own words the definitions of a system and a model.
4. Create a 1-‐box model using a system you are familiar with. (Use the back or additional paper.) a. Diagram and label your model using the standard box and arrow format. b. Run a model simulation similar to the paper clip business. Provide 3 cycles worth of
data.

Student Worksheet 19 of 25 Paper Clip Simulation © 2011 A collaborative project between the University of New Hampshire, Charles University and the GLOBE Program Office.
Name: Date:
Student Worksheet: Paper Clip Simulation Extension -‐ Math Equations
1. Scientists include equations in simple models to calculate the value of inputs, outputs, and stocks. The incorporation of equations can make life easier! Instead of counting all the clips one at a time you can calculate the factory production of clips each day based on an equation. Develop an equation that would determine the number of clips produced by the factory each day. Make sure your equation is general enough to explain any day of the factory scenario. Check the accuracy of your equation by testing it with actual data collected during the simulation and against the data displayed on the data table. Please show all of your math thinking.
2. Develop an equation that would determine the number of clips purchased by the customers each day. Make sure your equation is general enough to explain any day of the factory scenario. Check the accuracy of your equation by testing it with actual data collected during the simulation and against the data displayed on the data table. Please show all of your math thinking.
Student Worksheet 20 of 25 Paper Clip Simulation © 2011 A collaborative project between the University of New Hampshire, Charles University and the GLOBE Program Office.
3. Develop an equation that would determine the inventory stock each day. Make sure your equation is general enough to explain any day of the factory scenario. Check the accuracy of your equation by testing it with actual data collected during the simulation and against the data displayed on the graph. Please show all of your math thinking.
4. Determine a way to maintain the stock of paper clips at 25 per day by the end of the day over several days. Feel free to use the backside of your data table to check your strategy. Be able to explain your strategy to the class. Draw another diagram to help you illustrate your new strategy and model.

Student Worksheet 21 of 25 Paper Clip Simulation © 2011 A collaborative project between the University of New Hampshire, Charles University and the GLOBE Program Office.
Name: Date:
Student Worksheet: Paper Clip Simulation Extension -‐ Paper Clip Computer Model
1. Click 2. Follow along in the model story to complete the following tasks. To move forward through
the story, hit the space bar. To move backwards, hit the backspace key. a. Draw the basic one box diagram used in this computer model (remember, this
includes the stock, inflow, and outflow!).
b. Continue clicking through the story and record the two model converters that influence the model input (converters are represented by a circle and connecting arrow).
c. What two model converters influence the model output?
3. Once the story has ended, click the back arrow (in the left sidebar) to return to the homepage.
4. Now select the Map tab – What is the default initial value of workers in this model? (You can find this by holding your mouse over the circle labeled ‘workers’)
5. Select the Equation tab – Write the mathematical equation for model inflow.

Student Worksheet 22 of 25 Paper Clip Simulation © 2011 A collaborative project between the University of New Hampshire, Charles University and the GLOBE Program Office.
6. Select the Interface tab and click
7. Model Run 1
a. Set Story Inventory to 0 and click b. Look in the Instructions box.
i. How many workers are there?
ii. How many paperclips are produced per worker?
iii. How many customers?
iv. How many clips are purchased per customer?
c. Click to start the model run i. Did the store inventory increase, decrease or remain the same over time?
ii. What was the initial store inventory? The final store inventory?
d. Click i. How does clip production (‘producing’) compare to customer purchases
(‘purchasing’)?

Student Worksheet 23 of 25 Paper Clip Simulation © 2011 A collaborative project between the University of New Hampshire, Charles University and the GLOBE Program Office.
8. Model Run 2
a. Click to start a new model run b. Under Instructions, change the number of clips purchased from 1 to 2.
c. Click i. Did the store inventory increase, decrease or remain the same over time?
ii. Click . Can you explain why the results of this model run differ from the previous model run?
9. Model Run 3 a. Return to the Run Simulation Page. Change the number of workers from 5 to 4, and
return the number of paperclips purchased to 1. Click
i. Did the store inventory increase, decrease or remain the same over time?
ii. How could you change only the number of customers so that the system is at equilibrium? (Use graph Page 2 to assist you.)
iii. Test it out! Change the number of customers to the number you chose and
click . Were you correct? Why or why not?

Student Worksheet 24 of 25 Paper Clip Simulation © 2011 A collaborative project between the University of New Hampshire, Charles University and the GLOBE Program Office.
10. Return both the number of workers and customers back to 5. Click . The graph should look identical to model run 1.
a. If after 5 days, the number of clips purchased increased from 1 to 2, do you think that the system would reach equilibrium?
b. If yes, what would the store inventory be at equilibrium?
c. What would the graph look like? Sketch it below:

Data Table 25 of 25 Paper Clip Simulation © 2011 A collaborative project between the University of New Hampshire, Charles University and the GLOBE Program Office.
Paper Clip Simulation Data Table
Time Factory Production Customer Purchases Store
Day
# of paper clips produced per worker
# of workers today
Total paperclips produced this day
# of paper clips purchased per customer
# of customers today
Total paper clips purchased today
Inventory stock: paper clips remaining today
1
2
3
4
5
6
7
8
9
10
11
12
13
14