paper id: 4, page 1 a user-friendly pitot probe data
TRANSCRIPT

Paper ID: 4, Page 1
6th International Seminar on ORC Power Systems, October 11 - 13, 2021, Munich, Germany
A USER-FRIENDLY PITOT PROBE DATA REDUCTION EXCEL-REFPROP-
ROUTINE FOR NON-IDEAL GAS FLOW APPLICATIONS
Jan-Niklas Schollmeier and Stefan aus der Wiesche*
Muenster University of Applied Sciences, Stegerwaldstr. 39, 48565 Steinfurt, Germany
*Corresponding Author: [email protected]
ABSTRACT
This contribution presents a user-friendly data reduction routine for Pitot probes based on widely
available software with a fluid properties interface. The data reduction process rests on the general
balance equations and the fluid database and calculation program REFPROP by NIST. In the
corresponding calculation sheet, the user can easily select the fluid and manually or automatically insert
the probe data and stagnation conditions of the measurement. A robust algorithm directly calculates the
freestream Mach number and other flow and thermodynamic quantities. The new Pitot probe data
reduction routine's accuracy is assessed through several test cases, including the subsonic and
supersonic flow of dry air, Novec 649, and siloxane MM in the dilute and dense gas regime. For
compressible non-ideal gas flows, it is found the classical Rayleigh-Pitot equation is systematically in
error even in the dilute gas regime where relative deviations of more than 10 % were noticed. In the
dense gas regime, the Rayleigh-Pitot equation fails dramatically in calculating the freestream Mach
number, and errors larger than 60 % were observed.
1 INTRODUCTION
For obtaining and quantifying losses in turbomachinery, total pressure data are required (Dixon and
Hall (2010)). The classical device for obtaining total pressure data is the Pitot probe. This device is also
the natural starting point for more complex pneumatic probes, like the five-hole probe. In order to
improve the efficiency of turbines for organic Rankine cycle (ORC) applications, it is obvious to
conduct experiments and cascade testing in suitable organic vapor wind tunnels utilizing Pitot probes
(Spinelli et al. (2013), Reinker et al. (2015), Head et al. (2016)).
The theory of Pitot probes and the corresponding data reduction process, e. g., the famous Rayleigh-
Pitot equation, are well treated in numerous textbooks, e.g., John and Keith (2006) or Liepmann and
Roshko (2001), in the case of a perfect gas. For that, analytical expressions can be derived, making the
use of Pitot probe data for flow investigations relatively easy. However, much less is known about the
data reduction process in compressible non-ideal gas flows. Especially in the so-called dense gas
regime, the Rayleigh-Pitot equation's use becomes notoriously questionable. A data reduction method
is needed to cover the non-ideal gas behavior for isentropic flow and shock relations.
In the past, numerical methods for calculating non-ideal gas effects have been proposed and successfully
employed in Pitot measurements (Reinker et al. (2020)). However, at least in our laboratory team,
students and research assistants had a strong interest in utilizing a user-friendly routine running on
EXCEL in combination with REFROP by NIST (N.N. (2021)). Such a solution and its underlying sub-
routines are presented in the following after a brief review of Pitot probe measurements' fundamentals.
Proposing a data reduction method resting on a commercial software like the MS office program
EXCEL opens, in principle, the present contribution to criticism. Regarding a wide range of potentials
users, a code in Python connected to CoolProp (that would be made available in GitHub or as a web
interface where the users can add inputs and calculate the results) would be ideal. However, from the
author's experience, practically every laboratory or research and development department has access to

Paper ID: 4, Page 2
6th International Seminar on ORC Power Systems, October 11 - 13, 2021, Munich, Germany
EXCEL and REFPROP today, and so the limitations due to the commercial constraints might be weak
in practice. However, it would be certainly worthwhile to develop an open-source code for Pitot probe
data reduction for the scientific community. The interested reader can find in the following the
numerical scheme and might find it attractive to create its own code based.
2 PITOT PROBE FUNDAMENTALS
The stagnation (or total) pressure is measured by an instrument that brings the flow isentropically to
rest. Such a device is usually called a Pitot probe, and its history can be traced back to the year 1732.
Several probe geometries and combinations with static pressure taps are now available for obtaining
Mach number and velocities in compressible flows, as discussed by John and Keith (2006). In the case
of turbomachinery applications, cylinder probes are also common, see Wyler (1975). Despite the
numerous sizes and designs of Pitot probes, the fundamentals are still the same, see Fig. 1. The
isentropic flow relations are always fundamental for the data reduction process using Pitot probe
pressure (the total pressure denoted by subscript o in the following) and the static pressure.
2.1 Perfect Gas Flows
In subsonic perfect gas flow, see Fig. 1.a, the freestream flow Mach number Ma1 can be directly
determined from the measured total pressure po1 (Pitot probe pressure) and (known) free static pressure
p1 using the well-known isentropic flow relation
𝑀𝑎12 =
2
𝛾−1((
𝑝𝑜1
𝑝1)
(𝛾−1)/𝛾− 1). (1)
In the case of supersonic perfect gas flow, see Fig. 1.b, the Pitot probe acts as a blunt-nosed body, and
there will be a detached bow shock in front of the probe. Then, it is necessary to distinguish between a
station upstream of the shock (denoted by subscript 1) and a station downstream of the shock (denoted
by subscript 2). In the data reduction process, it is then necessary to include also the normal shock
relations, and the well-known Rayleigh-Pitot equation
𝑝𝑜2
𝑝1=
𝛾+1
2𝑀𝑎1
2 ((𝛾+1)2𝑀𝑎1
2
4𝛾𝑀𝑎12−2(𝛾−1)
)1/(𝛾−1)
. (2)
results in the case of a perfect gas with an isentropic exponent . For a given perfect gas, the inflow
Mach number Ma1 can be obtained using only the measured Pitot probe pressure po2 and the free static
pressure p1. In supersonic flows, Eq. (2) is typically solved iteratively for Ma1. In subsonic flow, po2 =
po1 holds, and the Mach number is determined by Eq. (1).
Figure 1: Pitot probe in subsonic flow (a) and in supersonic flow with a bow shock (b)

Paper ID: 4, Page 3
6th International Seminar on ORC Power Systems, October 11 - 13, 2021, Munich, Germany
2.2 Non-Ideal Gas Flows
In non-ideal gas flows, the qualitative thermodynamic behavior illustrated in Fig. 2 remains somewhat
similar.
In subsonic flows, Fig. 2.a, the Mach number Ma1 can be directly calculated by an isentropic flow
relation Ma1 = fs(p1, po1, ho1) assuming s = s1 = constant. In the case of non-ideal gas flows, the isentropic
flow relations fs are not universal; they depend in general on the stagnation state {ho1, po1}. It is usual
to calculate the stagnation enthalpy ho1 using the measured total temperature To1 and total pressure po1.
In wind tunnel experiments, it is often common to identify ho1 with the settling chamber value, i.e., with
h0 = h(T0, p0) where T0 and p0 are the settling chamber temperatures and pressures, respectively.
Figure 2: Thermodynamics of a Pitot probe in subsonic flow (a) and in supersonic flow (b)
In supersonic flows, Fig. 2.b, the shock between 1 and 2 requires more effort in calculating the inflow
Mach number Ma1. Typically, the stagnation enthalpy ho1 = ho2 is already known (this value is identified
with the settling chamber value h0 in a wind tunnel experiment). Furthermore, the Pitot probe provides
the downstream total pressure po2, and additional static wall pressure measurements provide the
upstream static pressure p1, see also Fig. 1.b. In this case, the unknown inflow Mach number Ma1 (and
other flow variables) can be calculated by solving the general balance equations for mass, energy, and
impulse
𝜌1𝑐1 = 𝜌2𝑐2, (3a)
ℎ1 +1
2𝑐1
2 = ℎ2 +1
2𝑐2
2 = ℎ0, (3b)
𝑝1 + 𝜌1𝑐12 = 𝑝2 + 𝜌2𝑐2
2. (3c)
Due to the quadratic velocity terms in Eq. (3), two solutions can result, but only the solution with s2 >
s1 is physically correct since the second law of thermodynamics has to be obeyed for the shock.
In the case of a perfect gas with constant properties, the above set of equations can be solved
analytically; then, in the supersonic case, the well-known Rayleigh-Pitot equation (2) results. A
different mathematical approach for solving the set of equations (3) has to be employed for fluids not
obeying the perfect gas laws.
3 DATA REDUCTION METHOD
It is possible to employ a quasi-analytical formalism proposed by Passmann et al. (2017) to solve the
above set of equations. In that case, it is necessary to solve a cubic equation for the specific volume v

Paper ID: 4, Page 4
6th International Seminar on ORC Power Systems, October 11 - 13, 2021, Munich, Germany
= 1/. Although such an approach might be elegant in terms of mathematics since the establishment of
the famous Cardano formulas, it is not very attractive for practical applications. Hence, a different
approach based on an appropriate fluid database and equation of states were employed in the following.
3.1 Program Structure and Flow Chart
The general structure of the data reduction routine is shown in Fig. 3. The input data are (after the fluid
selection) the Pitot probe pressure (in the following generally denoted by po2 even in the subsonic flow
case), the free static pressure p1, and the stagnation enthalpy h0 that is usually calculated as a function
of the settling chamber pressure p0 and temperature T0 in a typical wind tunnel experiment. All
thermodynamic properties are calculated by means of REFPROP by NIST. A feature of REFPROP
permits the utilization of REFPROP results within EXCEL. In addition to the primary input data, the
user might choose specific step sizes for the algorithm based on the solution control parameters' output.
Within the routine, a standard set of step sizes as default values is already provided, but the user might
try to improve the results' accuracy by choosing smaller step sizes. The primary output quantity is the
inflow or freestream Mach number Ma1, but several other flow and thermodynamically output data like
pressure, temperature, and sound speed are provided. The main flow chart of the EXCEL-based routine
is shown in Fig. 4.
Figure 3: General structure of the EXCEL-based data reduction routine for Pitot probes
Figure 4: Main flow chart of the data reduction process

Paper ID: 4, Page 5
6th International Seminar on ORC Power Systems, October 11 - 13, 2021, Munich, Germany
In the first step, the specific entropy s2 is calculated using the stagnation enthalpy h0 and the Pitot
pressure po2. Using s2, the isentropic flow relations x = fs2 for the flow and thermodynamically quantities
at the Pitot probe station 2 are calculated for a fair number of values p2i. In Fig. 4, a vector notation x =
(h2, T2, 2, c2, a2, Ma2,…) is used to characterize the thermodynamic state. The static pressure p2i starts
at p2,i=1 = po2 and it stops at i = imax corresponding to p2imax = p1. The total number of imax depends on the
chosen step size for calculating an isentropic table for station 2, which should be fine enough for
achieving the desired accuracy (see also later section).
If Ma2imax = fs2(po2, p1; h0) < 1, the subsonic flow results have already been calculated on the basis of the
isentropic relation (analog to Eq. (1) in the case of a perfect gas flow), and the routine is finished.
If Ma2imax > 1, the routine has to go through the supersonic path. In the supersonic flow case, a second
table for the (unknown) station 1 upstream of the shock has to be calculated. In this case, the static
pressure p1 and total enthalpy ho1 = h0 are assumed to be constant, and flow and thermodynamically
variables xj are computed for different values of specific entropy s1j. Here, j = 1 corresponds always to
s1,i=1 = s2, and s1,jmax corresponds to s0 (i.e., the entropy s0 of the settling chamber represents the lower
limit due to the second law of thermodynamics).
Using the calculated states xi and xj at station 1 and station 2, the mass flow and impulse expressions
c and p + c2 are computed (see Eq. (3)) for any i and j. Based on these expressions, the set (i*, j*) is
identified, which satisfied simultaneously the mass balance and the impulse balance (the energy balance
is already satisfied since h0 = ho1 = ho2 is assumed throughout). For identifying (i*, j*), the expression
p + c2 is plotted against c for i and j, respectively. The intersection of the two lines provides the
desired solution (i*, j*) and hence the desired freestream Mach number Ma1 and the other quantities.
Since the shock relations have mathematically two solutions, only the solution characterized by s1 < s2
is selected.
3.2 Solution Control Parameters and Numerics
Although the present data reduction rests entirely on the actual (real gas) fluid behavior as covered by
REFPROP, it is interesting to compare the computed results with the predictions by the simple perfect
gas expression (see Eq. (1) and Eq. (2)). Hence, as an additional feature, the isentropic exponent =
cp/cv is calculated by REFPROP using h0 and po2 and then inserted into the perfect gas expressions (i.e.,
assuming the perfect gas expressions). The outcome of this perfect gas calculation method is compared
with the results of the general data reduction. In the case of a perfect gas, both ways should provide
essentially the same. In the case of significant non-ideal gas behavior, substantial deviations can occur
between the two methods. However, if the difference between the two methods is too extreme, the user
might also consider a check of the actual calculation and the input data.
The data reduction routine provides default values for the steps p2 = p2i – p2,i+1 and s1 = s1j – s1,j+1 but
the user is free for changing these numerical parameters. In the case of large step sizes, the tables at
station 1 and 2 might be too coarse, and the flow quantities like Ma1 might be provided with large
uncertainty. In addition to the obvious strategy to reduce the step size (which increases the
computational running time), it is possible to use polynomial fitting functions for p + c2 as a function
of c (for i and j as marching indices) and to compute the intersection (i*, j*) through these fitting
functions. This interpolation algorithm works well since p + c2 as a function of c are typically
monotonically for a wide class of fluids and input data. The intersection is also shown graphically in an
auxiliary EXCEL sheet, including all tables and station values.
3.3 Using the Routine
The routine is implemented as EXCEL document. After selecting the fluid on the main sheet, the user
can manually type the required input data or provide a scan number from a recorded lab software file
(if available). Only the scan number is needed in the latter case, and the system provides the pressure
and enthalpy values. In the manual input procedure, the user has to specify the two pressure values p1
and po2. Still, the user can choose between two options: direct input of h0 or providing settling chamber
pressure and temperature values p0 and T0, respectively.
After completing the input, the data reduction starts directly and provides the results at the main
calculation sheet. Based on the computed Mach number Ma1, the output distinguishes between the
subsonic and supersonic flow. In the supersonic flow case, all values upstream and downstream of the

Paper ID: 4, Page 6
6th International Seminar on ORC Power Systems, October 11 - 13, 2021, Munich, Germany
shock are provided. A comparison with the perfect gas data reduction methods is provided, too. Here,
absolute values for the Mach number and the relative errors are listed. In addition to the main calculation
sheet, auxiliary sheets are created automatically. In addition to the tables of thermodynamic expressions,
the solution of the coupled mass and impulse balance equations are graphically shown in secondary
sheets. The intersection is explicitly reported in the diagram, and the values closest to that are marked
in green color in the tables. If necessary, the user can change the step size manually and repeat the
computation.
4 TEST AND APPLICATION
In the first set of test runs, the impact of the step size on the calculated Mach number was investigated.
After determining the required step size, the data reduction routine was tested through three different
fluids covering perfect gas up to dense gas regime applications.
4.1 Impact of Step Size
It was found that the impact of step size on the calculated Mach number Ma1 and other flow parameters
was modest for typical applications. As a general rule, the pressure step size should be of order p2/po2
≈ 1 %, and the entropy step size should be of order s1/s2 ≈ 0.05 %. With such step sizes, the Mach
numbers and other flow parameters can be computed with acceptable accuracy. In principle, it is
possible to achieve an exact solution through sufficiently small step sizes.
In Table 1, two representative examples are listed. The exact results are achieved if the residuals in the
balance equations (3) are zero. The deviations between the exact results and the outcome of the
computations with default step sizes were of order 0.6 up to 1.2 %. For practical applications, it is
recommended to assess the impact of step size on actual data reduction by performing some preliminary
test runs with characteristic input data for the experiments under consideration.
Table 1: Effect of size step on calculated Mach number
Fluid / h0 po2 p1 s Ma1
NOVEC 649 / 399.36 kJ/kg 4.5 bar 1.5 bar 0.0008 kJ/(kg K) 1.590
NOVEC 649 / 399.36 kJ/kg 4.5 bar 1.5 bar 0.0004 kJ/(kg K) 1.581 (exact)
MM / 407.98 kJ/kg 38 bar 10 bar 0.0030 kJ/(kg K) 2.002
MM / 407.98 kJ/kg 38 bar 10 bar 0.0027 kJ/(kg K) 2.027 (exact)
4.2 Application Cases
The practical value of the present data reduction routine can be assessed by performing some
representative test case calculations. In the following, three fluids are considered, namely dry air
(representing a perfect gas), NOVEC 649 at moderate pressure and temperature levels (representing a
non-ideal gas with only minor deviations from a perfect gas), and MM (C6H18OSi2 –
hexamethyldisiloxane). For the two organic vapors, two different stagnation conditions were
considered, which are illustrated by their location in the temperature-entropy diagrams, see Fig. 5.
4.2.1 Dry Air
In the case of dry air at pressure levels of about 2 up to 10 bar and temperature levels of about 100°C,
the deviations between the classical Rayleigh-Pitot equation and the EXCEL-based data reduction
routine using the REFPROP data for dry air remained relatively small (of order 0.1 % over the entire
practical Mach number range). This slight deviation level indicates that the classical Rayleigh-Pitot
equation is reliable for compressible air flows and that there is no real need to consider real-gas effects
for air flows at this pressure and temperature level for data reduction.
4.2.2 NOVEC 649
In a second test run, the deviations between the Rayleigh-Pitot equation and the data reduction using
REFPROP data for NOVEC 649 were assessed.

Paper ID: 4, Page 7
6th International Seminar on ORC Power Systems, October 11 - 13, 2021, Munich, Germany
Figure 5: Stagnation conditions for the test cases in the T,s-diagrams for Novec 649 and MM
The considered pressure and temperature levels were in parts roughly oriented to typical operating
conditions of the test facility CLOWT at Muenster University of Applied Sciences (Reinker et al.
(2020)). However, in addition to the moderate pressure test case (called N-A, see Fig. 5), a further set
(called N-B) at higher pressure was considered.
In Table 2, the NOVEC 649 test cases and the outcome regarding the Mach number errors are listed.
For the two sets, the stagnation enthalpy h0 and the static pressure p1 were assumed to be fixed. Values
for the freestream Mach number Ma1 and the Mach number Ma2 after the shock in front of the Pitot
probe were calculated for a range of Pitot pressure values po2 using the new data routine and Rayleigh-
Pitot formula. The relative deviation between these values was considered as an error. The maximum
errors are listed in Table 2.
In the case of moderate pressure level, the perfect gas equations introduced significant Mach number
errors of order 5 % in the subsonic, transonic and supersonic flow regimes. Such an error level is
substantially larger than the usual experimental uncertainty levels. This error was even higher in the
second set of higher pressure levels and exceeded 10 %. This means that the data reduction method has
to consider the non-ideal gas behavior, although NOVEC 649 behaves in this regime still similar to a
perfect gas. Even in the dilute gas regime, the classical Rayleigh-Pitot formula might be substantially
in error, and relative deviations between the classical Rayleigh-Pitot formula and the proposed method
of more than 10 % can occur.
Table 2: Considered Novec 649 test cases
Test
Case
Stagnation
enthalpy h0
Static
pressure p1
Pitot pressure
range po2
Maximum error
Ma1/Ma1
Maximum error
Ma2/Ma2
N-A 399.4 kJ/kg 2.0 bar 2.2 up to 7 bar 4.9 % 4.7 %
N-B 543.5 kJ/kg 10 bar 12 up to 38 bar 8.2 % 10.9 %
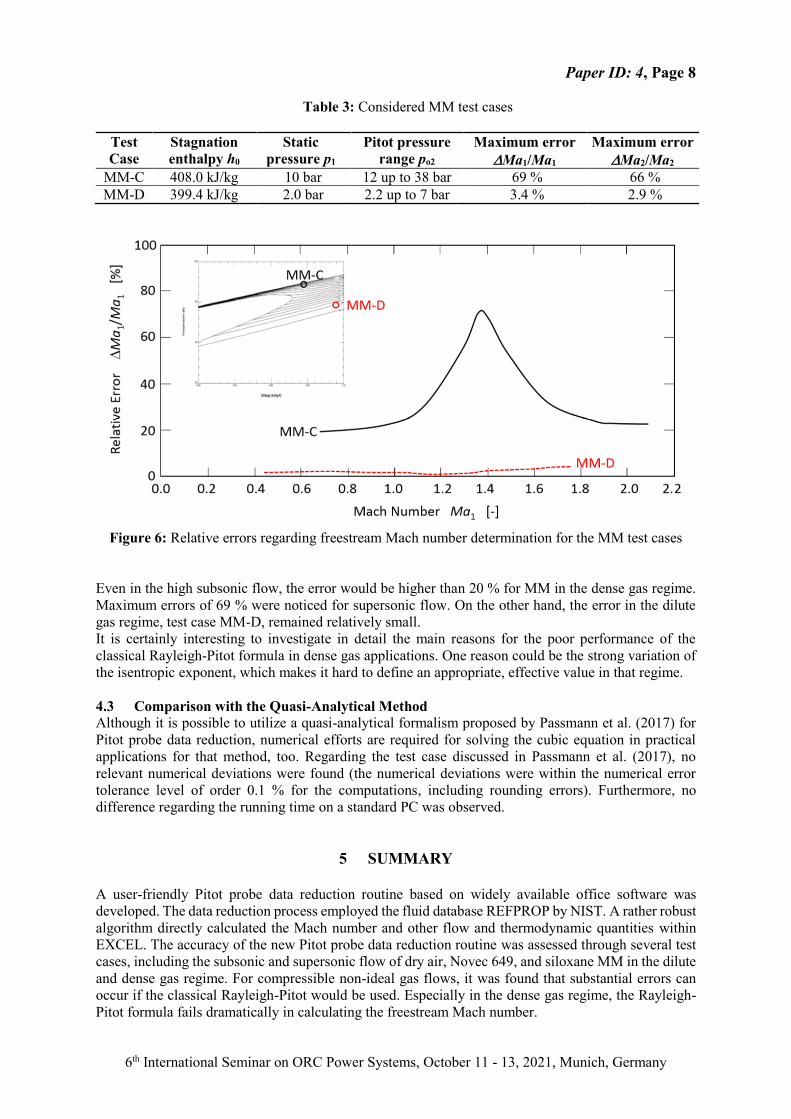
4.2.3 MM in non-ideal and quasi-ideal flow conditions
Finally, some test runs with MM were performed to assess the reliability of the data reduction in the
non-ideal flow regime, see Fig. 5. The test case called MM-C corresponded to the flow in the dense gas
regime, whereas the case MM-D was located farther away from the critical point where a quasi-ideal
gas flow can be expected. In Table 3, the considered MM test cases and the outcome regarding the
Mach number errors are listed. In Fig. 6, the relative errors regarding freestream Mach number Ma1 are
plotted for the MM test cases. The relative errors are substantial if the Rayleigh-Pitot equation would
be used in the dense gas regime, test case MM-C.
Paper ID: 4, Page 8
6th International Seminar on ORC Power Systems, October 11 - 13, 2021, Munich, Germany
Table 3: Considered MM test cases
Test
Case
Stagnation
enthalpy h0
Static
pressure p1
Pitot pressure
range po2
Maximum error
Ma1/Ma1
Maximum error
Ma2/Ma2
MM-C 408.0 kJ/kg 10 bar 12 up to 38 bar 69 % 66 %
MM-D 399.4 kJ/kg 2.0 bar 2.2 up to 7 bar 3.4 % 2.9 %
Figure 6: Relative errors regarding freestream Mach number determination for the MM test cases
Even in the high subsonic flow, the error would be higher than 20 % for MM in the dense gas regime.
Maximum errors of 69 % were noticed for supersonic flow. On the other hand, the error in the dilute
gas regime, test case MM-D, remained relatively small.
It is certainly interesting to investigate in detail the main reasons for the poor performance of the
classical Rayleigh-Pitot formula in dense gas applications. One reason could be the strong variation of
the isentropic exponent, which makes it hard to define an appropriate, effective value in that regime.
4.3 Comparison with the Quasi-Analytical Method
Although it is possible to utilize a quasi-analytical formalism proposed by Passmann et al. (2017) for
Pitot probe data reduction, numerical efforts are required for solving the cubic equation in practical
applications for that method, too. Regarding the test case discussed in Passmann et al. (2017), no
relevant numerical deviations were found (the numerical deviations were within the numerical error
tolerance level of order 0.1 % for the computations, including rounding errors). Furthermore, no
difference regarding the running time on a standard PC was observed.
5 SUMMARY
A user-friendly Pitot probe data reduction routine based on widely available office software was
developed. The data reduction process employed the fluid database REFPROP by NIST. A rather robust
algorithm directly calculated the Mach number and other flow and thermodynamic quantities within
EXCEL. The accuracy of the new Pitot probe data reduction routine was assessed through several test
cases, including the subsonic and supersonic flow of dry air, Novec 649, and siloxane MM in the dilute
and dense gas regime. For compressible non-ideal gas flows, it was found that substantial errors can
occur if the classical Rayleigh-Pitot would be used. Especially in the dense gas regime, the Rayleigh-
Pitot formula fails dramatically in calculating the freestream Mach number.

Paper ID: 4, Page 9
6th International Seminar on ORC Power Systems, October 11 - 13, 2021, Munich, Germany
NOMENCLATURE
a sound speed (m/s) p pressure (Pa)
c velocity (m/s) s specific entropy (J/(kg K))
fs isentropic relation (–) T temperature (K)
h specific enthalpy (J/kg) x thermodynamic state vector
Ma Mach number (–)
Greek Symbols
isentropic exponent (–) density (kg/m3)
Subscripts
i index variable (Pitot probe) 0 stagnation condition
j index variable (freestream) 1 upstream of shock (freestream)
o total 2 downstream of shock (Pitot)
Supercript
* solution (for index variables i and j)
REFERENCES
Dixon, S. L., Hall, C. A., 2010, Fluid Mechanics and Thermodynamics of Turbomachinery, 6th
edition, Butterworth-Heinemann, Burlington, MA
Head, A., de Servi, C., Casati, E., Pini, M., Colonna, P., 2016, Preliminary Design of the ORCHID: A
Facility for Studying Non-Ideal Compressible Fluid Dynamics and Testing ORC Expanders,
Proceedings Conference: ASME Turbo Expo 2016: Turbomachinery Technical Conference and
Exposition
John, J. E., Keith, T. G., 2006, Gas Dynamics, 3rd edition, Pearson Prentice Hall, Upper Saddle River,
New Jersey
Liepmann, H. W., Roshko, A., 2001, Elements of Gasdynamics, Dover Publication, New York
N.N., 2021, REFPROP webpage, https://www.nist.gov/srd/refprop (an official website of the United
States government)
Passmann, M., aus der Wiesche, S., Joos, F., 2017, A one-dimensional analytical calculation method
for obtaining normal shock losses in supersonic real gas flows. IOP Conf. Series: Journal of
Physics: Conf. Series, vol. 821, 012004
Reinker, F., Hasselmann, K., aus der Wiesche, Stefan, and Kenig, E. Y., 2015, Thermodynamics and
fluid mechanics of a closed blade cascade wind tunnel for organic vapors, ASME Journal of
Engineering for Gas Turbines and Power, vol. 138(5), p. 052601
Reinker, F., Wagner, R., Passmann, M., Hake, L., aus der Wiesche, S., 2020, Performance of a
Rotatable Cylinder Pitot Probe in High Subsonic Non-Ideal Gas Flows, Proceedings 3rd
International Seminar on Non-Ideal Compressible Fluid Dynamics for Propulsion and Power,
Delft, The Netherlands
Spinelli, A., Pini, M., Dossena, V., Gaetani, P., Casella, F., 2013, Design, Simulation, and
Construction of a Test Rig for Organic Vapors, ASME Journal of Engineering for Gas Turbines
and Power, vpl. 135(4), p. 042304
Wyler, J. S., 1975, Probe Blockage Effects in Free Jets and Closed Tunnels, ASME J. Eng. Gas
Turbines Power, vol. 97(4), 509-514
ACKNOWLEDGEMENT
The fruitful discussion with Max Passmann about shock relations and data reduction is acknowledged.