paper – 3: cost accounting and financial management …. costing.unlockedrtps.pdf · (ii)...
TRANSCRIPT

PAPER – 3: COST ACCOUNTING AND FINANCIAL MANAGEMENT PART I: COST ACCOUNTING
QUESTIONS
Material 1. Aditya Agro Ltd. produces edible oils of different varieties. The monthly demand pattern
for the finished products are as follows: Mustard oil 45,000 Litre Soybean oil 15,000 Litre Olive oil 3,000 Litre
To produce one litre of Mustard oil, Soybean oil and Olive oil, 5 kg. of mustards, 6 kg. of soybeans and 4.5 kg. of olives are required respectively. There is no opening and closing stock of materials. Aditya Agro Ltd. can purchase the materials either from the farmers directly or from the wholesale market. The company can purchase any quantity of materials from the wholesale market but in case of purchase from the farmers, it has to purchase the minimum specified quantity of materials at a time. Following is the material-wise summary related with the purchase of materials:
Wholesale Market Farmers Mustard: Minimum Quantity to be purchased Any quantity 13,50,000 kg. Purchase price per kg. (`) 15.00 12.50 Central Sales Tax (CST)* 2% --- Transportation cost per purchase (`) 6,000 15,000 Sorting and piling cost per purchase (`) ---- 1,200 Loading cost per 50 kg. (`) 10.00 5.00 Unloading cost per 50 kg. (`) 2.00 2.00 Soybean: Minimum Quantity to be purchased Any Quantity 2,70,000 kg. Purchase price per kg. (`) 11.00 9.00 Value Added Tax (VAT)** 4% --- Transportation cost per purchase (`) 9,000 12,000 Sorting and piling cost per purchase (`) --- 800 Loading cost per 50 kg. (`) 10.00 3.00 Unloading cost per 50 kg. (`) 2.00 2.00
© The Institute of Chartered Accountants of India

58 INTERMEDIATE (IPC) EXAMINATION: NOVEMBER, 2014
Olive: Minimum Quantity to be purchased Any Quantity 1,62,000 kg. Purchase price per kg. (`) 36.00 28.00 Import duty*** --- 10% Transportation Cost per purchase (`) 3,000 11,000 Sorting and piling cost per purchase (`) 1,800 --- Loading cost per 50 kg. (`) 10.00 25.00 Unloading cost per 50 kg. (`) 2.00 2.00
The company is paying 12.5% p.a. as interest to its bank for cash credit facility and `100 per 100 kg. as rent to the warehouse. [*CST will be added with the purchase price of mustards; **VAT will not be added with the purchase price of soybeans; ***Import duty will be added with the purchase price of olives.] You are required to (i) Calculate the purchase cost of each material
(a) from Wholesale market (b) from the Farmers
(ii) Calculate Economic Order Quantity of each material under the both options. (iii) Recommend the best purchase option for the material ‘olive’.
Labour 2. Jigyasa Boutiques LLP. (JBL) takes contract on job works basis. It works for various
fashion houses and retail stores. It has employed 26 workers and pays them on time rate basis. On an average an employee is allowed 2 hours for boutique work on a piece of garment. In the month of March 2014, two workers Margaret and Jennifer were given 30 pieces and 42 pieces of garments respectively for boutique work. The following are the details of their work:
Margaret Jennifer Work assigned 30 pcs. 42 pcs. Time taken 28 hours 40 hours
Workers are paid bonus as per Halsey System. The existing rate of wages is ` 50 per hour. As per the new wages agreement the workers will be paid ` 55 per hour w.e.f. 1st April 2014. At the end of the month March 2014, the accountant of the company has calculated wages to these two workers taking ` 55 per hour. (i) From the above information calculate the amount of loss that the company has
incurred due to incorrect rate selection. (ii) What would be the loss incurred by the JBL due to incorrect rate selection if it had
followed Rowan scheme of bonus payment.
© The Institute of Chartered Accountants of India

PAPER – 3: COST ACCOUNTING AND FINANCIAL MANAGEMENT 59
(iii) Amount that could have been saved if Rowan scheme of bonus payment was followed.
(iv) Do you think Rowan scheme of bonus payment is suitable for JBL? Overheads 3. Vision Ltd. manufactures luggage trolleys for airports. The factory, in which the company
undertakes all of its production, has two production departments- ‘Fabrication’ and ‘Assembly’, and two service departments- ‘Stores’ and ‘Maintenance’. The following information have been extracted from the company’s budget for the financial year ended 31st March, 2014:
Allocated Overhead Costs ` Fabrication Department 15,52,000 Assembly Department 7,44,000 Stores Department 2,36,000 Maintenance Department 1,96,000 Other Overheads ` Factory rent 15,28,000 Factory building insurance 1,72,000 Plant & machinery insurance 1,96,000 Plant & Machinery Depreciation 2,65,000 Subsidy for staffs’ canteen 4,48,000
Direct Costs ` ` Fabrication Department: Material 63,26,000 Labour 8,62,000 71,88,000 Assembly Department: Material 1,42,000 Labour 13,06,000 14,48,000
The following additional information is also provided: Fabrication
Department Assembly Department
Stores Department
Maintenance Department
Floor area (square meters) 24,000 10,000 2,500 3,500 Value of plant & machinery (`) 16,50,000 7,50,000 75,000 1,75,000 No. of stores requisitions 3,600 1,400 --- --- Maintenance hours required 2,800 2,300 400 ---
© The Institute of Chartered Accountants of India

60 INTERMEDIATE (IPC) EXAMINATION: NOVEMBER, 2014
No. of employees 120 80 38 12 Machine hours 30,00,000 60,000 Labour hours 70,000 26,00,000
Required: (a) Prepare a table showing the distribution of overhead costs of the two service
departments to the two production departments using step method; and (b) Calculate the most appropriate overhead recovery rate for each department. (c) Using the rates calculated in part (b) above, calculate the full production costs of the
following job order: Job number IGI2014
Direct Materials ` 1,15,200 Direct Labour:
Fabrication Department 240 hours @ ` 18 per hour Assembly Department 180 hours @ ` 18 per hour
Machine hours required: Fabrication Department 210 hours Assembly Department 150 hours
Operating Costing 4. Gopal Milk Co-Operative Society (GMCS) collects raw milk from the farmers of Ramgarh,
Pratapgarh and Devgarh panchayats and processes these milk to make various dairy products. GMCS has its own vehicles (tankers) to collect and bring the milk to the processing plant. Vehicles are parked in the GMCS’s garage situated within the plant compound. Following are the some information related with the vehicles:
Ramgarh Pratapgarh Devgarh No. of vehicles assigned 4 3 5 No. of trips a day 3 2 2 One way distance from the processing plant 24 k.m. 34 k.m. 16 k.m. Toll tax paid p.m. (`) 2,850 3,020 ---
All the 5 vehicles assigned to Devgarh panchayat, were purchased five years back at a cost of ` 9,25,000 each. The 4 vehicles assigned to Ramgarh panchayat, were purchased two years back at a cost of ` 11,02,000 each and the remaining vehicles assigned to Pratapgarh were purchased last year at a cost of ` 13,12,000 each. With the purchase of each vehicle a two years free servicing warranty is provided. A vehicle gives 10 kmpl mileage in the first two year of purchase, 8 kmpl in next two years and 6 kmpl afterwards. The vehicles are subject to depreciation of 10% p.a. on straight line basis irrespective of usage. A vehicle has the capacity to carry 25,000 litres of milk but on an average only 70% of the total capacity is utilized. The following expenditure is related with the vehicles:
© The Institute of Chartered Accountants of India

PAPER – 3: COST ACCOUNTING AND FINANCIAL MANAGEMENT 61
Salary to a Driver (a driver for each vehicle) ` 18,000 p.m. Salary to a Cleaner (a cleaner for each vehicle)
` 11,000 p.m.
Allocated garage parking fee ` 1,350 per vehicle per month Servicing cost ` 3,000 for every complete 5,000 k.m.
run. Price of diesel per litre ` 58.00
From the above information you are required to calculate (i) Total operating cost per month for each vehicle. (Take 30 days for the month) (ii) Vehicle operating cost per litre of milk.
Job Costing 5. Ares Plumbing and Fitting Ltd. (APFL) deals in plumbing materials and also provides
plumbing services to its customers. On 12th August, 2014, APFL received a job order for a students’ hostel to supply and fitting of plumbing materials. The work is to be done on the basis of specification provided by the hostel owner. Hostel will be inaugurated on 5th September, 2014 and the work is to be completed by 3rd September, 2014. Following are the details related with the job work: Direct Materials APFL uses weighted average method for the pricing of materials issues. Opening stock of materials as on 12th August 2014: - 15mm GI Pipe, 12 units of (15 feet size) @ ` 600 each - 20mm GI Pipe, 10 units of (15 feet size) @ ` 660 each - Other fitting materials, 60 units @ ` 26 each - Stainless Steel Faucet, 6 units @ ` 204 each - Valve, 8 units @ ` 404 each Purchases: On 16th August 2014: - 20mm GI Pipe, 30 units of (15 feet size) @ ` 610 each - 10 units of Valve @ ` 402 each On 18th August 2014: - Other fitting materials, 150 units @ ` 28 each - Stainless Steel Faucet, 15 units @ ` 209 each On 27th August 2014: - 15mm GI Pipe, 35 units of (15 feet size) @ ` 628 each - 20mm GI Pipe, 20 units of (15 feet size) @ ` 660 each - Valve, 14 units @ ` 424 each Issues for the hostel job:
© The Institute of Chartered Accountants of India

62 INTERMEDIATE (IPC) EXAMINATION: NOVEMBER, 2014
On 12th August 2014: - 20mm GI Pipe, 2 units of (15 feet size) - Other fitting materials, 18 units On 17th August 2014: - 15mm GI Pipe, 8 units of (15 feet size) - Other fitting materials, 30 units On 28th August 2014: - 20mm GI Pipe, 2 units of (15 feet size) - 15mm GI Pipe, 10 units of (15 feet size) - Other fitting materials, 34 units - Valve, 6 units On 30th August: - Other fitting materials, 60 units - Stainless Steel Faucet, 15 units Direct Labour: Plumber: 180 hours @ ` 50 per hour (includes 12 hours overtime) Helper: 192 hours @ `35 per hour (includes 24 hours overtime) Overtimes are paid at 1.5 times of the normal wage rate. Overheads: Overheads are applied @ ` 13 per labour hour. Pricing policy: It is company’s policy to price all orders based on achieving a profit margin of 25% on sales price. You are required to (a) Calculate the total cost of the job. (b) Calculate the price to be charged from the customer
Joint Products & By Products 6. Oleum Refinery Ltd. refines crude oil and produces two joint product Gasoline and HSD
in the ratio of 4:6. The refining is done in three processes. Crude oil is first fed in Process-A, from where the two products Gasoline and HSD are get separated. After separation from Process-A, Gasoline and HSD are further processed in Process- B and Process- C respectively. During the month of July, 2014, 4,50,000 Ltr. of crude oil were processed in Process-A at a total cost of ` 1,71,99,775. In Process-B, Gasoline is further processed at a cost of ` 10,80,000. In Process- C, HSD is further processed at a cost of ` 1,35,000. The Input output ratio for the each process is as follows:
Process- A 1 : 0.80
© The Institute of Chartered Accountants of India

PAPER – 3: COST ACCOUNTING AND FINANCIAL MANAGEMENT 63
Process- B 1 : 0.95 Process- C 1 : 0.90
The details of sales during the month are: Gasoline HSD Quantity sold (Ltr.) 1,32,000 1,88,000 Sales price per Ltr.(`) 68 46
There were no opening stocks. If these products were sold at split-off point, the selling price of Gasoline and HSD would be ` 64 and ` 41 per Ltr. respectively. Required: (i) Prepare a statement showing the apportionment of joint cost to Gasoline and HSD
in proportion of sales value at split off point. (ii) Prepare a statement showing the cost per Ltr. of each product indicating joint cost,
processing cost and total cost separately. (iii) Prepare a statement showing the product wise profit or loss for the month.
Standard Costing 7. The standard material cost for a normal mix of one tonne of product “Captain” based on:
Raw Material Usage (in tonne) Price per tonne A 0.740 ` 12,000 B 0.400 ` 23,500 C 0.640 ` 18,000
During the month of July, 2014, 18 tonnes of product “Captain” were produced from: Raw Material Consumption (tonnes) Cost (`)
A 13.12 1,62,000 B 7.10 1,65,200 C 11.50 2,07,000
Required to Calculate: (i) Material Cost Variance (ii) Material Price Variance (iii) Material Usage Variance (iv) Material Mix Variance (v) Material Yield Variance
© The Institute of Chartered Accountants of India

64 INTERMEDIATE (IPC) EXAMINATION: NOVEMBER, 2014
Marginal Costing 8. Maxim Ltd. manufactures a product “N-joy”. In the month of August 2014, 14,000 units of
the product “N-joy” were sold, the details are as under: (`) Sale Revenue 2,52,000 Direct Material 1,12,000 Direct Labour 49,000 Variable Overheads 35,000 Fixed Overheads 28,000 A forecast for the month of September 2014 has been carried out by the General manger of Maxim Ltd. As per the forecast, price of direct material and variable overhead will be increased by 10% and 5% respectively. Required to calculate: (i) Number of units to be sold to maintain the same quantum of profit that made in
August 2014. (ii) Margin of safety in the month of August 2014 and September 2014.
Budget and Budgetary Control 9. A Light Motor Vehicle manufacturer has prepared sales budget for the next few months,
and the following draft figures are available: Month No. of vehicles October 4,000 November 3,500 December 4,500 January 6,000 February 6,500
To manufacture a vehicle, a standard cost of ` 2,85,700 is incurred and sold through dealers at an uniform selling price of ` 3,95,600 to customers. Dealers are paid 12.5% commission on selling price on sale of a vehicle. Apart from other materials four units of Part-X are required to manufacture a vehicle. It is a policy of the company to hold stocks of Part-X at the end of the each month to cover 40% of next month’s production. 4,800 units of Part-X are in stock as on 1st October. There are 950 nos. of completed vehicles are in stock as on 1st October and it is policy to have stocks at the end of each month to cover 20% of the next month’s sales. You are required to (a) Prepare Production budget (in nos.) for the month of October, November, December
and January.
© The Institute of Chartered Accountants of India

PAPER – 3: COST ACCOUNTING AND FINANCIAL MANAGEMENT 65
(b) Prepare a Purchase budget for Part-X (in units) for the months of October, November and December.
(c) Calculate the budgeted gross profit for the quarter October to December. Miscellaneous 10. (a) What is Cost accounting? Enumerate its important objectives.
(b) What are the reasons for disagreement of profits as per cost accounts and financial accounts? Discuss.
(c) What is cost plus contract? State its advantages. (d) What is inter-process profit? State its advantages and disadvantages.
SUGGESTED HINTS/ANSWERS
1. (i) Calculation of Purchase Cost per Kg. of Materials Wholesale Market (`) Farmers (`) Mustard: Purchase price 15.00 12.50 Add: Central Sales Tax @ 2% 0.30 --- Add: Loading Cost 0.20
(` 10 ÷ 50 Kg.) 0.10
(` 5 ÷ 50 Kg.) Add: Unloading Cost 0.04
(` 2 ÷ 50 Kg.) 0.04
(` 2 ÷ 50 Kg.) 15.54 12.64 Soybean: Purchase price 11.00 9.00 Add: Loading Cost 0.20
(` 10 ÷ 50 Kg.) 0.06
(` 3 ÷ 50 Kg.) Add: Unloading Cost 0.04
(` 2 ÷ 50 Kg.) 0.04
(` 2 ÷ 50 Kg.) 11.24 9.10 Olive: Purchase price 36.00 28.00 Add: Import duty @ 10% --- 2.80 Add: Loading Cost 0.20
(` 10 ÷ 50 Kg.) 0.50
(` 25 ÷ 50 Kg.)
© The Institute of Chartered Accountants of India

66 INTERMEDIATE (IPC) EXAMINATION: NOVEMBER, 2014
Add: Unloading Cost 0.04 (` 2 ÷ 50 Kg.)
0.04 (` 2 ÷ 50 Kg.)
36.24 31.34
(ii) Economic Order Quantity (E.O.Q) = 2 Annualrequirement Orderingcos tCarryingcos t per kg.per annum
× ×
Annual Requirement (A) : Commodity Quantity (Kg.) Mustard (45,000 Ltr. × 5 Kg. × 12 months) 27,00,000 Soybean (15,000 Ltr. × 6 Kg. × 12 months) 10,80,000 Olive (3,000 Ltr. × 4.5 Kg. × 12 months) 1,62,000
Cost per Order (O): Wholesale Market (`) Farmers (`) Mustard:
- Transportation cost 6,000 15,000 - Sorting and piling cost --- 1,200
6,000 16,200 Soybean:
- Transportation cost 9,000 12,000 - Sorting and piling cost --- 800
9,000 12,800 Olive:
- Transportation cost 3,000 11,000 - Sorting and piling cost 1,800 ---
4,800 11,000
Carrying Cost per Kg. per annum (C × i): Wholesale Market (`) Farmers (`) Mustard:
- Interest on cash credit 1.9425 (` 15.54 × 12.5%)
1.5800 (` 12.64 × 12.5%)
- Warehouse rent* 1.0000 1.0000 2.9425 2.5800
© The Institute of Chartered Accountants of India

PAPER – 3: COST ACCOUNTING AND FINANCIAL MANAGEMENT 67
Soybean: - Interest on cash credit 1.4050
(` 11.24 × 12.5%) 1.1375
(` 9.10 × 12.5%) - Warehouse rent 1.0000 1.0000
2.4050 2.1375 Olive:
- Interest on cash credit 4.5300 (` 36.24 × 12.5%)
3.9175 (` 31.34 × 12.5%)
- Warehouse rent 1.0000 1.0000 5.5300 4.9175
* Warehouse rent per Kg. = 100100Kg.` = ` 1
Calculation of E.O.Q for each material under the both options Wholesale Market (Kg.) Farmers (Kg.) Mustard 2 27,00,000Kg. 6,000
2.9425× ×`
` 2 27,00,000Kg. 16,200
2.5800× ×`
`
= 1,04,933.53 = 1,84,138.47 Soybean 2 10,80,000Kg. 9,000
2.4050× ×`
` 2 10,80,000Kg. 12,800
2.1375× ×`
`
= 89,906.40 = 1,13,730.98 Olive 2 1,62,000Kg. 4,800
5.5300× ×`
` 2 1,62,000Kg. 11,000
4.9175× ×`
`
= 16,769.90 = 26,921.34 (iii) Selection of best purchase option for the purchase of Olives
Wholesale Market Farmers Annual Requirement (A) (Kg.) 1,62,000 1,62,000 Order Quantity (Q) 16,769.90 1,62,000
No. of orders AQ
⎛ ⎞⎜ ⎟⎝ ⎠
9.66 or 10 1
Average Inventory Q2
⎛ ⎞⎜ ⎟⎝ ⎠
(Kg.) 8,384.95 81,000
© The Institute of Chartered Accountants of India

68 INTERMEDIATE (IPC) EXAMINATION: NOVEMBER, 2014
Ordering Cost (`) (I) 48,000 (10 Orders × ` 4,800)
11,000 (1 Order × ` 11,000)
Carrying Cost (`) (II) (Average Inventory × Carrying cost per kg.)
46,368.77 (8,384.95 Kg. × `
5.5300)
3,98,317.5 (81,000 Kg. × `
4.9175) Purchase Cost (`) (III) 58,70,880
(1,62,000 Kg. × ` 36.24)
50,77,080 (1,62,000 Kg. × `
31.34) Total Cost (I) + (II) + (III) 59,65,248.77 54,86,397.50
Purchasing olives direct from the farmers is the best purchase option for the Aditya Agro Ltd.
2. Margaret Jennifer No. of garments assigned (Pieces.) 30 42 Hour allowed per piece (Hours) 2 2 Total hours allowed (Hours) 60 84 Hours Taken (Hours) 28 40 Hours Saved (Hours) 32 44
(i) Calculation of loss incurred due to incorrect rate selection. (While calculating loss only excess rate per hour has been taken)
Margaret (`)
Jennifer (`)
Total (`)
Basic Wages 140 (28 Hrs. × ` 5)
200 (40 Hrs. × ` 5)
340
Bonus (as per Halsey Scheme) (50% of Time Saved × Excess Rate)
80 (50% of 32 Hrs. × ` 5)
110 (50% of 44 Hrs. × ` 5)
190
Excess Wages Paid 220 310 530
(ii) Amount of loss if Rowan scheme of bonus payment were followed Margaret (`) Jennifer (`) Total
(`) Basic Wages 140.00
(28 Hrs. × ` 5) 200.00
(40 Hrs. × ` 5) 340.00
© The Institute of Chartered Accountants of India

PAPER – 3: COST ACCOUNTING AND FINANCIAL MANAGEMENT 69
Bonus (as per Rowan Scheme) Time Taken
TimeSaved ExcessRateTime Allowed
× ×⎛ ⎞⎜ ⎟⎝ ⎠
74.67 28 32 560× ×⎛ ⎞
⎜ ⎟⎝ ⎠
`
104.76 40 44 584× ×⎛ ⎞
⎜ ⎟⎝ ⎠
`
179.43
Excess Wages Paid 214.67 304.76 519.43 (iii) Calculation of amount that could have been saved if Rowan Scheme were followed
Margaret (`) Jennifer (`) Total (`) Wages paid under Halsey Scheme 220.00 310.00 530.00 Wages paid under Rowan Scheme 214.67 304.76 519.43 Difference (Savings) 5.33 5.24 10.57
(iv) Rowan Scheme of incentive payment has the following benefits, which is suitable with the nature of business in which Jigyasa Boutique LLP operates: (i) Under Rowan Scheme of bonus payment, workers cannot increase their earnings
or bonus by merely increasing its work speed. Bonus under Rowan Scheme is maximum when the time taken by a worker on a job is half of the time allowed. As this fact is known to the workers, therefore, they work at such a speed which helps them to maintain the quality of output too.
(ii) If the rate setting department commits any mistake in setting standards for time to be taken to complete the works, the loss incurred will be relatively low.
3. (a) Table of Primary Distribution of Overheads Particulars Basis of
Apportionment Total Amount
Production Department
Service Departments
Fabrication Assembly Stores Maintenance Overheads Allocated
Allocation 27,28,000 15,52,000 7,44,000 2,36,000 1,96,000
Direct Costs Actual 86,36,000 71,88,000 14,48,000 --- --- Other Overheads: Factory rent Floor Area
(48:20:5:7) 15,28,000 9,16,800 3,82,000 95,500 1,33,700
Factory building insurance
Floor Area (48:20:5:7)
1,72,000 1,03,200 43,000 10,750 15,050
Plant & Machinery insurance
Value of Plant & Machinery (66:30:3:7)
1,96,000 1,22,038 55,472 5,547 12,943
Plant & Machinery Depreciation
Value of Plant & Machinery (66:30:3:7)
2,65,000 1,65,000 75,000 7,500 17,500
© The Institute of Chartered Accountants of India

70 INTERMEDIATE (IPC) EXAMINATION: NOVEMBER, 2014
Canteen Subsidy No. of employees (60:40:19:6)
4,48,000 2,15,040 1,43,360 68,096 21,504
1,39,73,000 1,02,62,078 28,90,832 4,23,393 3,96,697
Re-distribution of Service Departments’ Expenses:
(b) Overhead Recovery Rate Department Apportioned
Overhead (`) Basis of Overhead Recovery Rate
Overhead Recovery Rate (`)
(I) (II) [(I) ÷ (II)] Fabrication 1,07,89,649 30,00,000 Machine Hours 3.60 per Machine Hour Assembly 31,83,351 26,00,000 Labour Hours 1.22 per Labour Hour
(c) Calculation of full production costs of Job no. IGI2014. Particulars Amount (`) Direct Materials 1,15,200 Direct Labour:
- Fabrication Deptt. (240 hours × ` 18) 4,320 - Assembly Deptt. (180 hours × ` 18) 3,240
Production Overheads: - Fabrication Deptt. (210 hours × ` 3.60) 756 - Assembly Deptt. (180 hours × ` 1.22) 220
Total Production Cost 1,23,736
Particulars Basis of Apportionment
Production Department
Service Departments
Fabrication Assembly Stores Maintenance Overheads as per Primary distribution
As per Primary distribution
1,02,62,078 28,90,832 4,23,393 3,96,697
Maintenance Department Cost
Maintenance Hours (28:23:4:-)
2,01,955 1,65,891 28,851 (3,96,697)
1,04,64,033 30,56,723 4,52,244 --- Stores Department No. of Stores
Requisition (18:7:-:-)
3,25,616 1,26,628 (4,52,244)
1,07,89,649 31,83,351 --- ---
© The Institute of Chartered Accountants of India

PAPER – 3: COST ACCOUNTING AND FINANCIAL MANAGEMENT 71
4. (i) Calculation of Operating Cost per month for each vehicle Ramgarh Pratapgarh Devgarh Total A. Running Costs:
- Cost of diesel (Working Note- 2)
1,25,280 70,992 92,800 2,89,072
- Servicing cost (Working Note- 3)
9,000 --- 3,000 12,000
1,34,280 70,992 95,800 3,01,072 B. Fixed Costs:
- Salary to drivers 72,000 (4 drivers ×
` 18,000)
54,000 (3 drivers ×
` 18,000)
90,000 (5 drivers ×
` 18,000)
2,16,000
- Salary to cleaners 44,000 (4 cleaners ×
` 11,000)
33,000 (3 cleaners ×
` 11,000)
55,000 (5 cleaners ×
` 11,000)
1,32,000
- Allocated garage parking fee
5,400 (4 vehicles ×
` 1,350)
4,050 (3 vehicles ×
` 1,350)
6,750 (5 vehicles ×
` 1,350)
16,200
- Depreciation (Working Note- 4)
36,733 32,800 38,542 1,08,075
- Toll tax passes 2,850 3,020 --- 5,870 1,60,983 1,26,870 1,90,292 4,78,145
Total [A + B] 2,95,263 1,97,862 2,86,092 7,79,217 Operating Cost per vehicle
73,815.75 (` 2,95,263 ÷ 4
vehicles)
65,954 (` 1,97,862 ÷ 3
vehicles)
57,218.40 (` 2,86,092 ÷ 5
vehicles)
64,934.75 (` 7,79,217 ÷
12 vehicles)
(ii) Vehicle operating cost per litre of milk TotalOperatingCost per month
Totalmilk carriedamonth =
(WorkingNote 5)7,79,217
1,47,00,000Litres −
` = ` 0.053
Working Notes: 1. Distance covered by the vehicles in a month
Route Total Distance (in K.M.)
Ramgarh (4 vehicles × 3 trips × 2 × 24 km. × 30 days) 17,280 Pratapgarh (3 vehicles × 2 trips × 2 × 34 km. × 30 days) 12,240 Devgarh (5 vehicles × 2 trips × 2 × 16 km. × 30 days) 9,600
© The Institute of Chartered Accountants of India

72 INTERMEDIATE (IPC) EXAMINATION: NOVEMBER, 2014
2. Cost of diesel consumption Ramgarh Pratapgarh Devgarh Total distance travelled (K.M.) 17,280 12,240 9,600 Mileage per litre of diesel 8 kmpl 10 kmpl 6 kmpl Diesel consumption (Litre) 2,160
(17,280 ÷ 8) 1,224
(12,240 ÷ 10) 1,600
(9,600 ÷ 6) Cost of diesel consumption @ ` 58 per litre (`)
1,25,280 70,992 92,800
3. Servicing Cost Ramgarh Pratapgarh Devgarh Total distance travelled (K.M.) 17,280 12,240 9,600 Covered under free service warranty
No Yes No
No. of services required 3 (17,280 k.m.
÷ 5,000 k.m.)
2 (12,240 k.m. ÷
5,000 k.m.)
1 (9,600 k.m.
÷ 5,000 k.m.)
Total Service Cost (`) 9,000 (` 3,000 × 3)
--- 3,000 (` 3,000 × 1)
4. Calculation of Depreciation Ramgarh Pratapgarh Devgarh No. of vehicles
4 3 5
Cost of a vehicle
11,02,000 13,12,000 9,25,000
Total Cost of vehicles
44,08,000 39,36,000 46,25,000
Depreciation per month
36,733 44,08,000 10%
12months×⎛ ⎞
⎜ ⎟⎝ ⎠
`
32,800 39,36,000 10%
12months×⎛ ⎞
⎜ ⎟⎝ ⎠
`
38,542 46,25,000 10%
12months×⎛ ⎞
⎜ ⎟⎝ ⎠
`
5. Total volume of Milk Carried Route Milk Qty. (Litre) Ramgarh ( 25,000 ltr. × 0.7 × 4 vehicles × 3 trips × 30 days) 63,00,000 Pratapgarh (25,000 ltr. × 0.7 × 3 vehicles × 2 trips × 30 days) 31,50,000 Devgarh (25,000 ltr. × 0.7 × 5 vehicles × 2 trips × 30 days) 52,50,000 1,47,00,000
© The Institute of Chartered Accountants of India

PAPER – 3: COST ACCOUNTING AND FINANCIAL MANAGEMENT 73
5. (a) Calculation of Total Cost for the Hostel Job Particulars Amount
(`) Amount (`)
Direct Material Cost: - 15mm GI Pipe (Working Note- 1) 11,051.28 - 20mm GI Pipe (Working Note- 2) 2,588.28 - Other fitting materials (Working Note- 3) 3,866.07 - Stainless steel faucet
15 units × 6 204 15 20921units
× + ×⎛ ⎞⎜ ⎟⎝ ⎠
` ` 3,113.57
- Valve
6 units × 8 404 10 402 14 42432units
× + × + ×⎛ ⎞⎜ ⎟⎝ ⎠
` ` ` 2,472.75 23,091.95
Direct Labour: - Plumber [(180 hours × ` 50) + (12 hours × ` 25)] 9,300.00 - Helper [(192 hours × ` 35) + (24 hours × ` 17.5)] 7,140.00 16,440.00 - Overheads [` 13 × (180 + 192) hours] 4,836.00 Total Cost 44,367.95
(b) Price to be charged for the job work: Amount (`) Total Cost incurred on the job 44,367.95
Add: 25% Profit on Job Price 44,367.95 25%75%
⎛ ⎞×⎜ ⎟⎝ ⎠
14,789.32
59,157.27
Working Note: 1. Cost of 15mm GI Pipe
Date Amount (`) 17-08-2014 8 units × ` 600 4,800.00 28-08-2014
10 units × 4 600 35 62839units
× + ×⎛ ⎞⎜ ⎟⎝ ⎠
` ` 6,251.28
11,051.28
© The Institute of Chartered Accountants of India
74 INTERMEDIATE (IPC) EXAMINATION: NOVEMBER, 2014
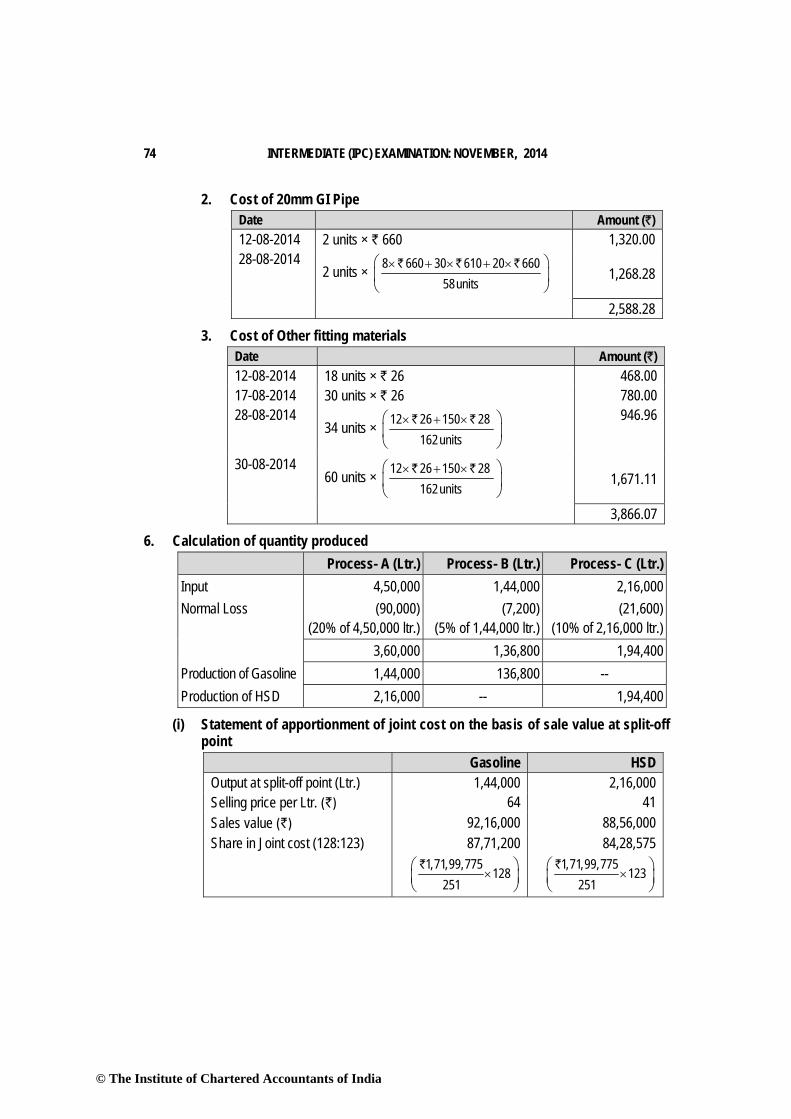
2. Cost of 20mm GI Pipe Date Amount (`) 12-08-2014 2 units × ` 660 1,320.00 28-08-2014
2 units × 8 660 30 610 20 66058units
× + × + ×⎛ ⎞⎜ ⎟⎝ ⎠
` ` ` 1,268.28
2,588.28
3. Cost of Other fitting materials Date Amount (`) 12-08-2014 18 units × ` 26 468.00 17-08-2014 30 units × ` 26 780.00 28-08-2014
34 units × 12 26 150 28162units
× + ×⎛ ⎞⎜ ⎟⎝ ⎠
` ` 946.96
30-08-2014 60 units × 12 26 150 28
162units× + ×⎛ ⎞
⎜ ⎟⎝ ⎠
` ` 1,671.11
3,866.07
6. Calculation of quantity produced Process- A (Ltr.) Process- B (Ltr.) Process- C (Ltr.) Input 4,50,000 1,44,000 2,16,000 Normal Loss (90,000)
(20% of 4,50,000 ltr.) (7,200)
(5% of 1,44,000 ltr.) (21,600)
(10% of 2,16,000 ltr.) 3,60,000 1,36,800 1,94,400 Production of Gasoline 1,44,000 136,800 -- Production of HSD 2,16,000 -- 1,94,400
(i) Statement of apportionment of joint cost on the basis of sale value at split-off point
Gasoline HSD Output at split-off point (Ltr.) 1,44,000 2,16,000 Selling price per Ltr. (`) 64 41 Sales value (`) 92,16,000 88,56,000 Share in Joint cost (128:123) 87,71,200
1,71,99,775128
251×
⎛ ⎞⎜ ⎟⎝ ⎠
`
84,28,575 1,71,99,775
123251
×⎛ ⎞⎜ ⎟⎝ ⎠
`
© The Institute of Chartered Accountants of India

PAPER – 3: COST ACCOUNTING AND FINANCIAL MANAGEMENT 75
(ii) Statement of cost per Litre. Gasoline HSD Output (Ltr.) 1,36,800 1,94,400 Share in joint cost (`) 87,71,200 84,28,575 Cost per Ltr. (`) (Joint cost) 64.11 43.36 Further processing cost (`) 10,80,000 1,35,000 Further processing cost per Ltr. (`) 7.89 0.69 Total cost per Ltr. (`) 72.00 44.05
(iii) Statement of profit Gasoline HSD Output (Ltr.) 1,36,800 1,94,400 Sales (Ltr.) 1,32,000 1,88,000 Closing stock (Ltr.) 4,800 6,400 (`) (`)
Sales @ `68 and `46 for Gasoline and HSD respectively
89,76,000 86,48,000
Add: closing stock (Ltr.) (at full cost) 3,45,600 2,81,920 Value of production 93,21,600 89,29,920 Less: Share in joint cost 87,71,200 84,28,575 Further processing 10,80,000 1,35,000 Profit/ (Loss) (5,29,600) 3,66,345
7. (i) Material Cost Variance = Standard Cost – Actual Cost Or = SP × SQ – AP × AQ A = (` 12,000 × 18 tonne × 0.74) – ` 1,62,000 = ` 2,160 (A)
B = (` 23,500 × 18 tonne × 0.40) – ` 1,65,200 = ` 4,000 (F) C = (` 18,000 × 18 tonne × 0.64) – ` 2,07,000 = ` 360 (F) = ` 2,200 (F)
(ii) Material Price Variance = Actual Quantity (Std. Price – Actual Price) Or = AQ × SP – AQ × AP A = (13.12 tonne × ` 12,000) – ` 1,62,000
= ` 1,57,440 - ` 1,62,000 = ` 4,560 (A) B = (7.1 tonne × ` 23,500) – ` 1,65,200
= ` 1,66,850 - ` 1,65,200 = ` 1,650 (F) C = (11.5 tonne × ` 18,000) – ` 2,07,000
© The Institute of Chartered Accountants of India

76 INTERMEDIATE (IPC) EXAMINATION: NOVEMBER, 2014
= ` 2,07,000 - ` 2,07,000 = Nil = ` 2,910 (A)
(iii) Material Usage Variance = Std. Price (Std. Quantity – Actual Quantity) Or = SP × SQ – SP × AQ A = (`12,000 × 18 tonne × 0.74) – (` 12,000 × 13.12 tonne)
= ` 1,59,840 – ` 1,57,440 = ` 2,400 (F) B = (`23,500 × 18 tonne × 0.40) – (` 23,500 × 7.10 tonne)
= ` 1,69,200 – ` 1,66,850 = ` 2,350 (F) C = (`18,000 × 18 tonne × 0.64) – (` 18,000 × 11.5 tonne)
= ` 2,07,360 – ` 2,07,000 = ` 360 (F) = ` 5,110 (F)
(iv) Material Mix Variance = Std. Price (Revised Std. Quantity – Actual Quantity) Or = SP × RSQ – SP × AQ
A = 0.7412,000 × 31.72 tonne × 1.78
⎛ ⎞⎜ ⎟⎝ ⎠
` – (` 12,000 × 13.12 tonne)
= `1,58,243.6 – `1,57,440 = ` 803.60 (F)
B = 0.4023,500 × 31.72 tonne × 1.78
⎛ ⎞⎜ ⎟⎝ ⎠
` – (` 23,500 × 7.10 tonne)
= ` 1,67,510.11 – `1,66,850 = ` 660.11 (F)
C = 0.6418,000 × 31.72 tonne × 1.78
⎛ ⎞⎜ ⎟⎝ ⎠
` ) – (` 18,000 × 11.5 tonne)
= ` 2,05,288.99 – ` 2,07,000 = ` 1,711.01 (A) = ` 2,47.30 (A)
(v) Material Yield Variance = Std. Price (Std. Quantity - Revised Std. Quantity) Or = SP × SQ – SP × RSQ
A = (`12,000 × 18 tonne × 0.74) - 0.7412,000 × 31.72 tonne × 1.78
⎛ ⎞⎜ ⎟⎝ ⎠
`
= `1,59,840 - `1,58,243.6 = ` 1,596.40 (F)
B = (`23,500 × 18 tonne × 0.40) - 0.4023,500 × 31.72 tonne × 1.78
⎛ ⎞⎜ ⎟⎝ ⎠
`
= ` 1,69,200 - ` 1,67,510.11 = ` 1,689.89 (F)
C = (`18,000 × 18 tonne × 0.64) - 0.6418,000 × 31.72 tonne × 1.78
⎛ ⎞⎜ ⎟⎝ ⎠
`
= ` 2,07,360 - ` 2,05,288.99 = ` 2,071.01 (F) = ` 5,357.30 (F)
© The Institute of Chartered Accountants of India

PAPER – 3: COST ACCOUNTING AND FINANCIAL MANAGEMENT 77
8. Calculation of Profit made in the month of August 2014 by selling 14,000 units. Amount per unit (`) Amount (`) Sales Revenue 18.00 2,52,000 Less: Variable Costs:
- Direct Material 8.00 1,12,000 - Direct Labour 3.50 49,000 - Variable Overhead 2.50 35,000
Contribution 4.00 56,000 Less: Fixed Overhead 2.00 28,000 Profit 2.00 28,000
(i) To maintain the same amount of profit i.e. ` 28,000 in September 2014 also, the company needs to maintain a contribution of ` 56,000.
Let, number of units to be sold in September 2014 is ‘x’, then the contribution will be
` 18 x – [(`8 × 1.10) + ` 3.5 + (` 2.5 × 1.05)] x = ` 56,000 ` 18 x – (` 8.8 + ` 3.5 + ` 2.625) x = ` 56,000
Or, x = 56,0003.075
`
`
= 18,211.38 units or 18,212 units.
(ii) Margin of Safety August 2014 September 2014 Profit ` 28,000 ` 28,000 P/V Ratio 4 100
18×
`
` 3.075 100
18×
`
`
Margin of Safety `1,26,000
`1,63,902.44 Pr ofit
100P / VRatio
×⎛ ⎞⎜ ⎟⎝ ⎠
28,000
18 100400
× ×⎛ ⎞⎜ ⎟⎝ ⎠
28,00018 100
307.5× ×⎛ ⎞
⎜ ⎟⎝ ⎠
9. (a) Preparation of Production Budget (in units) October November December January
Demand for the month (Nos.) 4,000 3,500 4,500 6,000 Add: 20% of next month’s demand 700 900 1,200 1,300 Less: Opening Stock (950) (700) (900) (1,200) Vehicles to be produced 3,750 3,700 4,800 6,100
© The Institute of Chartered Accountants of India

78 INTERMEDIATE (IPC) EXAMINATION: NOVEMBER, 2014
(b) Preparation of Purchase budget for Part-X October November December
Production for the month (Nos.)
3,750 3,700 4,800
Add: 40% of next month’s production
1,480 (40% of 3,700)
1,920 (40% of 4,800)
2,440 (40% of 6,100)
5,230 5,620 7,240 No. of units required for production
20,920 (5,230 × 4
units)
22,480 (5,620 × 4
units)
28,960 (7,240 × 4
units) Less: Opening Stock (4,800) (5,920)
(1,480 × 4 units)
(7,680) (1,920 × 4
units) No. of units to be purchased 16,120 16,560 21,280
(c) Budgeted Gross Profit for the Quarter October to December October November December Total
Sales in nos. 4,000 3,500 4,500 12,000 Net Selling Price per unit* ` 3,46,150 ` 3,46,150 ` 3,46,150
Sales Revenue (` in lakh) 13,846 12,115.25 15,576.75 41,538 Less: Cost of Sales (` in lakh) (Sales unit × Cost per unit)
11,428
9,999.50 12,856.50 34,284
Gross Profit (` in lakh) 2,418 2,115.75 2,720.25 7,254 * Net Selling price unit = ` 3,95,600 – 12.5% commission on ` 3,95,600 = ` 3,46,150
10. (a) Cost Accounting is defined as "the process of accounting for cost which begins with the recording of income and expenditure or the bases on which they are calculated and ends with the preparation of periodical statements and reports for ascertaining and controlling costs."
The main objectives of the cost accounting are as follows: (a) Ascertainment of cost: There are two methods of ascertaining costs, viz., Post
Costing and Continuous Costing. Post Costing means, analysis of actual information as recorded in financial books. Continuous Costing, aims at collecting information about cost as and when the activity takes place so that as soon as a job is completed the cost of completion would be known.
(b) Determination of selling price: Business enterprises run on a profit making basis. It is thus necessary that the revenue should be greater than the costs incurred. Cost accounting provides the information regarding the cost to make and sell the product or services produced.
© The Institute of Chartered Accountants of India

PAPER – 3: COST ACCOUNTING AND FINANCIAL MANAGEMENT 79
(c) Cost control and cost reduction: To exercise cost control, the following steps should be observed: (i) Determine clearly the objective. (ii) Measure the actual performance. (iii) Investigate into the causes of failure to perform according to plan; (iv) Institute corrective action.
(d) Cost Reduction may be defined “as the achievement of real and permanent reduction in the unit cost of goods manufactured or services rendered without impairing their suitability for the use intended or diminution in the quality of the product.”
(e) Ascertaining the profit of each activity: The profit of any activity can be ascertained by matching cost with the revenue of that activity. The purpose under this step is to determine costing profit or loss of any activity on an objective basis.
(f) Assisting management in decision making: Decision making is defined as a
process of selecting a course of action out of two or more alternative courses. For making a choice between different courses of action, it is necessary to make a comparison of the outcomes, which may be arrived under different alternatives.
(b) Reasons for disagreement of profits as per cost and financial accounts: The various reasons for disagreement of profits shown by the two sets of books viz., cost and financial may be listed as below: 1. Items appearing only in financial accounts: The following items of income and
expenditure are normally included in financial accounts and not in cost accounts. Their inclusion in cost accounts might lead to unwise managerial decisions. These items are: (i) Income:
(a) Profit on sale of assets (b) Interest received (c) Dividend received (d) Rent receivable (e) Share Transfer fees
(ii) Expenditure (a) Loss on sale of assets (b) Uninsured destruction of assets (c) Loss due to scrapping of plan and machinery (d) Preliminary expenses written off (e) Goodwill written off
© The Institute of Chartered Accountants of India

80 INTERMEDIATE (IPC) EXAMINATION: NOVEMBER, 2014
(f) Underwriting commission and debenture discount written off (g) Interest on mortgage and loans (h) Fines and penalties
(iii) Appropriation (a) Dividends (b) Reserves (c) Dividend equalization fund, Sinking fund etc.
2. Items appearing only in cost accounts: There are some items which are included in cost accounts but not in financial account. These are: (d) Notional interest on capital; (e) Notional rent on premises owned.
3. Under or over-absorption of overhead: In cost accounts overheads are charged to production at pre-determined rates where in financial accounts actual amount of overhead is charged, the difference gives rise under or over-absorption; causing a difference in profits.
4. Different bases of stock valuation: In financial books, stocks are valued at cost or market price, whichever is lower. In cost books, however, stock of materials may be valued on FIFO or LIFO basis and work-in-progress may be valued at prime cost or works cost. Differences in store valuation may thus cause a difference between the two profits.
5. Depreciation: The amount of depreciation charge may be different in the two sets of books either because of the different methods of calculating depreciation or the rates adopted. In company accounts, for instance, the straight line method may be adopted whereas in financial accounts it may be the diminishing balance method.
(c) Cost plus contract: Under cost plus contract, the contract price is ascertained by adding a percentage of profit to the total cost of the work. Such types of contracts are entered into when it is not possible to estimate the contract cost with reasonable accuracy due to unstable condition of material, labour services etc. Following are the advantages of cost plus contract: (i) The contractor is assured of a fixed percentage of profit. There is no risk of
incurring any loss on the contract. (ii) It is useful specially when the work to be done is not definitely fixed at the time
of making the estimate. (iii) Contractee can ensure himself about the ‘cost of contract’ as he is empowered
to examine the books and documents of the contractor to ascertain the veracity of the cost of contract.
(d) In some process industries the output of one process is transferred to the next process not at cost but at market value or cost plus a percentage of profit. The difference between cost and the transfer price is known as inter-process profits.
© The Institute of Chartered Accountants of India

PAPER – 3: COST ACCOUNTING AND FINANCIAL MANAGEMENT 81
The advantages and disadvantages of using inter-process profit, in the case of process type industries are as follows:
Advantages: 1. Comparison between the cost of output and its market price at the stage of
completion is facilitated. 2. Each process is made to stand by itself as to the profitability.
Disadvantages: 1. The use of inter-process profits involves complication. 2. The system shows profits which are not realised because of stock not sold out.
© The Institute of Chartered Accountants of India

82 INTERMEDIATE (IPC) EXAMINATION: NOVEMBER, 2014
PART II: FINANCIAL MANAGEMENT QUESTIONS
1. Answer the following, supporting the same with reasoning/working notes: (a) Discuss the risk-return considerations in financing of current assets. (b) Alpha Limited has ` 10 crores bonds outstanding. Bank deposits earn 10 per cent
per annum. The bonds will be redeemed after 15 years for which purpose Alpha Limited wishes to create a sinking fund. How much amount should be deposited to the sinking fund each year so that Alpha Limited would have in the sinking fund ` 10 crores to retire its entire issue of bonds?
(c) The overall cost of capital can be reduced by increasing the debt portion in the capital structure. Discuss.
(d) Determine the present value of ` 700 each paid at the end of each of the next six years. Assume an 8 per cent of interest.
(e) “Liquidity ratios are particularly useful in credit analysis by banks and other suppliers of short-term loans.” Comment.
Management of Working Capital 2. Beta Limited faces an interest rate of 0.5 per cent per day and its broker charges ` 75 for
each transaction in short-term securities. The managing director has stated that the minimum cash balance that is acceptable is ` 2,000 and that the variance of cash flows on a daily basis is ` 16,000. You are required to determine the maximum level of cash Beta Limited should hold and at what point should it start to purchase or sell securities?
Investment Decisions 3. Zeta Limited wants to replace its old machine with a new automatic machine. Two
models A and B are available at the same cost of ` 5 lakhs each. Salvage value of the old machine is ` 1 lakh. The utilities of the existing machine can be used if the company purchases A. Additional cost of utilities to be purchased in that case are ` 1 lakh. If the company purchases B then all the existing utilities will have to be replaced with new utilities costing ` 2 lakhs. The salvage value of the old utilities will be ` 0.20 lakhs. The earnings after taxation are expected to be:
(Cash inflows of) Year A
` B `
P.V. Factor @ 15%
1. 1,00,000 2,00,000 0.87 2. 1,50,000 2,10,000 0.76 3. 1,80,000 1,80,000 0.66
© The Institute of Chartered Accountants of India

PAPER – 3 : COST ACCOUNTING AND FINANCIAL MANAGEMENT 83
4. 2,00,000 1,70,000 0.57 5. 1,70,000 40,000 0.50 Salvage Value at the end of Year 5 50,000 60,000
The targeted return on capital is 15%. You are required to (i) Compute, for the two machines separately, net present value, discounted payback period and desirability factor and (ii) Advice which of the machines is to be selected ?
Financing Decisions 4. Gamma Limited has the following capital structure which is considered to be optimum as
on 31st March, 2014.
` 14% Debentures 30,000 11% Preference shares 10,000 Equity (10,000 shares) 1,60,000 2,00,000
The company share has a market price of ` 23.60. Next year dividend per share is 50% of year 2014 EPS. The following is the trend of EPS for the preceding 10 years which is expected to continue in future.
Year EPS (`) Year EPS `) 2005 1.00 2010 1.61 2006 1.10 2011 1.77 2007 1.21 2012 1.95 2008 1.33 2013 2.15 2009 1.46 2014 2.36
The company issued new debentures carrying 16% rate of interest and the current market price of debenture is ` 96. Preference shares ` 9.20 (with annual dividend of ` 1.1 per share) were also issued. The company is in 50% tax bracket. (a) Calculate after tax:
(i) Cost of new debt (ii) Cost of new preference shares (iii) New equity share (consuming new equity from retained earnings)
(b) Calculate marginal cost of capital when no new shares are issued.
© The Institute of Chartered Accountants of India

84 INTERMEDIATE (IPC) EXAMINATION: NOVEMBER, 2014
(c) How much needs to be spent for capital investment before issuing new shares? 50% of the 2014 earnings are available as retained earnings for the purpose of capital investment.
(d) What will the marginal cost of capital when the funds exceed the amount calculated in (c), assuming new equity is issued at ` 20 per share?
Financing Decisions 5. Theta Limited has a total capitalization of ` 10 Lakhs consisting entirely of equity shares
of ` 50 each. It wishes to raise another ` 5 lakhs for expansion through one of its two possible financial plans. (1) All equity shares of ` 50 each. (2) All debentures carrying 9% interest.
The present level of EBIT is ` 1,40,000 and Income tax rate is 50%. Calculate EBIT level at which earnings per share would remain the same irrespective of
raising funds through equity shares or debentures. Financial Analysis and Planning 6. From the information provided by Sai Limited, you are required to prepare a statement of
changes in working capital and the fund flow statement for the year. Balance Sheet as at 31st March 2014 (All figures in Rupees)
Assets 2013 2014 Liabilities 2013 2014 ` ` ` `
Current Assets Cash in Hand
10,000
2,000
Current Liabilities Sundry Creditors
3,00,000
2,00,000
Bank Balances 20,000 8,000 Provision for Taxes 10,000 15,000 Sundry Debtors 2,10,000 1,80,000 Proposed Dividend 50,000 60,000 Stock 4,00,000 4,50,000 Total Current Assets 6,40,000 6,40,000 Total Current
Liabilities 3,60,000 2,75,000
Fixed Assets Fixed Assets 8,00,000 11,00,000 Less: Accumulated Depreciation
1,60,000, 2,70,000
Total Fixed Assets
6,40,000 8,30,000
Other Assets Shareholder’s Funds Investments 1,60,000 6,70,000 Equity Share Capital 9,80,000 17,15,000
© The Institute of Chartered Accountants of India

PAPER – 3 : COST ACCOUNTING AND FINANCIAL MANAGEMENT 85
General Reserves 1,00,000 1,50,000 Total Other Assets 1,60,000 6,70,000 Total Shareholders’
Funds 10,80,000 18,65,000
Total Assets 14,40,000 21,40,000 Total Liabilities 14,40,000 21,40,000
It is also known that machinery costing `1,00,000 with an accumulated depreciation of ` 30,000 was sold for `60,000.
Investment Decisions 7. Mahalaxmi Limited, manufacturer of pressure cookers, is evaluating three investment
situations: (1) produce a new line of aluminum skillets, (2) expand its existing pressure cooker line to include several new sizes, and (3) develop a new, higher-quality line of pressure cookers. If only the project in question is undertaken, the expected present values and the amounts of investment required are:
Project Investment required Present value of Future Cashflows ` `
1 2,00,000 2,90,000 2 1,15,000 1,85,000 3 2,70,000 4,00,000
If projects 1 and 2 are jointly undertaken, there will be no economies; the investments required and present values will simply be the sum of the parts. With projects 1 and 3, economies are possible in investment because one of the machines acquired can be used in both production processes. The total investment required for projects 1 and 3 combined is ` 4,40,000. If projects 2 and 3 are undertaken, there are economies to be achieved in marketing and producing the products but not in investment. The expected present value of future cash flows for projects 2 and 3 is ` 6,20,000. If all three projects are undertaken simultaneously, the economies noted will still hold. However, a ` 1,25,000 extension on the plant will be necessary, a space is not available for all three projects. Which project or projects should be chosen?
Financial Analysis and Planning 8. You have been hired as an analyst for the Bank of Delhi and your team is working on an
independent assessment of Meyland Limited. Meyland Limited specializes in the production of freshly imported cheese from Switzerland. Your colleague has provided you with the following data for your reference:
Ratios 2014 2013 2012 2014
Industry Average
Long-term Debt 0.45 0.40 0.35 0.35
© The Institute of Chartered Accountants of India

86 INTERMEDIATE (IPC) EXAMINATION: NOVEMBER, 2014
Inventory Turnover 62.65 42.42 32.25 53.25 Depreciation/Total Assets 0.25 0.014 0.018 0.015 Days’ Sales in Receivables
113 98 94 130.25
Debt to Equity 0.75 0.85 0.90 0.88 Profit Margin 0.082 0.07 0.06 0.075 Total Asset Turnover 0.54 0.65 0.70 0.40 Quick Ratio 1.028 1.03 1.029 1.031 Current Ratio 1.33 1.21 1.15 1.25 Times Interest Earned 0.9 4.375 4.45 4.65 Equity Multiplier 1.75 1.85 1.90 1.88
(a) In the annual report to the shareholders, the CEO of Meyland Limited wrote, “2012 was a good year for the company with respect to our ability to meet our short-term obligations. We had higher liquidity largely due to an increase in highly liquid current assets (cash, account receivables and short-term marketable securities).” Is the CEO correct? Explain and use only relevant information in your analysis.
(b) What can you say about Meyland Limited's asset management? Be as complete as possible given the above information, but do not use any irrelevant information.
(c) You are asked to provide the shareholders with an assessment of Meyland Limited's solvency and leverage. Be as complete as possible given the above information, but do not use any irrelevant information.
Management of Working Capital 9. Lola Limited has a present annual sales turnover of ` 40,00,000. The unit sale price is
` 20. The variable cost are ` 12 per unit and fixed costs amount to ` 5,00,000 per annum. The present credit period of one month is proposed to be extended to either 2 or 3 months whichever will be more profitable. The following additional information is available:
On the basis of Credit Period of 1 month 2 months 3 months Increase in sales by − 10% 30% % of Bad debts to sales 1 2 5
Fixed cost will increase by ` 75,000 when sales will increase by 30%. The company requires a pre-tax return on investment at 20%. Evaluate the profitability of the proposals and recommended best credit period for Lola Limited.
© The Institute of Chartered Accountants of India

PAPER – 3 : COST ACCOUNTING AND FINANCIAL MANAGEMENT 87
10. Answer the following: (a) Discuss Profitability Index (PI) as a tool of capital budgeting and give an illustration. (b) Differentiate between Global Depository Receipts and American Depository
Receipts (c) Differentiate between Financial lease and Operating lease.
SUGGESTED ANSWERS / HINTS
1. (a) Risk-Return Considerations in Financing of Current Assets The financing of current assets involves a trade off between risk and return. A firm
can choose from short or long term sources of finance. Short term financing is less expensive than long term financing but at the same time, short term financing involves greater risk than long term financing.
Depending on the mix of short term and long term financing, the approach followed by a company may be referred as matching approach, conservative approach and aggressive approach.
In matching approach, long-term finance is used to finance fixed assets and permanent current assets and short term financing to finance temporary or variable current assets. Under the conservative plan, the firm finances its permanent assets and also a part of temporary current assets with long term financing and hence less risk of facing the problem of shortage of funds.
An aggressive policy is said to be followed by the firm when it uses more short term financing than warranted by the matching plan and finances a part of its permanent current assets with short term financing.
(b) Computation of Amount to be deposited in the Sinking Fund A = Sn/FVIFAi, n = S15 = `10 Crore/FVIFA10, 15 = ` 10 crore/31.772 = ` 3,14,742.54. (c) “The overall cost of capital can be reduced by increasing the debt portion in
the capital structure” In a zero-tax environment, MM Hypothesis has proved that the overall cost of
capital is independent of the amount of leverage in the capital structure. However, when companies are subject to tax, the overall cost of capital will be reduced due to the tax shield provided by debt.
(d) Computation of Present Value Here, the present value of an annuity of ` 700 has to be computed. The present
value factor of an annuity of Re. 1 at 8 per cent for 6 years is 4.623. Therefore, the
© The Institute of Chartered Accountants of India

88 INTERMEDIATE (IPC) EXAMINATION: NOVEMBER, 2014
present value of an annuity of ` 700 will be: 4.623× ` 700 = ` 3,236.10.
(e) “Liquidity ratios are particularly useful in credit analysis by banks and other suppliers of short-term loans”
The given statement is true because with the help of these ratios the stakeholders can draw conclusions regarding liquidity position of a firm. The liquidity position of a firm would be satisfactory, if it is able to meet its current obligations when they become due. Inability to pay-off short-term liabilities affects its credibility as well as its credit rating. Continuous default on the part of the business leads to commercial bankruptcy. Eventually such commercial bankruptcy may lead to its sickness and dissolution. Liquidity ratios are current ratio, liquid ratio and cash to current liability ratio.
2. The following steps may be followed for solving the problem: (a) Determining of the lower level of cash Beta Limited is to have – this has been set at
` 2,000. (b) Determining of the variation in cash flows of Beta Limited – this has been found to
be ` 16,000. (c) Calculation of the spread of transactions:
Spread = 3 x (0.75 × Variance of cashflow × Transaction cost)3Interest rate
Spread = 3 x (0.75 ×16,000 × 7530.005
= ` 1,694 (d) Calculation of the upper limit – this is the sum of the lower limit and the spread: Upper limit : ` 2,000 + ` 1,694 = ` 3,694. (e) Securities should be sold when the return point is reached. The return point is the
sum of the lower limit and a third of the spread: Return point = ` 2,000 + 1/3 (1,694) = ` 2,565.
Thus, Beta Limited is aiming for cash holding of ` 2,565 (return point). Therefore, if the balance of cash reaches ` 3,694 Beta Limited should buy ` 3,694 - ` 2,565 = ` 1,129 of marketable securities; if it falls to ` 2,000, then ` 2,565 - ` 2,000 = ` 565 of securities should be sold.
© The Institute of Chartered Accountants of India

PAPER – 3 : COST ACCOUNTING AND FINANCIAL MANAGEMENT 89
3. (i) Expenditure at year zero (` in lakhs)
Particulars A B Cost of Machine 5.00 5.00 Cost of Utilities 1.00 2.00 Salvage Value of Old Machine (1.00) (1.00) Salvage Value of Old Utilities – (0.20) Total Expenditure (Net) 5.00 5.80
(a) Discounted Value of Cash inflows (` in lakhs)
Machine A Machine B Year NPV Factor
@ 15% Cash inflows
Discounted Value of inflows
Cash flows
Discounted Value of inflows
0 1.00 (5.00) (5.00) (5.80) (5.80) 1 0.87 1.00 0.87 2.00 1.74 2 0.76 1.50 1.14 2.10 1.60 3 0.66 1.80 1.19 1.80 1.19 4 0.57 2.00 1.14 1.70 0.97 5 0.50 1.70 0.85 0.40 0.20 Salvage 0.50 0.50 0.25 0.60 0.30 Present Value 5.44 6.00 Net Present Value 0.44 0.20
(b) Discounted Payback Period (` in lakhs)
Machine A Machine B Year Discounted
Cash inflows Cumulative Discounted Cash inflows
Discounted Cash inflows
Cumulative Discounted Cash inflows
0 (5.00) — (5.80) — 1 0.87 0.87 1.74 1.74 2 1.14 2.01 1.60 3.34 3 1.19 3.20 1.19 4.53 4 1.14 4.34 0.97 5.50 5 1.10* 5.44 0.50* 6.00
© The Institute of Chartered Accountants of India

90 INTERMEDIATE (IPC) EXAMINATION: NOVEMBER, 2014
* Includes salvage value Discounted Payback Period (For A and B):
4 years + ⎟⎠⎞
⎜⎝⎛
10.1)66.0( × 1 = 4.6 years 4 years + ⎟
⎠⎞
⎜⎝⎛
50.0)30.0( × 1 = 4.6 years
(c) Desirability Index
Profitability Index: Sum of present value of net cash inflowInitial cash outlay
5.44 lakhs 5.00 lakhs
`
` = 1.088 (A) 6.00 lakhs
5.80 lakhs`
` = 1.034 (B)
(ii) Advise: The discounted payback period in both the cases is same, also the net present value is positive in both the cases but the desirability factor (profitability index) is higher in the case of Machine A, it is therefore better to choose Machine A.
4. (a) (i) Cost of New Debt
N
t) (1 I K d−
=
16 (1 - 0.5)= = 0.083396
(ii) Cost of New Preference Shares
OP K p =
1.1= = 0.129.2
(iii) Cost of New Equity Shares
G P
D K0
1e +=
0.10 0.05 0.1023.601.18 +=+=
= 0.15 Calculation of D1
D1 = 50% of 2014 EPS = 50% of 2.36 = ` 1.18
© The Institute of Chartered Accountants of India

PAPER – 3 : COST ACCOUNTING AND FINANCIAL MANAGEMENT 91
(b)
Type of Capital Proportion Specific Cost Product (1) (2) (3) (2) × (3) = (4) Debt 0.15 0.0833 0.0125 Preference 0.05 0.12 0.0060 Equity 0.80 0.15 0.1200 Marginal Cost of Capital 0.1385
(c) The company can spend the following amount: Retained earnings = (0.50) (2.36 × 10,000) = ` 11,800 The ordinary equity is 80% of total capital
11,800Capital investment = = 14,7500.80
``
(d) If the company requires funds in excess of ` 14,750 it will have to issue new shares. The cost of new issue will be
1.18K = + 0.10 = 0.159e 20`
The marginal cost of capital will be
Type of Capital Proportion Specific Cost Product (1) (2) (3) (2) × (3) = (4) Debt 0.15 0.0833 0.0125 Preference 0.05 0.1200 0.0060 Equity (New) 0.80 0.1590 0.1272 0.1457
5. Computation of Level of EBIT where EPS will be Equal for Both Alternatives The level of EBIT where EPS will be equal under both the alternatives can be ascertained by the following equation:
= 1
1
ST) - )(1Int -(X =
2
2
S)T1)(Int -(X −
In Alternative 1, there will be no fixed interest liability, Equity shares= 20,000+10,000=30,000.
© The Institute of Chartered Accountants of India

92 INTERMEDIATE (IPC) EXAMINATION: NOVEMBER, 2014
In Alternative 2, debentures of ` 5 lakhs carrying 9% interest will be used. Debentures interest will be:
100
5,00,000 9× = ` 45,000
Substituting the values in the above equation:
30,000
0.5) - 0)(1 -(X = 20,000
0.5) - 45,000)(1 -(X
or X = 1,35,000 At EBIT level of ` 1,35,000 earnings per share in both cases will be equal:
Calculation of EPS Alternative 1 Alternative 2 Equity Shares (A) 30,000 20,000 Debentures 0 ` 5,00,000 ` `
EBIT 1,35,000 1,35,000 Interest 0 45,000 1,35,000 90,000 Less: Income Tax @ 50% 67,500 45,000 Earnings after Tax (B) 67,500 45,000
EPS = AB = 2.25
6. Statement of Changes in Working Capital (All figures in Rupees)
Particulars 2013 2014 Increase in Working Capital
Decrease in Working Capital
Current Assets Closing Stock 4,00,000 4,50,000 50,000 Sundry Debtors 2,10,000 1,80,000 30,000 Cash in Hand 10,000 2,000 8,000 Bank Balance 20,000 8,000 12,000 Total(A) 6,40,000 6,40,000
© The Institute of Chartered Accountants of India

PAPER – 3 : COST ACCOUNTING AND FINANCIAL MANAGEMENT 93
Current Liabilities Sundry Creditors 3,00,000 2,00,000 1,00,000 Provision for Taxes 10,000 15,000 5,000 Proposed Dividends 50,000 60,000 10,000 Total(B) 3,60,000 2,75,000 Working Capital (A)-(B) 2,80,000 3,65,000 Increase in Working Capital 85,000 85,000 3,65,000 3,65,000 1,50,000 1,50,000
Now, before preparing the funds from operation statement and the funds flow statement, we have to calculate the amount of depreciation charged for the year and also the amount of profit or loss on account of sale of machinery. For this, we need to prepare a machinery account in the following manner:
Machinery A/c Particulars `
Balance of Fixed Assets as at 2013 8,00,000 Less: Cost of Machinery sold 1,00,000 Balance in fixed assets group after sale 7,00,000 Amount of Fixed assets as at 2014 11,00,000 Difference being additional purchase in Year 4,00,000
The written down value of the machinery is the cost minus the accumulated depreciation up to the point of sale. The sale price of the machinery, minus the written down value of the machinery sold, was ` 60,000 - [` 100,000-` 30,000]. Loss on sale of machinery comes to ` 10,000. Based upon the same logic, we have to calculate the amount of depreciation for the year.
Depreciation A/c Particulars ` Opening Balance of Accumulated Depreciation 1,60,000 Less: Accumulated depreciation of machinery sold 30,000 Balance in the accumulated depreciation account 1,30,000 Closing balance as on 2014 2,70,000 Difference being depreciation for the year 1,40,000
© The Institute of Chartered Accountants of India

94 INTERMEDIATE (IPC) EXAMINATION: NOVEMBER, 2014
Funds from Operations for the Year 2014
Particulars ` Profit for the Year (Increase in General reserves) 50,000 Add: Depreciation 1,40,000 Non-operational activity (loss on machine) 10,000 Fund From Operations 2,00,000
Funds Flow Statement for the Year 2014
Particulars ` Sources Funds from Operation 2,00,000 Proceeds from Sale of Machinery 60,000 Proceeds from Issue of Shares 7,35,000 Total (A) 9,95,000 Applications Purchase of Machinery 4,00,000 Purchase of Investment 5,10,000 Increase in Working Capital 85,000 Total (B) 9,95,000
7. Computation of Net Present Value (NPV) and Advise to Mahalaxmi Limited Project Investment
Required Present value of Future Cash
Flows Net Present
value ` ` ` 1 2,00,000 2,90,000 90,000 2 1,15,000 1,85,000 70,000 3 2,70,000 4,00,000 1,30,000 1 and 2 3,15,000 4,75,000 1,60,000 1 and 3 4,40,000 6,90,000 2,50,000 2 and 3 3,85,000 6,20,000 2,35,000 1, 2 and 3 6,80,000 9,10,000 2,30,000
Advise: Projects 1 and 3 should be chosen, as they provide the highest net present value.
8. (a) The answer should be focused on using the current and quick ratios. While the current ratio has steadily increased, it is to be noted that the liquidity has not
© The Institute of Chartered Accountants of India

PAPER – 3 : COST ACCOUNTING AND FINANCIAL MANAGEMENT 95
resulted from the most liquid assets as the CEO proposes. Instead, from the quick ratio, it is noted that the increase in liquidity is caused by an increase in inventories. For a fresh cheese company, it can be argued that inventories are relatively liquid when compared to other industries. Also, given the information, the industry-benchmark can be used to derive that the company's quick ratio is very similar to the industry level and that the current ratio is indeed slightly higher - again, this seems to come from inventories.
(b) Inventory turnover, day’s sales in receivables, and the total asset turnover ratio are to be mentioned here. Inventory turnover has increased over time and is now above the industry average. This is good - especially given the fresh cheese nature of the company’s industry. In 2014, it means for example that every 365/62.65 = 5.9 days the company is able to sell its inventories as opposed to the industry average of 6.9 days. Days' sales in receivables have gone down over time, but are still better than the industry average. So, while they are able to turn inventories around quickly, they seem to have more trouble collecting on these sales, although they are doing better than the industry. Finally, total asset turnover is gone down over time, but it is still higher than the industry average. It does tell us something about a potential problem in the company's long term investments, but again, they are still doing better than the industry.
(c) Solvency and leverage is captured by an analysis of the capital structure of the company and the company's ability to pay interest. Capital structure: Both the equity multiplier and the debt-to-equity ratio tell us that the company has become less levered. To get a better idea about the proportion of debt in the firm, we can turn the D/E ratio into the D/V ratio: 2014: 43%, 2013: 46%, 2012:47%, and the industry-average is 47%. So based on this, we would like to know why this is happening and whether this is good or bad. From the numbers it is hard to give a qualitative judgment beyond observing the drop in leverage. In terms of the company's ability to pay interest, 2014 looks pretty bad. However, remember that times interest earned uses EBIT as a proxy for the ability to pay for interest, while we know that we should probably consider cash flow instead of earnings. Based on a relatively large amount of depreciation in 2014 (see info), it seems that the company is doing just fine.
9. Evaluation of Profitability under different Credit Periods (` in Lakhs)
Particulars 1 Month 2 Months 3 Months A. Expected profit : (a) Sales 40,00,000 44,00,000 52,00,000 (b) Total Cost:
© The Institute of Chartered Accountants of India

96 INTERMEDIATE (IPC) EXAMINATION: NOVEMBER, 2014
(i) Variable Cost @ `12 24,00,000 26,40,000 31,20,000 (ii) Fixed Costs 5,00,000 5,00,000 5,00,000 29,00,000 31,40,000 36,20,000 (c) Expected Profit 11,00,000 12,60,000 15,80,000 B. Opportunity Cost of Investment in
Receivables
48,333
1,04,667
1,81,000 C. Net Benefits [A-B] 10,51,667 11,55,333 13,99,000
Recommendation: The credit period (i.e. 3 months) should be adopted since the net benefits under this policy are higher than those under other policies.
Working Note Calculation of Opportunity Cost of Investments in Receivables:
Opportunity Cost = 100
Return of Rate 360
Period CollectionCost Total ××
1 Month = 48,333 10020
12 29,00,000 1
`` =××
2 Months = 1,04,667`` =××10020
122 31,40,000
3 Months = 1,81,00010020
123 36,20,000 `` =××
10. (a) Profitability index: In capital budgeting, there are cases when we have to compare or rank a number of proposals each involving different amount of cash flows. One of the methods of comparing/ranking such proposal is to work out what is known as profitability index (PI). It is also called benefit-cost ratio. It may be calculated as follows:
outlay cash Initial
inflows cashnet of valuePresent PI =
Suppose, for example a company is considering two projects viz., A and B. The present value of net cash flows and initial outlay are as follows:
Project A Project B ` ` Present Value of Net Cash Inflows 36,000 34,000 Initial Cash Outlay 30,000 29,000
© The Institute of Chartered Accountants of India

PAPER – 3 : COST ACCOUNTING AND FINANCIAL MANAGEMENT 97
In the case of the example, Project A has profitability index of 1.20 whereas Project B’s ratio is 1.17 calculated as under:
36,000A 1.20 30,000
= =`
`
34,000B 1.17 29,000
= =`
`
It may be noted that as long as the profitability index is equal to or greater than 1.00, the project is acceptable.
Alternatively, profitability index may also be calculated as under:
outlfows cash discounted of Suminflows cash discounted of SumPI = .
(b) Differentiation between Global Depository Receipts (GDRs) and American Depository Receipts (ADRs)
Global Depository Receipts (GDRs) is a negotiable certificate denominated in US dollars, which represents a-non-US companies publicly, traded local currency equity. GDRs are created when the local currency shares of an Indian company are delivered to the depository’s local custodian bank, against which depository bank issues depository receipts in US dollar.
They may be freely traded in the overseas market like any other dollar denominated security either on a foreign stock exchange or in the over the counter market of qualified institutional buyers (QIBs). By issue of GDRs, Indian companies are able to tap global equity market to raise foreign currency funds by way of equity. It has distinct advantage over debt as there is no repayment of the principal and service costs are lower.
Whereas, American Depository Receipts (ADRs) are depository receipts issued by a company in the USA and are governed by the provisions of Security and Exchange Commission of USA. As the regulations are severe, Indian Companies tap the American market through private debt placements of GDRs listed in London and Luxemburg Stock Exchanges. Apart from legal impediments, ADRs are costlier than GDR Legal fees are considerably high for US listing. Registration fee in USA is also substantial. Hence, ADRs are less popular than GDRs.
(c) Difference between Financial Lease and Operating Lease
Financial Lease Operating Lease 1. The risk and reward incident to
ownership are passed on the lessee. The lessor only remains
The lessee is only provided the use of the asset for a certain time. Risk incident to ownership belongs only to
© The Institute of Chartered Accountants of India

98 INTERMEDIATE (IPC) EXAMINATION: NOVEMBER, 2014
the legal owner of the asset. the lessor. 2 The lessee bears the risk of
obsolescence. The lessee is only allowed the use of asset.
3 The lease is non-cancellable by either party under it.
The lease is kept cancellable by the lessor.
4. The lessor does not bear the cost of repairs, maintenance or operations.
Usually, the lessor bears the cost of repairs, maintenance or operations.
5. The lease is usually full payout. The lease is usually non-payout.
© The Institute of Chartered Accountants of India