paper 6.4 the use of multiphase sampling kit to improve ... · schlumberger via the synergy of...
TRANSCRIPT

Paper 6.4
The Use of Multiphase Sampling Kit to Improve Multiphase Flow Measurement
Through Accurate Phase-Behaviour Characterisation at the Well Site
Bruno Pinguet, Paul Guieze, Nadege Hopman, Graham Birkett and John Nighswander
Schlumberger

24th International North Sea Flow Measurement Workshop 24th – 27th October 2006
1
The Use of Multiphase Sampling Kit to Improve Multiphase
Flow Measurement through Accurate Phase-Behaviour Characterization at the Well Site
Bruno Pinguet, Paul Guièze, Nadège Hopman, Graham Birkett, and John Nighswander, Schlumberger
1 INTRODUCTION Representative reservoir fluid sampling and characterization has become increasingly important over the years. With exploration, appraisal and development activities moving into marginal fields and more challenging environments, accurate fluid characterization becomes more critical. This can be said for the formation tester, DST and multiphase sampling and fluid characterization environments with the most challenging area in recent years arguably being the multiphase environment. Multiphase flow meters have been accepted for several years now by the industry. Their use in permanent or well testing applications has been growing rapidly. In many cases, multiphase flow meters have replaced the separator for flow rate evaluation, but some fundamental needs from the client were not addressed properly, such as the ability to collect representative samples for phase-behavior characterization. Moreover, metering accuracies at very high GVF or in wet gas conditions has been questionable in many cases. This paper will focus on the Multiphase Active Sampling Device, a fluid sampling and analysis service that can be provided with the Vx multiphase metering technology in a well testing application with the objective of collecting representative samples, isolating and analyzing each fluid phase, and providing data from the analysis to input to the Vx acquisition software data to obtain more accurate flow rates. The collection of phase representative samples also opens the opportunity for a full recombination PVT study to be performed using the improved recombination ratio at line conditions from the multiphase flow meter. This dedicated multiphase fluid sampling and analysis system, combined with Vx technology potentially provides flow rate and fluid property data equivalent or superior to a conventional test separator system. 2 OVERVIEW Multiphase flow meters (MFM) have been accepted for several years now by the oil industry. Their use in permanent or well testing applications has been growing rapidly. MFM are usually operated at pressures well above a typical test separator. This is one of the main advantages of these products (Ref. [11], [12], [27] and [29]). Currently the most common working pressures are around 5000 psia but already the industry is demanding designs of up to 15000 psia working pressure. All MFM on the market are measuring flow rates at line conditions and therefore the use of PVT package to convert the flow rates at standard conditions is necessary (Ref. [3]). This is not addressed currently by most suppliers. Schlumberger via the synergy of several divisions and the knowledge of phase behavior and sampling techniques has developed a solution to address the entire problem and needs of our customers (Ref. [2], [3] and [29]). The PVT packages developed for the separator are limited and are essentially developed from Black Oil Correlation (Ref [3]). However, it is essential to have a full and clear understanding of the fluid behavior, error propagation and MFM performance to ensure the meter is fit for purpose in each application. To set up the acquisition parameters of a MFM there is until now two approaches:

24th International North Sea Flow Measurement Workshop 24th – 27th October 2006
2
1. The first approach uses published correlations (i.e. Black Oil Correlations [BOC]) to estimate oil, water and gas properties. This simple approach leads to acceptable metrological results up to 1500 PSIA. For a range 1500-5000 PSIA, this application can be extended with some careful assumptions. Indeed, PVT behavior of fluids may differ significantly from the aforementioned correlations (Ref [2], [3], [6]).
2. The second approach uses experimental and modelled data from an Equation of
State (EOS) software package using data from a standard PVT report. This requires a competent phase behaviour specialist to generate and quality control the generated fluid data for the MFM. (Ref [2] and [3]).
Figure 1 illustrates the topology of a production line were the MFM is located directly upstream of the separator.
Figure 1: Schematic of a typical multiphase meter set-up
At higher pressures and temperatures the fluid properties correlations developed for separators are outside their range of application. In addition at high pressure or temperature, the accuracy of the fluid properties inputs for conversion from line to standard conditions and vice-versa is more critical and can seriously affect the overall performance of the meter if care is not taken in their measurement. A possible production path from the initial static pressure to the surface measurement is presented with a dashed line in the Figure 2.This production path is for a constant system composition, this is essential, where pressure and temperature changes in the process from reservoir to production separator as indicated by the dotted line. A multiphase flow meter could be located anywhere on this line from any type of separators (production, test) up to the well head.

24th International North Sea Flow Measurement Workshop 24th – 27th October 2006
3
Figure 2: General phase diagram and production path
Robust and reliable MFM's are based on physical measurements and therefore the need for fluid properties is essential. This need is not new, is unavoidable, and has been similarly required to obtain flow rates at standard conditions with a separator. Figure 3 illustrates a generic fluid property flow path from line to standard conditions for all MFM’s and fluid types (i.e. from Heavy Oil to Gas Condensate).
Figure 3: Flow Path from line to standard conditions and vice versa

24th International North Sea Flow Measurement Workshop 24th – 27th October 2006
4
On the left of the diagram is the data coming from any flowmeter (multiphase or single phase [i.e. Coriolis…] at line conditions). These data have to be converted to standard conditions taking into account the gas and liquid dissolved in the various phases. A definition of each term is given here below and at the end of this paper. As a reminder and again whatever the type of meter used, the overall metrological performance of a meter is a direct function of the accuracy of these required input parameters (Ref [2]). qgmp is the gas volumetric flow rate at MFM conditions. This gas splits into two phases at standard conditions which are qggsc (gas flow rate) and qgosc (oil flow rate due to the liquid dropping out of the gas phase at lower pressure and temperature). qomp is the oil at MFM conditions. This oil splits into two phases at standard conditions which are qoosc (oil flow rate) and qogsc (gas flow rate), the gas evolved from the oil at standard conditions. qwmp will follow a similar path to the oil splitting into two phases, qwwsc and qwgsc. qsmp refers to a possible solid phase, this is not developed in details in this paper. The sum of the different outputs gives the total volumetric flow rates of gas, oil and water at standard conditions. In summary, three sets of data are required to calculate flow rates at standard conditions: densities, volumetric conversion factors from line conditions to standard conditions (bo, bw, and bg) and Solution Ratio (Rst, Rwst, rgmp). These values can be obtained from a classical laboratory analysis (i.e. PVT Report) (Ref [2]). The viscosity of the liquid at line conditions is also a pertinent parameter which is in this case depending primarily on the WLR, temperature and dissolved gas. There are, therefore, a total of 10 parameters required to obtain a full PVT profile. 2 INTRINSIC ERROR AND GLOBAL ERRORS All MFM’s and also separators require some knowledge of fluid properties to allow the real-time calculation of the fraction and flow rates of the different phases flowing through the meter but each multiphase flow meter is also dependent on several intrinsic features, measurements and models some of the most common of which are listed below:
1. Hardware: Venturi throat diameter, Venturi inlet diameter, Distance between pressure ports, Distance between elements of cross correlation, Pipe section, Acquisition frequency, Electronic stability...
2. Physical Measurement Type: Permittivity, Conductivity, Optical or Nuclear measurement for the different fluids.
3. Measurement Accuracy: for the above measurements. 4. Validity of the Interpretation Engine: for different hypotheses regarding the flow
rate (i.e. flow regime, mixing conditions, slugs or not…) or about viscosity, inversion phase, slippage and other physical or mathematical assumptions....
Overall, there are more than 10 to 20 parameters, which could significantly affect any multiphase measurement. Some can be adequately quality controlled during the construction, but others, such as the validity of models and some physical measurements, are more complex to understand and may lead to error. This is what we called the intrinsic measurement performance that is only a part of the overall performance. Beyond the intrinsic error of any multiphase measurement technology that can in itself be significant, characterizing the produced fluid properties can be crucial to the successful deployment and application of multiphase flow meters. The global uncertainties of a MFM encompass this second distinctive source of errors related to fluid properties to convert from the line condition measurements to standard conditions or vice versa. There has been little published on this element of the propagation error attributed to the fluid properties input alone (Reference [1], [2], and [3]). In addition, the fluid properties input
24th International North Sea Flow Measurement Workshop 24th – 27th October 2006
5
accuracy is rarely challenged, even if this may be the biggest effect on the global uncertainty of a meter such as in high pressure or wet gas conditions (Ref [4]). A review of the performance of different black oil correlations has already been completed (Reference [2] and [3]), and demonstrated that their application is quite limited. A propagation error simulator was also developed to look at the benefit of accurate input parameters. The reader can obtain more detailed information from Ref [2] and [3]. Only a summary is given here investigating the effect of oil shrinkage bo and expansion factor bg accuracy on the Water, Oil, Mass and Gas flow rate at standard conditions.
1. A first set of simulations was done using 5% and 4% relative error respectively for the bg and bo. The simulated relative error for gas, total mass, oil and water flow rate was respectively 8.2%, 2.9%, 9.4% and 10.3%.
2. A second simulation was made with 2% relative error for the bg and bo (Fig 11 & 12). This result led then for gas, total mass, oil and water flow rate to respectively 4.1%, 1.6%, 5.2% and 5.7%.
The results indicate a significant improvement, by almost a factor of two, in the overall accuracy of the mass, gas, oil and water flow rate with the improvement in the accuracy of the input parameters, the gas expansion factor bg and oil shrinkage factor bo. All others parameters were kept constant. This brief sensitivity analysis published on flow rates at standard conditions and total mass flow rate clearly demonstrates the performance of all MFM’s is strongly related to an accurate fluid property inputs. For more information the reader should refer to [2], [3], [6], 14], [19]. 3 FLUID PROPERTY MEASUREMENT AND MODELLING TECHNIQUES Several options are available to generate fluid property inputs which can generally be described as:
1. Black Oil Correlations (BOC): This is the basic approach using BOC to estimate oil, water and gas properties from simple stock tank oil and gas measurements. This solution leads quickly and simply to acceptable metrological results up to 1500 psia for most types of black oils and some volatile oils. However, in many cases the fluid behaviour may differ significantly from these correlations, then it is preferable to use data collected either experimentally or simulated using a PVT EOS simulator.
2. Wellsite Site Property Measurement (WSPM) : A dedicated wellsite measurement
of the required fluid properties, such as can be produced with the PVT Express, although requiring some expertise can deliver an accuracy equivalent to PVT laboratory measurements or better in some applications. In addition to measuring the relevant fluid properties for MFM input a full PVT report for can be produced within a day from a representative recombined sample. The need for wellsite fluid property measurement becomes a particular issue at higher MFM operating pressures and temperatures and with increasing volatility of the produced fluids.
3. Equation of State (EOS): The required fluid property inputs can be generated
using an equation of state (EOS) tuned to data from a from a full PVT report in a software package such as PVT-ProTM. The PVT report is often generated at the exploration and appraisal stage from well test or formation tester samples. Specialist PVT Expertise is required to both conduct the EOS simulation and to quality control the PVT data prior to its use. Although sometimes a complex task, EOS tuning provides the essential information necessary to run the meter in any type of fluid including volatile oils and gas condensate. The turnaround time is short once the PVT data is validated.
4. Laboratory Measurement (LM): PVT Laboratory measurements on samples
obtained from the MFM will necessarily require a longer turnaround time than all the other techniques but in most cases offer the most accurate measurement.

24th International North Sea Flow Measurement Workshop 24th – 27th October 2006
6
This may be a requirement when using an MFM in a production allocation application where the cost and delay in producing the fluid property inputs is offset by the need for superior accuracy.
4 SAMPLING AND THERMODYNAMIC EQUILIBIRUM Due to the wide range of operating conditions and flow regimes that a multiphase flowmeter can face (Ref. [1], [4], [5], [7], [8], [9], [10], [15], [17], [18], [20], [21], [22], [23], [24], [25], [27]), there is no possibility of measuring specifically phase densities in-line. The ultimate solution is therefore fluid sampling and analysis at the wellsite because it will allow direct measurement of the required MFM input parameters rather than relying on an estimated value from a correlation of EOS model. It will also provide an opportunity to take samples for a recombination PVT study using the improved MFM GOR at line conditions. In multiphase sampling it is critical to maintain a thermodynamic equilibrium between the different phases for the given reservoir fluid. This is possible when the pressure and temperature remain constant for a period of time. During this equilibrium there should be:
1. No molecular composition change in any phase when P and T remain constant 2. No mass transfer between phases when P and T remain constant
This equilibrium is generally independent of the sample volume and phase fractions. There have been intense discussions about the dynamics of establishing thermodynamic equilibrium between phases in multiphase conditions. Some authors consider that equilibrium is reached after a few milliseconds while others consider that it is never fully achieved. It is, however, generally accepted that the equilibrium is reached a few feet after a choke. In a separator, the residence time of the fluid in the vessel is generally considered long enough (typically 1 minute) to approach the true equilibrium, however the samples are often taken at slightly different pressure and temperature and some iterations can be necessary to obtain the correct fluid compositions. Due to the complexity of multiphase flow regimes it will never be possible to sample only one phase at a time but there is always a position in the flow line where one phase is predominantly present. The sampling technique, therefore, needs to allow the selection of the optimum sampling position for the required phase and subsequently segregate and enrich the sample with that phase at isobaric and isothermal conditions with reference to the meter flowing pressure and temperature. It should also allow all three phases to be collected separately but at the same point in the meter so that the samples are all collected at the same conditions and can be considered to be in equilibrium. 5 THE MULTIPHASE ACTIVE SAMPLING DEVICE AND ASSOCIATED SERVICE The Multiphase Active Sampling Device (MASD) and the associated service has been developed first as a dedicated add-on to the Vx multiphase flowmeter providing a unique and integrated multiphase solution to improve flow rate measurement. The MASD Hardware consists of three main elements:
• A multi-probe sampling device that retrofits to the liquid sampling port on the Vx PhaseTester.
• A wellsite fluid property measurement package which allows the direct measurement of the key fluid property inputs at line and standard conditions for any type of multiphase flow meter.
• A dedicated data acquisition software to receive the directly measured fluid property inputs as an alternative to the standard correlation available with the Vx multiphase meters.

24th International North Sea Flow Measurement Workshop 24th – 27th October 2006
7
Figure 4: Overall view of the MASD service equipment
The Multiphase Active Sampling Device hardware addresses the sampling and thermodynamic equilibrium issues in Section 4 with the following features:
• The multi-probe sampling device is inserted through the liquid sampling trap and into the PhaseTester stream. This has the advantages of good mixing due to the venturi that is located before the sampling probes. Additionally the samples are taken at the same point, which ensures that the pressure and temperature is constant and the samples refer to the same thermodynamic equilibrium.
• The multi-probe sampling device has several probes in the flow stream arranged axially and facing both upstream and downstream. This allows the selection of a sampling probe which will sample predominantly the required phase.
• The ability to enrich any desired phase during the sampling process. If a specific phase exists in a very small fraction inside the flow the MASD can actively enrich this phase so a large enough volume will be captured for all the required measurements.
• The pressure and temperature is maintained by heating and insulation during the sampling, segregation and enrichment process to ensure there is no mass transfer between the phases.
• The ability to verify that the right phase has been captured or transferred utilizing an optical phase detection technique.
The benefits of the MASD service are:
• Rapid turnaround of accurate Vx fluid property inputs at the wellsite rather than sending samples to a PVT Laboratory taking days or weeks.
• Improved flow rate measurements computed with the more accurate Vx fluid property inputs that result from direct measurement versus correlations or EOS modeling.
• Provision of samples for a recombination PVT study utilizing the improved Vx GOR measurement.
24th International North Sea Flow Measurement Workshop 24th – 27th October 2006
8
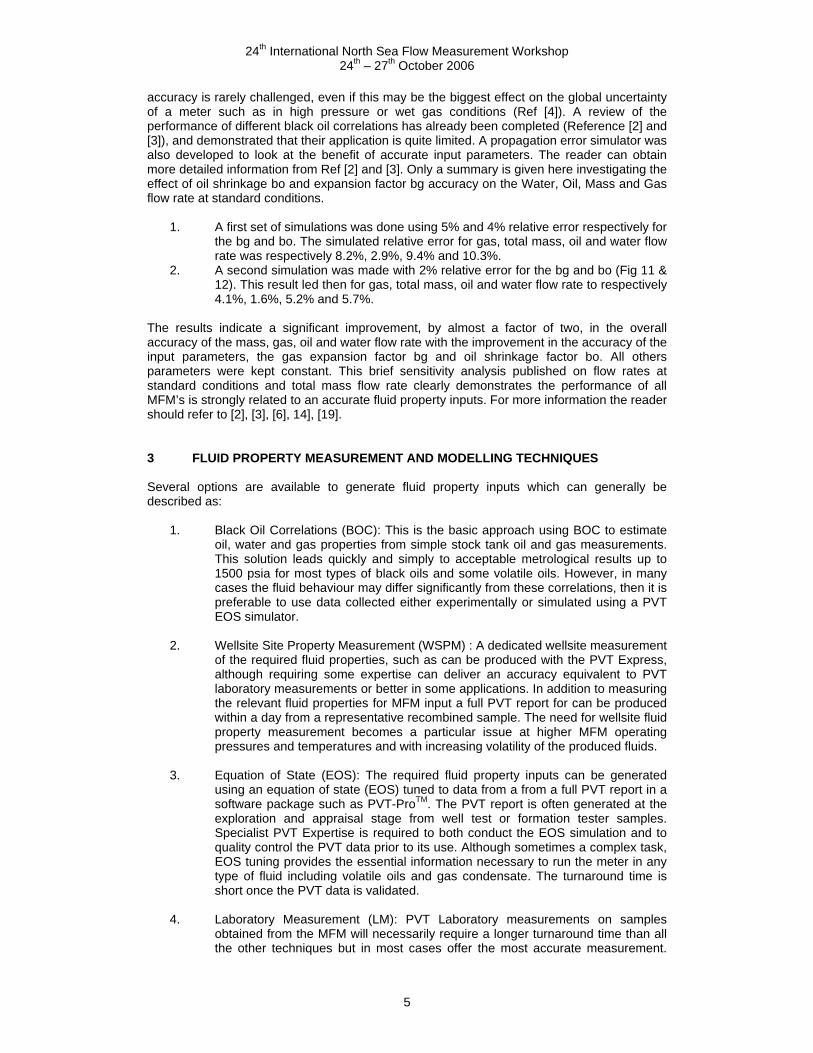
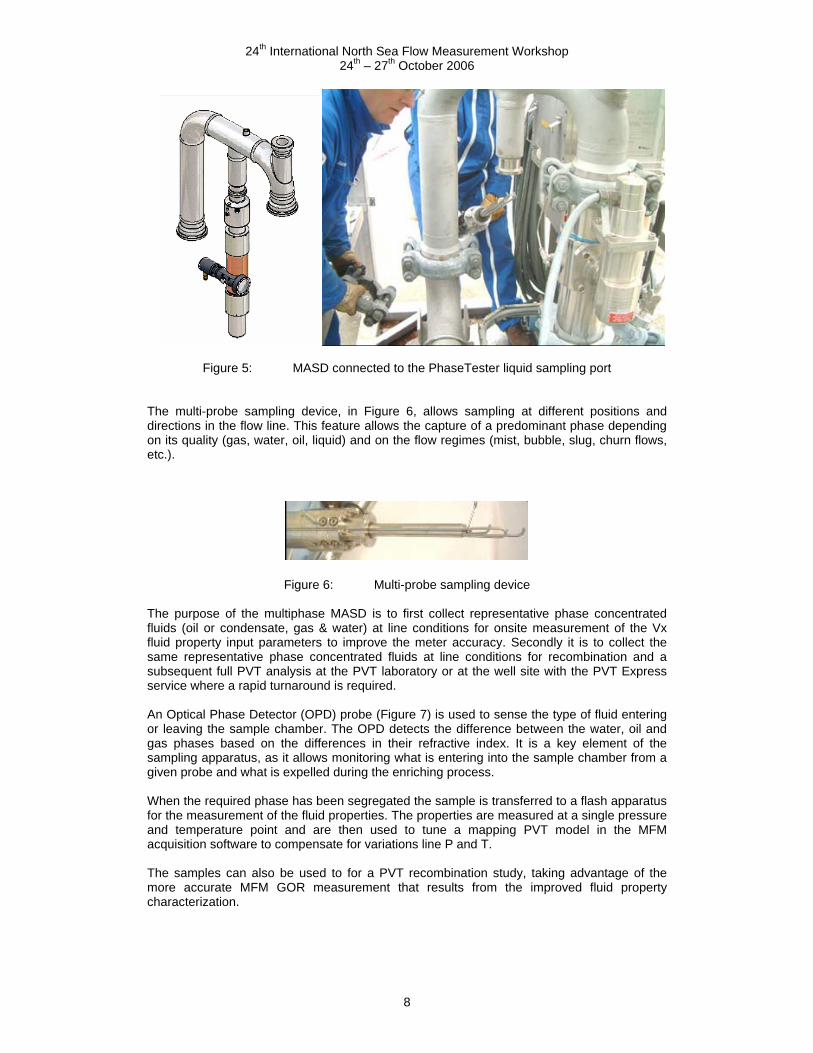
Figure 5: MASD connected to the PhaseTester liquid sampling port The multi-probe sampling device, in Figure 6, allows sampling at different positions and directions in the flow line. This feature allows the capture of a predominant phase depending on its quality (gas, water, oil, liquid) and on the flow regimes (mist, bubble, slug, churn flows, etc.).
Figure 6: Multi-probe sampling device
The purpose of the multiphase MASD is to first collect representative phase concentrated fluids (oil or condensate, gas & water) at line conditions for onsite measurement of the Vx fluid property input parameters to improve the meter accuracy. Secondly it is to collect the same representative phase concentrated fluids at line conditions for recombination and a subsequent full PVT analysis at the PVT laboratory or at the well site with the PVT Express service where a rapid turnaround is required. An Optical Phase Detector (OPD) probe (Figure 7) is used to sense the type of fluid entering or leaving the sample chamber. The OPD detects the difference between the water, oil and gas phases based on the differences in their refractive index. It is a key element of the sampling apparatus, as it allows monitoring what is entering into the sample chamber from a given probe and what is expelled during the enriching process. When the required phase has been segregated the sample is transferred to a flash apparatus for the measurement of the fluid properties. The properties are measured at a single pressure and temperature point and are then used to tune a mapping PVT model in the MFM acquisition software to compensate for variations line P and T. The samples can also be used to for a PVT recombination study, taking advantage of the more accurate MFM GOR measurement that results from the improved fluid property characterization.

24th International North Sea Flow Measurement Workshop 24th – 27th October 2006
9
Figure 7: Recording Signal for 3 phase flow. The different band green, red and blue
represent the 3 level for gas, oil and water 6 FLOW LOOP VALIDATION The sampling principle was tested and validated in a three-phase reference flow-loop. The figure here below shows the sampled GVF versus the flowing GVF. The purpose of this test was to determine the predominant phase that can be collected from the different probes. A numerical simulation was completed prior to the tests and the results show a good correspondence. Probe #1 that is positioned in the flow direction takes advantage of the difference in inertia between gas and liquid and samples predominantly gas. Due to centrifugal forces acting in the elbow preceding the sampling zone, liquid is flowing predominantly at the top of the pipe and therefore probe #4 is the better choice for liquid sampling (i.e. very low GVF). Other probes are there for to allow sampling in any unexpected conditions, but could be modified according to the results of further field tests.
0.000
0.200
0.400
0.600
0.800
1.000
1.200
0.75 0.8 0.85 0.9 0.95 1
Flow loop GVF
Sam
pled
GVF GVF @ probe#1
GVF @ probe#2GVF @ probe#3GVF @ probe#4
flow1
234
gas under sampling
gas over sampling
Figure 8: Best position to over sample gas or liquid versus reference flow loop
24th International North Sea Flow Measurement Workshop 24th – 27th October 2006
10
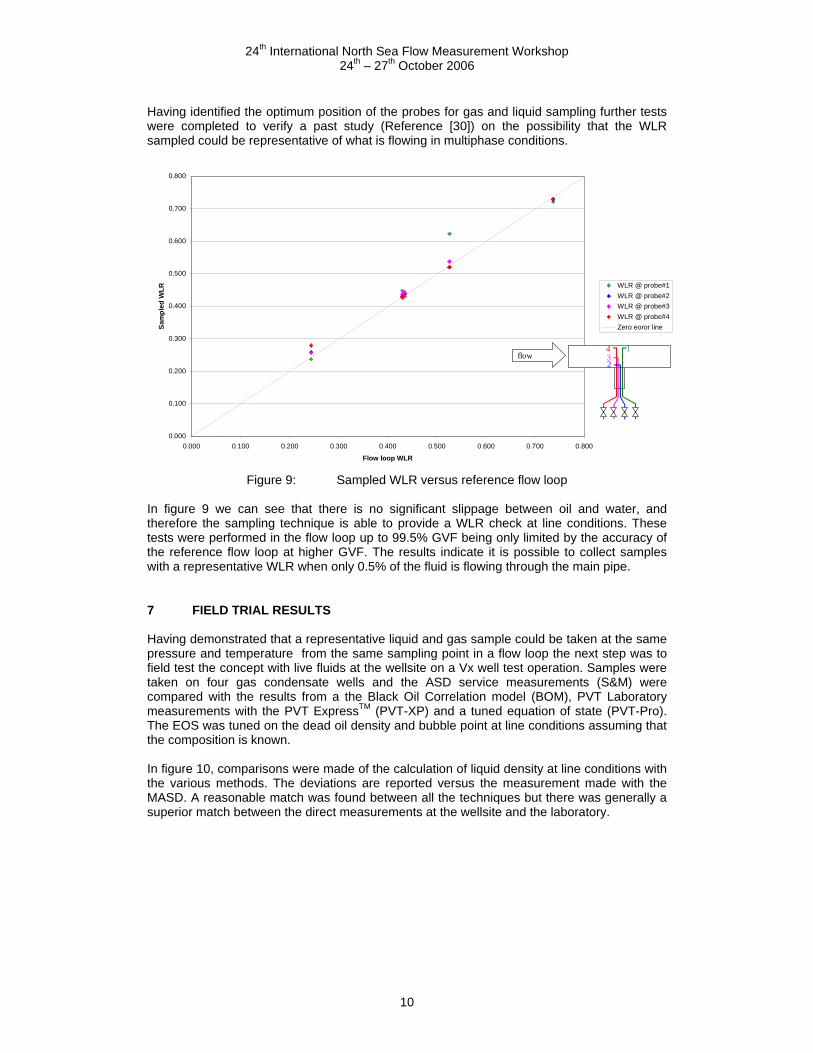
Having identified the optimum position of the probes for gas and liquid sampling further tests were completed to verify a past study (Reference [30]) on the possibility that the WLR sampled could be representative of what is flowing in multiphase conditions.
0.000
0.100
0.200
0.300
0.400
0.500
0.600
0.700
0.800
0.000 0.100 0.200 0.300 0.400 0.500 0.600 0.700 0.800
Flow loop WLR
Sam
pled
WLR WLR @ probe#1
WLR @ probe#2WLR @ probe#3WLR @ probe#4Zero eoror line
flow1
234
Figure 9: Sampled WLR versus reference flow loop
In figure 9 we can see that there is no significant slippage between oil and water, and therefore the sampling technique is able to provide a WLR check at line conditions. These tests were performed in the flow loop up to 99.5% GVF being only limited by the accuracy of the reference flow loop at higher GVF. The results indicate it is possible to collect samples with a representative WLR when only 0.5% of the fluid is flowing through the main pipe. 7 FIELD TRIAL RESULTS Having demonstrated that a representative liquid and gas sample could be taken at the same pressure and temperature from the same sampling point in a flow loop the next step was to field test the concept with live fluids at the wellsite on a Vx well test operation. Samples were taken on four gas condensate wells and the ASD service measurements (S&M) were compared with the results from a the Black Oil Correlation model (BOM), PVT Laboratory measurements with the PVT ExpressTM (PVT-XP) and a tuned equation of state (PVT-Pro). The EOS was tuned on the dead oil density and bubble point at line conditions assuming that the composition is known. In figure 10, comparisons were made of the calculation of liquid density at line conditions with the various methods. The deviations are reported versus the measurement made with the MASD. A reasonable match was found between all the techniques but there was generally a superior match between the direct measurements at the wellsite and the laboratory.

24th International North Sea Flow Measurement Workshop 24th – 27th October 2006
11
Oil phase density at LC
653 67
5
525
566
660
659
592
585
658 67
0
559
545
655
646
579
571
0
100
200
300
400
500
600
700
800
IA111 IA113 OT143 OT142
Well
dens
ity (k
g/m
3)
S&MBOMPVT XpPVT Pro
+ 0.
9 %
+ 0.
7 %
+ 0.
2 %
+ 12
.8 %
- 2.4
%
- 0.6
%
- 4.2
%
+ 6.
5 %
+ 10
.3 %
+ 3.
4 %
- 3.7
% + 0.
9 %
Figure 10: Comparison of the liquid density for the different techniques on four wells
A similar comparison was made (Fig 11 and Fig 12) for oil shrinkage (bo) and the GOR of the flashed oil (Rst). Both comparisons demonstrate the clear benefit of measurement over prediction. There is an excellent consistency in both cases between wellsite and laboratory measurement for the four different fluids at different well conditions whereas the relative error for Bo by prediction was seen to be as high as 21.7% using a black oil correlation and similarly a relative error of up to 38% for Rst was observed with the same technique. This is not surprising given the known limits of the published correlations.
Oil Phase Shrinkage (bo)
0.74
6
0.76
6
0.48
9
0.51
0
0.70
9
0.70
9
0.59
5
0.58
0
0.75
0
0.77
0
0.50
0
0.52
0
0.76
7
0.75
0
0.58
0
0.54
0
0
0.1
0.2
0.3
0.4
0.5
0.6
0.7
0.8
0.9
IA111 IA113 OT143 OT142
Well
bo (m
3/m
3)
S&MBOMPVT XpPVT Pro
- 5.0
% + 0.
5 %
+ 2.
8 %
- 7.4
% + 0.
5 %
- 2.1
%
+ 21
.7 %
+ 2.
2 %
+ 18
.6 %
+ 13
.7 %
+ 2.
0 %
+ 5.
9 %
Figure 11: Comparison of the oil shrinkage (Bo) in 4 wells with the different techniques

24th International North Sea Flow Measurement Workshop 24th – 27th October 2006
12
Rst
90 92
271
249
110
108
168 17
3
96
89
263
240
86
93
196
223
0
50
100
150
200
250
300
IA111 IA113 OT143 OT142
Well
Rst
(m3/
m3)
S&MBOMPVT XpPVT Pro
+ 22
.4 %
+ 6.
6 %
- 3.6
%
+ 17
..4 %
- 3.3
%
+ 1.
1 %
- 38.
0 %
- 3.0
%
- 27.
7 %
- 30.
5 %
- 3.6
%
- 10.
4 %
Figure 12: RST Comparison in 4 wells with the different techniques
Having demonstrated the superiority of measurement versus prediction of the fluid properties the next step was to investigate the impact on the MFM flow rates at both line and standard conditions. The following tables show the effect of the fluid properties on calculated flow rates using real data post-processed with the BOM, EOS model and MASD fluid property inputs Case A is a well with a very high GVF of over 99%.
MASD BOM EOS QvolOil@lc bpd 543 539 445 QvolOil@sc bpd 385 397 342 QvolWater@lc bpd 11 11 12.4 QvolWater@sc bpd 0 0 0 QvolGas@lc MMcfd 0.302 0.310 0.311 QvolGas@sc MMcfd 21.3 20.5 21.3 GVF % 99.0 99.0 99.2 WLR % 3.8* 3.8 3.8
Table 1: Case A: Comparison of reprocessed MFM flow rates, GVF and WLR.
MASD-BOM EOS-BOM Oil Relative Error @lc % 0.8 -17.3 Oil Absolute Error @lc bpd
4.5 -93.0
Oil Relative Error @sc % -4.3 -14.9 Oil Absolute Error @sc bpd -17 -60 Gas Relative Error @lc % -2.8 0.2 Gas Relative Error @sc % 3.6 3.8 Error WLR (absolute) % 0 0 Error GVF (absolute) % 0.04 0.17
Table 2: Case A: Comparison of the relative and absolute errors of the MFM flow
rates, GVF and WLR between the black oil correlation and both the wellsite fluid property measurements and the equation of state.

24th International North Sea Flow Measurement Workshop 24th – 27th October 2006
13
In this case, it can be seen that the influence on the calculated GVF and the gas flow rates at either lines or standard conditions is minimal but there is some improvement in the oil flow rate at line conditions with the wellsite measurement technique. At this very high GVF the well stream is very close to being single phase which would explain the minimal errors associated with one method versus another. Case B is a well with a wetter gas with a GVF close to 95%.
MASD BOM EOS QvolOil@lc bpd 2134 1181 1736 QvolOil@sc bpd 1342 997 1326 QvolWater@lc bpd 0 0 0 QvolWater@sc bpd 0 0 0 QvolGas@lc MMcfd 0.240 0.246 0.243 QvolGas@sc MMcfd 18.9 20.7 19.6 GVF % 95.3 97.4 96.2 WLR % 0 0 0
Table 3: Case B: Comparison of reprocessed MFM flow rates, GVF and WLR.
MASD-BOM PVT Pro-BOM Oil Relative Error @lc % 81 47 Oil Absolute Error @lc bpd 952 555 Oil Relative Error @sc % 35 33 Oil Absolute Error @sc bpd 346 329 Gas Relative Error @lc % -2.0 -1.2 Gas Relative Error @sc % -8.6 -5.6 Error WLR (absolute) % 0 0 Error GVF (absolute) % -2.1 -1.3
Table 4: Case B: Comparison of the relative and absolute errors of the MFM flow
rates, GVF and WLR between the black oil correlation and both the wellsite fluid property measurements and the equation of state.
In this case it can be seen that the oil flow rate at line conditions is underestimated by the black oil correlation and there is a reasonable match between the EOS and MASD. The gas flow rates at line conditions remain consistent. In comparing the two cases, it was observed that the dryer the gas then the less the gas flow rate at line conditions is affected by the uncertainty of the fluid properties. An error of 10% is still possible on the oil flow rate or in the range of 100 bpd in the cases we observed. At lower GVF’s, with more liquid present, the influence of the fluid property uncertainty is greater. Absolute errors in the range of 500-900 bpd in the oil flow rate at line conditions have been observed. Accurate fluid properties are therefore critical in a very wet gas environment to ensure accurate oil flow rates at standard conditions. 8 DISCUSSION Multiphase technology is perceived to be complex and this may lead to difficulty in deploying multiphase flow meters successfully in the field. We have observed that well selected field technicians and engineers trained with very specific objectives can successfully operate multiphase flow meters. The focus on PVT training and the ability to collect representative

24th International North Sea Flow Measurement Workshop 24th – 27th October 2006
14
samples is essential. This has leaded us to the conclusion that the MASD is best delivered as a service with the Vx multiphase flow meters. Multiphase flow meters are usually operated at pressures well above a separator. This environment usually results in better measurements of rates at line conditions since the Gas Volume Fraction is lower. In gas environments this effect is even more acute with the higher level of liquid drop out observed for retrograde condensates. Under these circumstances, the usual PVT properties model developed for the separator can reach its limits. It is unavoidable to have a full understanding of the PVT and the consequent error propagation on the multiphase flow meter performance to ensure it is fit for purpose. The dual-energy gamma ray / Venturi technology has been tested by many operating companies in their fields over the recent years. In addition to testing wells periodically, monitoring clean-up operations and evaluating reservoir performance in combination with production logging, Vx Technology is also used for optimizing gas lift, sampling fluids and measuring accurate flow rates, pressure and temperature. The meter acquires production rate, cumulative volume and operating condition data (including pressure and temperature) in real time without requiring separation of fluids and capturing the entire dynamics of the well response thanks to a relative fast acquisition MFM. There is continuous advancement in the current Vx Technology leading to a better precision, and extension of working conditions on the entire GVF range from 0 to 100% through two innovative models and in terms of temperature and pressure (i.e. 302ºF/5,000 psia up to 392ºF/10,000 psia). The main benefits of using a combination venturi / dual energy gamma ray flowmeter are: a stand-alone meter, portable and no moving parts. There is no need for flow calibration by cross reference to another metering system or any other calibration. The measurement is independent of the flow regime, e.g. slug flow, foaming. It has a wide operating envelope with the capability of sampling from fluid sampling ports. In addition, it offers real-time data management. The main benefits for the client are improved safety, data quality, logistics, and longevity. It had been demonstrated that the playback facility is a key element in this type of conditions. The robust physics behind the dual energy gamma ray venturi multiphase flowmeter enables a strong and predictable performance of the meter in specific operating conditions. It is also possible to perform the error budget on the computed rates and quantify accurately the sensitivities to the input parameters of the flow meter. The Multiphase Active Sampling Device service has been optimized for this specific type of meter. 9 CONCLUSION The Multiphase Active Sampling Device and the associated service has been field tested in four gas condensate wells to demonstrate the quality of the measurement versus conventional PVT Laboratory measurements as well as the impact on the MFM flow rates. The fluid properties measurements were better than 1% between the well site and the equivalent laboratory measurement. The improvement against the standard model in this type of conditions was better than 10% to 20% in the measured oil, water and gas phase flow rates. The direct measurements from the MASD hardware therefore provided a far superior Vx flow rate output measurement when compared with both Correlation and EOS modeling where a single-point calibration is acceptable. The MASD sampling technique may find a limit at very high GVF's but this has yet to be determined with sampling being successfully performed at higher than 99.8% GVF. Fluid properties or phase behaviour input accuracy requirements are rarely challenged, even where this may have a major effect on the global uncertainty such as in high pressure or wet gas conditions but all MFM have as minimum output the Oil, Water and Gas flow rates at line conditions. The industry reports its production at standard conditions and therefore, the flow rates at line conditions need to be converted to standard condition using PVT model in one way or another. The mass and volume flow rate accuracy converted from line to standard condition combine with the intrinsic accuracy of the multiphase flow meter provides the global accuracy of the measurement.

24th International North Sea Flow Measurement Workshop 24th – 27th October 2006
15
In determining the global uncertainty of a MFM one must not only consider the intrinsic measurement performance, such as the limits of the inversion model, fluid dynamics and other specific physical properties measurements of the fluid (e.g. electrical or optical) used as input, but also the effect of the fluid property or phase behaviour measurements. The global uncertainties, therefore, hide two distinctive sources of errors, which have the potential to mislead the community in determining the real performance of one meter against another. Flow loop tests are most of the time used by oil companies to determine the performance of an MFM, however generalising the results of a comparative flow loop tests or a specific successful field experience to make decisions about an application elsewhere where the fluid properties are substantially different could lead to disappointment in the selected MFM’s performance. It is therefore valuable to be able to quantify the global uncertainty of a meter as a function of the separate uncertainties in the prime measurement and from fluid properties inputs for any given application. Few suppliers, based on the available publications, are capable today to quantify and demonstrate the entire performance of their metrology and even fewer have an in-depth understanding of fluid properties. Through the unique specification of the Vx Technology it is possible to identify the global error and the intrinsic performance of the PhaseTester or PhaseWatcher. Having a measurement system that is predictable offers the advantage of a better understanding of the performance of the MFM for the life of the well and the ability to manage the accuracy within a narrow boundary. The Multiphase Active Sampling Device and the associated service is a unique solution to improve the overall accuracy of flow rate measurement by reducing the uncertainty associated with the fluid properties input parameters both with variations in pressure and temperature and with variations of the well effluent composition over time. 10 AKNOWLEDGMENT A special thanks to Dave Mac William of the Schlumberger Reservoir Fluids Center in Aberdeen for helping us in the various phases of this development project as well as the operational team who supported the field trials. 11 REFERENCE [1] THEUVENY B.C., SEGERAL G. and PINGUET B.: “Multiphase Flow Meters in Well Testing
Applications” paper SPE 71475 at the 2001 Annual Technical Conference and Exhibition, New Orleans, Sep. 30th- Oct. 3rd.
[2] PINGUET B., GUIEZE P., DELVAUX E.: “Criticality of the PVT Model in Multiphase Flow Meters to ensure accurate volumetric flow rate reporting” paper Multiphase Pumping & Technologies Conference in Abu Dhabi, February 22nd-25th 2004.
[3] PINGUET B.G, HADDAD N., BIRKETT P.G.:“Fluid Properties on the main path for MFM and WGM Accuracy: An Analytical approach”, 4th South East Asia Conference, Kuala Lumpur Conference, March 8th-11th 2005
[4] HOPMAN N., PINGUET B.G, PEREZ S, GUIEZE P., VANDENBERG S, BOURGEOIS AM: “Field Experience in Gas Well Testing: The benefit of the Vx Technology from 0 to 100% GVF”, 5th South East Asia Conference, Kuala Lumpur Conference, March 9th-12th 2006
[5] PINGUET B.G, GUIEZE P, HOPMAN N, : “Field Experience in gas well testing from 0 to 100% Gas Volume Fraction” at Rio2006 Oil&Gas Conference in September, 11-14 2006, in Rio de Janeiro
[6] PINGUET B.G, DESTARAC P: “Importance of the fluid properties and predictable measurement in Multiphase flow metering to ensure accurate reporting in high water cut conditions and/or high CO2 concentration” at 1st International Jornadas sobre Medicin de Gas, Petroleo y Derivados South America Instituto Argentino de Petroleo y Gas
[7] ECONOMIDES M. J., HILL D.A. and EHLIG-ECONOMIDES C.: Petroleum Production Systems, Upper Saddle River, NJ (1994) 523-550.
[8] FRESHMAN R., LEKIC H.O.: “Artificial Lift for High-Volume Production”, Oilfield Review (Spring 1999): 49-63.

24th International North Sea Flow Measurement Workshop 24th – 27th October 2006
16
[9] MUS E.A., TOSKEY E.D., BASCOUL S.J.F., BARBER E.C.: “Development Well Testing Enhancement Using a Multiphase Flow Meter”, paper SPE 77769 presented at the 2002 Annual Technical Conference and Exhibition, San Antonio, Sep. 29th- Oct. 2nd.
[10] RETNANTO A., AZIM A.: “Monitoring Well Performance Using Multiphase Flow Meter” SPE 68718 presented at the 2001 Asia Pacific Oil And Gas Conference and Exhibition, Jakarta, Indonesia, Apr. 17-19.
[11] FALCONE G., HEWITT G.F., ALIMONTI C. and HARRISON, B.: “Multiphase Flow Metering: Current Trends and Future Developments” paper SPE 71474 presented at the 2001 Annual Technical Conference and Exhibition, New Orleans, Sep. 30th- Oct. 3rd.
[12] ATKINSON D.I., BERARD M., and SEGERAL G.: “Qualification of a Nonintrusive Multiphase Flow Meter in Viscous Flows” paper SPE 63118 presented at the 2000 Annual Technical Conference and Exhibition, Dallas, Oct. 1-4.
[13] THEUVENY B.C., SEGERAL G. and PINGUET B.: “Multiphase Flow Meters in Well Testing Applications” paper SPE 71475 presented at the 2001 Annual Technical Conference and Exhibition, New Orleans, Sep. 30th- Oct. 3rd.
[14] ATKINSON D.I., PINGUET B., SEGERAL G. and THEUVENY B.C.: “Field Implications of Uncertainties in Multiphase Flow Measurements” paper SPE 77403 presented at the 2002 Annual Technical Conference and Exhibition, San Antonio, Sep. 29th- Oct. 2nd.
[15] BAKER C. B.: “Flow Measurement Handbook: Industrial Designs, operating principles, performance and applications”, Cambridge, United Kingdom (2000) 4-9.
[16] FREUND J. E.: “Modern Elementary Statistics”, Prentice-Hall, Inc., Englewood Cliffs, NJ 1979. [17] COUPUT J.P., PROUVOST H., COQUIL M., LEPORCHER E. and DYKESTEEN E.:
"Implementation of multiphase metering on unmanned wellhead platform", paper OTC13220 presented at the 2001 Offshore technology Conference in Houston, April 30th-May 3rd, 2001.
[18] RETNANTO A.: "Production Optimization using Multiphase Well Testing: A Case Study from East Kalimantan, Indonesia", paper SPE 71556 presented at the 2001 Annual Technical Conference and Exhibition, New Orleans, Sep. 30th- Oct. 3rd, 2001.
[19] THEUVENY B., SEGERAL G., MOSKNES P.O.: "Detection and Identification of Scales Using Dual energy / Venturi Subsea or Topside Multiphase Flow meters", paper OTC 13152 presented at the 2001 Offshore technology Conference in Houston, April 30th-May 3rd, 2001.
[20] KONTHA I.N.H., WEIMER B., RETNANTO A., AZIM A., MARTINON D.: "Monitoring Well Performance using Multiphase Flow meter", paper SPE 68718 presented at the SPE Asia Pacific Oil and Gas conference and Exhibition, Jakarta, 17-19 April 2001.
[21] HADY A.A., "The Use of a Multiphase Flow Meter to optimize Gas Lift Well Operations”. [22] MUS E. A., TOSKEY E. D., and BASCOUL S.J.F., "Added Value of a Multiphase Flow Meter in
Exploration Well Testing”, paper OTC 13146 presented at the 2001 Offshore Technology Conference held in Houston, April 30th-May 3rd, 2001.
[23] TURNA E.P., PINGUET B.G., KOSHY T., KHOORI A. and BEKKOUSHA AEK.: "Multiphase Flow meters and production Logs Diagnose Well Response in an Onshore ADCO Field, Abu Dhabi” paper SPE 81534 presented at the SPE 13th Middle east Oil Show & Conference held in Bahrain 5-8 April 2003.
[24] PINGUET B.G., BARRETO W. : “Multiphase Flow experience in Brazil: An artificial lift Focus”, South East Asia Conference, Singapore, March 9th-11th.
[25] PINGUET B.G, TURNA E.P and BARRETO W. : “Field Experience in Gas Lift Conditions with a Venturi and Nuclear fraction Meter Combination“, Multiphase Pumping and Technologies, Abu Dhabi Conference, February 22nd-25th
[26] MEHDIZAED P.: "Multiphase Meters" Hart's Petroleum Engineer International, May 98, p63-70.
[27] THEUVENY B. G. and MEHDIZAED P.: ”Multiphase Flowmeters for Well and Fiscal Allocations”, Paper presented at the SPE Western Regional / AAPG Pacific Section joint meeting, 20-22 May 2002, Anchorage, Alaska.
[28] BRADLEY, Petroleum Engineering Handbook, SPE (SPE Letter & Computer Symbols Standard for Economics, Well Logging and Formation Evaluation, Natural Gas Engineering, and Petroleum Reservoir Engineering).
[29] JAYAWARDANE S. and THEUVENY B. C. “PVT Sampling with Multiphase Flowmeters”, SPE 77405, San Antonio, Sep. 30-Oct. 2, 2002, Texas.
[30] PINGUET. B.G. and alt “Research-Engineering on sampling techniques for field operations”, Schlumberger private library 1995-96, SRPC.
24th International North Sea Flow Measurement Workshop 24th – 27th October 2006
17
12 DEFINITON OF KEY PARAMETERS A short explanation of key parameters is given here below:
• Density at line conditions: The MFM uses the density at operating pressure and temperature to estimate the flow rates of oil, water and gas at line conditions, it is necessary in parallel to have the same data at standard conditions.
• Oil Volume Factor: bo (Pline, Tline) is the oil volume factor. It is used to perform the computation of the flow rate at standard conditions from the flow rate at line conditions. Qo line (Pline, Tline) is the flow rate of oil at line conditions (m3/s). Oil Flow Rate at Standard conditions: The oil volume factor (bo) is used to perform the computation of the flow rate at standard conditions from the flow rate at line conditions using bo (Pline, Tline) which is the oil volume factor.
• Gas Phase Condensate Gas Ratio: rgmp (Pline, Tline) is the gas phase condensate gas ratio. It is the result of condensation of free gas present at line conditions in the flow i.e. liquid condensing from the free gas at line conditions when flashed at standard conditions. Note: both bo and rgmp are function of the process conditions downstream of the meter, and can vary significantly for light oil, condensate and gas effluent, depending on the number of separation stages and conditions (pressure / temperature).
• Gas Density: Even if a relationship exists between the deviation factor (Z) and the gas density, the compressibility factor table should be required for quality control.
• Z is the deviation factor of the gas (evolved from a flash of the reservoir fluid) at line conditions. Z (Pref, Tref) is the gas deviation factor at reference conditions (usually close to 1). Z(Pline,Tline) is the gas deviation factor at line conditions
• Rst(Pline,Tline) is the Dissolved Gas to Oil ratio at line conditions i.e. the amount of gas that evolves out of the oil when the pressure and temperature are dropped from line conditions to standard conditions (in m3/m3).
• Stock Tank Gas Water Ratio: Rwst is the Dissolved Gas to Water ratio at line conditions (i.e. the amount of gas that will evolve out of the water when the pressure and temperature are dropped from line conditions to standard conditions (in m3/m3). This term is usually negligible unless a large amount of CO2 and H2S is present. Rwst is highly a function of the downstream process conditions (number of separation steps, pressure and temperature of such steps, in particular if any liquid stabilization process is used) and can be ignored in most of the cases if neither CO2 nor H2S is present. In case of high pressure, the amount of dissolved gas might not be negligible.
• Gas Expansion factor: bg is the gas volume factor in Sm3/m3. It could be computed using the Z factor.
• Stock Tank Gas Oil Ratio: Rst is highly a function of the downstream process conditions (number of separation steps, pressure and temperature of such steps, in particular if any liquid stabilization process is used. Rst is the Gas evolved from oil at line conditions to Oil Ratio 2 (gas evolving from the oil at line conditions.
• Water volume Factor: bw is the water volume factor in Sm3/m3. Note that bw is function of the process conditions downstream of the meter, and can vary significantly if CO2 and H2S are present and depends on the number of separation stages and conditions (pressure / temperature).
• Water Flow Rate at Standard conditions: The water volume factor (bw) is used to perform the computation of the flow rate at standard conditions from the flow rate at line conditions using bw (Pline, Tline) which is the water volume factor.
• Viscosity at line conditions: Multiphase Flow Meter requires generally the knowledge of the viscosity of the liquid mixture at line conditions. The liquid mixture is not only theoretically a function of pressure, temperature and WLR (Water Liquid ratio), but also a function of the mixing and potential presence of de-emulsifiers, de-foamers, surfactant, diluents that may be injected upstream the meter.