panorama satistique de la construction navale dans le monde
TRANSCRIPT

SHIPBUILDING STATISTICS
MARCH, 2016

1. World New Orders ……………… 1 10. World Laid Up Vessels ……………… 19
Fig 1. World New Orders ……………… 2 Fig 10. World Laid Up Vessels ……………… 20
2. World Completions ……………… 3 11. World Seaborne Trade ……………… 21
Fig 2. World Completions ……………… 4 Fig 11. World Seaborne Trade ……………… 22
3. World Completions by Ship Type ……………… 5 12. Newbuilding / Repair Sales (SAJ Members Only) ……………… 23
Fig 3. Ship Type Share of World Completions ……………… 6 Fig 12. Newbuilding / Repair Sales (SAJ Members Only) ……………… 24
4. World Orderbook at Year-End ……………… 7 13. Ordinary Steel Consumption by Shipbuilding Industry ……………… 25
Fig 4. World Orderbook at Year-End ……………… 8 Fig 13. Ordinary Steel Consumption by Shipbuilding Industry ……………… 26
5. World Merchant Fleets by Registration ……………… 9 14. Repair / Conversion Turnover ……………… 27
Fig 5. Fig 14. Repair / Conversion Turnover ……………… 28
15. Shipbuilding Workforce (SAJ Members) ……………… 29
6. World Merchant Fleets by Ship Type ……………… 11 Fig 15. Shipbuilding Workforce (SAJ Members) ……………… 30
Fig 6. World Merchant Fleets by Ship Type ……………… 12 Annex 1. ……………… 31
7. World Merchant Fleets' Age Profile by Ship Type ……………… 13
Fig 7. World Merchant Fleets' Age Profile by Ship Type ……………… 14 Annex 2. ……………… 32
8. World "Total Losses" and "Disposals" ……………… 15
Fig 8. World "Total Losses" and "Disposals" ……………… 16 Annex 3. ……………… 33
9. World Disposals by Country of Breaking ……………… 17
Fig 9. World Disposals by Country of Breaking ……………… 18
Orderbook by Shipowner's nationality (Japan ・ S.Korea・ China) As of end December. 2015
Orderbook by shiptype (Japan ・ S.Korea・ China) As of end December. 2015
Actual Delivery & Estimated Delivery by Ship-types As of end December. 2015
CONTENTS : SHIPBUILDING STATISTICS (MAR, 2016)
Merchant Fleets Share (%) By Registration & By Nationality of Owner ……………… 10

Year 2009 2010 2011 2012 2013 2014 2015Country No. '000GT share(%) No. '000GT share(%) No. '000GT share(%) No. '000GT share(%) No. '000GT share(%) No. '000GT share(%) No. '000GT share(%)
Japan 300 8,509 25.3 427 11,921 14.5 332 7,689 13.5 387 8,851 23.0 571 13,804 13.4 604 19,314 23.7 540 20,579 26.9 S. Korea 150 8,522 25.4 473 27,912 33.9 359 25,125 44.2 232 11,967 31.2 551 35,452 34.4 340 24,594 30.1 276 23,634 30.9 China 487 14,947 44.5 1,043 36,118 43.8 731 19,112 33.6 704 13,761 35.8 1,417 43,925 42.6 1,164 31,372 38.4 730 25,284 33.0
Belgium 0 0 0.0 0 0 0.0 0 0 0.0 0 0 0.0 0 0 0.0 0 0 0.0 0 0 0.0Denmark 1 0 0.0 1 0 0.0 1 0 0.0 5 3 0.0 0 0 0.0 3 5 0.0 4 7 0.0France 5 5 0.0 8 282 0.3 3 36 0.1 6 229 0.6 1 0 0.0 3 501 0.6 3 4 0.0Germany 9 8 0.0 22 550 0.7 12 281 0.5 11 422 1.1 11 535 0.5 11 252 0.3 8 722 0.9Greece 4 3 0.0 0 0 0.0 3 3 0.0 0 0 0.0 0 0 0.0 0 0 0.0 0 0 0.0Italy 5 359 1.1 9 566 0.7 9 160 0.3 4 110 0.3 8 425 0.4 9 649 0.8 16 732 1.0Netherlands 10 57 0.2 9 22 0.0 43 90 0.2 21 48 0.1 46 206 0.2 45 82 0.1 25 67 0.1U.K. 2 0 0.0 1 0 0.0 3 1 0.0 5 2 0.0 1 0 0.0 7 11 0.0 7 21 0.0Finland 1 12 0.0 3 71 0.1 7 110 0.2 3 119 0.3 2 10 0.0 6 230 0.3 5 638 0.8Norway 14 30 0.1 13 62 0.1 17 74 0.1 26 116 0.3 20 102 0.1 27 130 0.2 16 57 0.1Sweden 0 0 0.0 0 0 0.0 0 0 0.0 0 0 0.0 0 0 0.0 0 0 0.0 0 0 0.0Spain 14 45 0.1 24 34 0.0 11 58 0.1 20 92 0.2 24 32 0.0 21 84 0.1 31 559 0.7Portugal 0 0 0.0 0 0 0.0 0 0 0.0 0 0 0.0 0 0 0.0 0 0 0.0 0 0 0.0
Europe total 65 521 1.6 90 1,587 1.9 109 813 1.4 101 1,141 3.0 113 1,311 1.3 132 1,944 2.4 115 2,807 3.7Brazil 24 42 0.1 22 92 0.1 42 556 1.0 59 582 1.5 29 193 0.2 12 45 0.1 6 10 0.0Poland 13 6 0.0 13 83 0.1 35 73 0.1 33 90 0.2 44 111 0.1 29 94 0.1 29 44 0.1Singapore 12 15 0.0 3 40 0.0 16 54 0.1 16 48 0.1 11 8 0.0 23 87 0.1 10 20 0.0Taiwan 12 264 0.8 8 246 0.3 12 1,028 1.8 11 63 0.2 35 1,021 1.0 36 296 0.4 25 369 0.5U.S.A. 23 27 0.1 45 70 0.1 36 276 0.5 35 212 0.6 72 721 0.7 40 205 0.3 26 35 0.0Croatia 1 24 0.1 6 141 0.2 8 109 0.2 7 44 0.1 12 144 0.1 15 293 0.4 15 331 0.4India 25 39 0.1 65 178 0.2 11 12 0.0 38 145 0.4 18 47 0.0 8 5 0.0 6 4 0.0Philippines 7 604 1.8 31 2,256 2.7 16 601 1.1 8 405 1.1 67 3,474 3.4 38 1,933 2.4 43 2,269 3.0Romania 9 17 0.1 41 356 0.4 41 558 1.0 42 230 0.6 50 1,376 1.3 32 824 1.0 38 201 0.3Turkey 47 73 0.2 45 113 0.1 44 98 0.2 49 104 0.3 85 164 0.2 74 180 0.2 80 152 0.2Vietnam 20 66 0.2 70 570 0.7 40 229 0.4 58 117 0.3 104 1,144 1.1 64 147 0.2 85 556 0.7Others 213 - - 398 717 0.9 420 468 0.8 372 640 1.7 353 306 0.3 277 267 0.3 173 276 0.4
Sub total 406 1,101 3.3 747 4,862 5.9 721 4,061 7.1 728 2,680 7.0 880 8,708 8.4 648 4,376 5.4 536 4,267 5.6
World Total 1,408 33,600 100.0 2,780 82,400 100.0 2,252 56,800 100.0 2,152 38,400 100.0 3,532 103,200 100.0 2,888 81,600 100.0 2,197 76,570 100.0
(Note) 1.Data Source : IHS "World Shipbuilding Statistics". 2.Ship Size Coverage : 100 Gross Tonnage and over. 3.Europe total = Former AWES (present SEA Europe) countries. Excludes Poland (member from '95) , Romania ('00), Croatia ('02), Lithuania & Bulgaria ('09) for comparisons with former periods.
1. WORLD NEW ORDERS
- 1 -

(Note) 1.Data Source : JSEA report based on LR until 1994. IHS "World Shipbuilding Statistics"from 1995. 2.Ship Size Coverage : 100 Gross Tonnage and over.
24.119.9
12.8
22.625.4 25.5 23.4
36.5
26.728.9
46.1
36.5
28.8
74.077.2
60.0
99.6
169.6
88.0
33.6
82.4
56.8
38.4
103.2
81.6 76.6
0
20
40
60
80
100
120
140
160
180
90 91 92 93 94 95 96 97 98 99 00 01 02 03 04 05 06 07 08 09 10 11 12 13 14 15
Fig 1. WORLD NEW ORDERS
Others
China
Europe
S.Korea
Japan
Million GT
World total figures are indicated.
(1990~2015)
China
S. Korea
Japan
- 2 -

Year 2009 2010 2011 2012 2013 2014 2015Country No. '000GT share(%) No. '000GT share(%) No. '000GT share(%) No. '000GT share(%) No. '000GT share(%) No. '000GT share(%) No. '000GT share(%)
Japan 576 18,972 24.6 580 20,218 21.0 593 19,367 19.0 586 17,426 18.2 540 14,588 20.7 522 13,421 20.8 520 13,005 19.2 S. Korea 524 28,849 37.4 526 31,698 32.9 572 35,850 35.2 474 31,583 33.0 386 24,504 34.8 343 22,595 35.0 358 23,272 34.4 China 1,086 21,969 28.5 1,413 36,437 37.8 1,425 39,609 38.9 1,448 39,003 40.8 1,073 25,903 36.8 914 22,707 35.1 949 25,160 37.2
Belgium 0 0 0.0 0 0 0.0 0 0 0.0 0 0 0.0 0 0 0.0 0 0 0.0 0 0 0.0Denmark 8 449 0.6 8 432 0.4 5 89 0.1 7 32 0.0 7 2 0.0 3 1 0.0 0 0 0.0France 8 146 0.2 8 258 0.3 6 2 0.0 8 144 0.2 4 183 0.3 2 1 0.0 5 4 0.0Germany 50 781 1.0 36 932 1.0 21 418 0.4 19 448 0.5 12 350 0.5 15 519 0.8 10 384 0.6Greece 8 11 0.0 7 4 0.0 7 6 0.0 1 1 0.0 1 1 0.0 0 0 0.0 5 4 0.0Italy 22 554 0.7 34 634 0.7 15 382 0.4 11 327 0.3 12 172 0.2 10 312 0.5 6 219 0.3Netherlands 33 138 0.2 29 138 0.1 34 175 0.2 38 110 0.1 30 66 0.1 29 108 0.2 35 108 0.2U.K. 6 1 0.0 8 1 0.0 1 0 0.0 4 4 0.0 6 5 0.0 8 7 0.0 6 3 0.0Finland 3 304 0.4 2 225 0.2 1 48 0.0 6 74 0.1 2 65 0.1 3 105 0.2 2 111 0.2Norway 15 44 0.1 12 21 0.0 12 13 0.0 23 42 0.0 19 46 0.1 20 63 0.1 22 54 0.1Sweden 1 9 0.0 1 13 0.0 0 0 0.0 0 0 0.0 0 0 0.0 0 0 0.0 0 0 0.0Spain 52 217 0.3 56 288 0.3 44 198 0.2 29 61 0.1 30 102 0.1 32 69 0.1 27 38 0.1Portugal 6 26 0.0 1 9 0.0 2 1 0.0 2 2 0.0 0 0 0.0 0 0 0.0 0 0 0.0
Europe total 212 2,680 3.5 202 2,955 3.1 148 1,332 1.3 148 1,243 1.3 123 992 1.4 122 1,185 1.8 118 925 1.4Brazil 25 77 0.1 21 47 0.0 32 102 0.1 26 219 0.2 31 170 0.2 26 212 0.3 32 361 0.5Poland 60 360 0.5 52 167 0.2 37 103 0.1 40 99 0.1 36 119 0.2 44 136 0.2 34 67 0.1Singapore 34 47 0.1 41 119 0.1 40 108 0.1 44 92 0.1 48 71 0.1 50 97 0.2 22 11 0.0Taiwan 18 476 0.6 21 580 0.6 23 767 0.8 33 790 0.8 25 483 0.7 47 600 0.9 56 749 1.1U.S.A. 99 292 0.4 76 238 0.2 59 122 0.1 64 154 0.2 70 192 0.3 85 293 0.5 75 427 0.6Croatia 16 412 0.5 16 387 0.4 14 380 0.4 12 200 0.2 7 89 0.1 7 41 0.1 7 73 0.1India 41 79 0.1 37 109 0.1 42 204 0.2 66 216 0.2 42 252 0.4 42 96 0.1 27 27 0.0Philippines 23 572 0.7 34 1,161 1.2 30 1,661 1.6 38 2,506 2.6 26 1,331 1.9 45 1,878 2.9 42 1,865 2.8Romania 58 720 0.9 43 613 0.6 34 652 0.6 44 437 0.5 41 504 0.7 44 326 0.5 39 485 0.7Turkey 127 515 0.7 94 364 0.4 87 359 0.4 60 190 0.2 68 194 0.3 94 184 0.3 91 173 0.3Vietnam 92 351 0.5 132 560 0.6 103 659 0.6 105 884 0.9 75 542 0.8 93 378 0.6 90 591 0.9Others 563 700 0.9 460 781 0.8 431 570 0.6 508 534 0.6 498 546 0.8 485 470 0.7 410 375 0.6
Sub total 1,156 4,602 6.0 1,027 5,125 5.3 932 5,687 5.6 1,040 6,320 6.6 967 4,493 6.4 1,062 4,711 7.3 925 5,204 7.7
World Total 3,554 77,073 100.0 3,748 96,433 100.0 3,670 101,845 100.0 3,696 95,575 100.0 3,089 70,480 100.0 2,963 64,618 100.0 2,870 67,566 100.0
(Note) 1.Data Source : IHS "World Fleet Statistics". 2.Ship Size Coverage : 100 Gross Tonnage and over. 3.Europe total = Former AWES (present SEA Europe) countries. Excludes Poland (member from '95) , Romania ('00), Croatia ('02), Lithuania & Bulgaria ('09) for comparisons with former periods.
2. WORLD COMPLETIONS
- 3 -

(Note)1.Data Source:IHS "World Fleet Statistics". 2.Ship Size Coverage:100 GT and over.
15.9 16.118.6
20.5 19.722.7
25.8 25.5 25.527.8
31.7 31.333.4
36.1
40.2
47.0
52.1
57.3
67.7
77.1
96.4
101.8
95.6
70.5
64.667.6
0
20
40
60
80
100
120
90 91 92 93 94 95 96 97 98 99 00 01 02 03 04 05 06 07 08 09 10 11 12 13 14 15
Fig 2. WORLD COMPLETIONS
Others
China
Europe
S.Korea
Japan
Million GT
World total figures are indicated.
(1990~2015)
Japan
S.Korea
China
- 4 -

No. '000GT No. '000GT No. '000GT No. '000GT No. '000GT No. '000GT No. '000GT No. '000GT No. '000GT No. '000GT No. '000GT No. '000GT No. '000GT No. '000GT No. '000GT No. '000GT
LPG/LNGCarrier 43 1,761 33 539 34 1,343 46 2,055 40 2,206 33 2,177 68 3,360 93 4,159 134 7,884 101 5,990 88 3,668 71 1,718 46 513 68 2,623 83 4,010 114 5,226
ChemicalTanker 100 1,354 84 1,154 116 1,703 177 2,662 191 3,137 213 3,328 253 3,666 322 4,460 461 6,404 419 5,808 324 4,529 232 3,225 158 2,137 157 2,729 162 3,282 208 4,588
Tanker 151 10,514 115 7,080 157 11,194 248 14,568 241 12,880 262 13,932 239 10,926 271 13,251 289 14,889 386 21,463 331 18,558 303 19,422 319 15,934 258 9,535 171 6,202 130 6,384
Bulker 184 6,962 314 11,304 224 7,725 165 6,466 257 10,264 313 12,537 310 13,465 317 13,375 342 13,013 537 22,693 985 43,549 1,169 53,001 1,204 53,891 767 33,413 615 26,200 645 26,520
Containership 154 5,270 186 6,978 200 7,167 174 6,194 174 7,069 266 10,276 362 14,753 395 14,495 428 16,226 278 11,477 260 14,648 192 13,391 212 13,765 212 14,747 206 16,414 212 17,339
Other Dry Cargo Ship 370 3,968 254 2,589 218 2,555 203 2,659 262 3,103 378 3,697 436 4,429 521 5,512 562 6,751 524 6,523 569 7,663 602 7,490 535 6,164 422 4,398 339 3,577 332 3,876
PassengerShip 61 858 63 1,089 52 1,061 42 978 47 939 39 399 31 753 52 859 44 1,040 55 985 45 1,257 40 546 44 788 21 572 50 711 47 656
Miscellaneous 736 1,009 504 559 538 635 485 549 517 574 625 625 748 766 811 1,207 982 1,483 1,254 2,133 1,146 2,561 1,061 3,053 1,178 2,382 1,184 2,464 1,337 4,223 1,182 2,976
World Total 1,799 31,696 1,553 31,292 1,539 33,383 1,540 36,131 1,729 40,171 2,129 46,970 2,447 52,118 2,782 57,320 3,242 67,690 3,554 77,073 3,748 96,433 3,670 101,845 3,696 95,575 3,089 70,480 2,963 64,618 2,870 67,566
( Note ) 1. Data Source : IHS "World Fleet Statistics". 2. Ship Size Coverage : 100 Gross Tonnage and over. 3. "Dry cargo" includes vessels of General cargo, Pax/General, Reefer, RoRo, Pax/RoRo and Other dry cargo. 4. "Miscellaneous" includes vessels of Fishing, Offshore, Research, Towing/Pushing, Dredging and Other activities.
2009
3. WORLD COMPLETIONS BY SHIP TYPE
2000 2001 2002 2003 2006 2010 20122011 20152004 2005 201420132007 2008
- 5 -

(Note) 1.Data Source : IHS "World Fleet Statistics" 2.Ship Size Coverage : 100 Gross Tonnage and over.
3.2 1.8 1.9 1.5 1.4 1.3 1.5 2.1 2.2 2.8 2.7 3.0 2.5 3.56.5
4.4
2.7 3.5 3.2 2.7 2.3 0.8 1.4 1.5 1.5 1.3 1.3 0.5 0.8 0.8
1.11.0
12.58.3 7.7 7.4 7.7 7.9 8.5
9.6 10.0 8.5 7.9 7.4 6.4 6.2
5.55.7
16.622.3
21.5
17.117.6
21.9
28.3 25.3 24.0
14.9 15.213.1 14.4
20.9
25.425.7
22.0
36.1
23.1
17.9
25.6
26.7
25.823.3
19.2
29.4
45.2 52.056.4
47.4
40.539.3
33.2
22.6
33.5
40.3
32.129.7
21.023.1
22.027.8
19.2
19.1
16.7
13.59.6
9.4
4.3
3.75.1
7.4 7.8 7.17.0
7.8
9.5
7.5
4.73.2
2.2
3.95.1
6.8
5.61.7
4.0 5.7 5.5 4.6 6.4 7.3 11.67.8
3.81.7 0.5
3.76.2 7.7
0%
10%
20%
30%
40%
50%
60%
70%
80%
90%
100%
00 01 02 03 04 05 06 07 08 09 10 11 12 13 14 15
Fig 3. SHIP TYPE SHARE OF WORLD COMPLETIONS
LPG/LNG Carriers Chemical Tankers
Tankers
Bulkers
ContainershipsOther Dry
Cargo Ships
PassengerShips
Miscellaneous
- 6 -

Year 2009 2010 2011 2012 2013 2014 2015Country No. '000GT share(%) No. '000GT share(%) No. '000GT share(%) No. '000GT share(%) No. '000GT share(%) No. '000GT share(%) No. '000GT share(%)
Japan 1,286 51,966 17.3 1,105 42,474 16.3 933 34,270 15.8 740 25,828 16.1 825 26,089 14.3 941 32,875 16.7 991 40,585 20.2 S. Korea 1,675 104,252 34.7 1,357 89,595 34.3 1,078 75,872 35.0 764 52,109 32.5 890 60,624 33.2 865 61,080 30.9 769 59,410 29.5 China 3,523 111,148 37.0 2,967 103,031 39.5 2,482 84,000 38.7 1,927 63,475 39.6 2,161 73,039 39.9 2,454 80,452 40.8 2,334 77,593 38.5
Belgium 0 0 0.0 0 0 0.0 1 1 0.0 1 1 0.0 1 1 0.0 0 0 0.0 0 0 0.0Denmark 12 555 0.2 5 116 0.0 5 2 0.0 8 2 0.0 1 0 0.0 1 1 0.0 6 10 0.0France 9 438 0.1 9 283 0.1 8 384 0.2 7 401 0.3 5 229 0.1 7 729 0.4 6 730 0.4Germany 85 1,988 0.7 55 1,459 0.6 48 1,319 0.6 37 1,208 0.8 30 1,109 0.6 28 1,491 0.8 27 1,855 0.9Greece 4 3 0.0 4 4 0.0 2 2 0.0 2 2 0.0 2 2 0.0 2 2 0.0 3 2 0.0Italy 83 1,965 0.7 47 1,293 0.5 39 1,078 0.5 35 870 0.5 28 1,151 0.6 26 1,460 0.7 37 1,985 1.0Netherlands 84 452 0.2 70 331 0.1 84 286 0.1 63 216 0.1 77 345 0.2 73 277 0.1 75 247 0.1U.K. 7 1 0.0 5 1 0.0 4 2 0.0 14 17 0.0 9 9 0.0 9 13 0.0 15 32 0.0Finland 6 335 0.1 5 131 0.1 12 194 0.1 7 221 0.1 8 226 0.1 9 351 0.2 12 879 0.4Norway 32 91 0.0 30 130 0.0 33 104 0.0 40 163 0.1 41 169 0.1 42 195 0.1 33 154 0.1Sweden 2 24 0.0 0 0 0.0 0 0 0.0 0 0 0.0 0 0 0.0 0 0 0.0 0 0 0.0Spain 120 656 0.2 83 349 0.1 50 187 0.1 57 245 0.2 54 179 0.1 48 203 0.1 51 717 0.4Portugal 3 11 0.0 2 8 0.0 6 47 0.0 4 46 0.0 4 46 0.0 2 8 0.0 0 0 0.0
Europe total 447 6,520 2.2 315 4,106 1.6 292 3,606 1.7 275 3,393 2.1 260 3,466 1.9 247 4,731 2.4 265 6,612 3.3Brazil 118 2,118 0.7 116 2,249 0.9 127 2,668 1.2 155 4,031 2.5 167 4,164 2.3 163 3,984 2.0 128 3,111 1.5Poland 82 327 0.1 70 305 0.1 68 211 0.1 58 183 0.1 83 208 0.1 66 182 0.1 75 184 0.1Singapore 107 297 0.1 86 264 0.1 93 268 0.1 83 351 0.2 66 252 0.1 50 177 0.1 55 192 0.1Taiwan 47 2,222 0.7 42 1,947 0.7 47 2,207 1.0 33 1,560 1.0 42 1,976 1.1 40 1,659 0.8 33 1,444 0.7U.S.A. 98 526 0.2 72 212 0.1 103 608 0.3 123 784 0.5 145 1,255 0.7 124 1,285 0.7 110 843 0.4Croatia 36 832 0.3 24 542 0.2 21 326 0.2 16 178 0.1 20 231 0.1 30 588 0.3 38 717 0.4India 261 3,424 1.1 257 2,436 0.9 239 2,016 0.9 192 1,305 0.8 168 1,128 0.6 123 222 0.1 120 292 0.1Philippines 114 6,690 2.2 108 7,064 2.7 80 4,726 2.2 48 2,482 1.5 90 4,672 2.6 83 4,611 2.3 93 5,170 2.6Romania 111 1,944 0.6 80 1,116 0.4 93 1,060 0.5 84 774 0.5 91 1,717 0.9 82 2,214 1.1 83 1,923 1.0Turkey 225 1,116 0.4 162 804 0.3 140 555 0.3 145 551 0.3 157 510 0.3 124 400 0.2 140 366 0.2Vietnam 287 3,094 1.0 252 2,452 0.9 237 2,262 1.0 205 1,357 0.8 227 1,944 1.1 181 1,535 0.8 205 1,585 0.8Others 809 4,036 1.3 809 2,420 0.9 826 2,310 1.1 702 2,008 1.3 602 1,589 0.9 575 1,394 0.7 568 1,369 0.7
Sub total 2,295 26,626 8.9 2,078 21,811 8.4 2,074 19,219 8.9 1,844 15,564 9.7 1,858 19,646 10.7 1,641 18,251 9.2 1,648 17,197 8.5World Total 9,226 300,511 100.0 7,822 261,016 100.0 6,859 216,967 100.0 5,550 160,368 100.0 5,994 182,863 100.0 6,148 197,389 100.0 6,007 201,397 100.0
(Note) 1.Data Source : IHS "World Shipbuilding Statistics". Year-end basis. 2.Ship Size Coverage : 100 Gross Tonnage and over. 3.Europe total = Former AWES (present SEA Europe) countries. Excludes Poland (member from '95) , Romania ('00), Croatia ('02), Lithuania & Bulgaria ('09) for comparisons with former periods.
4. WORLD ORDERBOOK AT YEAR-END
- 7 -

(Note) 1.Data Source : IHS "World Shipbuilding Statistics". 2.Ship Size Coverage : 100 Gross Tonnage and over.
39.8 43.237.3 39.2
45.8 48.5 45.356.6 57.4 58.9
71.1 75.8 74.9
112.2
146.2
164.0
208.9
329.7
368.1
300.5
261.0
217.0
160.4
182.9
197.4 201.4
0
50
100
150
200
250
300
350
400
90 91 92 93 94 95 96 97 98 99 00 01 02 03 04 05 06 07 08 09 10 11 12 13 14 15
Fig 4. WORLD ORDERBOOK AT YEAR-END
Others
China
Europe
S.Korea
Japan
Million GT
Japan
S. Korea
World total figures are indicated.
China
- 8 -

5. WORLD MERCHANT FLEETS BY REGISTRATION
Year 2005 End 2006 End 2007 End 2008 End 2009 End 2010 End 2011 End 2012 End 2013 End 2014 End 2015 EndCountry No. '000GT No. '000GT No. '000GT No. '000GT No. '000GT No. '000GT No. '000GT No. '000GT No. '000GT No. '000GT No. '000GT
Panama 6,838 141,822 7,183 154,965 7,605 168,166 8,065 183,503 8,100 190,663 7,986 201,264 8,127 214,760 8,083 218,663 8,066 218,269 8,092 217,605 8,026 216,806Liberia 1,653 59,600 1,907 68,405 2,171 76,573 2,306 82,389 2,456 91,696 2,726 106,708 3,030 121,519 3,098 126,017 3,080 126,439 3,062 126,991 3,136 131,044Marshall Is. 853 29,242 953 32,840 1,099 35,964 1,265 42,637 1,376 49,088 1,622 62,011 1,876 76,054 2,056 85,320 2,282 95,025 2,579 109,384 2,905 120,883Hong Kong 1,128 29,809 1,179 32,685 1,242 35,816 1,371 39,100 1,529 45,338 1,736 55,543 1,935 70,206 2,128 78,299 2,267 85,576 2,322 92,355 2,427 102,038Singapore 1,977 30,990 2,079 32,174 2,257 36,252 2,451 39,886 2,563 41,047 2,667 44,870 2,877 53,830 2,954 60,318 3,096 69,353 3,270 77,041 3,376 80,982Malta 1,220 23,016 1,294 24,850 1,421 27,754 1,532 31,633 1,613 35,037 1,724 38,738 1,815 45,117 1,764 44,168 1,816 49,707 1,936 56,239 2,099 64,173Bahamas 1,361 38,418 1,402 40,831 1,430 43,739 1,446 46,543 1,426 48,119 1,384 50,370 1,409 52,390 1,375 52,424 1,348 52,986 1,363 54,950 1,410 59,451China 3,590 22,284 3,695 23,488 3,799 24,919 3,916 26,811 4,064 30,077 4,080 34,705 4,148 37,924 3,718 40,612 3,937 43,064 4,242 44,475 4,444 44,278Greece 1,491 30,745 1,455 32,048 1,478 35,704 1,498 36,822 1,517 38,911 1,433 40,795 1,386 41,276 1,343 41,141 1,315 41,735 1,305 42,347 1,277 41,230Japan 6,842 12,751 6,731 12,798 6,519 12,788 6,316 13,536 6,221 14,725 6,150 16,858 5,619 17,423 5,521 18,527 5,501 19,801 5,506 21,066 5,352 22,617Cyprus 992 19,019 971 19,032 985 18,954 1,016 20,109 1,026 20,169 1,014 20,732 1,022 20,993 1,013 20,039 1,041 21,049 1,036 21,079 1,017 21,270Norway 2,068 17,532 2,078 18,222 2,088 18,156 2,055 18,311 2,023 16,614 1,995 16,529 2,004 16,512 1,958 16,528 1,944 16,405 1,953 15,916 1,956 16,447Italy 1,539 11,616 1,566 12,571 1,564 12,972 1,588 13,600 1,635 15,531 1,649 17,044 1,667 18,492 1,650 18,510 1,633 18,143 1,573 16,239 1,573 16,138Denmark 1,003 8,290 963 8,800 953 9,476 963 10,570 972 11,336 987 12,126 998 11,950 1,015 11,943 1,023 12,773 1,051 14,947 1,066 15,918Indonesia 3,214 4,330 4,271 5,287 4,469 5,670 4,464 5,810 5,205 8,093 5,763 9,279 6,332 10,430 7,171 11,671 7,773 12,689 8,470 13,549 9,266 14,739U.K. 1,563 11,194 1,598 12,150 1,637 13,444 1,676 15,247 1,697 16,958 1,638 16,478 1,662 17,651 1,535 16,922 1,467 14,739 1,432 13,462 1,460 14,653Isle of Man 362 8,406 360 8,632 339 8,450 345 8,965 363 10,194 385 11,621 410 13,341 409 14,203 418 15,804 407 15,288 380 14,299U.S.A. 6,472 11,058 6,498 11,218 6,486 11,411 6,524 11,268 6,546 12,018 6,371 11,941 6,461 11,601 6,345 11,336 6,367 11,256 6,516 11,507 6,627 11,995S. Korea 2,778 9,251 2,820 10,477 2,946 13,102 3,001 14,145 3,009 12,893 2,913 12,513 2,916 12,084 2,976 11,793 2,986 12,012 2,978 12,135 2,938 11,482Bermuda 136 7,312 149 8,413 152 9,170 153 9,592 155 9,706 158 10,536 164 11,323 164 11,594 152 11,031 157 10,986 149 10,419Germany 894 11,497 881 11,364 885 12,934 961 15,283 948 15,157 931 15,283 868 15,320 778 13,300 722 12,411 678 11,117 679 10,154India 1,096 8,065 1,181 8,381 1,417 9,168 1,460 9,283 1,349 9,027 1,404 9,244 1,443 9,762 1,496 9,364 1,531 9,208 1,553 9,194 1,596 9,679Antigua&Barbuda 1,030 7,179 1,086 7,947 1,130 8,635 1,195 9,537 1,237 9,993 1,293 10,738 1,322 11,163 1,265 10,665 1,193 10,047 1,123 9,546 1,010 8,514Russia 3,722 8,334 3,656 8,046 3,481 7,587 3,444 7,527 3,465 7,650 3,485 7,711 3,362 7,591 3,423 7,690 3,473 7,816 3,517 8,257 3,571 8,508Netherland 1,457 7,180 1,445 7,230 1,432 7,404 1,498 8,249 1,504 8,373 1,455 8,001 1,520 8,728 1,492 8,569 1,486 8,660 1,463 8,688 1,439 8,183Malaysia 1,052 5,759 1,101 6,389 1,151 6,975 1,238 7,078 1,344 7,718 1,391 8,073 1,449 8,197 1,401 7,586 1,454 6,993 1,523 7,136 1,578 7,018Turkey 1,156 5,045 1,184 4,849 1,252 4,995 1,301 5,181 1,344 5,451 1,334 5,947 1,360 6,419 1,351 6,476 1,313 5,926 1,313 5,868 1,449 6,039France 864 5,611 881 6,165 918 6,350 951 6,324 952 6,842 799 6,668 819 7,052 792 5,926 793 5,798 824 5,799 924 6,016Philippines 1,866 5,199 1,840 5,072 1,768 5,066 1,808 5,029 1,823 5,219 1,946 5,256 1,995 5,012 2,006 4,449 2,044 4,592 2,053 4,337 2,209 4,641Taiwan 636 3,226 628 2,786 629 2,750 637 2,672 641 2,636 677 2,869 906 2,990 919 3,195 954 3,305 1,033 3,740 1,132 4,024Iran 453 5,271 475 5,207 508 3,577 503 1,096 542 988 581 755 647 870 755 2,844 830 3,272 856 3,195 918 3,378Brazil 510 2,343 525 2,281 538 2,290 569 2,359 592 2,378 617 2,393 484 2,344 516 2,344 554 2,510 578 2,644 619 2,928St. Vincent 1,044 5,905 1,064 6,107 1,048 5,928 1,009 5,203 1,043 5,152 942 4,707 857 4,020 811 3,410 726 2,899 751 2,603 713 2,314Ukraine 658 1,154 655 1,136 655 1,145 644 1,087 622 905 528 787 523 710 523 662 509 619 486 561 459 506Poland 359 190 355 193 351 193 358 213 338 204 314 162 182 110 179 107 177 126 173 98 161 82Others 28,228 66,472 28,827 68,814 29,701 71,460 30,214 74,103 30,954 76,730 31,314 78,727 30,710 77,919 31,021 84,588 31,562 90,613 32,453 96,505 32,465 98,378World Total 92,105 675,116 94,936 721,855 97,504 774,937 99,741 830,704 102,194 882,635 103,392 957,982 104,305 1,043,082 105,004 1,081,205 106,833 1,122,649 109,627 1,166,847 111,806 1,211,223
(Note) 1. Data Source : IHS "World Fleet Statistics". 2. Ship Size Coverage : 100 Gross Tonnage and over. 3. Second Registries are included in Denmark, France, Netherlands, Norway. 4. Dominant registered countries or regions (more than 2 mil.GT) out of "Others" category as of 2015-end are ; Portugal 8.23, Belgium 4.92, Vietnam 4.52,
- 9 -

(Note) 1. Data Source : IHS "World Fleet Statistics" 2. Ship Size Coverage : 100 Gross Tonnage and over.
Panama
17.9%
Liberia
10.8%
Marshall Is.
10.0%Hong Kong
8.4%
Singapore
6.7%
Malta
5.3%Bahamas
4.9%
China
3.7%Greece
3.4%
Japan
1.9%
Cyprus
1.8%
Norway
1.4%
Italy
1.3%Others
22.6%
Greece
13.8% Japan
13.2%
China
8.9%Germany
6.9%U.S.A.
5.5%U.K.
4.6%
S. Korea
3.9%
Norway
3.1%
Singapore
3.1%
Denmark
2.5%
Taiwan
2.4%
Hong Kong
2.8%
Italy
1.5%
Others
27.8%
Note:Others 27.8% includes unknown nationality.
Fig 5. MERCHANT FLEETS SHARE (%)BY REGISTRATION & BY NATIONALITY OF OWNER
< As of End 2015/ GT Basis >
(1)By Registration (%) (2)By Nationality of Owner (%)
- 10 -

6. WORLD MERCHANT FLEETS BY SHIP TYPE
World Total Oil Tanker Bulk Carrier Other ship types GT share (%) Year No. '000 GT No. '000 GT No. '000 GT No. '000 GT Oil Tanker Bulk Carrier Other ship types
1955 32,492 100,569 3,575 26,455 28,917 74,114 26.3 73.71960 36,311 129,770 4,543 41,465 31,768 88,305 32.0 68.01965 41,865 160,392 5,307 55,046 1,403 18,757 35,155 86,589 34.3 11.7 54.01970 52,444 227,490 6,103 86,140 2,528 46,652 43,813 94,698 37.9 20.5 41.61975 63,724 342,162 7,024 150,057 3,711 85,548 52,989 106,557 43.9 25.0 31.11980 73,832 419,911 7,112 175,004 4,706 109,596 62,014 135,311 41.7 26.1 32.2 81 73,864 420,835 6,986 171,697 4,736 113,084 62,142 136,054 40.8 26.9 32.3 82 75,151 424,742 7,021 166,828 4,947 119,298 63,183 138,616 39.3 28.1 32.6 83 76,106 422,590 6,882 157,279 5,073 124,397 64,151 140,914 37.2 29.4 33.3 84 76,068 418,682 6,647 147,463 5,229 128,334 64,192 142,885 35.2 30.7 34.11985 76,395 416,269 6,590 138,448 5,391 133,983 64,414 143,838 33.3 32.2 34.6 86 75,266 404,910 6,490 128,426 5,274 132,908 63,502 143,576 31.7 32.8 35.5 87 75,240 403,498 6,490 127,660 5,099 131,028 63,651 144,810 31.6 32.5 35.9 88 75,680 403,406 6,565 127,843 4,980 129,635 64,135 145,928 31.7 32.1 36.2 89 76,100 410,481 6,383 129,578 5,061 129,482 64,656 151,421 31.6 31.5 36.91990 78,336 423,627 6,609 134,836 5,156 133,190 66,571 155,601 31.8 31.4 36.7 91 80,030 436,027 6,768 138,897 5,201 135,885 68,061 161,245 31.9 31.2 37.0 92 79,726 445,169 6,342 138,149 5,894 139,042 67,490 167,978 31.0 31.2 37.7 93 80,655 457,915 6,847 143,441 5,952 140,915 67,856 173,559 31.3 30.8 37.9 94 80,676 475,859 6,639 144,595 5,964 144,914 68,073 186,350 30.4 30.5 39.21995 82,890 490,662 6,761 143,521 6,165 151,694 69,964 195,447 29.3 30.9 39.8 96 84,264 507,873 6,878 146,366 6,409 157,382 70,977 204,125 28.8 31.0 40.2 97 85,494 522,197 6,933 147,108 6,552 162,169 72,009 212,920 28.2 31.1 40.8 98 85,828 531,893 6,960 151,036 6,413 158,565 72,455 222,292 28.4 29.8 41.8 99 86,817 543,610 7,051 154,092 6,357 158,958 73,409 230,560 28.3 29.2 42.42000 87,546 558,054 7,009 155,429 6,342 161,186 74,195 241,439 27.9 28.9 43.3 01 87,939 574,551 6,984 156,068 6,476 168,000 74,479 250,483 27.2 29.2 43.6 02 89,010 585,583 7,294 155,176 6,487 169,954 75,229 260,453 26.5 29.0 44.5 03 89,899 605,218 7,317 159,958 6,500 173,071 76,082 272,190 26.4 28.6 45.0 04 89,960 633,321 7,262 166,062 6,690 181,444 76,008 285,815 26.2 28.6 45.12005 92,105 675,116 7,410 175,336 6,964 193,213 77,731 306,567 26.0 28.6 45.4 06 94,936 721,855 7,549 183,201 7,204 204,828 80,183 333,826 25.4 28.4 46.2 07 97,504 774,937 7,209 190,612 7,477 217,629 82,818 366,696 24.6 28.1 47.3 08 99,741 830,704 7,221 195,441 7,744 231,964 84,776 403,299 23.5 27.9 48.5 09 102,194 882,635 7,453 207,835 8,081 252,524 86,660 422,276 23.5 28.6 47.82010 103,392 957,982 7,587 213,903 8,938 294,007 86,867 450,073 22.3 30.7 47.0 11 104,305 1,043,082 7,476 227,645 9,801 343,198 87,028 472,238 21.8 32.9 45.3 12 105,004 1,081,205 7,477 234,647 10,133 366,083 87,394 480,475 21.7 33.9 44.4 13 106,833 1,122,649 7,779 238,484 10,498 388,415 88,556 495,751 21.2 34.6 44.2 14 109,627 1,166,847 7,885 240,323 10,958 406,844 90,784 519,681 20.6 34.9 44.5 15 111,806 1,211,223 7,910 243,627 11,161 416,300 92,735 551,296 20.1 34.4 45.5
(Note) 1. Data Source : IHS "Stastical tables" until 1991. "World Fleet Statistics" from 1992. 2. Ship Size Coverage : 100 Gross Tonnage and over. 3. Combined carriers are included in "Bulk Carrier" category. 4. Mid year basis until 1991. Year end basis from 1992.
- 11 -

(Note)1.Data Source : IHS "Stastical tables" until 1991. "World Fleet Statistics" from 1992. 2.Ship Size Coverage : 100 Gross Tonnage and over. 3.Combined carriers are included in "Bulk carrier" category.
0
100
200
300
400
500
600
90 91 92 93 94 95 96 97 98 99 00 01 02 03 04 05 06 07 08 09 10 11 12 13 14 15
Fig 6. WORLD MERCHANT FLEETS BY SHIP TYPE
Oil Tanker
Bulk carrier
Other ship types
Million GT
- 12 -

7. WORLD MERCHANT FLEETS' AGE PROFILE BY SHIP TYPE
Ship Age Total 0 ~ 4 years 5 ~ 9 years 10 ~ 14 years 15 ~ 19 years 20 ~ 24 years 25 years +
Ship Type No. '000 GT No. '000 GT No. '000 GT No. '000 GT No. '000 GT No. '000 GT No. '000 GT
Total 92,105 675,116 9,773 189,373 10,047 136,674 9,975 98,573 10,991 72,184 12,760 87,895 38,559 90,4162005 Oil Tanker 7,410 175,336 1,046 59,717 726 36,695 1,180 37,313 836 19,311 915 12,099 2,707 10,202
(Year End) Bulk Carrier 6,964 193,213 1,273 48,127 1,140 38,800 835 25,899 812 22,747 1,425 37,921 1,479 19,719 Others 77,731 306,567 7,454 81,529 8,181 61,178 7,960 35,362 9,343 30,126 10,420 37,876 34,373 60,496
Total 94,936 721,855 11,019 210,224 10,068 142,139 10,153 107,742 10,965 71,937 12,272 88,004 40,459 101,8102006 Oil Tanker 7,549 183,201 1,172 63,429 691 37,679 1,157 36,701 881 22,880 850 11,944 2,798 10,568
(Year End) Bulk Carrier 7,204 204,828 1,279 50,340 1,175 40,666 985 31,465 731 19,661 1,377 37,375 1,657 25,320 Others 80,183 333,827 8,568 96,455 8,202 63,794 8,011 39,576 9,353 29,396 10,045 38,685 36,004 65,922
Total 97,504 774,937 12,261 234,079 9,973 150,286 10,379 114,766 10,696 76,800 11,873 84,144 42,322 114,8612007 Oil Tanker 7,209 190,612 1,244 65,236 748 45,133 974 31,102 870 28,136 731 11,558 2,642 9,447
(Year End) Bulk Carrier 7,477 217,629 1,371 55,759 1,098 38,192 1,172 38,703 704 18,401 1,246 33,637 1,886 32,937 Others 82,818 366,696 9,646 113,084 8,127 66,961 8,233 44,961 9,122 30,263 9,896 38,949 37,794 72,477
Total 99,741 830,704 13,863 265,364 10,053 161,771 10,523 119,406 10,479 86,169 11,468 77,959 43,355 120,0352008 Oil Tanker 7,221 195,441 1,286 65,547 865 53,113 810 27,795 962 28,888 688 11,043 2,610 9,055
(Year End) Bulk Carrier 7,744 231,964 1,552 62,324 1,073 38,916 1,247 40,003 754 25,379 1,146 30,389 1,972 34,953 Others 84,776 403,299 11,025 137,493 8,115 69,742 8,466 51,609 8,763 31,903 9,634 36,526 38,773 76,027
Total 102,194 882,635 15,496 302,196 10,475 174,569 10,536 127,992 10,168 90,729 11,056 66,628 44,463 120,5222009 Oil Tanker 7,453 207,835 1,453 74,060 923 55,562 757 31,760 1,021 27,562 646 10,135 2,653 8,756
(Year End) Bulk Carrier 8,081 252,524 1,855 75,126 1,156 42,404 1,222 40,724 794 29,418 948 25,926 2,106 38,926 Others 86,660 422,276 12,188 153,010 8,396 76,602 8,557 55,507 8,353 33,749 9,462 30,567 39,704 72,839 Total 103,392 957,982 17,148 352,513 11,105 189,720 10,419 136,825 10,057 96,309 10,704 62,128 43,959 120,487
2010 Oil Tanker 7,587 213,903 1,589 78,493 1,048 59,197 730 36,247 1,058 25,938 617 6,943 2,545 7,086 (Year End) Bulk Carrier 8,938 294,007 2,562 106,488 1,299 47,933 1,144 38,952 894 33,432 829 25,279 2,210 41,922
Others 86,867 450,073 12,997 167,532 8,758 82,590 8,545 61,626 8,105 36,940 9,258 29,906 39,204 71,479 Total 104,305 1,043,082 15,766 359,392 12,997 234,598 10,281 150,348 10,437 113,670 10,386 66,014 44,438 119,060
2011 Oil Tanker 7,476 227,645 1,382 76,847 1,305 65,604 756 44,513 921 23,113 708 10,797 2,404 6,771 (Year End) Bulk Carrier 9,801 343,198 3,300 141,556 1,406 55,804 1,109 38,349 1,219 44,509 743 23,642 2,024 39,338
Others 87,028 472,238 11,084 140,989 10,286 113,191 8,416 67,486 8,297 46,048 8,935 31,575 40,010 72,950 Total 105,004 1,081,205 19,568 440,535 13,088 234,483 10,316 150,092 10,326 108,581 10,137 55,931 41,569 91,583
2012 Oil Tanker 7,477 234,647 1,684 90,810 1,320 66,079 760 44,381 890 20,650 665 7,650 2,158 5,076 (Year End) Bulk Carrier 10,133 366,083 4,336 186,121 1,405 55,704 1,106 38,232 1,190 42,719 663 19,035 1,433 24,271
Others 87,394 480,475 13,548 163,603 10,363 112,699 8,450 67,479 8,246 45,213 8,809 29,245 37,978 62,235 Total 106,833 1,122,649 19,220 443,325 14,851 266,271 10,390 161,379 10,334 109,612 9,827 59,227 42,211 82,837
2013 Oil Tanker 7,779 238,484 1,653 85,780 1,396 65,912 893 52,716 766 20,055 791 8,890 2,280 5,131 (Year End) Bulk Carrier 10,498 388,415 4,753 206,720 1,600 62,592 1,079 38,921 1,234 41,098 636 21,080 1,196 18,006
Others 88,556 495,751 12,814 150,826 11,855 137,766 8,418 69,742 8,334 48,459 8,400 29,258 38,735 59,700 Total 109,627 1,166,847 18,807 432,543 16,821 304,126 10,806 174,569 10,325 117,169 9,389 57,802 43,479 80,639
2014 Oil Tanker 7,885 240,323 1,445 71,013 1,564 74,126 965 56,005 720 26,060 827 7,644 2,364 5,475 (Year End) Bulk Carrier 10,958 406,844 4,905 211,703 1,974 75,925 1,160 42,389 1,186 38,989 632 22,388 1,101 15,450
Others 90,784 519,681 12,457 149,827 13,283 154,075 8,681 76,175 8,419 52,121 7,930 27,770 40,014 59,714 Total 111,806 1,211,223 18,146 403,428 18,521 354,488 11,507 189,718 10,297 124,606 9,234 59,492 44,101 79,491
2015 Oil Tanker 7,910 243,627 1,262 58,126 1,645 79,351 1,085 59,714 704 32,672 854 8,277 2,360 5,488 (Year End) Bulk Carrier 11,161 416,300 4,520 194,740 2,683 106,894 1,300 47,799 1,027 32,328 640 21,881 991 12,658
Others 92,735 551,296 12,364 150,562 14,193 168,243 9,122 82,206 8,566 59,605 7,740 29,335 40,750 61,345(Note) 1. Data Source : IHS "World Fleet Statistics". 2. Ship Size Coverage : 100 Gross Tonnage and over. 3. Combined carriers are included in "Bulk Carrier" category.
- 13 -

(Note) 1.Data Source : IHS "World Fleet Statistics" 2.Ship Size Coverage : 100 Gross Tonnage and over.
58.1
79.4
59.7
32.7
8.3 5.5
194.7
106.9
47.832.3
21.912.7
150.6168.2
82.2
59.6
29.3
61.3
403.4
354.5
189.7
124.6
59.5
79.5
0
50
100
150
200
250
300
350
400
450
0-4 5-9 10-14 15-19 20-24 25+
Fig 7. WORLD MERCHANT FLEETS' AGE PROFILE BY SHIP TYPE
Oil Tanker
Bulker (Inc. Combi)
Other ship type
Total Fleet
Million GT
Ship Age
< As of End 2015 >
- 14 -

8. WORLD "TOTAL LOSSES" AND "DISPOSALS" TOTAL LOSSES (by Incidents) DISPOSALS (Scrap) TOTAL (Total losses + Disposals)
Year No. '000 GT Loss Ratio % No. '000 GT Disposal Ratio % No. '000 GT1970 352 613 0.27 1,030 4,311 1.90 1,382 4,9241975 336 995 0.29 626 5,077 1.48 962 6,072 76 345 1,156 0.31 734 6,615 1.78 1,079 7,771 77 336 1,073 0.27 914 6,093 1.55 1,250 7,166 78 473 1,711 0.42 1,078 10,070 2.48 1,551 11,781 79 465 2,210 0.54 923 6,665 1.61 1,388 8,8751980 387 1,804 0.43 903 6,022 1.43 1,290 7,826 81 359 1,238 0.29 762 7,252 1.72 1,121 8,490 82 402 1,632 0.38 1,113 13,624 3.21 1,515 15,256 83 340 1,473 0.35 1,310 16,759 3.97 1,650 18,232 84 327 2,354 0.56 1,785 17,751 4.24 2,112 20,1051985 307 1,651 0.40 2,360 22,229 5.34 2,667 23,880 86 265 2,609 0.64 1,888 20,288 5.01 2,153 22,897 87 219 1,284 0.32 1,474 12,009 2.98 1,693 13,293 88 231 865 0.21 1,452 5,015 1.24 1,683 5,880 89 211 667 0.16 695 2,477 0.60 906 3,1441990 244 1,412 0.33 468 1,645 0.39 712 3,057 91 321 1,937 0.44 587 2,306 0.53 908 4,243 92 266 1,453 0.33 601 6,657 1.50 867 8,110 93 278 968 0.21 878 10,310 2.25 1,156 11,278 94 240 1,920 0.40 945 12,293 2.58 1,185 14,2131995 252 1,000 0.20 874 9,435 1.92 1,126 10,435 96 257 1,190 0.23 917 10,822 2.13 1,174 12,012 97 215 1,288 0.25 888 9,839 1.88 1,103 11,127 98 263 1,158 0.22 969 13,737 2.58 1,232 14,895 99 222 1,294 0.24 1,045 18,161 3.34 1,267 19,4542000 216 1,204 0.22 827 13,552 2.43 1,043 14,755 01 187 1,096 0.19 887 15,483 2.69 1,074 16,579 02 149 773 0.13 927 17,831 3.05 1,076 18,604 03 166 576 0.10 1,062 16,360 2.70 1,228 16,936 04 136 463 0.07 817 7,469 1.18 953 7,9322005 162 479 0.07 562 4,107 0.61 724 4,586 06 173 797 0.11 708 5,047 0.70 881 5,843 07 208 705 0.09 624 4,290 0.55 832 4,995 08 187 550 0.07 827 8,368 1.01 1,014 8,919 09 231 1,232 0.14 1,581 25,533 2.89 1,812 26,7652010 218 1,100 0.11 1,460 19,427 2.03 1,678 20,527 11 182 1,184 0.11 1,688 25,566 2.45 1,870 26,751 12 170 863 0.08 1,751 37,389 3.46 1,921 38,252 13 167 913 0.08 1,554 30,057 2.78 1,721 30,970 14 95 356 0.03 1,237 22,765 2.03 1,332 23,121
(Note) 1. Data Source : IHS "Casualty Return" until 1989. "World Casualty Statistics" from 1990. 2. Ship Size Coverage : 100 Gross Tonnage and over. 3. Loss (Disposal) Ratio = Lost (Disposed) Fleet / World Total Existing Fleet at mid year (end year from 1992).
- 15 -

(Note) 1.Data source : IHS IHS "World Casualty Statistics". 2.Ship Size Coverage : 100 Gross Tonnage and over.
3.14.2
8.1
11.3
14.2
10.4
12.011.1
14.9
19.5
14.8
16.6
18.6
16.9
7.9
4.65.8
5.0
8.9
26.8
20.5
26.8
38.3
31.0
23.1
0
5
10
15
20
25
30
35
40
45
90 91 92 93 94 95 96 97 98 99 00 01 02 03 04 05 06 07 08 09 10 11 12 13 14
Fig 8. WORLD "TOTAL LOSSES" AND "DISPOSALS"Million GT
Indicated figures are combined volume of Total Losses and Disposals.
Disposals
Total Losses
- 16 -

9. WORLD DISPOSALS BY COUNTRY OF BREAKING
Year
Country No. '000GT No. '000GT No. '000GT No. '000GT No. '000GT No. '000GT No. '000GT No. '000GT No. '000GT No. '000GT No. '000GT No. '000GT No. '000GT No. '000GT No. '000GT No. '000GT
Taiwan 204 7,815 279 6,687 171 7,822 287 7,773 210 4,415 131 1,521 21 164 1 2 4 48 4 83 1 6
Spain 51 421 78 573 87 603 78 581 67 150 47 193 28 31 24 13 26 13 76 48 47 42 21 33 61 40 51 48 19 19 23 33
S. Korea 69 3,896 90 4,149 56 2,551 72 2,569 61 1,254 15 116 8 158 2 4 1 8 3 2 1 5 1 3 2 4
Pakistan 126 1,689 168 1,121 144 1,143 132 861 144 645 76 209 20 39 2 2 21 445 32 729 33 917 34 2,166 25 1,670 33 2,062 21 930 57 2,210
Italy 39 306 42 138 48 198 68 311 25 117 33 134 14 22 10 7 5 8 7 11 8 9 6 5 2 1 1 1 1 0
Croatia 16 106 18 78 26 130 29 97 9 22 9 9 16 15 4 1 4 4 4 1 1 0
Japan 445 505 463 913 487 973 449 770 425 608 470 175 152 45 350 81 340 81 337 82 196 57 73 20 116 146 91 25 124 30 64 19
China 10 132 163 2,114 282 5,019 242 4,567 102 1,887 33 556 37 477 10 81 7 172 54 2,213 159 5,786 115 2,848 53 754 28 104 32 99 30 550
India 61 524 60 459 135 1,303 68 636 137 1,684 60 462 66 678 112 1,092 63 696 146 1,925 142 1,911 186 2,802 189 2,810 315 4,920 363 4,948 370 6,256
Bangladesh 42 391 59 641 61 818 26 268 33 318 55 479 30 347 21 217 40 512 45 1,181 44 1,396 59 2,134 53 2,539 55 2,196 74 2,228 63 2,626
Turkey 1 4 8 50 26 383 27 418 19 134 66 338 39 151 26 102 29 77 24 79 23 82 33 97 47 208 48 137 41 195 27 182
Others 246 970 357 828 837 1,287 410 1,437 242 774 457 823 264 350 153 213 74 49 119 72 175 468 110 320 122 352 87 171 57 258 114 403
World Total 1,310 16,759 1,785 17,751 2,360 22,229 1,888 20,288 1,474 12,009 1,452 5,015 695 2,477 468 1,645 587 2,306 601 6,657 878 10,310 945 12,293 874 9,435 917 10,822 888 9,839 969 13,737
Year
Country No. '000GT No. '000GT No. '000GT No. '000GT No. '000GT No. '000GT No. '000GT No. '000GT No. '000GT No. '000GT No. '000GT No. '000GT No. '000GT No. '000GT No. '000GT No. '000GT
Taiwan 3 10 1 14 0 1 12 1 1
Spain 22 48 21 26 10 9 20 27 14 33 9 13 6 5 2 1 2 1 12 6 18 14 28 12 11 8 12 17 4 7 12 5
S. Korea 2 7 1 1 5 2 3 6 1 0 1 1 6 11 7 11
Pakistan 43 2,380 25 789 27 1,739 20 997 49 817 26 209 12 48 19 187 24 380 25 274 101 2,101 103 2,443 106 3,014 121 5,499 103 5,376 106 4,093
Italy 2 2 2 7 4 2 7 7 2 1 1 0 1 1 1 1 1 0
Croatia 1 0 2 1 3 2 3 1 2 1 3 0 2 0 1 0 3 1 6 3 3 1 3 0
Japan 103 31 94 22 47 12 102 25 46 46 12 6 1 1 1 0 2 1 1 46 34 13 33 8
China 68 2,564 78 2,637 70 2,510 70 3,139 119 5,582 70 1,538 8 151 9 254 26 341 38 928 301 7,738 187 4,723 263 5,969 335 8,168 343 7,084 215 4,976
India 371 6,803 340 5,987 347 4,768 326 6,751 383 5,886 206 1,620 128 1,123 102 853 134 1,332 198 2,458 425 7,561 422 6,534 461 8,505 497 12,210 363 8,087 317 6,795
Bangladesh 68 3,799 62 2,407 137 4,992 87 4,894 79 2,890 123 3,357 81 2,114 159 2,883 104 1,838 170 4,176 196 6,609 107 3,927 144 5,837 224 8,838 197 7,305 214 5,519
Turkey 31 226 52 295 41 165 73 385 77 280 100 200 54 138 63 148 43 118 56 141 117 557 210 658 306 1,067 247 1,541 214 1,370 169 978
Others 86 314 101 976 45 93 106 156 187 383 135 247 131 192 182 265 93 142 205 296 134 377 172 329 232 616 212 544 286 790 159 379
World Total 1,045 18,161 827 13,552 887 15,483 927 17,831 1,062 16,360 817 7,469 562 4,107 708 5,047 624 4,290 827 8,368 1,581 25,533 1,460 19,427 1,688 25,566 1,751 37,389 1,554 30,057 1,237 22,765
(Note) 1.Data Source : IHS "Casualty Return" until 1993. "World Casualty Statistics" from 1994. Only the figures of "World Total" in this table in 1990 - 2014 were revised by latest Casualty Statistics.
There have some divergences between the accumulated world totals by country of breaking and this table's figures of "World Total" which are equivalent to Table 8 "DISPOSALS" due to above reason.
2.Ship Size Coverage : 100 Gross Tonnage and over.
2004 2005 2008 2014
1992 19971993 1994 1995 1996
2009 2010 2013
1998
20122011
1987 1988 1989
2007
1983 1984 1985 1986
1999 2000
1990 1991
20062001 2002 2003
- 17 -

(Note) 1.Data Source : IHS "Casualty Return" until 1993. "World Casualty Statistics" from 1994. 2.Ship Size Coverage : 100 Gross Tonnage and over.
0
5
10
15
20
25
30
35
40
90 91 92 93 94 95 96 97 98 99 00 01 02 03 04 05 06 07 08 09 10 11 12 13 14
Fig 9. WORLD DISPOSALS BY COUNTRY OF BREAKINGMillion GT
Pakistan
China
India
Bangladesh
Turkey
Others
- 18 -

Year End Total Fleet Laid up Laid up Ratio Total Fleet Laid up Laid up RatioMillion DWT Million DWT % Million DWT Million DWT %
1980 328.1 7.3 2.2 144.5 2.2 1.51981 322.5 25.9 8.0 158.5 3.0 1.91982 302.2 60.8 20.1 172.4 26.0 15.11983 283.4 60.8 21.5 181.5 22.9 12.61984 267.0 56.9 21.3 192.4 13.5 7.01985 244.1 50.5 20.7 197.4 11.1 5.61986 240.5 33.4 13.9 196.8 8.9 4.51987 239.2 14.9 6.2 196.1 4.8 2.41988 243.7 10.0 4.1 197.9 2.3 1.21989 251.4 4.0 1.6 203.7 1.7 0.81990 257.5 3.1 1.2 211.4 1.7 0.81991 265.2 3.1 1.2 214.8 2.4 1.11992 269.6 2.8 1.0 215.0 3.0 1.41993 275.0 8.4 3.1 219.5 3.2 1.51994 271.4 5.6 2.1 228.1 3.2 1.41995 271.2 4.1 1.5 243.7 2.8 1.11996 275.4 3.7 1.3 253.8 2.6 1.01997 278.1 2.8 1.0 264.8 2.4 0.91998 282.6 2.5 0.9 264.0 4.1 1.61999 285.6 2.1 0.7 267.0 4.1 1.52000 292.4 2.3 0.8 274.7 2.8 1.02001 287.5 1.5 0.5 286.8 2.0 0.72002 292.3 1.5 0.5 294.5 2.0 0.72003 301.1 1.8 0.6 301.7 1.4 0.52004 317.7 0.5 0.2 322.2 0.8 0.22005 340.8 0.2 0.1 345.1 0.8 0.22006 360.1 0.2 0.1 368.2 0.6 0.22007 381.8 0.2 0.1 392.7 0.7 0.22008 401.2 0.2 0.0 419.1 0.6 0.12009 431.1 0.2 0.0 461.4 0.6 0.12010 447.2 2.6 0.6 539.9 0.1 0.02011 473.1 4.0 0.8 620.3 0.3 0.02012 492.2 4.8 1.0 686.0 1.2 0.22013 500.9 2.9 0.6 725.4 0.6 0.12014 508.2 7.9 1.6 757.2 2.3 0.32015 524.6 5.7 1.1 776.1 1.1 0.1
(Note) 1. Data Source : Clarkson "Shipping Review & Outlook"and "Shipping Intelligence Weekly".2. Ship Size Coverage : 10,000 Dead Weight Tonnage and over.
10. WORLD LAID UP VESSELS
Tanker Bulkcarrier
- 19 -

(Note) 1. Data Source : Clarkson "Shipping Review and Outlook" etc. 2.Ship Size Coverage : 10,000 Dead Weight Tonnage and over. 3.Year end basis.
4.8
5.5 5.8
11.6
8.8
6.9
6.3
5.2
6.6 6.2
5.1
3.5 3.5 3.2
1.3 1.0
0.8 0.9 0.8 0.8
2.7
4.3
6.0
3.5
10.2
6.8
0
2
4
6
8
10
12
14
90 91 92 93 94 95 96 97 98 99 00 01 02 03 04 05 06 07 08 09 10 11 12 13 14 15
Fig 10. WORLD LAID UP VESSELSMillion DWT
Bulk Carrier
Tanker
Indicated figures are combined volume of Tanker and Bulk Carrier.
- 20 -

(1) TONNES : million tonnes (2) TONNE-MILES : estimated billion tonne miles
IronOre
Coal GrainCont-ainer
OtherDry
TotalDry
CrudeOil
OilProducts
TotalOil
LPG LNG ChemicalsGrandTotal
IronOre
Coal GrainCont-ainer
OtherDry
TotalDry
CrudeOil
OilProducts
TotalOil
LPG LNG ChemicalsGrandTotal
1986 311 270 187 167 1,208 2,143 1,030 387 1,417 26 41 89 3,716
1987 319 273 211 185 1,225 2,213 977 366 1,343 28 44 96 3,723
1988 357 297 217 204 1,260 2,335 972 402 1,373 26 49 99 3,882
1989 378 306 219 224 1,292 2,419 1,066 463 1,530 30 52 99 4,130
1990 360 331 216 237 1,433 2,577 1,133 432 1,565 32 58 101 4,334
1991 366 351 217 259 1,447 2,640 1,217 390 1,607 34 58 103 4,443
1992 345 357 224 283 1,480 2,689 1,339 396 1,736 37 60 102 4,624
1993 361 358 222 311 1,511 2,763 1,326 430 1,755 39 62 112 4,731
1994 387 371 203 345 1,574 2,880 1,402 427 1,829 38 66 122 4,935
1995 408 402 213 376 1,655 3,054 1,455 449 1,904 39 68 128 5,193
1996 395 421 218 416 1,739 3,189 1,488 492 1,980 41 74 132 5,416
1997 429 447 228 454 1,828 3,386 1,584 488 2,072 42 83 135 5,718
1998 426 450 227 487 1,829 3,419 1,537 477 2,014 40 85 139 5,696
1999 402 458 245 542 1,814 3,461 1,591 509 2,099 43 93 150 5,845
2000 450 508 261 607 1,892 3,718 1,677 572 2,249 45 104 154 6,269 2,446 2,519 1,551 3,170 10,377 20,063 8,056 1,575 9,631 256 321 538 30,807
2001 452 546 264 628 1,898 3,788 1,667 552 2,218 42 107 157 6,312 2,533 2,606 1,667 3,271 10,375 20,452 7,799 1,554 9,352 243 348 548 30,944
2002 480 558 269 692 1,978 3,977 1,634 568 2,202 44 113 166 6,502 2,685 2,629 1,640 3,599 10,542 21,095 7,401 1,595 8,996 246 365 580 31,282
2003 516 600 272 802 1,979 4,169 1,760 601 2,360 47 125 170 6,871 2,875 2,813 1,778 4,215 10,660 22,341 8,023 1,712 9,735 260 403 594 33,332
2004 593 643 273 911 2,033 4,453 1,848 663 2,511 51 132 175 7,322 3,301 2,971 1,814 4,785 11,170 24,041 8,529 1,904 10,434 278 440 613 35,807
2005 662 673 274 1,002 2,062 4,673 1,878 726 2,605 52 142 183 7,654 3,715 3,088 1,844 5,272 11,245 25,164 8,606 2,169 10,775 279 457 641 37,316
2006 713 710 292 1,091 2,137 4,943 1,891 785 2,676 52 160 193 8,024 4,080 3,248 1,929 5,761 11,820 26,838 8,818 2,265 11,083 284 549 679 39,433
2007 777 768 306 1,215 2,157 5,223 1,912 816 2,728 56 171 204 8,382 4,520 3,410 2,061 6,425 11,702 28,118 8,725 2,339 11,063 282 631 716 40,810
2008 841 793 319 1,271 2,188 5,412 1,902 842 2,744 55 173 209 8,593 4,827 3,526 2,158 6,737 11,793 29,041 8,840 2,416 11,256 273 684 728 41,981
2009 898 807 321 1,133 2,002 5,161 1,815 849 2,664 54 183 216 8,277 5,365 3,441 2,221 6,032 10,701 27,760 8,121 2,549 10,669 268 689 760 40,147
2010 991 930 343 1,291 2,215 5,770 1,868 907 2,774 55 221 230 9,051 5,854 4,045 2,460 6,836 11,973 31,168 8,612 2,680 11,292 271 876 817 44,424
2011 1,053 1,000 345 1,412 2,317 6,127 1,851 934 2,785 59 247 242 9,460 6,337 4,318 2,404 7,472 12,467 32,998 8,713 2,768 11,481 285 1,059 866 46,689
2012 1,110 1,123 375 1,464 2,391 6,463 1,901 942 2,843 61 243 251 9,861 6,720 4,852 2,594 7,675 12,911 34,752 9,142 2,801 11,942 300 1,046 888 48,928
2013 1,189 1,179 390 1,544 2,516 6,818 1,832 978 2,810 63 244 261 10,196 6,896 5,030 2,776 8,083 13,589 36,374 8,925 2,872 11,797 313 1,034 912 50,431
2014 (e) 1,337 1,212 432 1,631 2,538 7,150 1,799 994 2,793 71 248 264 10,527 7,528 5,216 3,002 8,520 14,031 38,297 8,874 2,931 11,805 355 1,036 907 52,400
2015 (f) 1,371 1,176 438 1,715 2,596 7,296 1,862 1,041 2,903 77 252 272 10,801 7,678 5,080 3,099 8,897 14,306 39,060 9,196 3,077 12,274 374 1,066 925 53,698
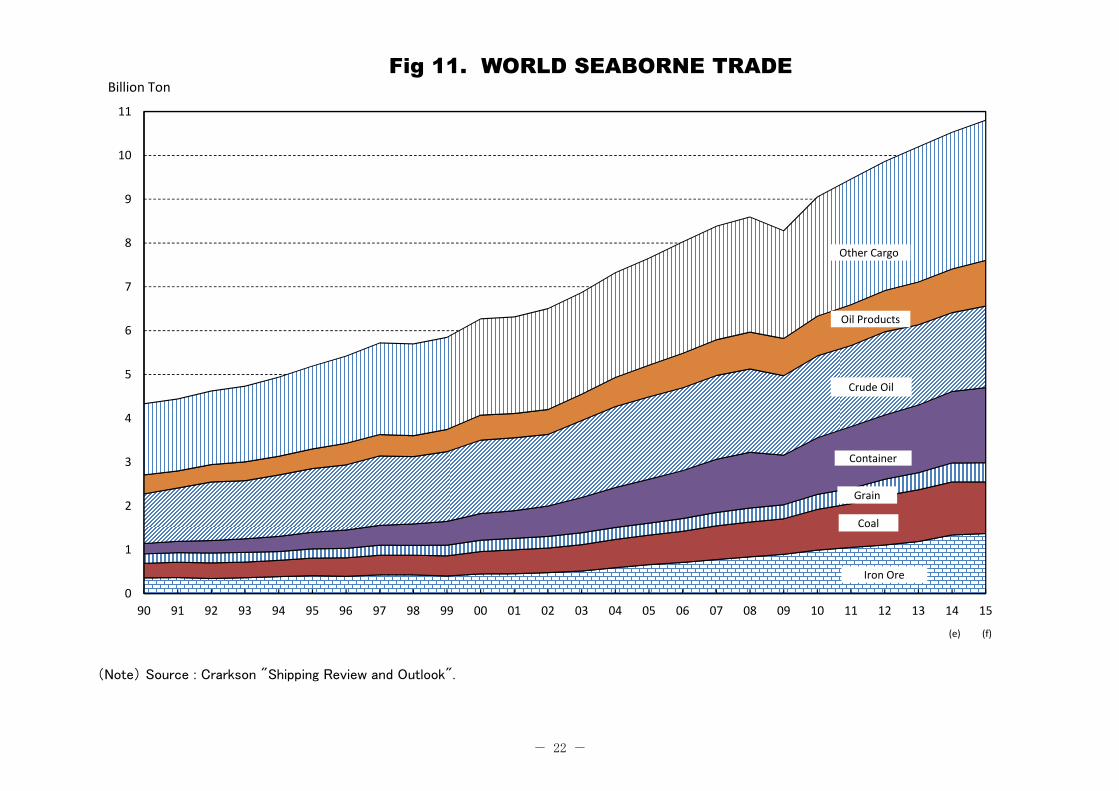
(Note) Source : Crarkson "Shipping Review & Outlook".
11. WORLD SEABORNE TRADE
Year
- 21 -
(Note) Source : Crarkson "Shipping Review and Outlook".
0
1
2
3
4
5
6
7
8
9
10
11
90 91 92 93 94 95 96 97 98 99 00 01 02 03 04 05 06 07 08 09 10 11 12 13 14 15
Fig 11. WORLD SEABORNE TRADEBillion Ton
(e) (f)
Iron Ore
Coal
Grain
Container
Crude Oil
Oil Products
Other Cargo
- 22 -

12. NEWBUILDING/REPAIR SALES (SAJ Members Only)
( Unit : 100 Million Yen )
Fiscal year Newbuilding share(%) Repair share(%) Total No. of company Fiscal year Newbuilding share(%) Repair share(%) Total No. of company
1975 16,453 89.5 1,920 10.5 18,373 23 1995 10,378 87.3 1,515 12.7 11,893 18
1976 18,374 90.7 1,890 9.3 20,264 23 1996 11,453 88.6 1,480 11.4 12,933 18
1977 17,989 89.5 2,103 10.5 20,092 23 1997 12,247 88.6 1,577 11.4 13,824 18
1978 9,906 84.2 1,856 15.8 11,762 23 1998 13,141 90.4 1,397 9.6 14,538 18
1979 8,877 81.2 2,052 18.8 10,929 23 1999 11,768 90.4 1,249 9.6 13,017 18
1980 10,750 76.0 3,395 24.0 14,145 23 2000 11,820 90.3 1,276 9.7 13,096 18
1981 14,514 79.5 3,740 20.5 18,254 23 2001 12,240 91.1 1,201 8.9 13,441 18
1982 13,412 82.0 2,941 18.0 16,353 23 2002 12,128 91.3 1,157 8.7 13,285 21
1983 14,820 86.1 2,385 13.9 17,205 23 2003 12,202 91.8 1,094 8.2 13,296 19
1984 15,249 86.7 2,347 13.3 17,596 23 2004 13,122 92.8 1,024 7.2 14,146 19
1985 12,067 84.5 2,206 15.5 14,273 23 2005 13,891 91.9 1,227 8.1 15,118 20
1986 9,800 84.9 1,737 15.1 11,537 18 2006 15,485 93.1 1,140 6.9 16,625 20
1987 5,448 76.7 1,658 23.3 7,106 18 2007 20,072 93.6 1,378 6.4 21,449 20
1988 5,086 76.7 1,542 23.3 6,628 18 2008 21,974 94.5 1,289 5.5 23,264 20
1989 7,279 80.2 1,796 19.8 9,075 18 2009 25,529 95.9 1,079 4.1 26,608 20
1990 8,665 82.7 1,817 17.3 10,482 18 2010 22,604 95.4 1,090 4.6 23,695 19
1991 8,990 82.1 1,961 17.9 10,951 18 2011 22,151 95.4 1,070 4.6 23,221 19
1992 11,780 88.3 1,567 11.7 13,347 18 2012 18,626 94.3 1,133 5.7 19,759 18
1993 12,288 88.9 1,529 11.1 13,817 18 2013 15,009 92.8 1,158 7.2 16,167 17
1994 11,789 88.6 1,518 11.4 13,307 18 2014 15,110 93.3 1,090 6.7 16,200 17
- 23 -

10.511.0
13.313.8
13.3
11.9
12.9
13.814.5
13.0 13.113.4 13.3 13.3
14.1
15.1
16.6
21.4
23.3
26.6
23.723.2
19.8
16.2 16.2
0
5
10
15
20
25
30
90 91 92 93 94 95 96 97 98 99 00 01 02 03 04 05 06 07 08 09 10 11 12 13 14
Fig 12.NEWBUILDING/REPAIR SALES (SAJ Members Only)100 Billion Yen
Newbuilding
Repair
Total figures are indicated.
Fiscal year
- 24 -

13. ORDINARY STEEL CONSUMPTION BY SHIPBUILDING INDUSTRY
Year79 80 81 82 83 84 85 86 87 88 89 90 91 92 93 94 95 96 97
Steel type
Plates 1,828,327 2,397,987 2,444,153 1,801,536 2,017,055 2,255,608 2,094,004 1,293,794 1,039,215 1,098,946 1,271,433 1,494,663 1,552,328 1,785,552 1,700,449 1,938,704 2,045,016 2,110,196 2,139,071
Shapes 227,958 298,407 301,588 228,451 256,014 275,769 243,796 150,972 119,794 133,888 155,351 184,962 195,517 223,333 203,587 238,572 247,857 254,153 260,732
Pipes 84,045 107,572 113,963 79,099 94,844 101,547 88,345 51,648 40,806 42,703 54,623 62,620 62,958 61,653 52,533 59,169 63,716 67,543 73,144
Bars 30,254 37,313 42,479 33,225 32,857 34,007 36,539 30,484 25,467 30,649 42,783 50,948 48,860 55,507 57,142 63,728 64,237 72,428 84,429
Others 2,332 1,916 1,650 1,525 2,793 2,783 2,833 2,493 2,422 2,787 2,322 2,120 1,648 2,090 1,497 2,038 2,200 1,621 1,562
Total 2,172,916 2,843,195 2,903,833 2,143,836 2,403,563 2,669,714 2,465,517 1,529,391 1,227,704 1,308,973 1,526,512 1,795,313 1,861,311 2,128,135 2,015,208 2,302,211 2,423,026 2,505,941 2,558,938
Year98 99 00 01 02 03 04 05 06 07 08 09 10 11 12 13 14 15 16
Steel type (estimation) (estimation)
Plates 2,256,065 2,122,552 2,212,440 2,405,927 2,433,287 2,631,493 2,990,107 3,506,815 3,405,778 3,541,567 3,896,154 3,832,844 3,889,481 3,671,105 3,004,009 2,794,875 2,940,493 2,895,047 3,023,850
Shapes 251,859 226,351 226,704 232,807 231,137 255,759 306,077 326,354 339,370 392,009 439,446 367,128 361,087 326,237 250,927 227,019 286,896 288,054 301,301
Pipes 73,594 66,883 62,438 76,786 85,842 78,853 87,857 98,606 104,144 123,032 119,301 113,188 101,462 91,933 68,774 70,797 73,330 75,566 78,790
Bars 106,160 102,238 108,458 130,070 148,581 139,794 158,220 182,227 158,556 154,897 144,729 136,022 127,160 125,343 116,422 114,802 74,176 81,970 88,638
Others 1,137 1,446 1,980 4,079 2,462 2,679 2,179 4,387 7,352 29,433 27,959 19,086 10,308 5,305 5,328 3,353 15,570 12,040 12,409
Total 2,688,815 2,519,470 2,612,020 2,849,669 2,901,309 3,108,578 3,544,440 4,118,389 4,015,200 4,240,938 4,627,589 4,468,268 4,489,498 4,219,923 3,445,460 3,210,846 3,390,465 3,352,677 3,504,988
(Note) 1. Data Source : SAJ members only. Uses are limited to shipbuilding and offshore structures. 2. Fiscal Year Basis : from 1st April to 31st March. 3. From 2006, Purchasing basis.
( Unit : Ton )
- 25 -
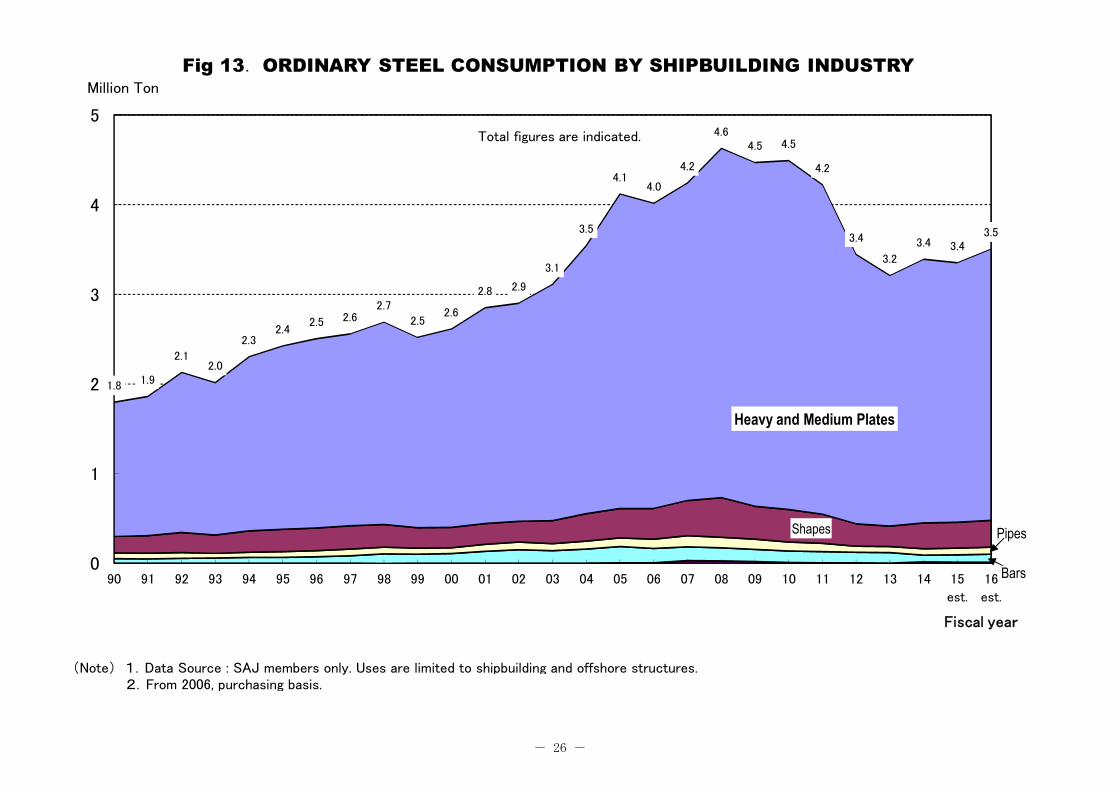
(Note) 1.Data Source : SAJ members only. Uses are limited to shipbuilding and offshore structures. 2.From 2006, purchasing basis.
1.8 1.9
2.12.0
2.32.4
2.5 2.62.7
2.52.6
2.8 2.9
3.1
3.5
4.14.0
4.2
4.64.5 4.5
4.2
3.4
3.2
3.4 3.43.5
0
1
2
3
4
5
90 91 92 93 94 95 96 97 98 99 00 01 02 03 04 05 06 07 08 09 10 11 12 13 14 15
est.
16
est.
Fig 13. ORDINARY STEEL CONSUMPTION BY SHIPBUILDING INDUSTRYMillion Ton
Total figures are indicated.
Heavy and Medium Plates
Shapes Pipes
Bars
Fiscal year
- 26 -

14. REPAIR / CONVERSION TURNOVER
Flag Types of work No. Turnover No. Turnover No. Turnover No. Turnover No. Turnover No. Turnover No. Turnover No. Turnover No. Turnover No. Turnover No. Turnover No. Turnover No. Turnover No. Turnover No. Turnover No. Turnover No. Turnover
\100 Mill \100 Mill \100 Mill \100 Mill \100 Mill \100 Mill \100 Mill \100 Mill \100 Mill \100 Mill \100 Mill \100 Mill \100 Mill \100 Mill \100 Mill \100 Mill \100 Mill
Docking work 2,632 1,174 2,844 1,124 2,769 1,054 2,588 936 2,722 985 2,629 1,013 2,488 959 2,297 851 2,279 987 2,007 1,166 2,090 1,295 1,989 1,077 1,928 1,021 1,971 1,121 1,970 1,107 1,908 1,082 1,737 1,003
Damaged repair 127 107 159 38 141 42 132 22 143 40 158 35 174 48 135 44 111 37 135 71 147 112 110 70 84 20 75 28 60 24 80 37 63 21
Conversion 38 242 33 224 34 73 26 154 36 157 46 183 49 100 35 68 25 113 13 18 8 16 25 48 29 47 13 10 12 17 17 24 21 48
Running/Afloat repair 482 22 562 25 509 21 630 66 836 38 963 50 1,195 54 952 61 859 58 792 51 850 73 785 74 751 77 740 57 758 60 643 56 575 43
Japanese Flag vessels Total 3,279 1,545 3,598 1,410 3,453 1,190 3,376 1,178 3,737 1,220 3,796 1,281 3,906 1,160 3,419 1,024 3,274 1,195 2,947 1,307 3,095 1,496 2,909 1,269 2,792 1,164 2,799 1,215 2,800 1,207 2,648 1,199 2,396 1,115
Docking work 925 739 745 488 733 397 679 335 621 318 454 237 397 180 424 210 420 231 339 255 401 298 316 237 263 192 262 149 166 106 161 119 192 155
Damaged repair 44 109 72 90 42 48 74 74 61 41 36 20 43 28 44 18 28 20 42 34 47 48 42 28 38 22 23 13 28 12 25 10 17 4
Conversion 48 798 20 275 20 353 35 409 35 392 5 54 16 79 11 106 4 17 7 73 0 0 2 3 5 52 3 13 2 5 6 22 3 17
Running/Afloat repair 508 53 452 42 475 50 397 64 385 47 281 40 219 21 228 34 128 20 123 44 130 27 128 20 137 25 138 30 81 28 67 20 55 9
Foreign Flag vessels Total 1,525 1,699 1,289 895 1,270 848 1,185 881 1,102 798 776 351 675 308 707 368 580 289 511 406 578 373 488 287 443 290 426 205 277 151 259 172 267 184
Docking work 3,557 1,913 3,589 1,612 3,502 1,450 3,267 1,271 3,343 1,303 3,083 1,250 2,885 1,139 2,721 1,061 2,699 1,218 2,346 1,422 2,491 1,594 2,305 1,314 2,191 1,212 2,233 1,270 2,136 1,213 2,069 1,201 1,929 1,158
Damaged repair 171 216 231 128 183 90 206 96 204 82 194 55 217 76 179 62 139 58 177 105 194 160 152 98 122 41 98 41 88 36 105 47 80 26
Conversion 86 1,040 53 499 54 425 61 563 71 549 51 238 65 179 46 174 29 130 20 91 8 16 27 50 34 99 16 23 14 22 23 47 24 65
Running/Afloat repair 990 75 1,014 67 984 72 1,027 130 1,221 85 1,244 90 1,414 75 1,180 95 987 79 915 95 980 100 913 94 888 102 878 86 839 88 710 76 630 52
Grand Total 4,804 3,244 4,887 2,306 4,723 2,038 4,561 2,059 4,839 2,018 4,572 1,632 4,581 1,468 4,126 1,391 3,854 1,484 3,458 1,713 3,673 1,869 3,397 1,556 3,235 1,454 3,225 1,420 3,077 1,358 2,907 1,371 2,663 1,300
No.of surveyed company
Flag Types of work No. Turnover No. Turnover No. Turnover No. Turnover No. Turnover No. Turnover No. Turnover No. Turnover No. Turnover No. Turnover No. Turnover No. Turnover No. Turnover No. Turnover No. Turnover No. Turnover No. Turnover
\100 Mill \100 Mill \100 Mill \100 Mill \100 Mill \100 Mill \100 Mill \100 Mill \100 Mill \100 Mill \100 Mill \100 Mill \100 Mill \100 Mill \100 Mill \100 Mill \100 Mill
Docking work 1,582 950 1,404 897 1,142 931 1,194 813 1,093 748 1,041 753 1,111 692 1,084 837 946 751 1,006 911 997 912 868 859 933 795 800 892 777 851 836 801 808 830
Damaged repair 53 20 47 24 37 13 31 10 31 12 7 1 26 12 23 13 23 20 13 2 9 3 20 4 19 4 16 12 13 6 11 3 13 8
Conversion 23 34 14 12 17 25 11 22 17 28 8 19 11 8 10 31 9 20 7 21 12 26 5 58 5 16 16 15 7 13 1 0 6 19
Running/Afloat repair 441 59 406 68 309 45 294 31 231 31 217 39 237 29 392 52 366 63 341 46 240 49 203 33 225 39 228 50 274 43 270 48 326 49
Japanese Flag vessels Total 2,099 1,063 1,871 1,001 1,505 1,014 1,530 876 1,372 820 1,273 811 1,385 741 1,509 933 1,344 854 1,367 981 1,258 990 1,096 954 1,182 854 1,060 969 1,071 913 1,118 851 1,153 906
Docking work 115 121 131 114 85 79 78 104 95 142 107 121 142 118 128 128 104 81 135 109 93 101 77 61 75 53 76 35 78 45 98 45 62 21
Damaged repair 5 3 7 5 5 4 12 5 6 1 4 2 6 2 4 0 6 17 1 0 7 8 2 0 1 1 6 12 3 2 2 2 0 0
Conversion 3 18 3 15 0 0 1 2 3 5 1 3 2 4 1 4 2 2 2 5 0 0 0 0 0 0 3 8 1 1 1 1 1 0
Running/Afloat repair 53 13 30 12 36 12 39 10 49 16 18 12 67 12 43 19 31 8 23 11 17 7 19 8 24 8 39 6 31 30 17 7 18 14
Foreign Flag vessels Total 176 155 171 146 126 95 130 121 153 164 130 139 217 136 176 151 143 108 161 124 117 116 98 69 100 62 124 60 113 78 118 55 81 35
Docking work 1,697 1,071 1,535 1,011 1,227 1,010 1,272 917 1,188 890 1,148 874 1,253 809 1,212 965 1,050 832 1,141 1,020 1,090 1,013 945 921 1,008 848 876 927 855 896 934 846 870 851
Damaged repair 58 23 54 29 42 17 43 15 37 13 11 3 32 14 27 14 29 37 14 2 16 11 22 5 20 5 22 23 16 8 13 5 13 8
Conversion 26 52 17 27 17 25 12 24 20 33 9 22 13 13 11 34 11 22 9 26 12 26 5 58 5 16 19 23 8 14 2 1 7 19
Running/Afloat repair 494 72 436 80 345 57 333 41 280 47 235 51 304 41 435 71 397 71 364 57 257 56 222 40 249 47 267 56 305 74 287 54 344 64
Grand Total 2,275 1,218 2,042 1,147 1,631 1,109 1,660 997 1,525 983 1,403 950 1,602 876 1,685 1,084 1,487 962 1,528 1,105 1,375 1,105 1,194 1,023 1,282 916 1,184 1,030 1,184 991 1,236 906 1,234 941
No.of surveyed company
(Note) 1. Data Source : SAJ members and associate member only. Fiscal year basis. 2. Docking work is mainly composed of Special survey and Intermediate survey. 3. The definition of "Japanese Flag vessels" in this table includes foreign flag vessels which are practically controlled by Japanese shipowner.
8281 8786858483 9291908988 959493
13 14
19 18
96 97
10 11 12
14 141414
05 06 07 08 09
141414141Half 15. 2Half 14
98 99 00 01 02
2323
14141Half 16. 2Half 141617
03 04
231Half 21. 2Half 23
1718 14
191919191Half 18. 2Half 19171717212323
- 27 -

(Note) Data Source : SAJ members and associate member only.
171
187
156
145 142
136 137 130
122 115
111
100 98 95
88
108
96
111 111
102
92
103 99
91 94
0
20
40
60
80
100
120
140
160
180
200
90 91 92 93 94 95 96 97 98 99 00 01 02 03 04 05 06 07 08 09 10 11 12 13 14
Fig 14. REPAIR / CONVERSION TURNOVERBillion Yen
Japanese Flag vessels(Including foreign flag vessels practically controlled by Japanese shipowner.)
Foreign Flag vessels
Total figures are indicated.
Fiscal year
- 28 -

( Unit : Person ) Division Subcontractor Employee + No. of surveyed Total Employee
Year Staff Worker Total (shipbuilding division) Subcon. Total Companies & Yards (Inc. other division)
1976 28,869 81,366 110,235 31,340 141,575 23 co. & 51 yards -
77 27,235 75,918 103,153 30,053 133,206 23 co. & 51 yards 264,309
78 23,163 67,246 90,409 21,661 112,070 23 co. & 49 yards 246,386
79 18,309 50,613 68,922 15,664 84,586 23 co. & 48 yards 214,110
80 15,155 41,483 56,638 18,050 74,688 23 co. & 46 yards 201,196
81 16,244 41,793 58,037 24,135 82,172 23 co. & 46 yards 204,583
82 16,637 43,845 60,482 25,908 86,390 23 co. & 46 yards 204,390
83 16,770 43,033 59,803 18,422 78,225 23 co. & 45 yards 203,150
84 16,418 41,086 57,504 17,992 75,496 23 co. & 44 yards 195,468
85 15,692 38,373 54,065 18,699 72,764 23 co. & 43 yards 189,053
86 13,865 33,515 47,380 16,034 63,414 23 co. & 44 yards 176,167
87 10,140 20,994 31,134 11,866 43,000 21 co. & 40 yards 146,393
88 8,533 16,311 24,844 10,846 35,690 18 co. & 40 yards 132,559
89 8,049 15,047 23,096 12,006 35,102 18 co. & 39 yards 128,106
90 7,639 14,712 22,351 13,056 35,407 18 co. & 38 yards 127,299
91 8,305 15,211 23,516 14,412 37,928 18 co. & 38 yards 130,007
92 8,873 16,073 24,946 15,664 40,610 18 co. & 38 yards 133,881
93 9,366 16,311 25,677 16,266 41,943 18 co. & 38 yards 134,338
94 8,397 16,317 24,714 15,514 40,228 18 co. & 38 yards 129,849
95 7,886 15,678 23,564 14,752 38,316 18 co. & 38 yards 124,362
96 7,066 14,557 21,623 15,480 37,103 18 co. & 37 yards 117,324
97 6,925 13,196 20,121 18,215 38,336 18 co. & 37 yards 113,107
98 6,872 13,055 19,927 18,298 38,225 18 co. & 36 yards 111,351
99 6,753 12,269 19,022 18,622 37,644 18 co. & 35 yards 107,249
2000 6,570 11,518 18,088 17,479 35,567 18 co. & 33 yards 100,785
01 6,441 11,710 18,151 18,865 37,016 18 co. & 35 yards 94,108
02 6,245 11,411 17,656 20,755 38,411 18 co. & 34 yards 89,112
03 6,771 11,991 18,762 23,048 41,810 17 co. & 33 yards 78,433
04 6,975 11,692 18,667 21,771 40,438 17 co. & 32 yards 78,433
05 7,051 11,676 18,727 24,608 43,335 17 co. & 32 yards 71,596
06 7,269 13,377 20,646 26,188 46,834 18 co. & 35 yards 72,994
07 7,702 13,961 21,663 28,577 50,240 18 co. & 35 yards 71,542
08 8,295 14,453 22,748 29,391 52,139 18 co. & 35 yards 76,929
09 8,840 14,795 23,635 30,261 53,896 18 co. & 35 yards 79,982
10 9,408 15,451 24,859 28,461 53,320 18 co. & 35 yards 79,907
11 9,534 15,129 24,663 28,101 52,764 18 co. & 35 yards 76,161
12 9,431 14,287 23,718 27,462 51,180 18 co. & 35 yards 70,782
13 9,034 13,261 22,295 24,218 46,513 17 co. & 35 yards 68,949
14 8,972 11,867 20,839 23,501 44,340 16 co. & 34 yards 59,734
15 9,203 11,882 21,085 25,331 46,416 16 co. & 34 yards 58,985
(Note) As of 1st April in each year.
Shipbuilding Division Employee
15. SHIPBUILDING WORKFORCE (SAJ Members)
- 29 -

(Note) As of 1st April in each year.
35
38
4142
4038
3738 38 38
3637
38
4240
43
47
5052
54 53 5351
47
4446
0
10
20
30
40
50
60
90 91 92 93 94 95 96 97 98 99 00 01 02 03 04 05 06 07 08 09 10 11 12 13 14 15
Staffs
Workers
Total figures are indicated.
Sub contractors
1,000 Persons
Fig 15.SHIPBUILDING WORKFORCE (SAJ Members)
- 30 -

Annex 1. Orderbook by shipowner's nationality (Japan・S.Korea・China) As of end Dec. 2015
Shipbuilding country Shipbuilding country Shipbuilding countryCGT CGT CGT
Owner's Nationality No. GT CGT Owner % Owner's Nationality No. GT CGT Owner % Owner's Nationality No. GT CGT Owner %
JAPAN 265 14,284,771 7,644,722 37.2 GREECE 139 11,418,603 5,319,714 19.6 CHINA, PEOPLE'S REPUBLIC OF 372 21,533,190 9,546,131 27.0
CHINESE TAIPEI 48 1,627,167 851,074 4.1 KOREA, SOUTH 89 5,974,945 2,791,239 10.3 GREECE 139 7,495,545 3,230,249 9.1
GREECE 41 1,880,124 817,421 4.0 DENMARK 28 3,752,145 1,533,779 5.6 GERMANY 125 4,030,768 2,182,495 6.2
UNITED STATES OF AMERICA 21 867,600 585,602 2.9 BERMUDA 43 2,732,000 1,525,184 5.6 SINGAPORE 84 5,072,757 2,167,459 6.1
SINGAPORE 28 623,433 381,708 1.9 CANADA 18 1,996,000 1,435,820 5.3 BERMUDA 77 4,678,289 1,844,374 5.2
BERMUDA 13 723,867 293,900 1.4 MONACO 31 2,770,200 1,434,461 5.3 NORWAY 64 3,203,880 1,689,052 4.8
HONG KONG, CHINA 13 431,200 222,487 1.1 CHINA, PEOPLE'S REPUBLIC OF 36 2,942,300 1,350,148 5.0 HONG KONG, CHINA 53 2,892,826 1,285,534 3.6
MONACO 12 479,200 220,146 1.1 JAPAN 18 1,897,200 1,125,840 4.1 UNITED STATES OF AMERICA 47 2,647,947 1,146,588 3.2
SPAIN 2 254,400 189,336 0.9 NORWAY 33 2,417,500 1,109,767 4.1 DENMARK 51 1,378,976 887,121 2.5
GERMANY 7 272,250 128,387 0.6 UNITED KINGDOM 20 1,439,800 1,053,502 3.9 ITALY 31 1,564,597 815,486 2.3
NORWAY 7 184,624 101,631 0.5 SINGAPORE 41 2,154,700 964,685 3.6 JAPAN 24 1,129,202 555,896 1.6
FINLAND 4 228,800 98,860 0.5 UNITED STATES OF AMERICA 29 2,007,800 897,085 3.3 MONACO 32 1,143,372 554,592 1.6
UNITED KINGDOM 6 182,578 94,310 0.5 HONG KONG, CHINA 22 1,945,300 840,076 3.1 NETHERLANDS 29 931,242 477,785 1.4
CHINA, PEOPLE'S REPUBLIC OF 5 88,099 90,100 0.4 MALAYSIA 13 1,197,000 704,248 2.6 CANADA 10 608,500 437,306 1.2
CANADA 5 103,000 62,065 0.3 SAUDI ARABIA 14 1,700,400 524,058 1.9 KOREA, SOUTH 23 936,375 380,083 1.1
ISLE OF MAN 3 86,650 54,415 0.3 GERMANY 13 1,173,200 502,023 1.8 SWEDEN 17 611,600 374,892 1.1
SOUTH AFRICA 3 102,200 50,607 0.2 KUWAIT 8 1,109,300 450,507 1.7 UNITED KINGDOM 24 594,265 372,922 1.1
INDIA 3 65,950 38,741 0.2 FRANCE 6 870,000 368,670 1.4 AUSTRALIA 11 1,102,750 337,195 1.0
PORTUGAL 2 72,800 35,132 0.2 BELGIUM 8 528,000 226,826 0.8 CHINESE TAIPEI 9 786,197 264,920 0.7
PHILIPPINES 6 19,199 34,338 0.2 RUSSIA 7 388,000 221,409 0.8 POLAND 18 424,260 242,528 0.7
ITALY 2 68,800 33,942 0.2 NIGERIA 3 251,568 194,892 0.7 THAILAND 17 378,261 221,866 0.6
DENMARK 2 43,100 25,518 0.1 INDIA 7 300,000 184,172 0.7 TURKEY 11 339,871 198,040 0.6
KOREA, SOUTH 4 6,670 19,778 0.1 JERSEY 4 616,000 173,856 0.6 LUXEMBOURG 5 250,000 147,835 0.4
TURKEY 1 34,795 17,089 0.1 OMAN 7 203,000 117,467 0.4 UNITED ARAB EMIRATES 8 288,230 139,648 0.4
BELGIUM 1 12,200 10,244 0.0 NETHERLANDS 4 258,100 105,024 0.4 CYPRUS 6 263,026 118,052 0.3
PANAMA 1 11,500 9,905 0.0 UNITED ARAB EMIRATES 6 174,000 100,686 0.4 INDIA 6 227,416 106,696 0.3
MALAYSIA 1 3,100 6,060 0.0 TURKEY 4 220,000 94,062 0.3 FRANCE 7 135,622 105,342 0.3
CHILE 4 75,700 67,788 0.2 BULGARIA 6 177,600 92,904 0.3
SWEDEN 4 107,400 64,150 0.2 BANGLADESH 6 153,000 89,196 0.3
ANGOLA 2 168,000 61,534 0.2 SWITZERLAND 7 124,924 75,568 0.2
PHILIPPINES 2 84,600 41,618 0.2 SPAIN 4 149,851 74,972 0.2
SWITZERLAND 1 48,000 28,887 0.1 ISRAEL 3 135,162 60,021 0.2
INDONESIA 6 71,284 59,664 0.2
JERSEY 3 132,029 59,168 0.2
PORTUGAL 3 105,000 51,453 0.1
MALTA 2 88,196 39,494 0.1
SRI LANKA 2 73,400 35,308 0.1
CROATIA 2 71,800 34,836 0.1
BELGIUM 1 94,000 31,333 0.1
UKRAINE 2 58,900 30,688 0.1
RUSSIA 4 24,499 28,390 0.1
MALAYSIA 3 30,208 22,905 0.1
FINLAND 2 32,000 21,278 0.1
MARSHALL ISLANDS 2 21,200 20,350 0.1
ICELAND 1 10,100 10,039 0.0
QATAR 1 3,061 4,658 0.0
NIGERIA 1 2,738 4,371 0.0
UNCONFIRMED 431 17,545,169 8,411,531 41.0 UNCONFIRMED 56 3,473,974 1,544,769 5.7 UNCONFIRMED 283 9,039,074 4,702,572 13.3
Cargo carrying ships Total 937 40,303,246 20,529,049 100.0 Cargo carrying ships Total 720 56,394,735 27,157,946 100.0 Cargo carrying ships Total 1,644 75,246,990 35,379,255 100.0
(Note) 1. Source : IHS "World Shipbuilding Statistics" 2. Vessel's Coverage 100 GT and over
Japan S.Korea China
- 31 -

Annex 2. Orderbook by shiptype (Japan・S.Korea・China)As of end Dec. 2015
Shipbuilding country Shipbuilding country Shipbuilding countryCGT CGT CGT
Ship Type No. GT CGT Type % Ship Type No. GT CGT Type % Ship Type No. GT CGT Type %
Bulk Carrier 435 17,531,847 7,949,910 38.1 LNG Tanker 91 10,243,905 7,888,363 27.2 Bulk Carrier 702 31,631,101 13,591,685 34.3
LNG Tanker 30 3,988,741 2,924,191 14.0 Crude Oil Tanker 206 19,869,405 6,707,362 23.2 Container Ship 293 16,644,811 8,700,236 22.0
Container Ship 47 6,168,463 2,573,485 12.3 Container Ship 97 12,738,260 5,327,319 18.4 Crude Oil Tanker 138 13,138,266 4,441,777 11.2
Crude Oil Tanker 60 5,020,071 1,798,664 8.6 LPG Tanker 106 3,786,874 2,541,282 8.8 Chemical/Oil Products Tanker 136 2,621,724 1,718,231 4.3
Chemical/Oil Products Tanker 90 1,615,713 1,110,679 5.3 Chemical/Oil Products Tanker 112 3,014,907 1,781,143 6.2 LNG Tanker 20 1,442,726 1,212,691 3.1
Chemical Tanker 64 884,181 950,676 4.6 Bulk Carrier 40 3,159,955 1,109,903 3.8 General Cargo Ship 108 1,401,670 1,167,488 2.9
General Cargo Ship 79 919,468 723,153 3.5 Vehicles Carrier 26 1,789,100 948,934 3.3 LPG Tanker 47 1,256,136 929,891 2.3
Vehicles Carrier 20 1,271,599 674,633 3.2 Oil Products Tanker 32 1,311,145 652,938 2.3 Ore Carrier 23 3,224,188 918,570 2.3
LPG Tanker 43 848,179 649,795 3.1 Ore Carrier 2 304,400 84,082 0.3 Vehicles Carrier 29 1,657,363 916,727 2.3
Ore Carrier 8 1,049,000 307,014 1.5 Ro-Ro Cargo Ship 2 120,000 65,526 0.2 Chemical Tanker 25 377,365 405,390 1.0
Passenger (Cruise) Ship 2 250,000 254,774 1.2 Bitumen Tanker 2 48,000 30,130 0.1 Passenger/Ro-Ro Cargo Ship 12 169,111 191,187 0.5
Oil Products Tanker 17 365,835 202,290 1.0 Chemical Tanker 3 8,285 19,681 0.1 Heavy Load Carrier 9 297,736 181,534 0.5
Passenger/Ro-Ro Cargo Ship 14 102,774 143,934 0.7 Aggregates Carrier 1 499 1,283 0.0 Container/Ro-Ro Cargo Ship 4 401,720 181,296 0.5
Refrigerated Cargo Ship 5 72,198 89,498 0.4 Bitumen Tanker 22 187,767 177,597 0.4
Ro-Ro Cargo Ship 5 51,830 53,958 0.3 Oil Products Tanker 22 209,044 161,804 0.4
Cement Carrier 7 54,148 43,362 0.2 Deck Cargo Ship 18 121,824 124,512 0.3
Wood Chips Carrier 2 82,000 37,777 0.2 Bulk/Oil Carrier 4 173,982 99,172 0.3
Passenger Ship 3 7,950 16,167 0.1 Refrigerated Cargo Ship 8 49,742 82,038 0.2
Bitumen Tanker 3 7,949 12,073 0.1 Self Discharging Bulk Carrier 3 95,100 46,650 0.1
Powder Carrier 1 5,500 5,547 0.0 Livestock Carrier 4 55,600 45,708 0.1
Limestone Carrier 1 3,500 4,210 0.0 Barge Carrier 1 34,153 21,516 0.1
Aggregates Carrier 1 2,300 3,259 0.0 Cement Carrier 3 21,452 19,414 0.0
Passenger/Container Ship 1 25,000 18,593 0.0
Passenger Ship 9 6,331 18,193 0.0
Landing Craft 2 2,740 6,028 0.0
Water Tanker 1 338 1,327 0.0
Cargo carrying ships total 937 40,303,246 20,529,049 98.4 Cargo carrying ships total 720 56,394,735 27,157,946 93.8 Cargo carrying ships total 1,644 75,246,990 35,379,255 89.3
Ships of Miscellaneous Activities 54 281,307 326,091 1.6 Ships of Miscellaneous Activities 49 3,015,383 1,792,813 6.2 Ships of Miscellaneous Activities 690 2,346,498 4,253,482 10.7
All Ship Types Total 991 40,584,553 20,855,140 100.0 All Ship Types Total 769 59,410,118 28,950,759 100.0 All Ship Types Total 2,334 77,593,488 39,632,737 100.0
(Note) 1. Source : IHS "World Shipbuilding Statistics" 2. Vessel's Coverage 100 GT and over
Japan S.Korea China
- 32 -

As of end Dec. 2015, Unit: Mill. GT
2009 2010 2011 2012 2013 2014 20152016est.
2017est.
VLCC >= 200,000 8.5 8.6 9.9 7.9 4.9 3.9 3.2 7.5 6.2Suezmax 120-200,000 3.7 3.2 3.6 3.8 2.5 0.7 0.9 2.1 3.3Aframax 80-120,000 5.8 4.3 3.6 2.6 1.1 1.1 1.9 2.5 3.2Panamax 60-80,000 1.6 1.3 1.1 0.6 0.4 0.2 0.1 0.7 0.7Products 30-60,000 4.5 3.0 2.0 1.6 2.3 2.8 3.3 2.3 2.1Products 10-30,000 0.1 0.1 0.2 0.2 0.1 0.1 0.1 0.0 0.1Chem & Spec. 10-60,000 2.2 2.0 1.4 0.8 0.5 0.5 1.3 1.8 1.1Small tankers < 10,000 0.9 0.7 0.6 0.6 0.4 0.2 0.1 0.1 0.1Total Tankers 27.3 23.2 22.4 18.1 12.2 9.5 10.9 17.0 16.8Capesize > 100,000 10.8 20.0 23.7 21.7 11.4 9.7 8.8 9.5 6.6Panamax 80-100,000 2.2 5.7 8.5 10.8 7.7 4.4 4.3 5.2 4.2Panamax 65-80,000 1.4 2.1 3.4 3.8 3.2 2.6 1.0 0.5 0.3Handymax 40-65,000 6.1 11.0 13.0 12.2 8.7 6.7 9.1 8.6 6.1Handysize 10-40,000 3.9 5.8 6.7 6.7 4.1 3.4 4.1 3.3 2.5Combos > 10,000 0.0 0.9 0.5 0.0 0.0 0.0 0.0 0.0 0.0Total Bulkers and Combos 24.4 45.5 55.8 55.2 35.1 26.8 27.3 27.1 19.7Containers > 8,000 teu 3.9 7.5 8.7 9.7 10.1 13.0 15.2 10.7 11.1Containers 3-8,000 teu 5.9 6.0 3.7 3.1 3.7 2.4 1.2 0.3 0.6Containers < 3,000 teu 2.0 1.4 1.0 0.9 0.7 0.7 1.1 1.3 1.0Total Containers 11.8 14.9 13.4 13.7 14.5 16.1 17.5 12.3 12.7LNG Carriers 4.8 2.9 1.2 0.2 1.7 3.5 3.2 4.1 4.5LPG Carriers 1.1 0.9 0.5 0.3 1.0 0.8 2.2 2.9 2.1Offshore 1.7 2.6 2.8 2.5 2.3 3.3 2.4 2.1 2.1Cruise Vessels 1.0 1.2 0.5 0.8 0.6 0.7 0.6 1.0 0.9Passenger Ferries 0.4 0.5 0.4 0.4 0.2 0.2 0.3 0.2 0.2Others # 5.8 6.2 6.4 4.8 3.4 2.9 2.8 2.0 1.5Total Special Vessels 8.9 10.5 10.1 8.5 6.5 7.1 6.1 5.3 4.7
All Vessels Types 78.3 98.1 103.3 96.1 70.9 63.6 67.2 68.7 60.6
Note: 1. Source: Crarkson "World Shipyard Monitor, page7- January. 2016".
2. Others# includes MPP, Reefers, RoRo ships, PCC.
3. Estimated delivery figures are updated by monthly incorporating new orders and other informations.
Annex 3. Actual Delivery & Estimated Delivery by Ship-types (based on present orderbook)
- 33 -

(Note) 1.Source: Clarkson "World Shipyard Monitor". 2.As of end Dec. 2015.
78.3
98.1 103.3
96.1
70.9
63.6 67.2 68.7
60.6
0
20
40
60
80
100
120
2009 2010 2011 2012 2013 2014 2015 2016est.
2017est.
Special Vessels
LPG Carriers
LNG Carriers
Containerships
Bulkers and Combos
Tankers
Annex 3. Actual Delivery & Estimated Delivery by Ship-types(based on present orderbook)
Mill. GT
- 34 -