panera bread - eco27 | just another wordpress.com site analysis strengths - panera bread bakery...
TRANSCRIPT
PANERA BREAD
Terry Asante
Rob McClain

BUSINESS OVERVIEW
• Panera Bread was once known as the St. Louis
Bread Company, but was acquired by Au Bon Pain
Company in 1993.
• There are 1,504 locations as of September 2011
• CEO and founder: Ron Shaich
• 2010 Sales roughly $3 Billion
• Food: So good.
• Current Stock Price: $141

BUSINESS DESCRIPTION
• “Bread is our passion,
soul and expertise”.
• Panera bread is A
nationally baked Cafe
Panera Bread prides itself on freshly baked foods. It is best known
for its soothing soups, freshly tossed salads, mouth watering
sandwiches, and of course, fresh dough-rising breads.
SWOT ANALYSIS
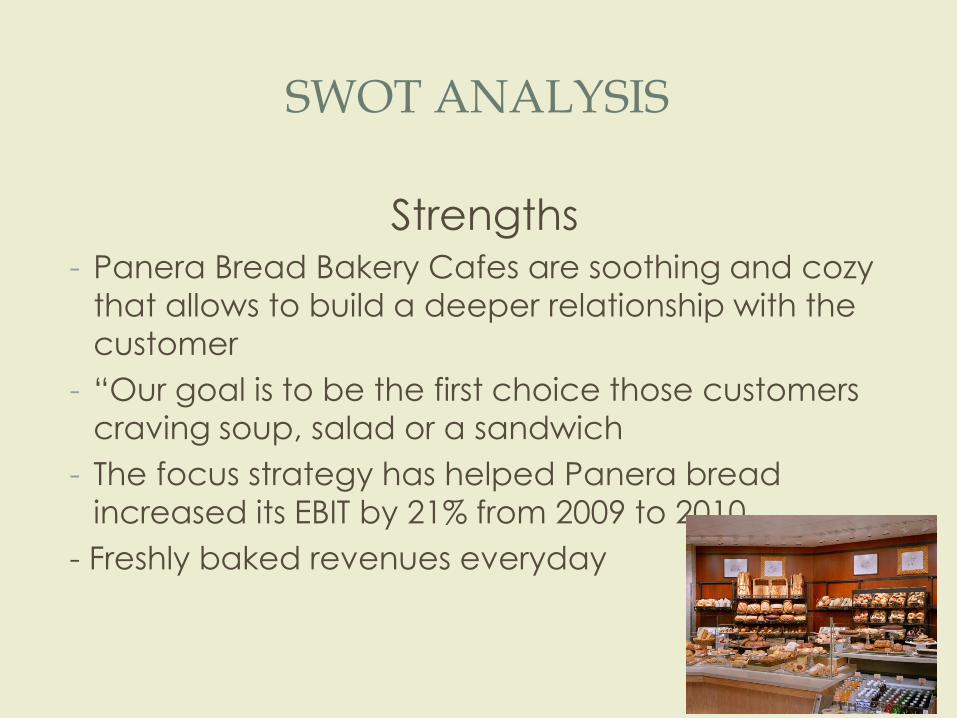
Strengths - Panera Bread Bakery Cafes are soothing and cozy
that allows to build a deeper relationship with the
customer
- “Our goal is to be the first choice those customers
craving soup, salad or a sandwich
- The focus strategy has helped Panera bread
increased its EBIT by 21% from 2009 to 2010
- Freshly baked revenues everyday
WEAKNESS
• Higher priced food may cause consumers to
substitute to Lower quality food item
• Changes in consumer taste and preferences will
lead to restaurants offering more nutritious items.
• No 24 hour drive through window
OPPORTUNITIES.
• My Panera Loyalty program introduced in 2010
customer earn rewards
• Fortune Magazine named Panera Bread in “ 100
fastest growing companies”.

THREATS
• Competition for specialty food and casual
• Changes in consumer taste and preferences will
lead to restaurants offering more healthy items
• Barriers of entry and exit in the restaurant industry
are low.

FINANCIAL ANALYSIS
• Profitability ratios
• Liquidity ratios
• Efficiency ratios

0.00
200.00
400.00
600.00
800.00
1,000.00
1,200.00
1,400.00
1,600.00
1,800.00
12/31/10 12/31/09 12/31/08 12/31/07 12/31/06
I
n
M
i
l
l
i
o
n
s
Fiscal Year
Net Sales
Series1
Years 2006 2007 2008 2009 2010 TTM
Sales revenue $ 828,971 29% $ 1,066,691 22% $ 1,298,853 4% $ 1,353,494 14% $ 1,542,489 14%
$ 1,754,428
Revenues in 000’s
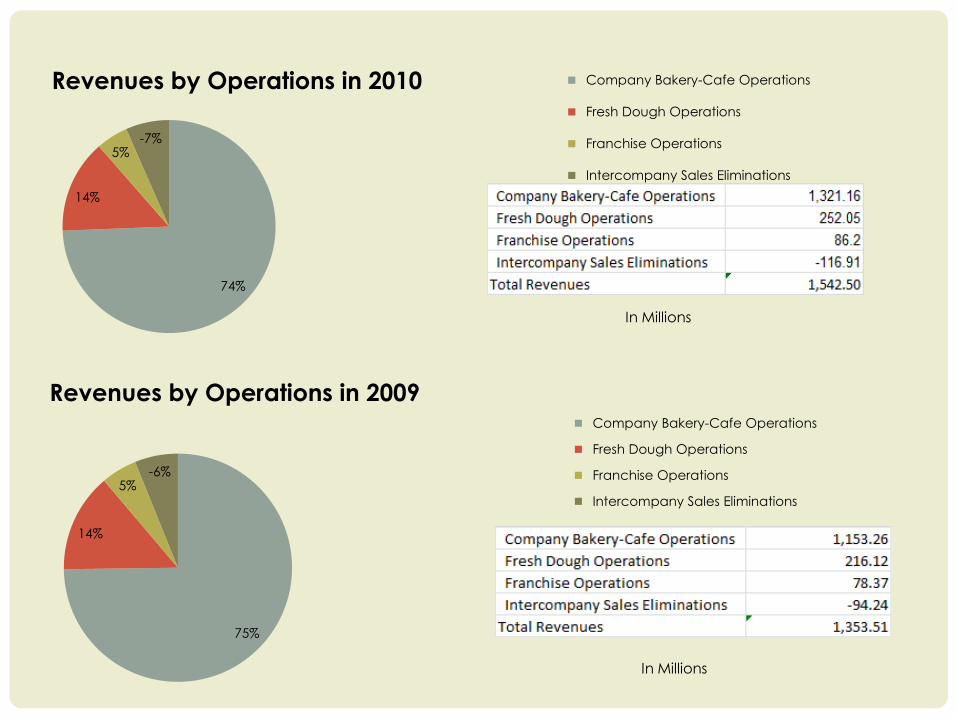
74%
14%
5% -7%
Revenues by Operations in 2010 Company Bakery-Cafe Operations
Fresh Dough Operations
Franchise Operations
Intercompany Sales Eliminations
In Millions
75%
14%
5% -6%
Revenues by Operations in 2009 Company Bakery-Cafe Operations
Fresh Dough Operations
Franchise Operations
Intercompany Sales Eliminations
In Millions

0
5
10
15
20
2006 2007 2008 2009 2010
Years
Return On Assets
Panera Bread
Chipolte
Starbucks
Mcdonalds
0
5
10
15
20
25
30
35
40
2006 2007 2008 2009 2010
Years
Return On equity Panera Bread
Chipolote
Starbucks
Mcdonalds2006 2007 2008 2009 2010
16.47 13.62 14.33 15.76 18.76
Panera
Bread
10.58 13.62 13.2 19.13 23.64 Chipotle
29.81 13.21 14.12 28.14 30.91 Starbucks
23.16 15.58 30.1 33.2 34.51
McDonald
’s
2006 2007 2008 2009 2010
12.01 9.26 9.83 11.39 12.7
Panera
Bread
8.31 10.64 10.11 14.2 17.18 Chipotle
13.77 5.73 6.95 15.81 18.12 Starbucks
12.01 8.2 14.91 15.1 15.9
McDonal
ds

0
5
10
15
20
25
30
35
2007 2008 2009 2010 2011
Years
Operating profit margin
Panera Bread
Chipolte
Mcdonalds
Starbucks
2007 2008 2009 2010 2011
10.95 8.37 8.68 10.41 12 Panera Bread
7.5 10 9.3 13.4 15.7 Chipotle
11.2 4.9 5.7 13.3 14.8 Starbucks
20.59 17.02 27.39 30.08 31.04 McDonalds
2007 2008 2009 2010 2011
10.47 11.56 13.27 15.76 18.76 Panera Bread
10.57 13.62 13.11 19.02 23.52 Mcdonalds
20.77 8.64 10.63 24.19 27.2 Starbucks
14.41 9.88 17.9 18.88 19.49 Chipotle
0
5
10
15
20
25
30
2007 2008 2009 2010 2011
Years
Return on Invested Capital
Panera Bread
Chipolte
Starbucks
Mcdonalds
ROIC WACC EVA spread EVA
PNRA 20.16 10.25 9.91 64.06
MCD 19.9 6.89 13.01 3688.69
PNRA 20.57 11.03 9.54 102.1
SBUX 25.13 10.40% 14.73 688.4

0
0.5
1
1.5
2
2.5
3
3.5
4
2007 2008 2009 2010 Latest Qtr
Years
Current Ratio Panera Bread
Chipolte
Starbucks
Mcdonalds
0
0.5
1
1.5
2
2.5
3
3.5
4
2008 2009 2010 2011 Latest Qtr
Years
Quick ratio Panera Bread
Mcdonalds
Starbucks
Chipolote
2007 2008 2009 2010 Latest Qtr
0.8 1.39 1.14 1.49 0.87 Mcdonalds
1.19 1.21 2.26 1.56 1.39 Panera Bread
0.8 1.29 1.55 1.83 1.83 Starbucks
2.75 2.75 2.91 3.3 3.8 Chipotle
2008 2009 2010 2011 Latest Qtr
Panera Bread 1 0.9 1.93 1.27 1.08
Mcdonalds 0.67 1.18 0.96 1.22 0.71
Starbucks 0.3 0.59 0.98 1.17 1.17
Chipotle 2.54 2.5 2.69 3.08 3.51
0
0.5
1
1.5
2
2.5
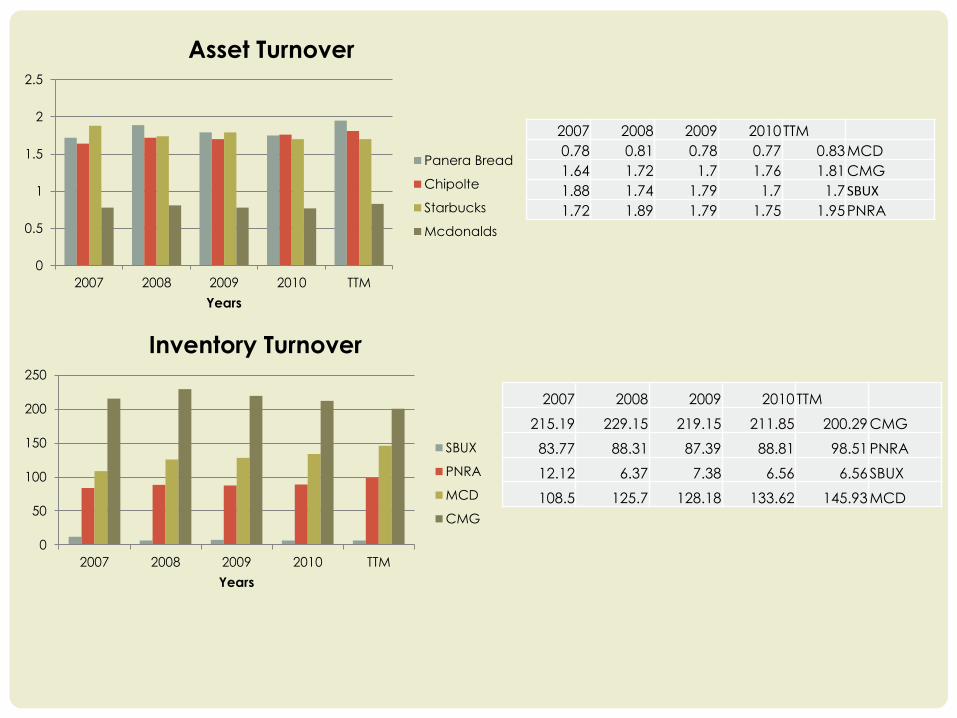
2007 2008 2009 2010 TTM
Years
Asset Turnover
Panera Bread
Chipolte
Starbucks
Mcdonalds
2007 2008 2009 2010 TTM
0.78 0.81 0.78 0.77 0.83 MCD
1.64 1.72 1.7 1.76 1.81 CMG
1.88 1.74 1.79 1.7 1.7 SBUX
1.72 1.89 1.79 1.75 1.95 PNRA
0
50
100
150
200
250
2007 2008 2009 2010 TTM
Years
Inventory Turnover
SBUX
PNRA
MCD
CMG
2007 2008 2009 2010 TTM
215.19 229.15 219.15 211.85 200.29 CMG
83.77 88.31 87.39 88.81 98.51 PNRA
12.12 6.37 7.38 6.56 6.56 SBUX
108.5 125.7 128.18 133.62 145.93 MCD

RECOMMENDATION
• Panera Bread has great revenue and cash flow
streams; healthy and efficient ratios.
• It’s growth is on the verge of maturity. It’s large
margin years are possibly coming to an end. There
is a lot of uncertainty in this volatile market.
• We are putting forth a recommendation for current
shareholders to hold. Watch and see what the
market and PNRA do. We are confident a steady
growth will occur, but it is too expensive to jump on
the wagon.

BYE