panera bread 2008 annual shareholders...
TRANSCRIPT

Panera Bread 2008 Annual Shareholders Meeting

2
Disclaimer
Matters discussed in this presentation, including any discussion or impact, express or implied, on the Company's anticipated
growth, and future earnings per share, contain forward–looking statements within the meaning of Section 27A of the Securities
Act of 1933 and Section 21E of the Securities Exchange Act of 1934. All forward-looking statements made during this
presentation are made only as of this date, and we do not undertake any obligation to publicly update or correct any forward-
looking statements to reflect events or circumstances that occur or which we hereafter become aware after this date. The
statements identified by the words “believe”, “positioned”, “estimate”, “project”, “target”, “continue”, “will”, “intend”, “expect”,
“future”, “anticipates”, “preliminary” and similar expressions express management's present belief, expectations or intentions
regarding the Company’s future performance. The Company’s actual results could differ materially from those set forth in the
forward–looking statements due to known and unknown risks and uncertainties and could be negatively impacted by a number
of factors. These factors include but are not limited to the following: the availability of sufficient capital to the Company and the
developers party to franchise development agreements with the Company; variations in the number and timing of bakery–cafe
openings; public acceptance of new bakery–cafes; competition; national and regional weather conditions; changes in restaurant
operating costs, particularly food and labor; and other factors that may affect retailers in general. These and other risks are
discussed from time to time in the Company’s SEC reports, including its Form 10–K for the fiscal year ended December 25, 2008.

3
The Panera Bread Story
Strong and stable unit volumes driven by high consumer acceptance- $2.0 million AUV is highest of any public concept outside casual dining
- 87% of units have a greater than $1.5 million AUV
- 2008 YTD (as of April 22) company-owned comparable store sales growth of 4.38%
Unit level economics drive unit growth- 40% cash-on-cash, store level ROI
- 21% unit CAGR from 2002 to 2007
- 1,252 bakery-cafes open at end of Q1 2008 (543 company and 709 franchise)
Unit Growth and Operating leverage leads to strong corporate performance- From 2001 to 2006, 43% average annual EPS growth; 2007 EPS flat
- From January 2, 1998 to May 19, 2008 stock appreciation of nearly 1,300% or 29% annually

4
Unit Performance: Average Unit Volumes Are Better Than All But Casual Dining
T.G.I. Friday’s $3,444
Outback Steakhouse $3,355
Red Robin Gourmet Burgers & Spirits $3,172Chili’s Grill & Bar $3,063Applebee’s Neighborhood Grill & Bar $2,542Buffalo Wild Wings Grill & Bar $2,175Ruby Tuesday $2,141PANERA BREAD $2,007McDonald’s $1,974Chipotle Mexican Grill $1,555Wendy’s $1,304
Burger King $1,175
Boston Market $1,088KFC $978Arby’s $904Dunkin’ Donuts $844Starbucks $768Pizza Hut $689Quizno’s $406Subway $382
QUIC
K CA
SUAL
and
FAS
T FO
ODCA
SUAL
DIN
ING
Note: 2006 AUVs, in thousands of dollars. Source: Nation’s Restaurant News Top 100 Report; June 25, 2007

5
Average 2-Year Comp. Store Sales Growth of 7.4%
Com
para
ble
Stor
e Sa
les G
row
th %
5.5Yr. Avg. of 7.4%
QTD as of 4/22/08

6
Why? Consumers Rank Panera the Definitive Industry Leader
Ranked #1 or #2 in customer satisfaction on Sandelman survey five years in a row- Sandelman & Associates survey of 84,000 customers at 138 food service concepts over 70 markets
- 57% of customers ranked Panera as “excellent” on their last visit
Ranked “Most Popular” & “Top Food” among all fast food chains by Zagat for 2007
Ranked among the best in the industry in food quality five years in a row- Restaurants and Institutions “Choice in Chains” survey of 7,000 customers
Named “Chain of the Year” by Restaurant Hospitality and “Brand of the Year” by Fast Casual in 2006

7
High AUVs Drive Among the Most Attractive Store-Level ROIs in the Industry
Cash Flow $000, except % (a)
Average Net Sales/Unit $1,974
Unit EBITDA $332
Unit Margin % 17%
Invested Capital $000 (b)
Investment Before Overhead $831
Capitalized Overhead $82
Investment After Capitalized Overhead $913
Cash-On-Cash ROI
Before Capitalized Overhead 40%
After Capitalized Overhead 36%
(a) Trailing 52 weeks ending March 25, 2008 for 349 company-owned Panera bakery-cafes opened before March 25, 2008 (excluding acquisitions)(b) Average investment cost for 349 company-owned Panera bakery-cafes opened before March 25, 2008 (excluding acquisitions)

8
High ROIs Fuel Significant Unit Growth
81 90 110 132 173 226311
391532 572
102172
259346
429
515
566
636
698758
0
200
400
600
800
1000
1200
1400
1999 2000 2001 2002 2003 2004 2005 2006 2007 2008 Proj.
Franchise
Company
262 total
369 total
478 total
183 total
602 total
741 total
877 total
Tota
l Num
ber o
f Bak
ery-
Cafe
s
1,027 total
1,330 total1,230
total

9
Panera Has Become the Clear National LeaderWith Significant Development Potential Still Available
Note: 1,252 Bakery-cafes open as of 3/25/08
Maine
JacksonvilleOrlandoSoutheast FloridaTampa/Sarasota
Raleigh-DurhamCharlotteWinston-SalemTennessee. Western NC, Northern GASouth CarolinaAtlanta
Boston Metro
Connecticut &Rhode Island, So Mass
Upstate New YorkJersey/Long IslandPhiladelphia MetroBaltimoreNorthern Virginia/DCWest VirginiaWestern Virginia
Northern California
Houston
ToledoClevelandPittsburgh
Oklahoma
Denver
Las Vegas
Dallas
Alabama
St. LouisCentral MOSW MissouriNW Arkansas
KentuckyColumbusCincinnati
Central PA
Kansas City32
25
5
20
17
17
27
Milwaukee
20
Nebraska18
12
MinneapolisRochester
243
16
81
DetroitGrand Rapids
Indianapolis
1442
Chicago
29
Central IllinoisEastern & Central Iowa
13
33
13
25
30
523
7
3
4
34
41
4935
13
69
34
27
1313
11
12
3210
25
17
21
26
10
31
4Pensacola
239
SouthernCalifornia
48
21Pacific Northwest
1South Dakota
31 Arizona
4
Salt Lake City
Market Penetration LevelsBakery-Cafe to Population Ratio
1 : 100K or less (high penetration)1 : 150K1 : 200K1 : 250K (low penetration)
10
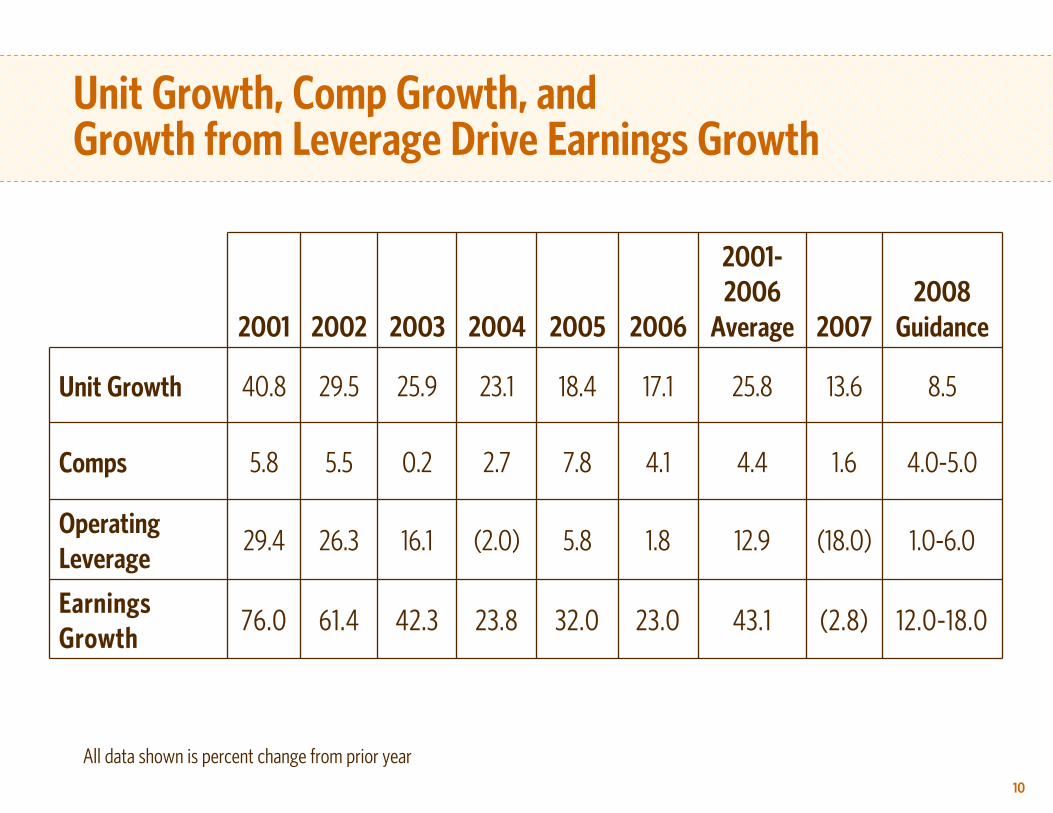
Unit Growth, Comp Growth, andGrowth from Leverage Drive Earnings Growth
All data shown is percent change from prior year
2001 2002 2003 2004 2005 2006
2001-2006
Average 20072008
Guidance
Unit Growth 40.8 29.5 25.9 23.1 18.4 17.1 25.8 13.6 8.5
Comps 5.8 5.5 0.2 2.7 7.8 4.1 4.4 1.6 4.0-5.0
Operating Leverage
29.4 26.3 16.1 (2.0) 5.8 1.8 12.9 (18.0) 1.0-6.0
Earnings Growth
76.0 61.4 42.3 23.8 32.0 23.0 43.1 (2.8) 12.0-18.0

11
What happened over the last 2 years?
Stable transaction growth- Positive growth 11 of the last 13 quarters in company-owned bakery-cafes
Margin compression- Focus on transaction growth at the expense of margin
- Wheat and oil prices reached historically high levels
- Crispani showed limited growth
Negative trajectory on ROIC- Margin compression affects all bakery-cafes
- 40% of system are immature bakery-cafes

12
A 2 Year View of Panera
6.8%
8.4%
7.2% 7.2%
8.9%
3.7%
2.5%
1.6%
-0.6%
1.7%
3.4%
2.6%
3.3%
Company-owned Comps
7.3%
QTD as of 4/22/08
13
Focus in 2008
Improve margin: grow gross profit per transaction year over year(despite hyper-inflation in wheat)
Maintain or grow transactions (despite consumer headwinds)
Drive increased ROIC

14
Improve Margin:Grow Gross Profit per Transaction Year over Year
Paradigm evolution- Rather than focus on comps, focus is on driving transactions and gross profit per transaction
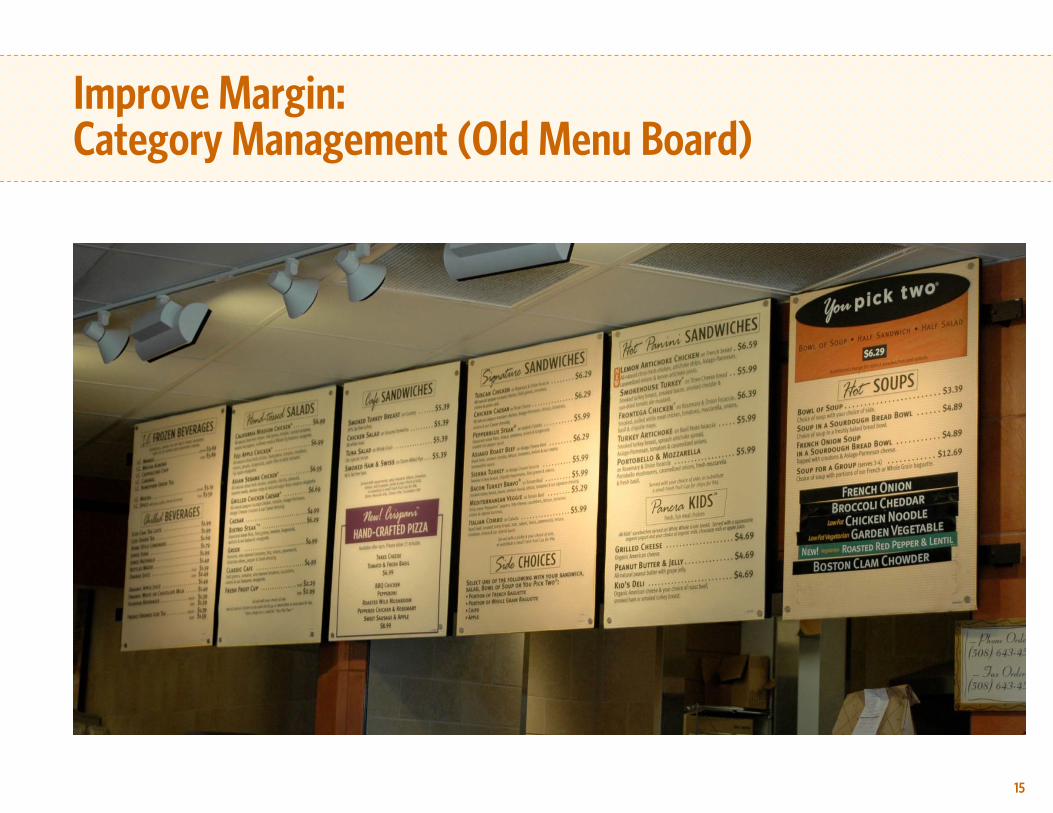
Category management team added- Philosophy: Actions to impact customer behavior- Process: Data collection and rigorous testing- Utilize menu placement to focus on high penny profit items
- Celebrations focused on high penny profit items like You Pick Two- New product introduction process: breakfast sandwich
Pricing initiatives- Pricing philosophy: hi/low (differentiated)- Take price to cover hyper-inflation in wheat consistent with contractual ability- 2.5% increase taken in November 2007 and 2.7% late March 2008 with no transaction loss- In mid-June revised bagel pricing to roll out
Crispani removed- Effectively out mid-first quarter- 100 bps run-rate labor margin improvement
Increase fresh dough sales through bakery initiatives- “Be a Hero” in the office or home: bulk bagel sales- Bread merchandising: seasonal products
15
Improve Margin: Category Management (Old Menu Board)

16
Improve Margin: Category Management (New Menu Board)

17
Improve Margin:Category Management
You Pick TwoYou Pick TwoCinnamon Crunch Cinnamon Crunch
Bagel & Cafe MochaBagel & Cafe Mocha Breakfast SandwichBreakfast Sandwich

18
Improve Margin:Increase Fresh Dough Sales
Bulk BagelsBulk BagelsIrish Soda Bread / Irish Soda Bread /
Hot Cross BunsHot Cross Buns TakeTake--home Breadhome Bread

Hyperinflation: 2008 Locked Costs vs. 2007 Actual Cost
19
*Estimated average for Q3 & Q4 2008

20
Maintain or Grow Transactions
Breakfast- Breakfast sandwiches
Lunch- New soups, salads, sandwiches
- Service system: to go and ease of use
- Via Panera
Platform- Ops excellence: speed / accuracy / customer satisfaction
- Media Trials III

Maintain or Grow Transactions
21

22
Drive Increased ROIC
Invest incremental capital at minimum 15% + long-term free cash flow return- 85% of capital at a 15%+ return, and maximum of 15% of capital non-ROI
(infrastructure/test)
Tighter development with focus on raised AWS hurdles
23
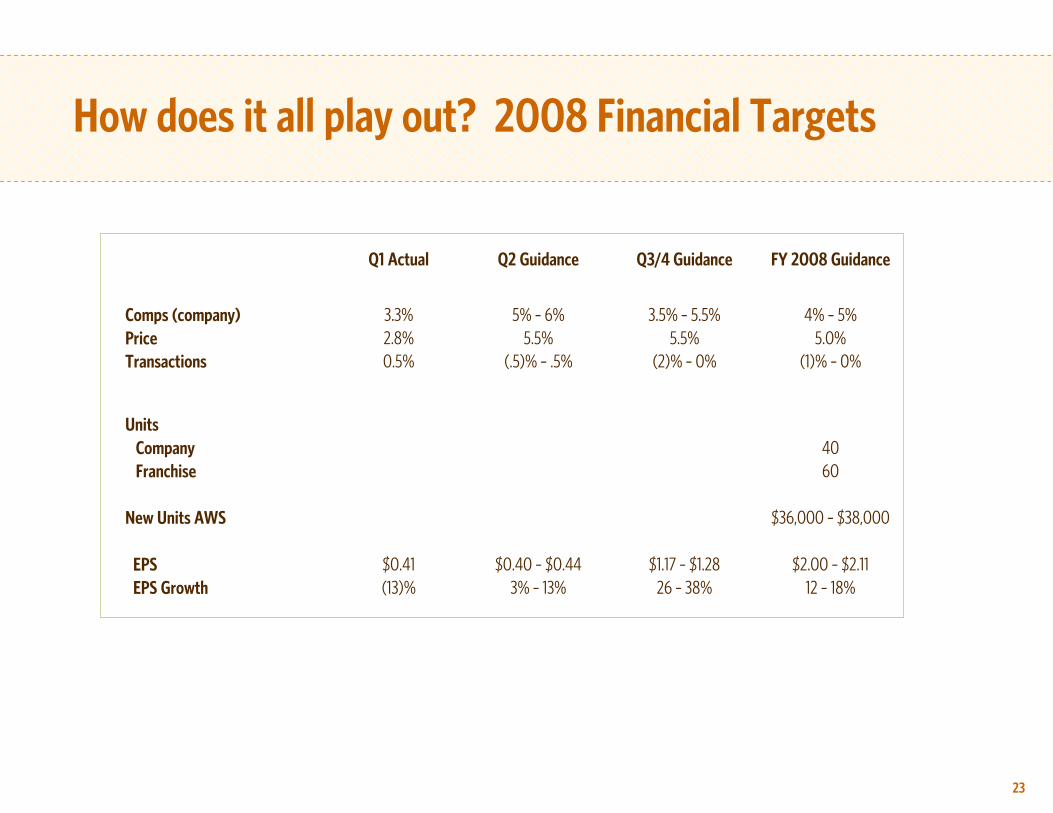
How does it all play out? 2008 Financial Targets
Q1 Actual Q2 Guidance Q3/4 Guidance FY 2008 Guidance
Comps (company) 3.3% 5% – 6% 3.5% – 5.5% 4% – 5%Price 2.8% 5.5% 5.5% 5.0%Transactions 0.5% (.5)% – .5% (2)% – 0% (1)% – 0%
UnitsCompany 40Franchise 60
New Units AWS $36,000 – $38,000
EPS $0.41 $0.40 – $0.44 $1.17 – $1.28 $2.00 – $2.11 EPS Growth (13)% 3% – 13% 26 – 38% 12 – 18%

24
Investment Considerations
Exceptional consumer acceptance drives superior store volumes, which in turn drives 40% cash-on-cash returns
Significant potential for future development
Short term: positioned to drive improved performance through focus on improved margin, transaction growth and increased ROIC improvement
Medium term: positioned to drive expanded earnings growth through concept differentiation + development + leverage

Panera Bread Companywww.panerabread.com