paleofluid evolution of the fractured basalt hydrocarbon ... · studied with a hitachi s-4700...
TRANSCRIPT

Volcanic successions of the Kecel Basalt Formation (KBF) occur in the southern part of thePannonian Basin. As a result of periodic submarine eruptions, the basaltic and pyroclastic rockhorizons were intercalated with layers of the Late Miocene Endrod Marl Formation, which isregarded as one of the most important hydrocarbon source rocks in the area. The KBF was discoveredthrough almost 30 wells between 2,200 and 2,900 meters of depth. Due to the high fracture porosity,some parts of the formation show good reservoir characteristics and act as important migrationpathways of hydrocarbon-bearing fluids. Since the reservoir is presumably fracture-controlled, thisstudy concentrates on the evolution of fractures crosscutting the rock body. Based on textural andmineralogical features, four distinct vein types can be distinguished, of which the first three types arediscussed in this paper. Beside calcite, quartz, feldspar, and chlorite, the veins are cemented by variouszeolite minerals. The vertical dimension of the dominant zeolite zone indicates the burial-diagenetictype of zeolite zonation and suggests subsidence of the subaqueous basalt after formation.
Key words: fractured hydrocarbon reservoir, metabasalt, Pannonian Basin, vein microstructure,microthermometry, zeolite zones
Introduction
The volcanic and pyroclastic rocks of the Kecel Basalt Formation are the resultof the extensive Lower Pannonian volcanic activity in the southern part of thePannonian Basin. This formation is unique due to the presence of reservoir-scalepetroleum accumulations within the fractured volcanic succession. Although ithas been identified from several boreholes and is of economic importance, the
1788-2281/$ 20.00 © 2009 Akadémiai Kiadó, Budapest
Central European Geology, Vol. 52/3–4, pp. 299–323 (2009)DOI: 10.1556/CEuGeol.52.2009.3–4.6
Paleofluid evolution of the fractured basalthydrocarbon reservoir in theÜllés–Ruzsa–Bordány area, SE Hungary
Barbara Szabó, Tivadar M. Tóth, Félix Schubert Department of Mineralogy, Geochemistry and PetrologyUniversity of Szeged, Szeged
Addresses: B. Szabó, T. M. Tóth, F. Schubert: H-6701 Szeged, P.O. Box 651, Hungary, e-mail: [email protected]
Received: April 30, 2009; accepted: August 4, 2009

evolution of the rock body and its fracture system has not yet been studied indetail. Only a few studies have focused on the rock (Cserepesné Meszéna 1978;Pap 1983; Balázs and Nusszer 1987), and only one thesis has focused specificallyon the cementation of the vesicles and fractures (Rappensberger 1991).Rappensberger (1991) identified crystals of several cement mineral phases bySEM and optical microscope (saponite, illite-nontronite, laumontite, heulandite,analcime, levyne, yugawaralite), but he focused mostly on the vesicles, not on theveins, and he did not deal with questions of genetics.
The aim of this study is to provide new information about the mineralizationof the vesicles and veins during and after the post-volcanic alteration of thereservoir. We do not deal with genetic circumstances of the host basaltic rockbody and its metasomatic alteration synchronous with the volcanic activity.
Geologic setting
In the 1970s and 1980s, several hydrocarbon exploration boreholes were drilledin the southern part of the Pannonian Basin, in SE Hungary. Some of thempenetrated intensely altered volcanic rocks named Kecel Basalt Formation (KBF)after the location of the most extensive and thickest series of the volcanicformation (Császár 1997). The Late Miocene to Lower Pannonian basaltic rockswere drilled in the area of Szank, Kiskunhalas, Sándorfalva, Pusztamérges, Üllés,Ruzsa and Bordány by several wells (Cserepesné Meszéna 1978; Pap 1983; Balázsand Nusszer 1987). The stratigraphic thickness of the volcanic formation variesfrom a few to more than 600 meters across the province. The formation consistsof pyroclastic and lava rocks interbedded with up to several hundred meter-thicklayers of the Endrod Marl Formation (EMF). The interlayered and overlyingstrata of the Tótkomlós Calcareous Marl Member of the EMF include fossils(referred to Kõváry and Széles in Balázs and Nusszer 1987); paleontologicalevidence shows that the age of the basalt must be between 8 and 11.6 Ma(Magyar et al. 2004). The results are in agreement with the whole rock K/Arradiometric ages, determined as 8.13 ±0.71 Ma from Kecel-1, as 9.61 ±0.38 Mafrom Kiskunhalas-Ny-3 and as 10.4 ±1.8 Ma from the Ruzsa-4 wells (CserepesnéMeszéna 1978; Pap 1983; Balázs and Nusszer 1987).
The present study concentrates on the successions of KBF in the area of Üllés,Ruzsa and Bordány (Fig. 1). Pap (1983) and Balázs and Nusszer (1987) definedsimilar petrographic characteristics of the volcanic rocks. The pyroclastic and lavarocks are intercalated and overlain by Lower Pannonian calcareous marl andargillaceous marl (EMF), and underlain by Badenian sandstone-siltstone (BékésiFormation). In the underlying sandstone bed, the authors identified basalticdikes. The volcanic strata consist to a large extent of pyroclastics with lesser lavarocks, including tuff layers and marl units in the lower part. In addition to theintercalated calcareous marl, the lava rock locally contains spheroid marlinclusions (Pap 1983; Balázs and Nusszer 1987). The stratigraphic position of the
300 B. Szabó et al.
Central European Geology 52, 2009

volcanic rocks is well presented by Pap (1983) and Gajdos et al. (1983). Althoughthe total thickness of the volcanic succession is not known everywhere, it waspenetrated over 500 m in some wells (Kecel-1: 540 m, Kecel-2: 616 m).
Samples and methods
The Kecel Basalt Formation has been explored by almost 30 wells in the area ofÜllés, Ruzsa and Bordány. The volcanic rocks were penetrated between 2,200 and2,900 meters. For petrological studies, there are core samples from 15 wells, andcuttings from one well (Fig. 1) (Table 1). Of the core samples, some were chosen
Paleofluid evolution of the fractured basalt hydrocarbon reservoir in the Üllés–Ruzsa–Bordány area 301
Central European Geology 52, 2009
Fig. 1Location of the study area in the Pannonian Basin. Insets: Occurrence of Kecel Basalt Formation.Studied wells in Üllés–Ruzsa–Bordány area
Tisza
Tisza

for further investigation as representative mainly of fracture cementation, and ofrock texture in the second place. The macroscopic observations were carried outto explore the very basic textural characteristics of the rocks, the relationship ofveins and vesicles, the paragenesis and spatial relationships of the fracture-fillingminerals.
302 B. Szabó et al.
Central European Geology 52, 2009
Table 1Well data from Üllés–Ruzsa–Bordány area
* measured depth, ** true verified depth, *** no data

Almost 100 thin sections were investigated during the microscopic studies.Petrography was performed on 58 covered thin sections from the collection of theHungarian Oil and Gas Company (MOL Plc.), and further uncovered thinsections were prepared in the Department of Mineralogy, Geochemistry andPetrology at the University of Szeged for SEM and Raman microspectroscopicstudies. Petrography was performed using an Olympus SZX7 binocular andNikon FXA and Olympus BX-41 polarizing microscopes. Vein microtextures arereviewed following the nomenclature of Bons (2000) and Oliver and Bons (2001).Raman spectra of fracture-filling minerals and fluid inclusions were recorded inpart with a Horiba Jobin Yvone spectrometer connected with an Olympus BX40microscope (Technical University of Budapest), and with a Labram-typespectrometer connected to an Olympus U-D6RE microscope (University ofNantes) using 50× and 100× LWD lenses. The radiating laser source operated at532 nm in the former and at 488 nm in the latter case. The acquisition time waschosen depending on the intensity of the signal, usually 10–30 seconds in thecase of minerals and 60–100 seconds in the case of fluid inclusions, accumulated3–5 times.
Both the highly polished thin sections and the crushed rock surfaces werestudied with a Hitachi S-4700 scanning electron microscope. An acceleratingvoltage of 15–20 kV was used for taking BSE and SE images. EDS spectra wererecorded on the solid inclusions of calcite in Type 2 and prehnite crystals fromvesicles and Type 3 veins.
Representative slices were cut from the veins available for fluid inclusionstudies. Fifteen double polished thick sections (75–150 µm) were prepared fromthe cores. When necessary, the slices were impregnated by epoxy under vacuumat 40 °C for at least 24 hours. The preparation procedure was done following theinstructions of Shepherd et al. (1985).
Prior to microthermometry, fluid inclusion petrography was carried out inorder to classify fluid inclusion assemblages following the criteria of Goldsteinand Reynolds (1994). Microthermometry was carried out using a LinkamTHMSG-600 heating-freezing stage mounted on an Olympus BX-41 microscopeusing LWD lenses with ×100 magnification. The stage was calibrated usingsynthetic fluid inclusions trapped in quartz with an opened sample containerand covered with a silver lid at –56.6, 0.0 and 374 °C. The accuracy of themeasurements was ±0.1 °C below and ±1 °C above 0 °C. The homogenizationtemperature was usually determined only with the cycling method (Goldsteinand Reynolds 1994). The salinities of the aqueous inclusions are reported inmass% of NaCl equivalent following the calculated values of Goldstein andReynolds (1994). The salinities were calculated from the final ice meltingtemperatures Tm(Ice). The concentrations of methane in the methane-bearinginclusions are not known, so the possible effects of the dissolved methane andthe methane-hydrate-clathrate to the salinity could not be taken into account.
Paleofluid evolution of the fractured basalt hydrocarbon reservoir in the Üllés–Ruzsa–Bordány area 303
Central European Geology 52, 2009
The salinities of the present study are therefore maximum values (Schubert et al.2007).
Mineral chemistry measurements were made in the Eugen F. Stumpfl electronmicroprobe laboratory at the Montanuniversität Leoben with a JEOL JXA 8200Superprobe. Quantitative analyses were carried out with a 10 nA beam currentand 15 kV accelerating voltage. The beam diameter was 1 µm and theaccumulation time was 10 sec for the peaks and 4 sec for the background. Thedetection limit was 0.1–0.02% in the case of Si, Al, Ti, Fe, Mg, Ca, Na, K and Mn.International mineral standards were used to quantitatively interpret theelements. ZAF correction was used to correct each measurement. Chloriteformulae were calculated based on 28 oxygens and with Fe2+/Fe3+ calculatedassuming full-site occupancy similar to those followed by Rivas-Sanchez et al.(2006) in a similar geologic system.
Computed Tomography (CT) offers the possibility of a deep textural andpetrographic investigation of a core sample in a non-destructive way. The CTequipment uses X-ray for recording, and the reconstructed image shows thebeam-weakening quality of the sample in every voxel represented by a matrix ofHounsfield Units (HU). The calculated HU values can be visualized by gray-scaleimaging. The core sample from the Üllés-36 well was put under vacuum for 6hours and then saturated with water before the CT-measurement. The CTmeasurements were carried out on Siemens Somatom S40 Spiral CT equipmentin the Diagnostic Institute in the University of Kaposvár. Scanning wasperformed in 2-mm steps.
The pressure-temperature (P-T) conditions of the observed equilibrium mineralassemblages can be calculated using the thermodynamic properties of theminerals (Holland and Powell 1998) using WinDomino Software (De Capitaniand Brown 1987; De Capitani 1994). THERIAK modul calculates the minimumGibbs energy assemblage at a given P-T point, and DOMINO modul does it for agiven P-T area in the case of a chemically closed system.
The minerals in the present study are abbreviated according to Kretz (1983),except for mesolite.
Results
Host rock
In the study area the thickest series of volcanic rocks (186 meters) waspenetrated by well Üllés-36. In the area of Ruzsa, the KBF was drilled between2,500 and 2,900 meters, while in the Bordány-Üllés area basalt occurs between2,200 and 2,650 meters (Table 1).
Based on macroscopic observations, the vast majority of the samples representpyroclastic rocks, while lava rocks are subordinate and occur only in the area ofÜllés and Bordány (Fig. 2a and b) (Table 1). The rounded lapilli of the pyroclasticrock samples have vitrophyric rims in places. Angular fragments from the
304 B. Szabó et al.
Central European Geology 52, 2009

intercalated marl layers are mixed up with lapilli in several places (Fig. 2a).Among the volcanic blocks, lapilli and smaller grains, the remnant space is filledwith a fine fraction of volcanic ash and a clay mineral matrix (Fig. 2a). In thecontact zones, the volcanic material is mixed with the fine fraction of the marinesediment (Fig. 3a). Occasionally, cement minerals (clay, carbonate and zeoliteminerals) are precipitated among the lapilli and the smaller grains of thepyroclastic rocks (Fig. 3b). In places the volcanic rock contains marl inclusions, aswas also observed by Balázs and Nusszer (1987). The loose, crumbly characterand lighter color of the pyroclastic rocks and tuffs can be easily distinguishedfrom the dark green, massive lava rocks. The lapilli and blocks of pyroclasticrocks and the lava rock samples are rich in vesicles and amigdaloids. Based onmicroscopic observations the texture of the lava rock is variolitic, spherulitic withphenocrysts and microphenocrysts of plagioclase as well as altered amphiboleand pyroxene crystals (Fig. 4a and b). In some thin sections high limonite content
Paleofluid evolution of the fractured basalt hydrocarbon reservoir in the Üllés–Ruzsa–Bordány area 305
Central European Geology 52, 2009
Fig. 2Representative pyroclastic (a, Ruzsa-18) and lava rock (b, Üllés-36) cores
Fig. 3a) In pyroclastic core samples pore space is typically filled by weathered volcanic material,occasionally mixed with marl along the contact zones (Ruzsa-18); b) At places the pore space amongthe lapillis is filled by minerals (Ruzsa-4)

306 B. Szabó et al.
Central European Geology 52, 2009
Fig. 4a) Üllés-36, 1N) and b) Ruzsa-12, +N) Spherulitic texture and the main components of basalt
appears as brown patches in the matrix (Fig. 4a). The chloritized and carbonatedclinopyroxene phenocrysts appear as pseudomorphs in most cases (Fig. 4b), butin some places fresh clinopyroxene crystals can also be found. In addition to thechloritization of mafic phenocrysts, chlorite is the principal cement phase in thevesicles (Figs 4b and 5a). It is extremely fine-grained, and appears as green tobrown in thin section as the replacement mineral of the glassy matrix and maficphenocrysts. Several samples contain fine-grained pyrite crystals scattered in thematrix or in vesicles followed by chlorite.
The lapilli and the lava rock samples are very rich in vesicles with mostlyspherical or irregular shapes scattered in the rock without any preferredorientation (Fig. 2b). Away from the veins, most vesicles are filled partly or fullywith chlorite, or with quartz and prehnite followed by chlorite crystals. In thevesicles, chlorite occurs with a different morphology and color. The fine-grainedbrownish-green type is followed by dark green grains, radial aggregates of smallgreen needles and finally light green fans of fibers (Fig. 5a). In places vesicles arecompletely filled by calcite, containing chlorite zones (Fig. 5b). These zones havedifferent orientations in the neighboring vesicles. The CT measurements showthat the vesicles near the fractures are filled, but away from them the vesicles areusually empty (Fig. 5c). Along the veins, inside a zone a couple of centimeterswide, the vesicles are full of different fracture-filling minerals (Fig. 5c, d and e).
Veins
Based on their host rock, occurrence, vein microstructure and cement minerals,four distinct vein types can be distinguished in the studied cores usingmicroscopy, SEM and Raman microspectroscopy (Table 2).
Type 1 veins could be identified only inside the lapilli of pyroclastic rocksamples. The narrow veins (with a maximum aperture of 2 mm) crosscut thelapilli, but the end at their edges (Fig. 6a). Euhedral K-feldspar crystals grow fromthe vein wall towards the center of the vein followed by idiomorphic quartz andalbite crystals (Fig. 6b). The remnant volume was filled by laumontite and inplaces calcite (Fig. 6c). Based on the growth directions of the K-feldspar, quartzand albite crystals, the microstructure of the vein is syntaxial (Bons 2000; Oliverand Bons 2001) (Fig. 6d).
Paleofluid evolution of the fractured basalt hydrocarbon reservoir in the Üllés–Ruzsa–Bordány area 307
Central European Geology 52, 2009
←Fig. 5a) SEM image of the subsequent chlorite (Chl) phases (Üllés-77), b) Alternating precipitation of calcite(Cc) and chlorite (Chl); black arrows show the growth direction inside the vesicles (Üllés-43), c) CTimage of a Üllés-36 core sample from 2,266 m: vesicles are filled by minerals near to the vein and areempty a little further away from it. The diameter of the core sample is 10 cm, d) The same in the coresample from Üllés-77. Dashed line represents the border of the affected and unaffected zones. In theaffected zone the vein-filling laumontite (Lmt) precipitated on chlorite (Chl) in the vesicles. In theunaffected zone the vesicles remained empty after an initial chlorite lining, e) Sketch shows that therock away from the veins was not affected by the mother fluid of the fracture-filling minerals and isdevoid of these minerals; near the veins the appearance of these minerals can be observed

308 B. Szabó et al.
Central European Geology 52, 2009
Table 2Vein types
Fig. 6Characteristics of vein Type 1. a) Macroscopic appearance of the vein in a lapillus from the Ruzsa-21well, b) Microscopic appearance of the vein (Kfs–K-feldspar, Qtz–quartz, Ab–albite, Lmt–laumontiteand Cc–calcite) (Ruzsa-21), c) Vein and vesicle-filling minerals in a lapillus (Ruzsa-21), d) Typicalgrowth pattern of the syntaxial vein texture is indicated on the sketch modified after Oliver and Bons(2001)

The rare, narrow (up to 3-6 mm) veins of Type 2 occur exclusively in lava rocksamples. They are subvertical with a dip of 70–90°. The central parts of thesymmetrical veins are filled with altered volcanic material, while the vein wallsare covered by calcite (Fig. 7a). Mostly, the opposite vein wall planes can be wellfitted. In places, this altered material contains small grains from the wall rock andnarrow calcite microveins, crosscutting the central filling. In the symmetric calcitefilling of the main vein, the number of the calcite grains decreases away from thecentral part, and the faster growing "winner" crystals widen towards the veinwalls at the expense of the "loser" grains (following the nomenclature of Bons2001). Based on the crystallographically-controlled growth competition, thegrowth direction of the calcite crystals points from the central part of the veintowards the vein walls (Bons 2000, 2001; Oliver and Bons 2001) (Fig. 7a inset A).The shape of the calcite crystals is mostly elongated and blocky along the mainvein, except for the stretched, deformed crystals in places (Fig. 7a inset B).
Paleofluid evolution of the fractured basalt hydrocarbon reservoir in the Üllés–Ruzsa–Bordány area 309
Central European Geology 52, 2009
Fig. 7Characteristics of vein Type 2. a) Antitaxial texture of the symmetric calcite (Cc) vein (Bo-2, +N). Thecrystals were widening towards the vein wall as they were growing, as presented in Inset A: thegrowth direction of the calcite crystals (Cc) thus points to the wall rock. Inset B shows the localappearance of heulandite rim (Heu) with the stretched calcite crystals (Cc). b) The appearance of solidinclusion bands (I.b.) and trails (I.t.) in the calcite filling (Cc) indicates the function of the crack-sealmechanism during precipitation of the vein (Bo-2, 1N), c) Sketch of the typical growth pattern of anantitaxial vein (modified after Oliver and Bons 2001)

Between the stretched calcite crystals and the vein wall (up to 50 mm), a narrowasymmetric zeolite (heulandite) rim appears (Fig. 7a Inset B). The calcite crystalscontain several solid inclusions parallel to the vein walls ("inclusion bands") andnormal to them ("inclusion trails") (following the nomenclature of Bons 2000) aswell as bigger slivers from the wall rock (Fig. 7b). These slivers can be well fit toeach other and to the vein wall (Fig. 7b). The EDS spectra show high Fe, Mg, Ca,Al and Si contents in the solid inclusions, suggesting that they originate from thebasaltic wall rock (Fig. 7c). Based on this behavior the microstructure of the veinis antitaxial (Fig. 7c).
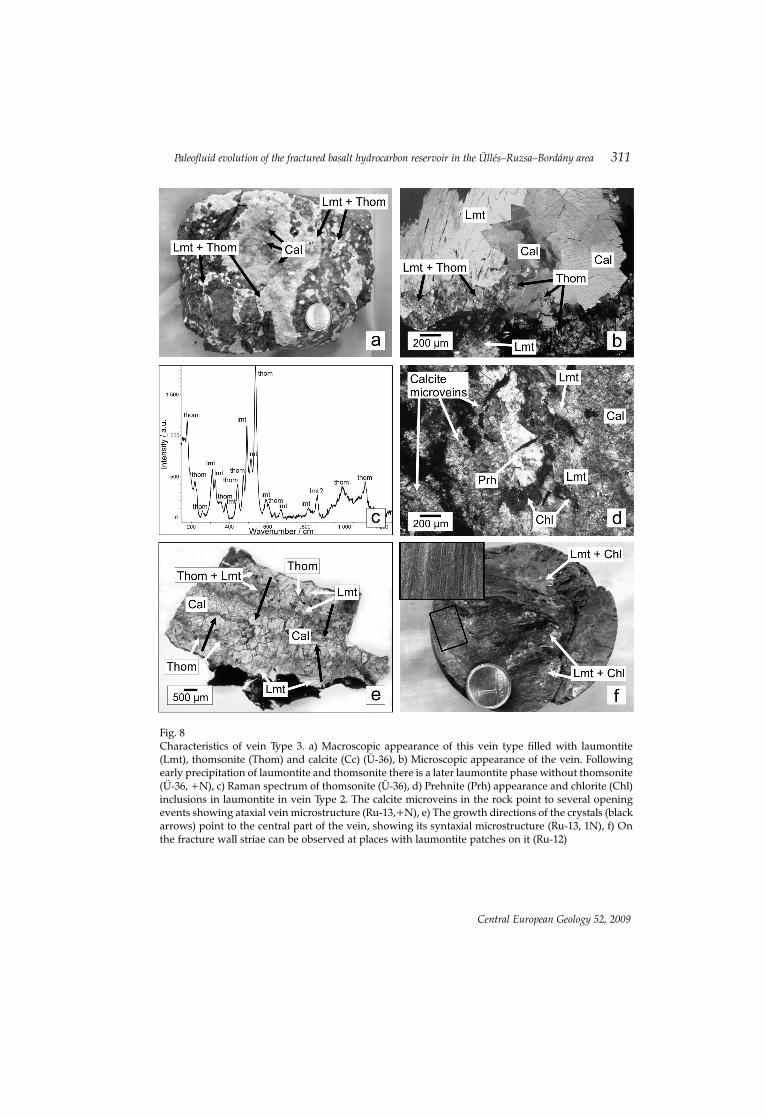
The dense network of Type 3 veins with a maximum aperture of 2 centimetersappears in most samples in the Üllés and Ruzsa areas in both basaltic andpyroclastic rock cores (Fig. 8a). In a few cases they clearly crosscut Type 2 veins.In places within both the Üllés and the Ruzsa areas, grayish-blue prehnitecrystals occur directly on the vein wall (Fig. 8d). Prehnite nodules exhibit a core-rim texture defined by fluid inclusions, suggesting a two-stage growth. Based onEDS analysis the crystals are chemically homogeneous. The rims of the prehnitecrystals in places contain laumontite inclusions, suggesting that laumontitecrystallization started during the last growth stage of prehnite (Fig. 10e). Type 3veins are mostly filled by laumontite and calcite (Fig. 8a and b). Away from thevein wall, the fibrous laumontite crystals usually contain needle-shapedinclusions identified as thomsonite by Raman spectroscopy (Fig. 8c). Thethomsonite inclusion-bearing laumontite phase was followed by pure laumontitefibers and small, blocky calcite crystals growing toward the centers of the veins(Fig. 8e). The late laumontite and calcite cements contain green chlorite crystalsas solid inclusions (Fig. 8d). Many calcite crystals enclose fluid inclusion bandssubparallel to the vein wall (Fig. 10f). Some of the calcite crystals are twinned, butthe thickness of the twins and the direction of twining are different in thecrystals. Based on the growth competition pattern, Type 3 veins show syntaxialvein microstructure (Bons 2000, 2001; Oliver and Bons 2001) (Fig. 8e). In somesamples the sequence of the fracture-filling minerals is not obvious becausecalcite microveins crosscut the laumontite cement and the host rock, parallel tothe laumontite-calcite vein. These microveins and the inclusion bands of thecalcite crystals suggest that the veins opened in several steps in different places(ataxial vein). In places, striae can be observed on the vein wall under thelaumontite fibers (Fig. 8f).
Type 4 veins (with a maximum aperture of 2 centimeters) occur only in thewell-cemented cores of the Üllés-61 well (Fig. 9a). The angular grains of the hostrock show a brecciated structure, and debris of vitrophyric-rimmed lapilli occursamong these rock fragments (Fig. 9a). The vein-filling minerals are mesolite,analcime, heulandite and stilbite (Fig. 9b). The tiny needles of mesolite appear assolid inclusions within the main vein-filling analcime and heulandite crystals.Based on optical observations and Raman spectroscopy on cuttings, we assumethe presence of the same vein type in the Üllés-65/A well.
310 B. Szabó et al.
Central European Geology 52, 2009
Paleofluid evolution of the fractured basalt hydrocarbon reservoir in the Üllés–Ruzsa–Bordány area 311
Central European Geology 52, 2009
Fig. 8Characteristics of vein Type 3. a) Macroscopic appearance of this vein type filled with laumontite(Lmt), thomsonite (Thom) and calcite (Cc) (Ü-36), b) Microscopic appearance of the vein. Followingearly precipitation of laumontite and thomsonite there is a later laumontite phase without thomsonite(Ü-36, +N), c) Raman spectrum of thomsonite (Ü-36), d) Prehnite (Prh) appearance and chlorite (Chl)inclusions in laumontite in vein Type 2. The calcite microveins in the rock point to several openingevents showing ataxial vein microstructure (Ru-13,+N), e) The growth directions of the crystals (blackarrows) point to the central part of the vein, showing its syntaxial microstructure (Ru-13, 1N), f) Onthe fracture wall striae can be observed at places with laumontite patches on it (Ru-12)

Chlorite thermometry
Chlorite is the main vesicle-filling mineral, but chlorite crystals appear in Type3 veins as well, trapped in laumontite and calcite crystals. Four subsequentchlorite types can be distinguished in both vesicles and veins by their color andmorphology (Fig. 5a). Microprobe measurements show different compositionsfor all of these types (Table 3). The Al2O3 and FeO contents increase continuouslyfrom the cores of the aggregates (Chl 1) and become constant in the light greencrystals of the outermost generation (Chl 4) (Fig. 5a). Based on mineral chemistry,the formation temperature can be established with several chlorite solid-solutiongeothermometers. The method of Cathelineau (1988) is based on the empiricalapproach that AlIV in the chlorite structure is correlated with the precipitationtemperature. Kranidiotis (1987) modified the approach of Cathelineau and Nieva(1985) with a correction for the changes of Fe/(Fe+Mg). Jovett (1991) alsomodified the original geothermometer of Cathelineau and Nieva (1985), takinginto account the variation of Fe/ (Fe+Mg) in chlorite.
The estimated formation temperatures represent a warming trend from Chl 1to Chl 3 without any significant change in the last phase (Chl 4) compared to thethird type (Chl 3). Based on the formula of Cathelineau (1988), the temperatureincreased from about 140 °C to 205 °C, from 185 to 220 °C using Kranidiotis (1987)and from 145 to 210 °C based on Jovett (1991), along the precipitation path ofsubsequent chlorite generations. The formulae and calculated temperatures arelisted in Table 3.
312 B. Szabó et al.
Central European Geology 52, 2009
Fig. 9Textural characteristics of vein Type 4. a) Macroscopic appearance of vein Type 4, where the well-cemented fragments are in a brecciated structure. The fragments with dark rims could be the parts ofa lapillus (Ü-61), b) Syntaxial veins are filled with analcime (Ana), mesolite (Meso), heulandite (Hul)and stilbite (Stb) (Ü-61, +N)

Fluid inclusion petrography and microthermometry
Fluid inclusion microthermometry was performed on fracture-filling mineralsof rock samples with a well-defined position in the mineral sequence (Table 4).
In Type 1 veins, K-feldspar, quartz and calcite crystals contain fluid inclusionassemblages those are suitable for microthermometry (Fig. 10a, b and c). The K-feldspar crystals contain low quantities of irregularly-shaped, measurable fluidinclusions. The primary, two-phase (L+V) aqueous inclusions appear isolated inthe small crystals (Fig. 10a) and are homogenized into the liquid phase between142 and 158 °C. The final ice melting temperature of the inclusions is –0.3 °C,
Paleofluid evolution of the fractured basalt hydrocarbon reservoir in the Üllés–Ruzsa–Bordány area 313
Central European Geology 52, 2009
Table 3Chlorite composition data and thermometric calculations
* Representative compositions from the subsequent chlorites (Chl 1-4)** T (°C)=-61.92+321.98*Al(IV)*** T (°C)=106*AlCIV+18, where AlCIV=AlIV+0.7*[Fe/(Fe+Mg)]**** T (°C)=319*AlCIV-69, where AlCIV=AlIV+0.1[Fe/(Fe+Mg)]

314 B. Szabó et al.
Central European Geology 52, 2009
Table 4Summary of fluid inclusion and microthermometric data

suggesting a maximum salinity of 0.53 mass% NaCleq. The two-phase (L+V)aqueous fluid inclusions in the quartz crystals compose extended "clouds" withinthe crystals (primary fluid inclusions) and occur along trails ending at the edgesof the crystals (secondary fluid inclusions). These trails never continue in theneighbouring feldspar or calcite grains. The aqueous inclusions containaccidentally trapped solid particles in places (Fig. 10b). The small sheets oftranslucent amorphous crystals have a light green color under one Nikol. Thehomogenization temperatures (Th) are between 138 and 152 °C in the case ofprimary aqueous inclusions, and between 135 and 151 °C in the case of secondaryaqueous inclusions. The Tm(Ice) of the inclusions is –0.2 °C, suggesting a very lowsalinity (0.35 mass% NaCleq). The negative crystal-shaped, two-phase aqueousinclusions occur in small groups in the calcite crystals (Fig. 10c). These primaryfluid inclusions homogenize into the liquid phase between 137 and 154 °C. TheTm(Ice) of the inclusions is –0.4 °C, suggesting the highest salinity in this veintype (0.71 mass% NaCleq). On the basis of Raman microspectroscopy the two-phased inclusions in the K-feldspar, quartz and calcite crystals, contain methanein the vapor phase at room temperature.
In Type 3 veins, several fluid inclusion assemblages were identified in theprehnite and calcite crystals. There is no fluid inclusion suitable formicrothermometry in laumontite, because the single-phase (L) inclusions usuallydecrepitate at room temperature, presumably due to the "open-structure" of thecrystals (Juhász et al. 2002) (Fig. 10d). The dark cores of the prehnite crystals arethe result of the tiny primary two-phase aqueous fluid inclusions appearing inlarge quantities (Fig. 10e). The inner zone is crosscut by trails of secondary two-phase aqueous fluid inclusions. The primary aqueous inclusions homogenizeinto the liquid phase between 130 and 181 °C, while the temperature of final icemelting is –0.5 °C, suggesting a salinity of 0.88 mass% NaCleq. The primaryinclusions contain methane in the vapor phase at room temperature, identifiedby Raman microspectroscopy. Some less twinned calcite crystals contain one-phase (L) and two-phase (L+V) aqueous fluid inclusion bands parallel to the veinwall (Fig. 10f), which can be regarded as primary inclusions in the case of ataxialvein microstructure. These inclusions are too small (<5 µm) for microthermo-metric measurements. The parallel bands are crosscut by two-phase (L+V),aqueous inclusion trails (secondary inclusions) (Fig. 10f), and homogenizebetween 135 and 150 °C into liquid phase. Based on Raman microspectroscopy,the two-phase aqueous inclusions of calcite contain no methane.
Paleofluid evolution of the fractured basalt hydrocarbon reservoir in the Üllés–Ruzsa–Bordány area 315
Central European Geology 52, 2009
← Fig. 10Fluid inclusions in the fracture-filling minerals. a) Primary, irregularly-shaped aqueous inclusion in K-feldspar (Type 1) (Ru-21, 1N), b) Primary, three-phase aqueous inclusions in quartz (Type 1) (Ru-21,1N), c) Primary, negative crystal-shaped aqueous inclusions in calcite (Type 1) (Ru-21, 1N), d) One-phase and decrepitated inclusions in laumontite (Type 3) (Ru-13, 1N), e) Crowd of primary two-phased aqueous inclusions in the inner zone of a prehnite crystal. Laumontite (Lmt) inclusions in theouter zone are also observable (Type 3) (Ü-36,1N), f) Bands of primary (P) one-phase inclusions andtrails of secondary (S) two-phase inclusions in a calcite crystal (Type 3) (Ru-13, 1N)
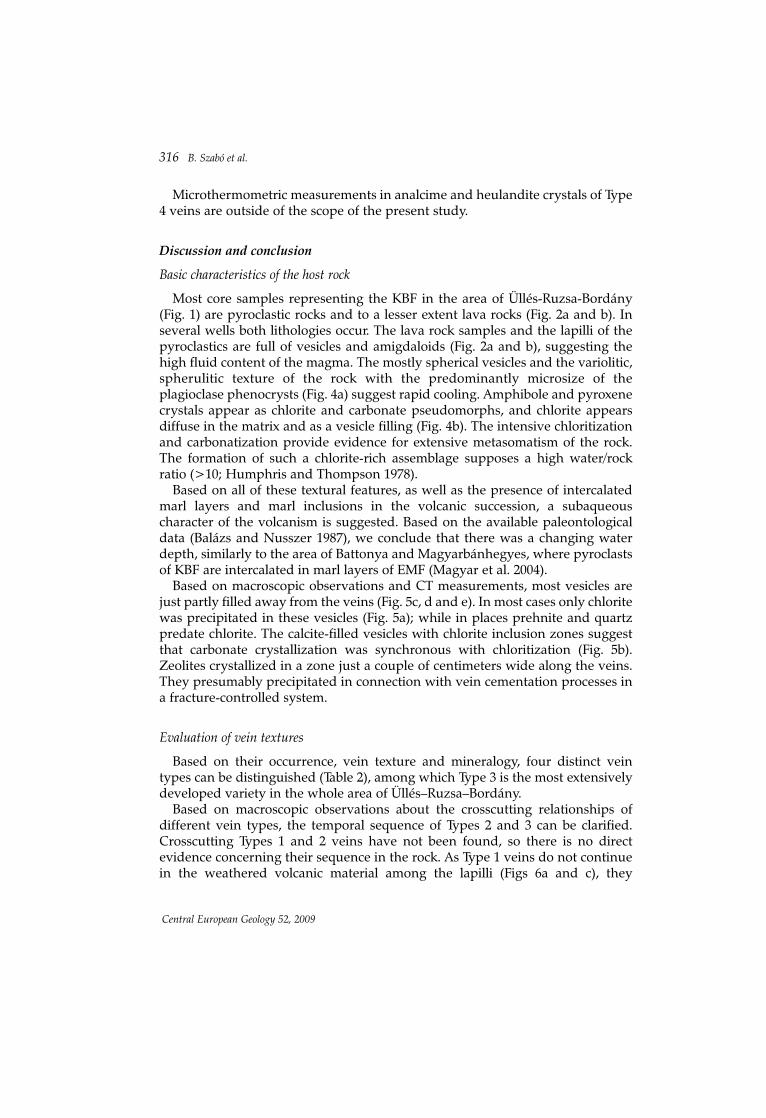
Microthermometric measurements in analcime and heulandite crystals of Type4 veins are outside of the scope of the present study.
Discussion and conclusion
Basic characteristics of the host rock
Most core samples representing the KBF in the area of Üllés-Ruzsa-Bordány(Fig. 1) are pyroclastic rocks and to a lesser extent lava rocks (Fig. 2a and b). Inseveral wells both lithologies occur. The lava rock samples and the lapilli of thepyroclastics are full of vesicles and amigdaloids (Fig. 2a and b), suggesting thehigh fluid content of the magma. The mostly spherical vesicles and the variolitic,spherulitic texture of the rock with the predominantly microsize of theplagioclase phenocrysts (Fig. 4a) suggest rapid cooling. Amphibole and pyroxenecrystals appear as chlorite and carbonate pseudomorphs, and chlorite appearsdiffuse in the matrix and as a vesicle filling (Fig. 4b). The intensive chloritizationand carbonatization provide evidence for extensive metasomatism of the rock.The formation of such a chlorite-rich assemblage supposes a high water/rockratio (>10; Humphris and Thompson 1978).
Based on all of these textural features, as well as the presence of intercalatedmarl layers and marl inclusions in the volcanic succession, a subaqueouscharacter of the volcanism is suggested. Based on the available paleontologicaldata (Balázs and Nusszer 1987), we conclude that there was a changing waterdepth, similarly to the area of Battonya and Magyarbánhegyes, where pyroclastsof KBF are intercalated in marl layers of EMF (Magyar et al. 2004).
Based on macroscopic observations and CT measurements, most vesicles arejust partly filled away from the veins (Fig. 5c, d and e). In most cases only chloritewas precipitated in these vesicles (Fig. 5a); while in places prehnite and quartzpredate chlorite. The calcite-filled vesicles with chlorite inclusion zones suggestthat carbonate crystallization was synchronous with chloritization (Fig. 5b).Zeolites crystallized in a zone just a couple of centimeters wide along the veins.They presumably precipitated in connection with vein cementation processes ina fracture-controlled system.
Evaluation of vein textures
Based on their occurrence, vein texture and mineralogy, four distinct veintypes can be distinguished (Table 2), among which Type 3 is the most extensivelydeveloped variety in the whole area of Üllés–Ruzsa–Bordány.
Based on macroscopic observations about the crosscutting relationships ofdifferent vein types, the temporal sequence of Types 2 and 3 can be clarified.Crosscutting Types 1 and 2 veins have not been found, so there is no directevidence concerning their sequence in the rock. As Type 1 veins do not continuein the weathered volcanic material among the lapilli (Figs 6a and c), they
316 B. Szabó et al.
Central European Geology 52, 2009

presumably formed before the consolidation of the pyroclastic sediment. Thealtered volcanic material is the first vein-filling substance in Type 2 veins of themassive basalt (Fig. 7a). Although there are no textural data about their agerelationships, both Type 1 and Type 2 veins formed prior to significant diagenesisof the pyroclastic material, so they must be about the same age.
Under the microscope Type 1 veins exhibit a syntaxial texture, because thegrowth direction of the K-feldspar and quartz crystals points from the fracturewall to the center of the vein (Fig. 6b) (Bons 2000). In the case of this texture type,the transport mechanism of the host-fluid was presumably advection (Bons 2000;Oliver and Bons 2001), so a fracture-controlled fluid flow can be assumed at thetime of K-feldspar and quartz cementation in Type 1. Based onmicrothermometric measurements K-feldspar and quartz crystals precipitatedfrom source fluids with low salinity (0.53 mass% NaCleq in the case of K-feldspar;0.35 mass% NaCleq in the case of quartz), while calcite crystallization happenedfrom a fluid with a somewhat higher salinity (0.71 mass% NaCleq) (Table 4).
The well-fitted vein wall planes and the massive host rock suggest thatweathered volcanic material with tiny rock grains did not arise from in situweathering, but was transported there by advection after fracturing. The calcitecrystals of this vein type nevertheless show a well-developed antitaxial texture(Fig. 7a) (Bons 2000, 2001; Bons and Montenari 2005). This texture is interpretedby several authors (Durney and Ramsay 1973; Fisher and Barntley 1992; Bonsand Jessel 1997) as a result of precipitation from fluid diffusing through the wallrock. Hilgers et al. (2001) disagree with this explanation because their digitalsimulations on vein formation show that the antitaxial texture of fibrous crystalscould be the result of advective transport. In Type 2 veins, the length/width ratioof calcite crystals is less than 10, so the shapes of the crystals are elongate blockyrather than fibrous. The elongate blocky microstructure indicates thatcrystallization occurred in fluid-filled cracks. The "bands" and "trails" of solidinclusions originated from the wall rock are evidence for a crack-seal mechanism,i.e. several alternating microscale opening and healing events had to happen inthe veins (Fig. 7b) (Ramsay and Huber 1987). This mechanism was modeled byHilgers et al. (2001), using the digital approach of Bons (2001). The modelsuggests that if veins exhibit textural features of both crack-seal mechanism andgrowth competition, the size of each incremental opening episode had to besmaller than about 10 µm. The presence of solid inclusions and slivers from thewall rock in calcite are evidence against advection as a main procedure and makediffusion in the rock matrix more likely, because in the case of advection, waterwould carry away these small fragments (Fig. 7b). The local appearance ofstretched calcite crystals and the narrow heulandite rim makes a later re-openingevent probable in the Type 2 veins (Fig. 7a inset B).
The texture of Type 3 is syntaxial (Fig. 8e), pointing to an advection event at thetime of cementation. In the case of Type 3 veins advection in open fractures issupported by the extensive appearance of laumontite crystals. Their shape and
Paleofluid evolution of the fractured basalt hydrocarbon reservoir in the Üllés–Ruzsa–Bordány area 317
Central European Geology 52, 2009
orientation suggest growth in suddenly opened fractures (Juhász et al. 2002). Thelatest calcite microveins (Fig. 8d) and the parallel fluid inclusion bands in calcitecrystals (Fig. 10f) suggest an ataxial texture (Bons 2000). The vein opened in thiscase in several subsequent steps, and the precipitation of calcite was not fracture-controlled. The ataxial texture implies diffusion as the main transport mechanismduring precipitation of the last calcite phase. The dominant Type 3 veins alsoexhibit a dense fracture network in pyroclastic and lava rock samples (Fig. 8a).The veins of the pyroclastic core samples crosscut the lapilli and the matrix,suggesting brittle deformation of the rock after compaction of the pyroclasticstrata. Striae can be observed rarely on the vein walls, suggesting motion ofblocks along the opened fractures before laumontite precipitation (Fig. 8f).
Thermal evolution
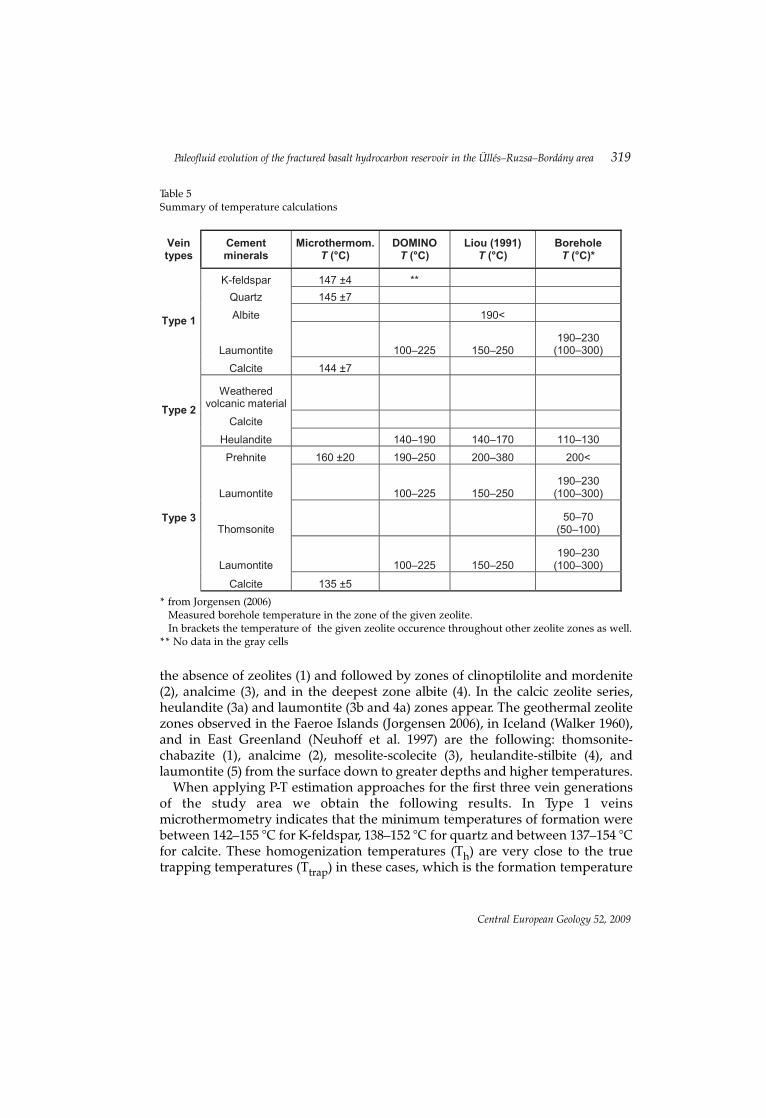
On the basis of the sequence of fracture-filling minerals (Table 2), the P-Tstability of the subsequent minerals can be calculated by the WinDominomodeling system using the thermodynamic database of Holland and Powell(1998). These results could be compared to and completed by the estimations ofLiou et al. (1991) for the P-T stability fields of different zeolites, and bytemperature data from fluid inclusion microthermometric measurements as wellas borehole temperature measurements (Jorgensen 2006) (Table 5).
The sequence of zeolites could be used as an indicator of changingpaleotemperature, as was reported from different volcanic provinces (Coombs etal. 1959; Neuhoff et al. 1997; Jorgensen 2006). Jorgensen (2006) shows that theregional zeolite distribution pattern reflects primarily variations in the maximumdepth of burial of the basalt rather than differences in heat flow. It is possible touse a reference area with different heat flow values to compare the measuredtemperatures with our temperature calculations. In order to use zeolites aspaleotemperature indicators it must be established that the formation of theseminerals is nearly independent of pressure, provided that the pressure is notextremely high and the temperature is below the critical temperature of water(374 °C). On the other hand the appearance of diverse zeolite phases is notindependent of the chemical composition of the rock itself. Barth-Wirsching andHöller (1989) confirm that in order to compare zeolite zonation patterns,choosing a reference area with similar chemical compositions is crucial. Theformation of zeolite zones could be associated with geothermal areas or could bethe result of a burial diagenetic alteration of the basaltic rock. The burialdiagenetic type of zeolite zonation has been described by Hay (1978), whodistinguished four subsequent zones. The first zone (altered glass zone) ischaracterized by the absence of zeolites (1) and is followed downward by theclinoptilolite (2), analcime and heulandite (3) and laumontite and albite (4) zones.Iijima (1988) defined four zones in marine environments. The burial diagenetictype of zeolite zonation in the case of the sodic reaction series is characterized by
318 B. Szabó et al.
Central European Geology 52, 2009
the absence of zeolites (1) and followed by zones of clinoptilolite and mordenite(2), analcime (3), and in the deepest zone albite (4). In the calcic zeolite series,heulandite (3a) and laumontite (3b and 4a) zones appear. The geothermal zeolitezones observed in the Faeroe Islands (Jorgensen 2006), in Iceland (Walker 1960),and in East Greenland (Neuhoff et al. 1997) are the following: thomsonite-chabazite (1), analcime (2), mesolite-scolecite (3), heulandite-stilbite (4), andlaumontite (5) from the surface down to greater depths and higher temperatures.
When applying P-T estimation approaches for the first three vein generationsof the study area we obtain the following results. In Type 1 veinsmicrothermometry indicates that the minimum temperatures of formation werebetween 142–155 °C for K-feldspar, 138–152 °C for quartz and between 137–154 °Cfor calcite. These homogenization temperatures (Th) are very close to the truetrapping temperatures (Ttrap) in these cases, which is the formation temperature
Paleofluid evolution of the fractured basalt hydrocarbon reservoir in the Üllés–Ruzsa–Bordány area 319
Central European Geology 52, 2009
* from Jorgensen (2006) Measured borehole temperature in the zone of the given zeolite.In brackets the temperature of the given zeolite occurence throughout other zeolite zones as well.
** No data in the gray cells
Table 5Summary of temperature calculations

of the mineral phases (Schubert et al. 2007). If the liquid phases of these methane-bearing aqueous inclusions are saturated with methane-rich vapor uponinclusion entrapment, then Th= Ttrap (Schubert et al. 2007). If the liquid phase isundersaturated with respect to methane, then Th < Ttrap, but for a typical oil-reservoir setting and degree of undersaturation like this case, the differencebetween Th and Ttrap is minor (<10 °C; Schubert et al. 2007). The main fracture-filling mineral of Type 2 is calcite, which has an extremely wide stability zone inP-T space. As there are no fluid inclusions available for microthermometry in thiscalcite phase, the conditions of calcite precipitation cannot be estimated.Heulandite appears after a later microscale re-opening of Type 2. It is stable at lowpressure (below 500 bars) and between 140 and 190 °C (WinDomino modeling),while based on Liou et al. (1991), its temperature stability is between 140–170 °C.The minimum temperature of the heulandite zone, examined in a number ofboreholes in the geothermal areas of Iceland, is about 110–130 °C. The fracturesin the lapilli and in the massive basalt, where the minerals of Types 1 and 2precipitated later, were presumably the results of early cooling of the rock shortlyafter volcanism in the area. Their cementation occurred at around 135–155 °C inthe unconsolidated volcanoclastic sediment.
In Type 3 veins, the presence of prehnite indicates T = 190–250 °C calculated byWinDomino, and 200–380 °C at low pressures (< 3 kbars) according to Liou et al.(1991). Based on microthermometry, the minimum temperature of prehniteprecipitation was between 130 and 181 °C (Th), and according to the methanecontent of the aqueous inclusions, the Th values are very close to the truetrapping temperature (Ttrap) (min. <10 °C; Schubert et al. 2007). The followingmineral is laumontite, which is the highest-temperature zeolite phase in theobserved vein-filling sequence (Walker 1960; Hay 1978; Iijima 1988; Neuhoff et al.1997; Jorgensen 2006). The average temperature of the laumontite zone examinedin a number of boreholes in Iceland is about 190–230 °C (Jorgensen 2006), but itappears in every zone where the temperature is above 100 °C and below 300 °C.Laumontite is stable between 100 and 225 °C (WinDomino), and between 150 and250 °C based on the experimental work of Liou et al. (1991). Assuming an openchemical system, decreasing CO2-fugacity may also play an important roleduring the precipitation of prehnite and laumontite (Liou et al. 1991; Juhász et al.2002). While for laumontite precipitation low CO2-fugacity is required, for calcitea significantly higher CO2 content is advantageous in the fractures. Thomsoniteis an index mineral of the low-temperature zeolite zones (Walker 1960; Neuhoffet al. 1997; Jorgensen 2006). The typical temperature of the thomsonite zonemeasured in many boreholes in Iceland is between 50 and 90 °C, and this mineralalways appears below 100 °C (Jorgensen 2006). The stability conditions ofthomsonite cannot be modeled by DOMINO because heat capacity data are notavailable.
Concluding the thermal history of the fractured rock, during the cementationof veins Types 1 and 2 no significant change in temperature can be implied. The
320 B. Szabó et al.
Central European Geology 52, 2009

minerals precipitated in fractured lapilli before the final consolidation of thevolcanic sediment at around 140–155 °C (Type 1). The calcite of Type 2 crystallizedin the fractures of basalt just following it was filled by altered volcanic material.The earliest cement phases in Type 3 veins from prehnite to thomsonite clearlysuggest a cooling trend during fracture cementation from around 160 °C to50–70 °C. However, the next phases, crystals of late laumontite and chloriteaggregates among them, suggest an increasing temperature for the late evolutionto the temperature of 150–225 °C on the basis of the temperature stability oflaumontite. Based on chlorite thermometry data, reheating temperaturesreached as high as ~220 °C.
Laumontite is the most characteristic zeolite mineral in the whole Üllés-Ruzsa-Bordány area. Although the present depth of the KBF is different in the twoareas, the dominant vein type is the laumontite-calcite cemented Type 3 in bothcases. These veins are typical between 2,530 and 2,900 meters of depth in theRuzsa area, and between 2,200 and 2,650 meters of depth in the Üllés area.Compared to recent geothermal fields, a 700 meter-thick zone is usually notcharacterized by the presence of a single zeolite phase only. For the studiedsubaqueous volcanic sequence a burial diagenetic type of zeolite zonation issuggested instead. The present stratigraphic position of the volcanic rocksprovides direct evidence for the subsidence being covered by more than 2,000meters of Pannonian to younger sediments. On the other hand, the presentborehole temperatures do not exceed 130–150 °C, which is at least 70 °C lowerthan the calculated temperatures for the cementation of Type 3 veins. All theseresults suggest that after the basaltic complex subsided and reached its maximaltemperature, it had to cool down. Detailed study of the complex effect ofsignificant upraise, termination of postvolcanic hydrothermal activity anddecreasing geothermal gradient in a more regional context is beyond the scope ofthe present paper. The lack of hydrocarbon inclusions in the first three vein typessuggests that appearance of oil in the fractured system must postdate opening ofnew fractures and precipitation of Type 4 veins.
Acknowledgements
The authors thank MOL Ltd. for their financial support of the project, BalázsKiss and Katalin Milota for their fruitful discussion and information, and AndrásNusszer and Bernadette Cs. Meszéna for thin sections. Special thanks go to TamásFöldes for the CT measurement. The comments of the two reviewers are alsogratefully acknowledged.
ReferencesBalázs, E., A. Nusszer 1987: Magyarország medenceterületeinek kunsági (pannóniai s. str.)
emeletbeli vulkanizmusa (Unterpanno- nischer Vulkanismus der Beckengebiete Ungarns). –Magyar Állami Földtani Intézet Évkönyve, 69, pp. 95–113. (In Hungarian.)
Paleofluid evolution of the fractured basalt hydrocarbon reservoir in the Üllés–Ruzsa–Bordány area 321
Central European Geology 52, 2009

Barth-Wirsching, U., H. Höller 1989: Experimental studies on zeolite formation conditions. – TheEuropean Journal of Mineralogy, 1, pp. 498–506.
Bons, P.D. 2000: The formation of veins and their microstructures. – Journal of Virtual Explorer, 2.Bons, P.D. 2001: Development of crystal morphology during antitaxial growth in a progressively
widening vein: I. The numerical model. – Journal of Structural Geology, 23, pp. 865–872.Bons, P.D., M.W. Jessel 1997: Experimental simulation of the formation of fibrous veins by localised
dissolution-precipitation creep. – Mineralogical Magazine, 61, pp. 53–63.Bons, P.D., M. Montenari 2005: The formation of antitaxial calcite veins with well-developed fibers,
Oppaminda Creek, South Australia. – Journal of Structural Geology, 27, pp. 231–248.Cathelineau, M. 1988: Cation site occupancy in chlorites and illites as a function of temperature. –
Clay Minerals, 23, pp. 471–485.Cathelineau, M., D. Nieva 1985: A chlorite solid solution geothermometer. The Los Azufres
Geothermal System (Mexico). – Contrib. Mineral. Petr., 91, pp. 235–244.Coombs, D.S., A.J. Ellis, W.S. Fyfe,. A.M. Taylor 1959: The zeolite facies, with comments on the
interpretation of geothermal syntheses. – Geochimica et Cosmochimica Acta, 17, pp. 53–107.Cserepesné, M.B. 1978: A Kiskunhalas-Ny-3. szénhidrogénkutató fúrással feltárt alsó-pannóniai
bazalt és proterozoi migmatit képzõdményekrõl (About the Lower Pannonian basaltic andProterozoic migmatite rocks drilled by Kiskunhalas-Ny-3 hydrocarbon exploration borehole). –Földtani Közlöny, 108/1, pp. 53–64. (In Hungarian.)
Császár, G. 1997: Magyarország litosztratigráfiai alapegységei (The Lithostratigraphic Units ofHungary.). – Magyar Rétegtani Bizottság, Budapest.
De Capitani, C. 1994: Gleichgewichts-Phasendiagramme: Theorie und Software. – Beihefte zumEuropean Journal of Mineralogy, 72. Jahrestagung der Deutschen MineralogischenGesellschaft, 6, pp. 48.
De Capitani, C., T.H. Brown 1987: The computation of chemical equilibrium in complex systemscontaining non-ideal solutions. – Geochimica et Cosmochima Acta, 51, pp. 2639–2652.
Gajdos, I., S. Pap, A. Somfai, L. Völgyi 1983: Az alföldi pannóniai (s. l.) képzõdményeklitosztratigráfiai egységei (Lithostratigraphic units of the Pannonian s. l. formations in theHungarian Plain). – MÁFI kiadvány, Budapest, pp. 28–33. (In Hungarian.)
Goldstein, R.H., T.J. Reynolds 1994: Systematics of fluid inclusions in diagenetic minerals. – SEPMShort Course 31., Society of Sedimentary Geology, 203 p.
Durney D.W., J.G. Ramsay 1973: Incremental strains measured by syntectonic crystal growth. – In:de Jong, K.A., R. Scholten (Eds): Gravity and Tectonics, Wiley, New York, pp. 67–96.
Fisher, D.M., S.L. Brantley 1992: Models of quartz overgrowth and vein formation: deformation andepisodic fluid flow in an ancient subduction zone. – J. of Geophysical Research, 97, (B13), pp. 20043–20061.
Hanor, J.S. 1980: Dissolved methane in sedimentary brines; potential on the PVT properties of fluidinclusions. – Econimic Geology, 75, pp. 603–617.
Hay, R.L. 1978: Geologic occurrence of zeolites. – In: Sand, L.B., F.A. Mumpton (Ed.): NaturalZeolites, Occurrence, Properties, Use. Pergamon Press, Oxford, pp. 135–143.
Hilgers, C., D. Koehn, P.D Bons., J.L. Urai 2001: Development of crystal morphology during unitaxialgrowth in a progressively widening vein: II. Numerical simulations of evolution of antitaxialfibrous veins. – Journal of Structural Geology, 23, pp. 873–885.
Holland, T.J.B., R. Powell 1998: An internally consistent thermodynamic data set for phases ofpetrological interest. – Journal of Metamorphic Geology, 16, pp. 309–343.
Humphris, S.E., G. Thompson 1978: Hydrothermal alteration of oceanic basalts by seawater. –Geochimica et Cosmochimica Acta, 42, pp. 107–125.
Iijima, A. 1988: Application of zeolites to petroleum exploration. – In: Kalló, D., H.S. Sherry (Ed.):Occurrence, properties and utilization of natural zeolites. Akadémiai Kiadó, Budapest, pp.29–37.
322 B. Szabó et al.
Central European Geology 52, 2009

Jovett, E.C. 1991: Fitting iron and magnesium into the hydrothermal chlorite geothermometer. –GAC/MAC/SEG Joint Annual Meeting (Toronto, May 27–29, 1991) Program with Abstracts 16,A62.
Jorgensen, O. 2006: The regional distribution of zeolites in the basalts of the Faroe Islands andsignificance of zeolites as paleotemperature indicators. – In: Chalmers, J.A., R. Waagstei (Ed.)Scientific results from the deepened Lopra-1 borehole, Faroe Islands. Geological Survey ofDenmark and Greenland Bulletin, 9, pp. 123–144.
Juhász, A., T.M. Tóth, K. Ramseyer, A. Matter 2002: Connected fluid evolution in fracturedcrystalline basement and overlying sediments, Pannonian Basin, SE Hungary. – ChemicalGeology, 182, Akadémiai Kiadó, Budapest, pp. 91–120.
Kranidiotis, P., W.H. MacLean 1987: Systematics of chlorite alteration at the Phelps Dodge MassiveSulfide Deposit, Matagami, Quebec. – Economic Geology, 82, pp. 1898–1911.
Kretz, R. 1983: Symbols for rock-forming minerals. – American Mineralogist, 68, pp. 277–279.Liou, J.G., C. De Capitani, M. Frey 1991: Zeolite equilibria in the system CaAl2Si2O8 – NaAlSi3O8 –
SiO2 – H2O. – New Zealand Journal of Geology and Geophysics, 34, pp. 293–301.Magyar, I., Gy. Juhász, A. Szurominé Korecz, M. Sütõné SzentaiI 2004: A pannóniai Tótkomlósi
Mészmárga Tagozat kifejlõdése és kora a Battonya–pusztaföldvári-hátság környezetében (TheTótkomlós Calcareous Marl Member of the Lake Pannon sedimentary sequence in theBattonya–Pusztaföldvár region, SE Hungary). – Földtani Közlöny, 134/4, pp. 521–540. (InHungarian with English abstract.)
Neuhoff, P.S., W.S. Watt, D.K. Bird, A.K. Pedersen 1997: Timing and structural relations of regionalzeolite zones in basalts of the East Greenland continental margin. – Geology, 25, pp. 803–806.
Oliver, N.H.S., P.D. Bons 2001: Mechanisms of fluid-flow and fluid-rock interaction in fossilmetamorphic hydrothermal systems inferred from vein-wallrock patterns, geometry andmicrostructure. – Geofluids, 1, pp. 137–162.
Pap, S. 1983: Alsó-pannóniai bazaltvulkanizmus Balástya és Üllés-Ruzsa-Zákányszék térségében(Lower Pannonian basalt volcanism in the Balástya and Üllés-Ruzsa-Zákányszék areas). –Földtani Közlöny, 113/2, pp. 163–170. (In Hungarian.)
Ramsay, J.G., M.I. Huber 1987: The Techniques of Modern Structural Geology. Vol. 2: Folds andFractures. – Academic Press Inc (London) Ltd. 392 p.
Rappensberger, Cs. 1991: Mineralogical identification of zeolites in a deep-drilling core. Thesis. –Department of Mineralogy, University of Veszprém. 113 p.
Rivas-Sanchez, M.L., L.M. Alva-Valdivia, J. Arenas-Alatorre, J. Urrutia-Fucugauchi, M. Ruiz-Sandoval, M.A. Ramos-Molina 2006: Berthierine and chamosite hydrothermal: genetic guidesin the Pena Colorada magnetite-bearing ore deposit, Mexico. – Earth Planets Space, 58, pp.1389–1400.
Schubert, F., L.W. Diamond, T.M. Tóth 2007: Fluid-inclusion evidence of petroleum migrationthrough a buried metamorphic dome in the Pannonian Basin, Hungary. – Chemical Geology,244, pp. 357–381.
Shepherd, T. J., A.H. Rankin, D.H.L. Alderton 1985: A Practical Guide to Fluid Inclusion Studies. –Blackie and Son Ltd., 239 p.
Walker, G.P.L. 1960: Zeolite zones and dike distribution in relation to the structure of the basalts ineastern Iceland. – Journal of Geology, 68, pp. 515–528.
Wheeler, R.S., P.R.L. Browne, K.A. Rogeres 2001: Iron-rich and iron-poor prehnites from Way Linggoepithermal Au-Ag deposit, southwest Sumatra, and the Heber geothermal field, California. –Mineralogical Magazine, 65, pp. 397–406.
Paleofluid evolution of the fractured basalt hydrocarbon reservoir in the Üllés–Ruzsa–Bordány area 323
Central European Geology 52, 2009