palaeogeography, palaeoclimatology, palaeoecology · of taxa. reticulofenestrids ... (ird), higher...
TRANSCRIPT
Calcareous nannofossil changes during the Mid-Pleistocene Revolution:Paleoecologic and paleoceanographic evidence from North Atlantic Site 980/981
Maria Marino a,!, Patrizia Maiorano a, Benjamin P. Flower b
a Department of Geology and Geophysics, E. Orabona, 4, Università degli Studi di Bari Aldo Moro, Bari, Italyb College of Marine Science, 140 7th Avenue South, University of South Florida, St. Petersburg, FL, USA
a b s t r a c ta r t i c l e i n f o
Article history:Received 12 November 2010Received in revised form 22 March 2011Accepted 23 March 2011Available online 1 April 2011
Keywords:Calcareous nannofossilsNorth Atlantic ODP Site 980/981Mid-Pleistocene RevolutionPaleoecologyPaleoceanography
New quantitative data on calcareous nannofossil assemblages through 583–1138 thousand years ago (kyr)have been acquired in high sample resolution (2–3 ky) at northern Atlantic ODP (Ocean Drilling Program) Site980/981. Assemblage composition re!ects a temperate paleobioprovince suggesting signi"cant in!ux ofwarm North Atlantic Current at the site location during the mid-Pleistocene transition, between MarineIsotope Stage (MIS) 35 and 15.Three intervals have been described based on changes in nannofossil composition and abundance !uctuationsof taxa. Reticulofenestrids are abundant just in the "rst interval (MIS 35–22), which is also characterised bythe absence of Gephyrocapsa (N4 !m) and C. pelagicus s.l., the latter occurring in upper MIS 24 only. The secondinterval corresponds to the expanded warm MIS 21 that is accompanied by high carbonate content, absenceof both nannofossil reworking and ice rafted debris (IRD), higher abundance of C. leptoporus (5–8 !m) andH. carteri, and absence of C. pelagicus s.l. and medium gephyrocapsids. The third interval (MIS 20–15) recordsthe occurrence of C. pelagicus s.l. and medium Gephyrocapsa, generally higher abundance and higheramplitude !uctuations of helicoliths, and absence of reticulofenestrids. The major changes in nannofossilassemblages seem to be the result of combined paleoenvironmental factors related to sea surface waterfeatures (temperature and nutrient availability, sea-ice cover) and possibly to deep and intermediate waterproduction of both Northern and Southern Hemisphere origin during glacial and interglacial phases. Complexinter-relationships between environmental parameters and evolutionary/ecological factors are inferred toexplain the patterns of Coccolithus pelagicus subspecies, whose distribution and abundance !uctuationsare compared with the available patterns of Turborotalia quinqueloba and Neogloboquadrina pachyderma(left coiled) at Site 980 and with the C. pelagicus subspecies patterns from North Atlantic DSDP (Deep SeaDrilling Project) Site 607 and South Atlantic ODP Site 1090.Data collected provide additional information on stratigraphic distribution of selected taxa; the FirstOccurrence (FO) of Gephyrocapsa omega is con"rmed as a diachronous event, even in the Atlantic Ocean, whilethe First and Last Common Occurrence (FCO, LCO) of R. asanoi appear as diachronous and synchronous events,respectively, on a global scale.
© 2011 Elsevier B.V. All rights reserved.
1. Introduction
Coccolithophores are phytoplanktonic organisms that are in!u-enced by surface water properties such as temperature, salinity,turbidity and nutrient content within the photic zone (McIntyre andBè, 1967; Brand, 1994; Winter et al., 1994). Their biogeography anddiversity through time varied depending on surface water featuresthat are related to latitudinal zonation and oceanic frontal boundarydynamics (McIntyre and Bè, 1967; Findlay and Giraudeau, 2000;Bown et al., 2004; Ziveri et al., 2004; Boeckel and Baumann, 2008) aswell as to climate variability (Knoll, 2003; Katz et al., 2004). Although
calcareous nannofossil assemblages have been largely investigated asa useful tool for paleoclimatic and paleoceanographic reconstruction(McIntyre and Bè, 1967; Baumann et al., 1999; Thierstein and Young,2004), the combined effects of evolutionary and ecological/environ-mental factors are not always distinguishable especially whennannofossil assemblages involve different sites and time intervals.
The aim of this work is to investigate calcareous nannofossilassemblages at ODP (Ocean Drilling Program) Site 980/981 between1138 and 583 kyr, during the Mid-Pleistocene Revolution (MPR), inorder to improve knowledge on the nannofossil response to paleo-environmental variations and on the paleoecology of a few poorlyknown taxa. The MPR is a crucial time of global modi"cation charac-terised by a glacial–interglacial periodicity switch from 41 kyrto100 kyr (Berger and Jansen, 1994), changes in the ocean circulationand intensity of thermohaline circulation (Boyle and Keigwin, 1985;
Palaeogeography, Palaeoclimatology, Palaeoecology 306 (2011) 58–69
! Corresponding author. Tel.: +39 80 5443454; fax: +39 80 5442625.E-mail address: [email protected] (M. Marino).
0031-0182/$ – see front matter © 2011 Elsevier B.V. All rights reserved.doi:10.1016/j.palaeo.2011.03.028
Contents lists available at ScienceDirect
Palaeogeography, Palaeoclimatology, Palaeoecology
j ourna l homepage: www.e lsev ie r.com/ locate /pa laeo
Venz and Hodell, 2002; Raymo et al., 2004; Clark et al., 2006) and inseawater nutrient and alkalinity distribution (Boyle, 1988). Thelocation of Site 980/981 in the northern Atlantic Ocean makes itsuitable for monitoring the Arctic Front and sea-ice dynamics as wellas the variability of North Atlantic DeepWater (NADW) and SouthernOcean Water (SOW). The site is chronologically well constrained andseveral paleoclimate/paleoceanographic proxies are available.
Quantitative study on nannofossil assemblages is based on high-resolution sampling (1 sample every 2–3 ky) together with measures ofShannon-Weaver Diversity. Recent taxonomic concepts based on studiesof living subspecies have been also taken into account in order to acquireadditional information on biodiversity changes during the MPR interval.Collected data are compared with available SST (Sea Surface Tempera-ture), CaCO3,, "13C, "18O, and IRD (ice rafted debris) patterns to highlightinter-relations between environment and nannofossil assemblagechanges through time. The distinctive quantitative patterns ofC. pelagicuss.l. recognised at Site 980/981 are compared with those of selectedplanktonic foraminifera and with the C. pelagicus s.l. patterns from otherAtlantic sites (DSDPSite607andODPSite1090) forabetter interpretationof the temporal and spatial distribution of the subspecies discriminatedwithin this group in terms of evolution, biogeography, and ecology.
2. Oceanographic setting
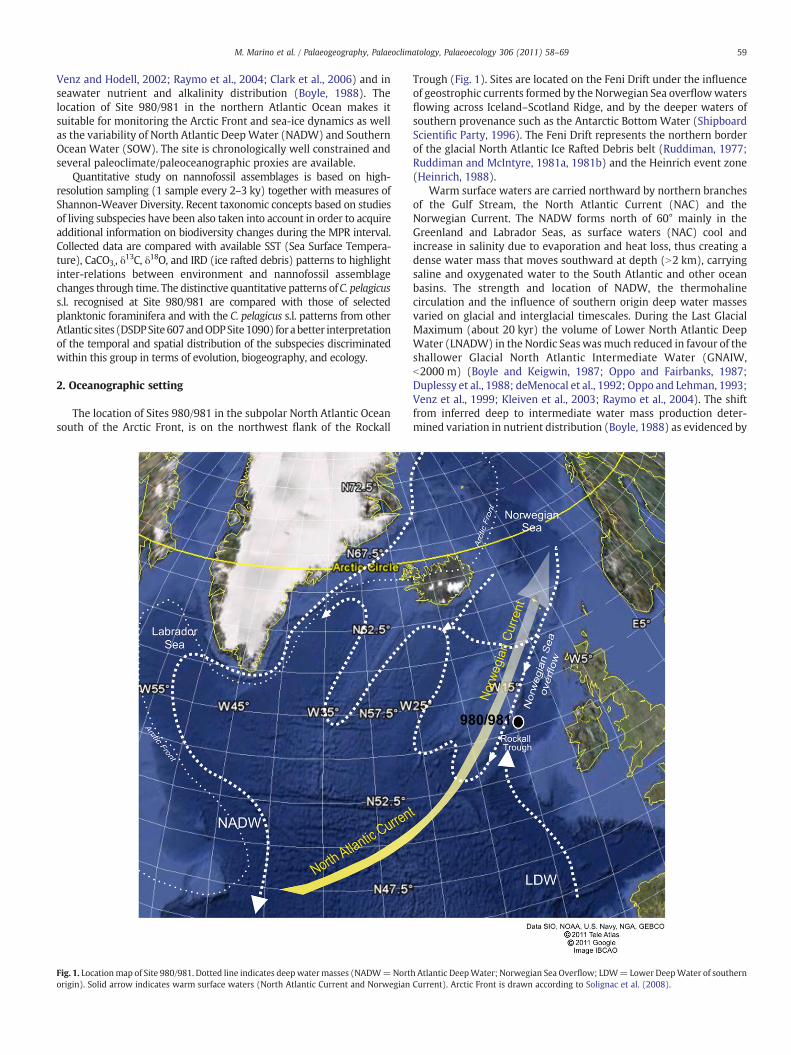
The location of Sites 980/981 in the subpolar North Atlantic Oceansouth of the Arctic Front, is on the northwest !ank of the Rockall
Trough (Fig. 1). Sites are located on the Feni Drift under the in!uenceof geostrophic currents formed by the Norwegian Sea over!owwaters!owing across Iceland–Scotland Ridge, and by the deeper waters ofsouthern provenance such as the Antarctic Bottom Water (ShipboardScienti"c Party, 1996). The Feni Drift represents the northern borderof the glacial North Atlantic Ice Rafted Debris belt (Ruddiman, 1977;Ruddiman and McIntyre, 1981a, 1981b) and the Heinrich event zone(Heinrich, 1988).
Warm surface waters are carried northward by northern branchesof the Gulf Stream, the North Atlantic Current (NAC) and theNorwegian Current. The NADW forms north of 60° mainly in theGreenland and Labrador Seas, as surface waters (NAC) cool andincrease in salinity due to evaporation and heat loss, thus creating adense water mass that moves southward at depth (N2 km), carryingsaline and oxygenated water to the South Atlantic and other oceanbasins. The strength and location of NADW, the thermohalinecirculation and the in!uence of southern origin deep water massesvaried on glacial and interglacial timescales. During the Last GlacialMaximum (about 20 kyr) the volume of Lower North Atlantic DeepWater (LNADW) in the Nordic Seas wasmuch reduced in favour of theshallower Glacial North Atlantic Intermediate Water (GNAIW,b2000 m) (Boyle and Keigwin, 1987; Oppo and Fairbanks, 1987;Duplessy et al., 1988; deMenocal et al., 1992; Oppo and Lehman, 1993;Venz et al., 1999; Kleiven et al., 2003; Raymo et al., 2004). The shiftfrom inferred deep to intermediate water mass production deter-mined variation in nutrient distribution (Boyle, 1988) as evidenced by
Fig. 1. Locationmap of Site 980/981. Dotted line indicates deepwatermasses (NADW=North Atlantic DeepWater; Norwegian Sea Over!ow; LDW=Lower DeepWater of southernorigin). Solid arrow indicates warm surface waters (North Atlantic Current and Norwegian Current). Arctic Front is drawn according to Solignac et al. (2008).
59M. Marino et al. / Palaeogeography, Palaeoclimatology, Palaeoecology 306 (2011) 58–69

the comparison of the "13C values at deep and intermediate depths ofNorth Atlantic sites (Oppo and Fairbanks, 1987; Oppo and Lehman,1993; Oppo et al., 1995), which also reveal an enhanced in!uence ofnutrient-rich deep Southern Ocean Water (SOW, lower "13C) duringglacial phases. On the Rockall Plateau and Feni Drift, based on "13Cvalues, a mixing of GNAIW and SOW occurred during glacials of thelast 1 Ma (Venz et al., 1999; Flower et al., 2000). Nutrient-rich (low"13C) Antarctic IntermediateWaters (AAIW) have possibly penetratedas high as 60°N during late Pleistocene deglaciations (Rickaby andElder"eld, 2005; Hodell et al., 2009). The change in NADWproductionis also linked to North Atlantic surface water oceanography includ-ing position of the Arctic Front (AF) which divides cold Arctic watersfrom warm Atlantic waters (Johannessen et al., 1994). The AF variedlatitudinal location and orientation during glacial and interglacialperiods (CLIMAP, 1976; Hewitt et al., 2001;Wright and Flower, 2002),determining changes in sea-ice distribution and north–south andeast–west hydrographic gradients.
3. Material and age model
Cores of Sites 980 and 981 consist of drift deposits with highsedimentation rate derived from deposition of "ne-grained material byinteraction of bottom currentswith bathymetric features (McCave et al.,1995). The cores of Site 980 were recovered on Feni Drift at 2173meterbelow sea level at 55.49°N, 14.70°W. Site 981, at 2184 meter waterdepth, is located 3 km SE of Site 980. Pleistocene sediments consist oflight gray to dark gray nannofossil oozes and clayey nannofossil oozes;the estimated sedimentation rates in the investigated intervals varyfrom about 50 mcd (meters composite depth)/m.y. to 70 mcd/m.y. andfrom35 to45 mcd/m.y. at Site 980 and Site 981, respectively (ShipboardScienti"c Party, 1996).
The studied record is a composite section spanning the intervalbetween 71 and 93 mcd at Site 980 and from 60.16 to 73 mcd at Site981. The age model is based on correlation of benthic "18O records(Flower et al., 2000; Raymo et al., 2004) to the LR04 benthic "18O stack(Lisiecki and Raymo, 2005). The record spans between 583 and1138 kyr, and includes MIS 15–35. In this work we compare data ofselected nannofossil taxa at Site 980/981 with other proxies (benthic"18O, "13C, nannofossils) available at DSDP Site 607 and ODP Site 1090.Benthic "18O data at Site 1090 (Venz and Hodell, 2002; Hodell et al.,2003) and at Site 607 (Raymo et al., 1989; Ruddiman et al., 1989)were used to correlate these records to the LR04 benthic "18O stack.Benthic "18O data for all sites are based exclusively on Cibicidoides spp.Correlation has been conducted using the Analyseries Program(Paillard et al., 1996), using minimal age control points to minimizelarge sedimentation rate changes and the introduction of temporalartefacts. Interpretation of benthic isotope stratigraphy was aided bypaleomagnetic events including the Brunhes/Matuyama boundaryand the Jaramillo subchron (Channell and Raymo, 2003). Ages of theoxygen isotope stage boundaries, as traced in all "gures, are accordingto Lisiecki and Raymo (2005).
Finally, the paper bene"ts from comparison of nannofossil datawith CaCO3 data (Ortiz et al., 1999), MAT-SST data (Sea SurfaceTemperature, obtained by Modern Analog Technique for foraminiferaassemblages) and IRD (Wright and Flower, 2002), and benthic "13C(Flower et al., 2000; Raymo et al., 2004) records available at Site 980/981, in order to assess the consistency of paleoclimatic and paleo-ceanographic reconstruction during the investigated interval.
4. Methods
A total of 226 samples has been analysed from the Pleistocenerecord through Marine Isotope Stage (MIS) 15–35. Time resolution ofsamples is 2–3 ky. The samples used for benthic oxygen isotopeanalysis were also investigated in this study. Smear slides wereprepared from unprocessed samples according to standard tech-
niques (Bown and Young, 1998) and analysed under a polarized lightmicroscope at a magni"cation of 1000!. This technique has beenconsidered valuable for paleoecologic and paleoceanographic studiesusing calcareous nannofossils (i.e. Gibbs et al., 2004; Blaj andHenderiks, 2007). Quantitative analyses were performed by countingabout 300 total nannofossilsN4 !m in size. Nannofossilsb4 !m in sizehave not been included in this "rst counting, since small placolithsfrequently are the dominant component of Pleistocene assemblages,thus preventing the recognition of those taxa that may be useful instratigraphic (Gephyrocapsa omegaN4 !m, Reticulofenestra asanoi)and paleoenvironmental (i.e. Helicosphaera, Syracosphaera, Rhabdo-sphaera, Umbilicosphaera, and Oolithotus) investigations. Reworkedspecimens have been quanti"ed during this counting and plotted asnumber/300. A supplementary counting on 300 specimens of the totalnannofossil assemblages (Nandb4 !m) has been performed in orderto evaluate abundances of the deep photic dweller Florisphaeraprofunda, as already suggested by Matsuoka and Okada (1989) andCastradori (1993), and of small placolithsb4 !m in size. The abun-dances of each taxon have been plotted as percentage of the totalcount and record the main !uctuations of nannofossils through time.
On the total assemblage N4 !m, numerical analysis using PAST(PAleontology STatistic) software (Hammer et al., 2001), has beenperformed in order to estimate the Shannon-Weaver Index (H,Diversity). Themeasure of Diversity through the record, with exclusionof barren samples, is based on the count at species level, and at genuslevel when it consists of one prevailing species (Syracosphaera spp.,mainly represented by S. hystrica, and Rhabdosphaera spp., mainlyconsisting of R. claviger) or is represented by very rare and scatteredspecimens (Umbilicosphaera spp., Pontosphaera spp, and Oolithotusspp.). The Shannon–Weaver Index provides a reliable indication ofdiversity changes innannofossil assemblages, although it excludes smallplacoliths (gephyrocapsids and reticulofenestrids); on the other hand,we are aware that some limitations could arise from the counting ofsingle coccoliths rather than of the variable number of coccolithssurrounding the cell of different species, and from possible differentialsusceptibility of taxa to dissolution (Incarbona et al., 2008).
Taxonomy of calcareous nannofossils follows Young et al. (2003),Jordan et al. (2004) and references therein. Morphometric subdivisionwithin Calcidiscus leptoporus s.l. and Coccolithus pelagicus s.l. complexesare used here according to taxonomyof Klejine (1993), Knappertsbuschet al. (1997), Steel (2001), Geisen et al. (2002, 2004), Quinn et al. (2003,2004), Parente et al. (2004). In detail, C. leptoporus small (3–5 !m),C. leptoporus intermediate (5–8 !m) and C. quadriperforatus (8–10 !m)have been discriminated within C. leptoporus s.l.; C. pelagicus pelagicus(6–10 !m), C. pelagicus braarudii (10–13 !m), and C. pelagicus azorinus(14–16 !m) have been distinguished within C. pelagicus s.l.
5. Results
5.1. Calcareous nannofossil preservation
Calcareous nannofossils are generally abundant and well pre-served; dissolution phenomena have been observed in a few samplesand more severely within upper MIS 16. However, signi"cant effectsof dissolution and overgrowth did not prevent the recognition of taxaat species/subspecies levels. The nanno-dissolution index, that hasproved to be a reliable estimate of sediment dissolution, was notutilised in the study samples, as instead adopted in Pleistocenerecords (Matsuoka, 1990; Dittert et al., 1999; Boeckel and Baumann,2004; Marino et al., 2009), based on the ratios between dissolution-resistant coccoliths of Calcidiscuswith respect to its single shield or tomore delicate coccoliths of other taxa. In fact, Calcidiscus mostlyexhibit entire (two shields connected by a narrow central column)placoliths at Site 980/981, thus not showing separate proximal anddistal shields. This suggests that collected data may be suitable forstratigraphic and paleoenvironmental interpretation.
60 M. Marino et al. / Palaeogeography, Palaeoclimatology, Palaeoecology 306 (2011) 58–69
A few short barren intervals have been recorded in upperMIS 16, andat the MIS 18/17, 20/19, 23/22, and 24/23 shifts, as shown in all "gures,and they mainly occur during peaks of IRD. Barren samples may resultfrom reduced or no coccolith production linked to unfavourableenvironmental conditions, as also recorded at Site 980 during Heinrichlevel H11 (Stolz and Baumann, 2010) and in the Atlantic Iberian Marginduring IRD peaks of the last glacial phase (Incarbona et al., 2010).However, severe coccolith dissolution events, through the columnwater,possibly related tonorthwardpenetrationof themore corrosive southernorigin deepwaters during lower or suppressedNADWproduction (Oppoand Lehman, 1993; Raymo et al., 2004), may not be excluded.
5.2. Biochronologic data
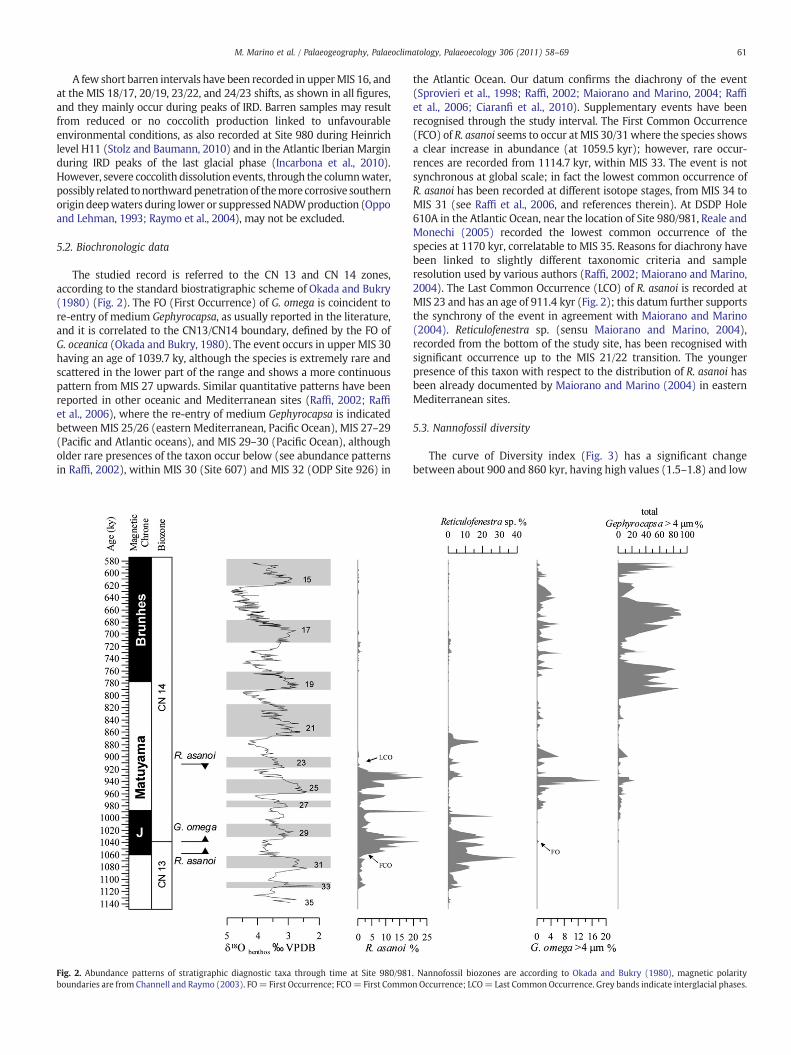
The studied record is referred to the CN 13 and CN 14 zones,according to the standard biostratigraphic scheme of Okada and Bukry(1980) (Fig. 2). The FO (First Occurrence) of G. omega is coincident tore-entry of medium Gephyrocapsa, as usually reported in the literature,and it is correlated to the CN13/CN14 boundary, de"ned by the FO ofG. oceanica (Okada and Bukry, 1980). The event occurs in upper MIS 30having an age of 1039.7 ky, although the species is extremely rare andscattered in the lower part of the range and shows a more continuouspattern from MIS 27 upwards. Similar quantitative patterns have beenreported in other oceanic and Mediterranean sites (Raf", 2002; Raf"et al., 2006), where the re-entry of medium Gephyrocapsa is indicatedbetween MIS 25/26 (eastern Mediterranean, Paci"c Ocean), MIS 27–29(Paci"c and Atlantic oceans), and MIS 29–30 (Paci"c Ocean), althougholder rare presences of the taxon occur below (see abundance patternsin Raf", 2002), within MIS 30 (Site 607) and MIS 32 (ODP Site 926) in
the Atlantic Ocean. Our datum con"rms the diachrony of the event(Sprovieri et al., 1998; Raf", 2002; Maiorano and Marino, 2004; Raf"et al., 2006; Ciaran" et al., 2010). Supplementary events have beenrecognised through the study interval. The First Common Occurrence(FCO) of R. asanoi seems to occur atMIS 30/31where the species showsa clear increase in abundance (at 1059.5 kyr); however, rare occur-rences are recorded from 1114.7 kyr, within MIS 33. The event is notsynchronous at global scale; in fact the lowest common occurrence ofR. asanoi has been recorded at different isotope stages, from MIS 34 toMIS 31 (see Raf" et al., 2006, and references therein). At DSDP Hole610A in the Atlantic Ocean, near the location of Site 980/981, Reale andMonechi (2005) recorded the lowest common occurrence of thespecies at 1170 kyr, correlatable to MIS 35. Reasons for diachrony havebeen linked to slightly different taxonomic criteria and sampleresolution used by various authors (Raf", 2002; Maiorano and Marino,2004). The Last Common Occurrence (LCO) of R. asanoi is recorded atMIS 23 and has an age of 911.4 kyr (Fig. 2); this datum further supportsthe synchrony of the event in agreement with Maiorano and Marino(2004). Reticulofenestra sp. (sensu Maiorano and Marino, 2004),recorded from the bottom of the study site, has been recognised withsigni"cant occurrence up to the MIS 21/22 transition. The youngerpresence of this taxon with respect to the distribution of R. asanoi hasbeen already documented by Maiorano and Marino (2004) in easternMediterranean sites.
5.3. Nannofossil diversity
The curve of Diversity index (Fig. 3) has a signi"cant changebetween about 900 and 860 kyr, having high values (1.5–1.8) and low
Fig. 2. Abundance patterns of stratigraphic diagnostic taxa through time at Site 980/981. Nannofossil biozones are according to Okada and Bukry (1980), magnetic polarityboundaries are from Channell and Raymo (2003). FO= First Occurrence; FCO= First Common Occurrence; LCO= Last Common Occurrence. Grey bands indicate interglacial phases.
61M. Marino et al. / Palaeogeography, Palaeoclimatology, Palaeoecology 306 (2011) 58–69

amplitude !uctuations below, and lower values (down to 1) andhigher amplitude !uctuations above. H index is not unambiguouslycorrelatable to the pattern of the oxygen isotope and SST curves, andits minimum values are recorded both in glacial and interglacialstages, whereas it shows comparable trends with those of the "13Ccurve (Fig. 3). The generally higher values and the low amplitude!uctuations of Diversity in the lower part of the studied intervalcorrespond with the generally high values and the low amplitude!uctuations of "13C in the same interval; similarly, higher !uctuationsand minima in the Diversity curve mimic the "13C curve in the upperpart of the studied interval. A detailed comparison of H index withCaCO3 content (Ortiz et al., 1999) seems to suggest that dissolutionhas not in!uenced the Diversity trend through time, because minimaof carbonate content do not match minima in H index. Finally, theDiversity curve has no distinct relation with the coccolith reworkingand IRD records, suggesting a primary link of Diversity pattern withnannofossil assemblage changes.
5.4. Abundance patterns of calcareous nannofossil taxa
Nannofossil assemblages are usually dominated by small placoliths(mainly small Gephyrocapsa), and are characterised by high abundanceof Pseudoemiliania lacunosa, Reticulofenestra spp. N4 !m, and Calcidiscusspp. (Figs. 4–5). Gephyrocapsa spp. (N4 !m) and C. pelagicus s.l. areabundant in selected intervals of the upper portion of the studiedinterval (Figs. 4–5). Subordinate taxa are Syracosphaera spp. andHelicosphaera spp. Pontosphaera spp. Umibilicosphaera spp. (U. sibogaesibogae and U. sibogae foliosa), Rhabdosphaera spp. (mainly R. clavigera),Calciosolenia spp. and Oolithotus fragilis and have been recorded withvery rare and scattered occurrences; therefore their abundance patternsarenot shown. Florisphaera profunda is almost absentat Site 980/981 andit has been found in a few samples only, with percentages lower than 2%.
P. lacunosa, Reticulofenestra spp. (N4 !m), Reticulofenestra sp. (sensuMaiorano andMarino, 2004) and R. asanoi do not reveal a clear relation
with glacial–interglacial cycles (Figs. 2, 4). Reticulofenestrids recorda sharp decrease in the interval from the lower part of MIS 21upwards where they are absent or scattered with very rare specimens(Fig. 4). The abundance !uctuations of G. oceanica s.l., G. omega andG. caribbeanica do not show relation with glacial and interglacialphases (Figs. 2, 4). Within the C. pelagicus complex, all morphotypesare almost absent from MIS 35 to 25 after which they co-occur atthe same cold intervals MIS 24, 18 and 16 (Fig. 4). C. pel. pelagicus(5–8 !m) is the most abundant while C. pelagicus azorinus is veryrare and scattered, with percentages generally lower than 6%(Fig. 4).
Syracosphaera spp. and C. leptoporus complex represent a consistentcomponent of the assemblages with abundances reaching percentagesup to 40% and 70% respectively (Fig. 5). They record signi"cantabundance !uctuations that show a broad positive relation withinterglacials, although some peaks also occur in glacial phases (Fig. 5).C. leptoporus intermediate (5–8 !m) represents themajor component ofthe genus (up to 70% in the total assemblages, Fig. 5); C. quadriperforatusis recorded from MIS 34 to MIS 19, having abundance generally nothigher than 25%, and C. leptoporus small (3–5 !m) occurs discontinu-ously with low abundance, usually b5–8% (Fig. 5). H. carteri is the mostrepresentative species within Helicosphaera spp., with percentagesranging between 2 and 22%; the species has higher abundances withhigher amplitude!uctuations aboveMIS 21 (Fig. 5).H. hyalina is mostlyrecorded from MIS 21 upward.
Reworked nannofossil specimens have been found in cold glacialphases MIS 34, 32, 22, 18, and 16, and at the MIS 23/22 shift. Peaks ofreworking are always coincident with IRD peaks while they do notmimic any species abundance pattern (Figs. 4 and 5). Reworking ismostly composed of taxa Cretaceous in age, mainly coming fromCampanian–Maastrichtian genera (Reinhardtites levis, Arkangelskiella,Quadrum tri!dum, and Lithraphidites quadratus); a few samples withinMIS 16 also contain very rare Paleogene and Neogene nannofossils(Fasciculithus, Chiasmolithus, Dictyococcites, and Sphenolithus). The
Fig. 3. Comparison of Diversity index with curves of benthic foraminiferal "18O and "13C (from Flower et al., 2000; Raymo et al., 2004), CaCO3 (Ortiz et al., 1999), IRD, MAT SST(Wright and Flower, 2002), and nannofossil reworking. Coccolith barren sample positions are also shown. Grey areas indicate interglacial phases.
62 M. Marino et al. / Palaeogeography, Palaeoclimatology, Palaeoecology 306 (2011) 58–69
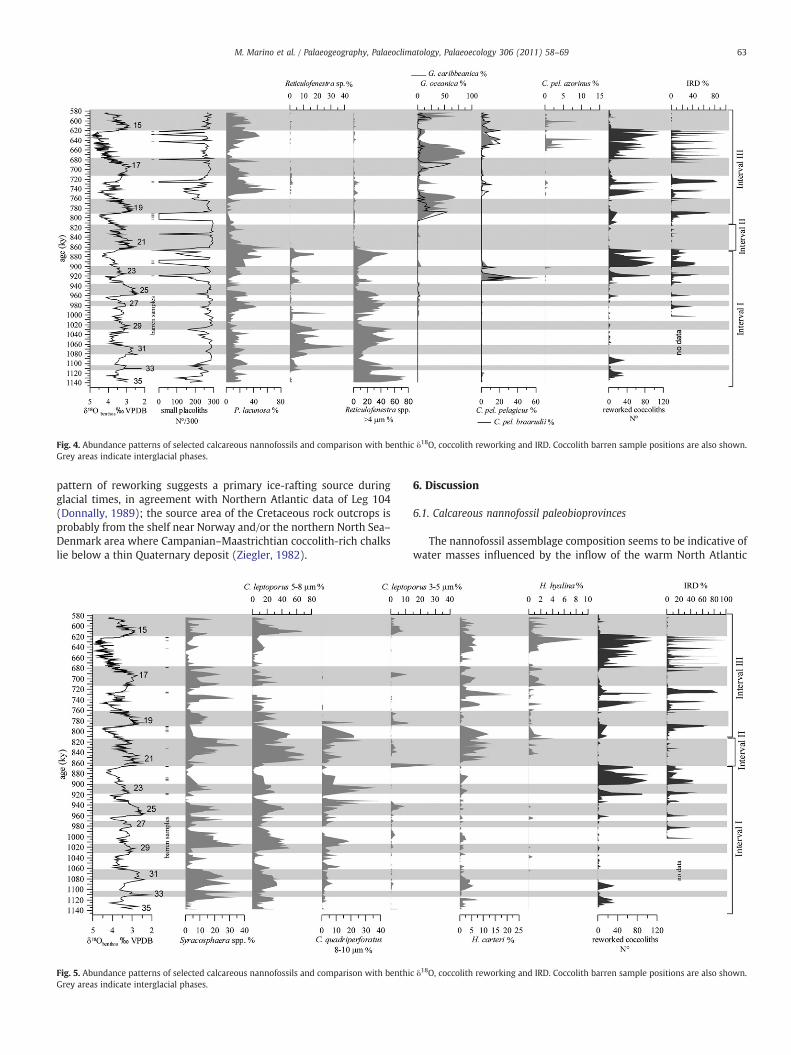
pattern of reworking suggests a primary ice-rafting source duringglacial times, in agreement with Northern Atlantic data of Leg 104(Donnally, 1989); the source area of the Cretaceous rock outcrops isprobably from the shelf near Norway and/or the northern North Sea–Denmark area where Campanian–Maastrichtian coccolith-rich chalkslie below a thin Quaternary deposit (Ziegler, 1982).
6. Discussion
6.1. Calcareous nannofossil paleobioprovinces
The nannofossil assemblage composition seems to be indicative ofwater masses in!uenced by the in!ow of the warm North Atlantic
Fig. 4. Abundance patterns of selected calcareous nannofossils and comparison with benthic "18O, coccolith reworking and IRD. Coccolith barren sample positions are also shown.Grey areas indicate interglacial phases.
Fig. 5. Abundance patterns of selected calcareous nannofossils and comparison with benthic "18O, coccolith reworking and IRD. Coccolith barren sample positions are also shown.Grey areas indicate interglacial phases.
63M. Marino et al. / Palaeogeography, Palaeoclimatology, Palaeoecology 306 (2011) 58–69

Current. Location of the site was east of the Arctic Front duringmost ofthe investigated Pleistocene interval. In particular, the presence ofabundant placoliths-bearing taxa (small placoliths, reticulofenestrids,and Calcidiscus spp.), the subordinate, although signi"cant occurrenceof Syracosphaera spp. and Helicosphaera spp., known as warm watertaxa (McIntyre et al., 1972; Gard and Backman, 1990; Haidar andThierstein, 1997), and the extreme rarity or absence of tropical–subtropical taxa (Umbilicosphaera spp., Oolithotus spp., Rhabdosphaeraspp., and F. profunda), might be used to interpret the nannofossilassociation as indicative of temperate conditions, according to thetransitional bioprovince recognised in this sector of North AtlanticOcean by McIntyre and Bè (1967). This "nding, in agreement with thedistribution of living and recent coccolithophores documented byBaumann et al. (2000) and Solignac et al. (2008), may be consideredreliable since a generally consistent correspondence between surfacesediment coccolithophore assemblages and overlying water massfeatures has been recognized by Solignac et al. (2008). Syracosphaeraspp. and Helicosphaera spp., that are rare in the living community ofthe North Atlantic (Baumann et al., 2000), are not considered driftedtaxa transported by the warm North Atlantic Current because theyhave signi"cant abundances (up to 40% and 20%, respectively) in thestudied interval. The cold water adapted taxa (e.g. C. pelagicus) thatare typically dominant in the living and Holocene associations of thenorthern Norwegian–Greenland Sea (Baumann and Matthiessen,1992; Samtleben et al., 1995; Baumann et al., 2000) are not dominantin the Pleistocene assemblages of Site 980/981. The presence ofC. quadriperforatus, a species considered a tropical–subtropical taxon(Klejine, 1993; Knappertsbusch, 1993; Knappertsbusch et al., 1997;Quinn et al., 2004), might also support the inferred temperatecondition. Although additional data on the Pleistocene distributionof this taxon are needed, an evolutionary control on the peculiardistribution of the species between MIS 34 and MIS 19 cannot beexcluded because C. quadriperforatus has been recorded in the sameinterval at South Atlantic Site 1090 (Marino et al., 2009).
6.2. Calcareous nannofossil changes through time and paleoceanographicimplications
The major changes in nannofossil assemblages do not show aprimary relation with glacial–interglacial phases only. The comparablepatterns of H index and "13C curves (Fig. 3) might suggest a connectionbetween nannofossil diversity and variability of oceanic circulationthrough MPR, although complex inter-relationship between differentenvironmental parameters and evolutionary/ecological factors couldhave controlled the assemblage modi"cation through time. The changeevidenced in the pattern of H index between about 900 and 860 kyr(Fig. 2), also visible in the "13C curve at about the same time, may berelated to variation in Milankovitch periodicity of glacial–interglacialcycles. Similar !uctuation patterns of nannofossil diversities have beenobserved in other Atlantic sites (Site 607, Site 1090), interpreted as dueto a change in glacial–interglacial periodicity from 40 ky to 100 ky(Marino et al., 2008, 2009), which determined more intense glacial andinterglacial phases, at the time of the last node of the 1.2 m.y. obliquitycycles (at about 0.9 m.y.), related to global oceanographic and bioticchanges (Lourens and Hilgen, 1997; Bertini et al., 2010).
Furthermore, the distinct changes of nannofossil compositionprovide a subdivision of the study section into three time intervals.
Interval I (MIS 35-upper MIS 22) is distinguishable mainly by thepresence of abundant reticulofenestrids, which show a signi"cant dropat about 866 kyr, and by the absence of Coccolithus pelagicus s.l. andmedium gephyrocapsids (Fig. 4). This "nding is comparable with thesharp decrease of reticulofenestrids recorded at sites 607 and 1090(Marino et al., 2008, 2009), where a signi"cant modi"cation incomposition and structure of nannofossil assemblages similarly occursat the MIS 22/21 transition. This change may have a relation with theevolutionary trend of reticulofenestrids, also testi"ed by the wide scale
synchronous event of LCO of R. asanoi. The higher values of Diversityduring the "rst interval, with the exception of cold MIS 34, might berelated to the presence of reticulofenestrids and possibly tomore stablesurface water conditions that would have favored coccolithophoridswhich bene"t from oligotrophic environments. It is worthy to note ashort peakofC. pelagicus s.l. (C. pel. pelagicus andC. pel. braarudii) (Fig. 4)in upper MIS 24, between 922.35 and 926.41 kyr, indicating a possiblemajor event of lower surface water temperature, in agreement with apreference for cold surfacewaters of this taxon (McIntyre and Bè, 1967;Samtleben et al., 1995). During the peak of C. pelagicus s.l. no extremecoldphase is documented at the site byWright and Flower (2002)basedon summer MAT-SST; the authors however indicate a high increase ofthe polar Neogloboquadrina pachyderma (left coiled), interpreted as asoutheastern position of Arctic Front with respect to site location. Asigni"cant IRD input at this time (923.54 kyr) is evident at Site 980, alsodocumented at North Atlantic Site 982 during MIS 24 at about 920 kyr(Venz et al., 1999), thus suggesting a more southward in!uence of bothice-rafting processes and Arctic Front position. Then, the occurrence ofC. pelagicus s.l. may indicate the "rst severe cold conditions of surfacewaters in the northeast sector of the Atlantic Ocean at Site 980/981.Furthermore, a shift toward a negative peak of "13C occurs at the top ofMIS 24 (Fig. 3) from 914.25 to 919.8 kyr, interpreted as suppressedNADW production at the time of increased global ice-sheet volume(Raymo et al., 1990; 1997). The wide scale signi"cance of thisoceanographic event is supported by coeval low values of benthicforaminiferal "13C in the South Atlantic Ocean (Venz and Hodell, 2002),when strati"cation of the water column and carbonate dissolutionoccurred (Schmieder et al., 2000), in relation to the shallowingofNADWand enhanced northward penetration of "13C-depleted and corrosiveSOW (Schmieder et al., 2000; Hodell et al., 2001, 2003), which probablyinvolved the column water structure in the northeast Atlantic as well.However, neither a Diversity minimum nor lowest values of carbonatecontent are recorded at this time (Fig. 3), thus excluding a selectivepreservation of dissolution-resistant C. pelagicus s.l. at Site 980/981.Unfortunately the presence of C. pelagicus s.l. cannot be documented inMIS 24 of South Atlantic Ocean because of a coccolith barren intervalrecorded at Site 1090 (Marino et al., 2009).
Interval II corresponds to theexpandedwarmMIS21, characterizedbypersistenthighcarbonate content (up to70%)and temperature (up to12–14 °C), nonannofossil reworking and IRD input (Fig. 3), higher abundanceof C. leptoporus (5–8 !m) and ofH. carteri, lower abundance of P. lacunosa,and absence ofC. pelagicus s.l. andmediumgephyrocapsids (Figs. 4 and5).Temperature of surface waters seems to be the primary environmentalparameter that controlled nannofossil assemblages during this interval.Very similar trends are shown by the above-mentioned taxa in MIS 21 atAtlantic sites 607 and 1090 (Marino et al., 2008, 2009). These distinctivepatterns during MIS 21 could have a relation with a response ofcoccolithophorids to a wide scale paleoceanographic condition, possiblydue to warmer surface waters at Site 980/981 (“extreme warmth”,according to MAT-SST of Wright and Flower, 2002), also supported by adecrease of N. pachyderma (left-coiled) (Wright and Flower, 2002).Higher carbonate content during enhanced interglacial in!uxof theNorthAtlantic Current has been reported in the North Atlantic and Norwegian–Greenland Sea, associated with higher numbers of coccoliths (Baumannand Huber, 1999). Higher coccolith production has also been found inthe northern Atlantic Ocean during interglacial phases (Huizhong andMcCave, 1990;Manighetti andMcCave, 1995; Thomas et al., 1995), whenmost coccolithophores, in the absence of sea-ice cover and dependingon higher surface temperature, are more abundant. Helicosphaera andCalcidiscus, which have highly calci"ed coccoliths (Young and Ziveri,2000; Loubere et al., 2004), could have been an important source of thehigher carbonate content at this time, providing a more signi"cant "necarbonate !ux at the site location, during a time of no IRD dilution and anorthern position of Arctic Front.
Interval III (MIS 20–15) records the occurrence of mediumGephyrocapsa and C. pelagicus s.l., more signi"cant presence of
64 M. Marino et al. / Palaeogeography, Palaeoclimatology, Palaeoecology 306 (2011) 58–69

H. hyalina, general higher abundance of helicoliths, and absence ofreticulofenestrids (Figs. 4 and 5). The occurrence of gephyrocapsidsN4 !m in this interval, especially from MIS 19/20 upwards, is knownto be linked to the re-entry of these placoliths after the globaltemporary disappearance documented between MIS 37 and MIS29–25 (Raf", 2002; see Raf" et al., 2006 and references therein).However, the reasons for the extreme rarity of the taxon starting fromits re-entry (Figs. 2, 4) up to MIS 20/19 at Site 980/981 are not clear.
Peaks of C. pelagicus subspecies occur in glacial MIS 16, similar tothe "rst interval (upper MIS 24), and with minor abundance duringthe colder phases of MIS 18 (Fig. 4), con"rming their preference forcold surface waters. The co-occurrence of the peaks close to IRD andcoccolith-reworking increases seems to imply major sea-ice exten-sions during these glacials. However, the taxon is unusually absent inthe glacials MIS 22 and MIS 20, when both IRD and reworking inputsare recorded. The comparison between the patterns of C. pelagicus s.l.and abundance !uctuations of N. pachyderma (left-coiled) (“arcticspecies”, Johannessen et al., 1994) and Turborotalia quinqueloba (“sea-ice edge” and high nutrient surface water indicator, Johannessen et al.,1994; Carstens et al., 1997) should improve the understanding of theecological and temporal distribution of the C. pelagicus complex(Fig. 6). The relative abundance of these planktonic foraminifers hasbeen used at Site 980 byWright and Flower (2002) to reconstruct theposition of the Arctic Front during the last 1–0.5 Ma. Furthermore, atSite 980/981 the signi"cant abundance peaks of C. pel. pelagicus and
C. pel. braarudii co-occur with prominent peaks ofN. pachyderma (left-coiled) during both MIS 24 and the colder phases of MIS 18 as well asduring MIS 16, supporting a position of the Arctic Front south of theFeni Drift area, in agreement with the hypothesis of Wright andFlower (2002). The higher abundance of C. pel. azorinuswithin MIS 16correlates with the higher abundance of T. quinqueloba suggesting asimilar ecological preference of these taxa for sea-ice edge waters, andsustaining the suggestion of Wright and Flower (2002) that the ArcticFront was located near the Feni Drift area during most of this time,before the more severe cold condition of the peak MIS 16 glaciation.The peaks of T. quinqueloba and C. pel. azorinus in MIS 16 developduring relatively higher values of winter SST (Fig. 6), when the polarN. pachyderma (left-coiled) decreases. On the other hand, we areunable to explain why C. pelagicus s.l. are absent at Site 980/981during MIS 22–20, when other records of low SST, high abundances ofT. quinqueloba and of N. pachyderma (left-coiled) predict theoccurrence of C. pelagicus subspecies peaks as they do at MIS 24, 18and 16.
The major peaks of H. hyalina and H. carteri during Interval III arenot easy to interpret, due to the complex paleoecology of these taxa(preference for lower salinity, or warmer and/or more productivesurface waters; see Flores and Sierro, 2007, and references therein).The peak of H. hyalina at the glacial–interglacial transition MIS 16–15falls between two IRDmaxima and is coincident with SST increase andlow abundances of N. pachyderma (left-coiled) and C. pelagicus s.l.
Fig. 6. Comparison of C. pelagicus subspecies distribution with T. quinqueloba and N. pachyderma (left-coiled) (Wright and Flower, 2002) at Site 980/981. Coccolith barren samplepositions are also shown. Grey areas point out the correlated intervals discussed in text.
65M. Marino et al. / Palaeogeography, Palaeoclimatology, Palaeoecology 306 (2011) 58–69

(Figs. 3 and 5). This could be related to a short-lived episode ofwarmer and low salinity shallow water caused by increased glacialmeltwater discharge. The two more prominent peaks of H. carteri inthe colder phases of MIS 18 (Fig. 5) are coincident with higherabundance of C. pel. braarudii and therefore maybe the result of moreproductive surface waters.
6.3. Temporal and spatial distribution of Coccolithus pelagicus s.l. in theAtlantic Ocean
The distinctive distribution of C. pelagicus s.l. in particular glacialsat Site 980/981 requires a closer examination to clarify the ecologyand evolution of these subspecies that are not always discriminated inthe fossil record. C. pel. pelagicus is considered a subarctic species(Baumann et al., 2000; Geisen et al., 2002) and its general higherabundance at the northern latitude Site 980/981, especially duringMIS 24, seems to support the preference of the taxon for colderwaters, with temperatures ranging from !1 to 14 °C (Okada andMcIntyre, 1979; Samtleben and Schröder, 1992; Winter et al., 1994).On the other hand, our data do not support, during the MPR, theaf"nity of the larger C. pel. braarudii (10–13 !m) with temperatewaters (Baumann et al., 2000; Cachao and Moita, 2000; Geisen et al.,2002) with optimal conditions between 13 and 18 °C (Cachao andMoita, 2000); the taxon in fact shows signi"cant abundance at Site980/981 during glacials, even higher than C. pel. pelagicus, inagreement with "ndings of Marino et al. (2009) in the SouthernOcean. Factors different from surface water temperature alone havebeen hypothesised by Baumann and Huber (1999) based on records ofPliocene–Pleistocene sediments from the North Atlantic, Norwegianand Labrador Seas (Baumann and Meggers, 1996; Baumann andHuber, 1999) where C. pelagicus s.l. is abundant to dominant.Upwelling conditions are associated with C. pel. braarudii (Baumannet al., 2000; Cachao and Moita, 2000; Parente et al., 2004; Narcisoet al., 2006) and this might agree with the inferred higher nutrientconditions during MIS 16 at Site 980/981, based on the co-occurrenceof the taxon with T. quinqueloba. High nutrient concentrations andmore dynamic conditions from several upwelling areas have been alsorelated to C. pelagicus s.l. (Blasco et al., 1980; Giraudeau and Baley,1995; Cachao and Moita, 2000; Boeckel and Baumann, 2004). Thepreference of C. pel. braarudii for upwelling conditions has not beencon"rmed by Marino et al. (2009) in the Southern Ocean during theMPR. C. pel. azorinus has been related to the in!uence of water massesfrom the Azores front (Parente et al., 2004) and it seems to indicatepreference for cold and nutrient-richwaters at Site 980/981; however,data on its distribution in the Pleistocene record are still very scarce.
The comparison of the C. pelagicus s.l. records in North AtlanticSites 980/981 and 607 and South Atlantic Site 1090 (Fig. 7) mayprovide additional data on Pleistocene spatial and temporal distribu-tion of the subspecies. Abundance !uctuations of the taxa arecorrelated with benthic "13C curves at each site (Fig. 7). The patternsof taxa are well comparable among the three sites for the intervalabove MIS 24. The absence of C. pelagicus s.l. in the interval from MIS35 to MIS 25 is a common feature between North Atlantic Sites 607and 980/981, and this could represent a paleobiogeographic feature ofthe taxon complex in the North Atlantic, since C. pel. pelagicus andC. pel. braarudii are almost continuously present during this timeinterval in the Southern Ocean (Fig. 7), where, in constrast, C. pel.pelagicus is absent in surface sediments (Findlay and Giraudeau,2000). On the other hand C. pel. azorinus shows a comparable patternboth in the North Atlantic sites (from MIS 18 upward, Fig. 7) andSouthern Ocean (fromMIS 20 upward), suggesting a possible primaryevolutionary cause besides the above-inferred link to Arctic Front andsea-ice dynamics and higher nutrient availability.
The positive correlation between peaks of C. pelagicus s.l. and lowerglacial values in benthic "13C at both North Atlantic sites (Fig. 7) relatesto lower ef"ciency of the deep (NADW)/intermediate (GNADW) North
Atlantic water production, as well as the northward penetration ofSouthern Ocean waters (SOW, AAIW). Today, the low "13C andnutrient-rich AAIW (Boyle and Keigwin, 1987; Oppo and Fairbanks,1987; Duplessy et al., 1988) lies at levels shallower than 800 m in theNorth Atlantic and is dif"cult to recognise north of 25°, but thesesouthern originwaters have been inferred to have penetrated as high as60° N during last termination (Rickaby and Elder"eld, 2005) andpossibly at the latitude of Site 980/981 during MIS 24, 18 and 16. Thehigher abundances of C. pelagicus s.l. also show a correlationwith lowerglacial values of "13C in the Southern Ocean. The high abundance ofC. pel. pelagicus at Site 1090 from MIS 32 to MIS 25 is accompanied bylower values of "13C than at sites 980/981 and 607 (where C. pelagicuss.l. are absent) and it has been related to the shallowing of the nutrient-rich AAIW following the northward wind-driven sea ice motion(according to the model of Saenko and Weaver, 2001; Marino et al.,2009). In addition, this pattern of "13C in the Southern Ocean has beenrelated to sea ice expansion and reduced deep water ventilation (VenzandHodell, 2002). Similarly, wider sea-ice extent during glacialminimain "13C has been inferred by other authors (Kellogg, 1980; Raymo et al.,1990; Broecker, 1993). Therefore, the presence of sea ice could haveaided the C. pelagicus s.l. proliferation during more severe MPR glacialsat Site 980/981. Enhanced availability of nutrients at the same time canbe also considered because higher primary productivity is documentedby Sakshaug and Slagstad (1991) in the Barents Sea during “produc-tivity-conducive sea-ice edge” conditions. Phytoplankton blooms areknown in polar arctic seas where they trail the ice edge as a band 20–50 km wide during the summer melting, when nutrients concentratedunder the winter sea-ice cover are exposed to light in a low salinitysurface layer (Alexander, 1980; Rey and Loeng, 1985). Accordingly, it iscongruent to suppose that at Site 980/981 the productivity-conducivesea-ice edge conditions in surface waters during glacial MIS 16, 18, and24 may have promoted a more ef"cient nutrient consumption andfavored the r-selection life strategy of the cold-adapted C. pelagicus s.l. Ifthis is true, the higher abundances of C. pelagicus s.l. might also be theresult of its capability to survive in low irradiance conditions (Brand,1994) and their phagotrophic life-strategy (Parke and Adams, 1960) asthe time of sea-ice cover occurred during more severe glacials.Therefore, complex environmental (temperature, sea-ice edge, ef"-ciency of nutrient consumption, solar irradiance) and evolutionaryfactors may have controlled the distribution of the subspecies.
7. Conclusion
Nannofossil assemblage composition at Site 980/981 during theMid-Pleistocene Revolution represents a temperate paleobioprovincelinked to the in!ux of the warm North Atlantic Current at the sitelocation, especially during interglacial periods. Reworked Campanian–Maastrichtian nannofossils have been found during glacial periodscoincident with IRD input supporting a primary source of ice-raftingfrom the shelf near Norway and/or northern North Sea–Denmark area.The lack of correlation between Diversity index and the CaCO3, IRD, andcoccolith-reworking curves seems to exclude signi"cant nannofossildilution by dissolution or inorganic input in most of the study section,and to indicate a primary response of nannofossil assemblages toenvironmental changes through time, thus making the collected datavaluable for paleoenvironmental and stratigraphic interpretation.Barren samples recorded in certain intervals might derive from reducedor no coccolith production during unfavorable environmental condi-tions and/or from more pronounced coccolith dissolution duringnorthward penetration of corrosive deep waters of southern origin.
The most important modi"cation of nannofossil assemblagesoccurs between 860 and 900 kyr and has been interpreted as relatedto a change in glacial–interglacial periodicity from 40 ky to 100 ky,which involved more intense glacial and interglacial phases. Changesin nannofossil composition and abundance !uctuations of taxaallowed the discrimination of three different intervals in the study
66 M. Marino et al. / Palaeogeography, Palaeoclimatology, Palaeoecology 306 (2011) 58–69

section. The "rst interval (MIS 35–22) is mainly characterised by theabsence of C. pelagicus s.l. and gephyrocapsids (N4 !m) and by thehigher abundance of reticulofenestrids, whose sharp drop in abun-dance is recorded at about 866 kyr. The higher values of Diversitythrough the "rst interval could indicate more stable surface waterswhich would have favored most coccolithophorids that bene"t fromoligotrophic conditions. During the "rst interval, MIS 24 records theoccurrence of C. pelagicus s.l., probably in relation to the beginning ofenhanced ice sheet expansion and the "rst severe cold surface watersin the northeast sector of the Atlantic Ocean, coincident with aminimum in benthic "13C during reduced or suppressed NADWproduction and a probable northward penetration of SOW. Thesecond interval (MIS 21) is coincident with persistent high carbonatecontent, no nannofossil reworking or IRD input, higher abundance ofC. leptoporus (5–8 !m) and H. carteri, and absence of C. pelagicus s.l.and medium gephyrocapsids. Higher coccolith production, mainlyrepresented by the highly calci"ed C. leptoporus (5–8 !m) andH. carteri coccoliths, could have represented an important source of"ne carbonate at this time, re!ecting higher surface water temper-ature and absence of sea-ice cover at the site location. The thirdinterval (MIS 20–15) mainly features the occurrence of C. pelagicus s.l.and medium Gephyrocapsa. More severe glacial intervals and theoccurrence of productivity-conducive sea-ice edge waters at the sitelocation during MIS 18 and 16, as during MIS 24, might havein!uenced the nannofossil composition. This is consistent with Arctic
Front variability and sea-ice extension as well as more pronouncedvariability of deep and intermediate water mass production ofnorthern and southern hemisphere origin.
Evolutionary and ecological/biogeographic factors combined withchanges of environmental parameters have been invoked to clarifyspatial and temporal distribution of C. pelagicus subspecies, based oncomparison of their abundance !uctuations with data of selectedplanktonic foraminifera at Site 980 and of C. pelagicus subspeciesrecords from other North and South Atlantic sites. Lower sea surfacetemperature, more ef"cient consumption of nutrients during produc-tivity-conducive sea-ice edge conditions at the time of severe glacialsMIS 24, 18 and 16 at Site 980/981, higher ability to survive in lowersolar irradiance conditions, and evolutionary factors may havecontrolled the distribution of the C. pelagicus subspecies.
Quantitative data provided additional information on biochronologyof the FO of Gephyrocapsa omega and the FCO and LCO of R. asanoi,further supporting the diachronous character of the appearances ofG. omega and R. asanoi and the global scale synchronous disappearanceof R. asanoi.
Acknowledgments
The authors wish to thank the Ocean Drilling Program forproviding samples of the investigated site. The valuable suggestionsand critical reviews of A. Incarbona (University of Palermo) and an
Fig. 7. Comparison of C. pelagicus subspecies distribution at Site 980/981 with the patterns available at DSDP Site 607 (Marino et al., 2008) and ODP Site 1090 (Marino et al., 2009).Benthic "18O and "13C records are from Raymo et al. (1989) and Ruddiman et al. (1989) at Site 607, and from Venz and Hodell (2002) and Hodell et al. (2003) at Site 1090. Grey areasindicate glacial phases.
67M. Marino et al. / Palaeogeography, Palaeoclimatology, Palaeoecology 306 (2011) 58–69

anonymous reviewer are greatly acknowledged. This research was"nancially supported by Fondi di Ateneo, Università di Bari, R. LaPerna, 2008.
References
Alexander, V., 1980. Interrelationships between the seasonal sea ice and biologicalregimes. Cold Regions Science and Technology 2, 157–178.
Baumann, K.-H., Huber, R., 1999. In: Raymo, M.E., Jansen, E., Blum, P., Herbert, T.D.(Eds.), Sea-surface gradients between the North Atlantic and the Norwegian Seaduring the last 3.1 m.y.: comparison of sites 982 and 985: Proceedings of the OceanDrilling Program, Scienti"c Results, vol. 162, pp. 179–190. College Station, TX.
Baumann, K.-H., Matthiessen, J., 1992. Variations in surface water mass conditions inthe Norwegian Sea: evidence from Holocene coccolith and dino!agellate cystassemblages. Marine Micropaleontology 20, 129–146.
Baumann, K.-H., Meggers, H., 1996. Paleoceanographic changes in the Labrador Seaduring the past 3.0 My: evidence from calcareous plankton records. In:Moguilevsky, A., Whatley, R. (Eds.), Microfossils and Oceanic Environments. Univ.of Wales (Aberystwyth Press), pp. 131–153.
Baumann, K.-H., Cepek, M., Kinkel, H., 1999. Coccolithophores as indicators of oceanwater masses, surface-water temperature, and paleoproductivity examples fromthe South Atlantic. In: Fischer, G., Wefer, G. (Eds.), Use of Proxies in Paleoceano-graphy: Examples from the South Atlantic. Springer, Berlin, Heidelberg, pp.117–144.
Baumann, K.-H., Andruleit, H., Samtleben, C., 2000. Coccolithophores in the Nordic Seas:comparison of living communities with surface sediment assemblages. Deep SeaResearch II 47, 1743–1772.
Berger, W.H., Jansen, E., 1994. Mid-Pleistocene climate shift—the Nansen connection.In: Johanessen, O.M., et al. (Ed.), The Polar Oceans and Their Role Shaping theGlobal Environment: Geophysical Monograph Series, vol. 85, pp. 295–311.
Bertini, A., Ciaran", N., Marino, M., Palombo, M.R., 2010. Proposal for Pliocene andPleistocene land–sea correlation in the Italian area. Quaternary International 219,95–108.
Blaj, T., Henderiks, J., 2007. Smear and spray preparation techniques put to the test (II):reproducibility and accuracy of calcareous nannofossil assemblage counts. Journalof Nannoplankton Research 29 (2), 92–100.
Blasco, D., Estrada, M., Jones, B., 1980. Relationship between the phytoplanktondistribution and composition and the hydrography in the North–West Africanupwelling region near Cabo Corbeiro. Deep Sea Research 27, 799–819.
Boeckel, B., Baumann, K.-H., 2004. Distribution of coccoliths in surface sediments ofsouth-eastern South Atlantic Ocean: ecology, preservation and carbonate contri-bution. Marine Micropaleontology 51, 301–320.
Boeckel, B., Baumann, K.-H., 2008. Vertical and lateral variations in coccolithophorecommunity structure across the subtropical frontal zone in the South AtlanticOcean. Marine Micropaleontology 67, 255–273.
Bown, P.R., Young, J.R., 1998. Technique. In: Bown, P.R. (Ed.), Calcareous NannofossilBiostratigraphy. Kluwer Academic Publishing, Dordrecht, pp. 16–28.
Bown, P.R., Lees, J.A., Young, J.R., 2004. Calcareous nannoplankton evolution anddiversity through time. In: Thierstein, H.R., Young, J.R. (Eds.), Coccolithophores—From molecular Processes to Global Impact. Springer Editor, pp. 481–508.
Boyle, E.A., 1988. The role of vertical chemical fractionation in controlling lateQuaternary atmospheric carbon dioxide. Journal of Geophysical Research 93 (C12),15701–15714.
Boyle, E.A., Keigwin, L.D., 1985. A comparison of paleochemical records from the NorthAtlantic and North Paci"c Ocean: changes in deep ocean circulation and chemicalinventories. Earth and Planetary Science Letters 76, 135–150.
Boyle, E.A., Keigwin, L., 1987. North Atlantic thermohaline circulation during the past20000 years linked to high-latitude surface temperature. Nature 330, 35–40.
Brand, L.E., 1994. Physiological ecology of marine coccolithophores. In: Winter, A.,Siesser, W. (Eds.), Coccolithophores. Cambridge University Press, Cambridge, pp.39–49.
Broecker, W.S., 1993. An oceanographic explanation for the apparent carbon isotope–cadmium discrepancy in the glacial Antarctic? Paleoceanography 8, 137–139.
Cachao, M., Moita, M.T., 2000. Coccolithus pelagicus, a productivity proxy related tomoderate fronts off Western Iberia. Marine Micropaleontology 39, 131–155.
Carstens, J., Debbeln, D., Wefer, G., 1997. Distribution of planktic foraminifera at the icemargin in the Arctic (Fram Strait). Marine Micropaleontology 29, 257–269.
Castradori, D., 1993. Calcareous nannofossils and the origin of eastern Mediterraneansapropel. Paleoceanography 8, 459–471.
Channell, J.E.T., Raymo, M.E., 2003. Paleomagnetic record at ODP Site 980 (FeniDrift, Rockall) for the past 1.2 Myrs. Geochemestry, Geophysics, Geosystems.doi:10.1029/2002GC000440.
Ciaran", N., Lirer, F., Lirer, L., Lourens, L.J., Maiorano, P., Marino, M., Petrosino, P., Sprovieri,M., Stefanelli, S., Brilli, M., Girone, A., Joannin, S., Pelosi, N., Vallefuoco, M., 2010.Integrated stratigraphy and astronomical tuning of Lower-Middle PleistoceneMontalbano Jonico land section (Southern Italy). Quaternary International 219,109–120.
Clark, P.U., Archer, D., Pollard, D., Blum, L.D., Rial, J.A., Brovkin, V., Mix, A.C., Pisias, N.G.,Roy, M., 2006. The middle Pleistocene transition: characteristics, mechanisms, andimplications for long-term changes in atmospheric pCO2. Quaternary ScienceReviews 25, 3150–3184.
CLIMAP, 1976. The surface of the ice age earth. Science 191, 1131–1137.deMenocal, P.B., Oppo, D.W., Prell, W.L., 1992. Pleistocene d13C variability of North
Atlantic Intermediate Waters. Paleoceanography 7, 229–250.
Dittert, N., Baumann, K.-H., Bickert, R., Henrich, R., Huber, R., Kinkel, H., Meggers, H.,1999. Carbonate dissolution in the deep-sea: methods, quanti"cation andpaleoceanographic application. In: Fischer, G., Wefer, G. (Eds.), Use of Proxies inPaleoceanography: Examples from the South Atlantic. Springer, Berlin, Heidelberg,pp. 255–284.
Donnally, D.M., 1989. In: Eldholm, O., Thiede, J., Taylor, E., et al. (Eds.), Calcareousnannofossils of the Nortwegian–Greenland Sea: ODP Leg 104: Proceedings of theOcean Drilling Program, Scienti"c Results, Vol. 104, pp. 459–486. College Station, TX.
Duplessy, J.C., Shackleton, N.J., Fairbanks, R.G., Labeyrie, L., Oppo, D., Kallen, N., 1988.Deepwater sources during the last glacial cycle and their impact on the globaldeepwater circulation. Paleoceanography 3, 343–360.
Findlay, C.S., Giraudeau, J., 2000. Extant calcareous nannoplankton in the Australiasector of the southern ocean (Austral summers 1994 and 1995). MarineMicropaleontology 40, 417–439.
Flores, J.A., Sierro, F.J., 2007. Pronounced mid-Pleistocene southward shift of the PolarFront in the Atlantic sector of the Southern Ocean. Deep-Sea Research II 54,2432–2442.
Flower, B.P., Oppo, D.W., McManus, J.F., Venz, K.A., Hodell, D.A., Cullen, J., 2000. NorthAtlantic intermediate to deep water circulation and chemical strati"cation duringthe past 1 Myr. Paleoceanography 15, 388–403.
Gard, G., Backman, J., 1990. Synthesis of Arctic and Sub-Arctic coccolith biochronologyand History of North Atlantic drift water in!ux during the last 500,000 years. In:Bleil, U., Thiede, J. (Eds.), Geological History of the Polar Oceans: Arctic versusAntarctic. Kluwer, pp. 417–436.
Geisen,M., Billard, C., Broerse, A., Cros, L., Probert, I., Young, J.R., 2002. Life-cycle associationsinvolving pairs of holococcolithophorid species: intraspecifc variation or crypticspeciation? Journal of Phycology 37, 531–550. doi:10.1017/S0967026202003852.
Gibbs, S., Shackleton, N., Young, J., 2004. Orbitally forced climate signals inmid-Pliocenenannofossil assemblages. Marine Micropaleontology 51, 39–56.
Giraudeau, J., Baley, G.W., 1995. Spatial dynamics of coccolithophore communities duringan upwelling event in the Southern Benguela system. Continental Shelf Research 15,1825–1852.
Haidar, A.T., Thierstein, H.R., 1997. Calcareous phytoplankton dynamics at Bermuda (N.Atlantic). European Geosciences Union, Abstract Supplement 1 Terra Nova 9, p. 602.
Hammer, Ø., Harper, D.A.T., Ryan, P.D., 2001. PAST: Paleontological Statistics softwarepackage for education and data analysis. Palaeontologia Electronica 4 (1)http://www.palaeo-electronica.org/2001_1/past/issue1_01.htm 9 pp.
Heinrich, H., 1988. Origin and consequence of cyclic ice rafting in the northeast AtlanticOcean during the past 130,000 years. Quaternary Research 29, 142–152.
Hewitt, C.D., Broccoli, A.J., Mitchell, J.F.B., Stouffer, R.J., 2001. A coupled model study ofthe last glacial maximum: was part of the North Atlantic relatively warm?Geophysical Research Letters 28, 1571–1574.
Hodell, D.A., Charles, C.D., Sierro, F.J., 2001. Late Pleistocene evolution of the ocean'scarbonate system. Earth and Planetary Science Letters 192, 109–124.
Hodell, D.A., Venz, K.A., Charles, C.D., Ninnemann, U.S., 2003. Pleistocene verticalisotope and carbonate gradient in South Atlantic sector of the Southern Ocean.Geochemistry, Geophysics, Geosystems 4, 1004. doi:10.1020/2002GC000367.
Hodell, D.A., Minth, E.K., Curtis, J.H., McCave, I.N., Hall, I.R., Channell, J.E.T., Xuan, C.,2009. Surface and deep-water hydrography on Gardar Drift (Iceland Basin) duringlast interglacial period. Earth and Planetary Science Letters 288, 10–19.
Huizhong, W., McCave, I.N., 1990. Distinguishing climatic and current effects in mid-Pleistocene sediments of Hatton and Gardar Drifts, NE Atlantic. Journal ofGeological Society London 147, 373–383.
Incarbona, A., Di Stefano, E., Sprovieri, R., Bonomo, S., Censi, P., Dinarès-Turell, J., Spoto,S., 2008. Vertcal structure variabilità of the water column and paleoproductivityreconstruction in the Central-Western Mediterranean during the Late Pleistocene.Marine Micropaleontology 69, 26–41.
Incarbona, A., Martrat, B., Di Stefano, E., Grimalt, J.O., Pelosi, N., Patti, B., Tranchida, G.,2010. Primari productivity variabilità on the Atlantic Iberian Margin over the last70000 years: evidence from coccolithophores and fossil organic compounds.Paleoceanography 25 (PA2218), 1–15. doi:10.1029/2008PA001709.
Johannessen, T., Jansen, E., Flatøy, A., Ravelo, A.C., 1994. The relationship betweensurface water masses, oceanographic fronts and paleoclimatic proxies in surfacesediments of the Greenland, Iceland, Norwegian seas. In: Zahn, R., et al. (Ed.),Carbon Cycling in the Glacial Ocean: Constraints on the Ocean's Role in GlobalChange. : NATO ASI Ser. I, vol. 117. Springer, Berlin, pp. 61–86.
Jordan, R.W., Cros, L., Young, J.R., 2004. A revised classi"cation scheme for livinghaptophytes. Micropaleontology 50, 55–79. doi:10.2113/50.
Katz, M.E., Finkel, Z.V., Grzebyk, D., Knoll, A.H., Falkowski, P.G., 2004. Evolutionarytrajectory and biogeochemical impact of marine eukaryotic phytoplankton. TheAnnual Review of Ecology, Evolution and Systematics 35, 523–556. doi:10.1146/annurev.ecolsys.35.112202.130137.
Kellogg, T.B., 1980. Paleoclimatology and paleo-oceanography of the Norwegian andGreenland Seas: glacial–interglacial contrasts. Boreas 9, 115–137.
Kleiven, H.F., Jansen, E., Curry, W.B., Hodell, D.A., Venz, K., 2003. Atlantic thermohalinecirculation changes on orbital to suborbital timescales during the mid-Pleistocene.Paleoceanography 18, 1008. doi:10.1029/2001PA000629.
Klejine, A., 1993. Morphology, taxonomy and distribution of extant Coccolithophorids(calcareous nannoplankton). Ph. D. Thesis, Vrije Universiteit, Amsterdam, 321 pp.
Knappertsbusch, M., 1993. Geographic distribution of living and Holocene coccolitho-phores in the Mediterranean Sea. Marine Micropaleontology 21, 219–247.
Knappertsbusch, M., Cortes, M.Y., Thierstein, H.R., 1997. Morphologic variability of thecoccolithophorid Calcidiscus leptoporus in the plankton, surface sediments and fromthe Early Pleistocene. Marine Micropaleontology 30, 293–317.
Knoll, A.H., 2003. Life on a Young Planet: The First Three Billion Years of Evolution onEarth. Princeton University Press, Princeton, NJ. 277 pp.
68 M. Marino et al. / Palaeogeography, Palaeoclimatology, Palaeoecology 306 (2011) 58–69
Lisiecki, L.E., Raymo, M.E., 2005. A Pliocene–Pleistocene stack of 57 globally distributedbenthic d18O records. Paleoceanography 20. doi:10.1029/2004PA001071.
Loubere, P., Mekik, F., Franc¸ois, R., Pichat, S., 2004. Export !uxes of calcite in the easternequatorial Paci"c from the Last Glacial Maximum to present. Paleoceanography 19(PA2018). doi:10.1029/2003PA000986.
Lourens, L.J., Hilgen, F.J., 1997. Long-periodic variations in the earth's obliquity and theirrelation to third-order eustatic cycles and Late Neogene glaciations. QuaternaryInternational 40, 43–52.
Maiorano, P., Marino, M., 2004. Calcareous nannofossil bioevents and environmentalcontrol on temporal and spatial patterns at the early–middle Pleistocene. MarineMicropaleontology 53, 405–422.
Manighetti, B., McCave, I.N., 1995. Late glacial and Holocene paleocurrents aroundRockall Bank. NE Atlantic Ocean. Paleoceanography 10, 611–626.
Marino, M., Maiorano, P., Lirer, F., 2008. Changes in calcareous nannofossil assemblagesduring the Mid-Pleistocene Revolution. Marine Micropaleontology 69, 70–90.doi:10.1016/j.marmicro.2007.11.010.
Marino, M., Maiorano, P., Lirer, F., Pelosi, N., 2009. Response of calcareous nannofossilassemblages to paleoenvironmental changes through the mid-Pleistocene revolu-tion at Site 1090 (Southern Ocean). Palaeogeography, Palaeoclimatology, Palaeoe-cology 280, 333–349.
Matsuoka, H., 1990. A new method to evaluate dissolution of CaCO3 in the deep-seasediments. Transaction and Proceedings of the Paleontological Society of Japan 157,430–434.
Matsuoka, H., Okada, H., 1989. Quantitative analysis of Pleistocene nannoplankton inthe subtropical northwestern Paci"c Ocean. Marine Micropaleontology 14, 97–118.
McCave, I.N., Manighetti, B., Beveridge, N.A.S., 1995. Circulation in the glacial NorthAtlantic inferred from grain-size measurements. Nature 374, 149–152.
McIntyre, A., Bè, A.H.W., 1967. Modern coccolithophores of the Atlantic Ocean—I.Placolith and cyrtoliths. Deep Sea Research 14, 561–597.
McIntyre, A., Ruddiman, W.F., Jantzen, R., 1972. Southward penetrations of the NorthAtlantic Polar Front: faunal and !oral evidence of large-scale surface water massmovements over the last 225,000 years. Deep Sea Research 19, 61–77.
Narciso, A., Cachão, M., de Abreu, L., 2006. Coccolithus pelagicus subsp. Pelagicus versusCoccolithus pelagicus subsp. braarudii (Coccolithophore, Haptophyta): a proxy forsurface subartic Atlantic waters off Iberia during the last 200 kyr. MarineMicropaleontology 59, 15–34.
Okada, H., Bukry, D., 1980. Supplementary modi"cation and introduction of codenumbers to the low-latitude coccolith biostratigraphic zonation (Bukry, 1973;1975). Marine Micropaleontology 5, 21–325.
Okada, H., McIntyre, A., 1979. Seasonal distribution of modern coccolithophores in thewestern North Atlantic Ocean. Marine Biology 54, 319–328.
Oppo, D.W., Fairbanks, R.G., 1987. Variability in the deep and intermediate watercirculation of the Atlantic Ocean: Northern Hemisphere modulation of theSouthern Ocean. Earth and Planetary Science Letters 86, 117–123.
Oppo, D.W., Lehman, S.J., 1993. Mid-depth circulation of the subpolar North Atlanticduring the Last Glacial Maximum. Science 259, 1148–1152.
Oppo, D.W., Raymo, M.E., Lohmann, G.P., Mix, A.C., Wright, J.D., Prell, W.L., 1995. A "13Crecord of upper North Atlantic deep water during the past 2.6 million years.Paleoceanography 10, 373–394.
Ortiz, J., Mix, A., Harris, S., O'Connell, S., 1999. Diffuse spectral re!ectance as a proxy forpercent carbonate content in North Atlantic sediments. Paleoceanography 14,171–186.
Paillard, D., Labeyrie, L., Yiou, P., 1996. Macintosh program performs time-seriesanalysis. Eos, Transactions. American Geophysical Union 77, 379.
Parente, A., Cachão, M., Baumann, K.-H., de Abreu, L., Ferreira, J., 2004. Morphometry ofCoccolithus pelagicus s.l. (Coccolithophore, Haptophyta) from offshore Portugal,during the last 200 kyr. Micropaleontology 50, 107–120.
Parke, M., Adams, I., 1960. The motile (Crystallolithus hyalinus Gaarder & Markall) andnon-motile phases in the life history of Coccolithus pclagicus (Wallich)Schiller.Journal of the Marine Biological Association of the United Kingdom 39, 263–274.
Quinn, P., Thierstein, H.R., Brand, L., Winter, A., 2003. Experimental evidence for thespecies character of Calcidiscus leptoporusmorphotypes. Journal of Paleontology 77,825–830.
Quinn, P.S., Sáez, A., Baumann, K.-H., Steel, B.A., Sprengel, C., Medlin, L.K., 2004.Coccolithophorid biodiversity: evidence from the cosmopolitan species Calcidiscusleptoporus. In: Thierstein, H., Young, J.R. (Eds.), Coccolithophores: From MolecularProcesses to Global Impact. Springer, Berlin, pp. 299–326.
Raf", I., 2002. Revision of the early-middle Pleistocene calcareous nannofossilbiochronology (1.75–0.85 Ma). Marine Micropaleontology 45, 25–55.
Raf", I., Backman, J., Fornaciari, E., Palike, H., Rio, D., Lourens, L., Hilgen, F., 2006. Areview of calcareous nannofossil astrobiochronology encompassing the past 25million years. Quaternary Science Reviews 25, 3113–3137.
Raymo, M.E., Ruddiman, W.F., Backman, J., Clement, B.M., Martinson, D.G., 1989. LatePliocene variation in northern Hemisphere ice sheet and north Atlantic deep watercirculation. Paleoceanography 4, 413–446.
Raymo, M.E., Ruddiman, W.F., Rind, D., 1990. Climatic effects of reduced Arctic sea icelimits in the GISS-II GCM. Paleoceanography 5, 367–382.
Raymo, M.E., Oppo, D.W., Curry, W., 1997. The mid-Pleistocene climate transition: adeep sea carbon isotopic perspective. Paleoceanography 12, 546–559.
Raymo, M.E., Oppo, D.W., Flower, B.P., Hodell, D.A., McManus, J.F., Venz, K.A., Kleiven, K.F.,McIntyre, K., 2004. Stability of North Atlantic water masses in face of pronouncedclimate variability during thePleistocene. Paleoceanography19, PA2008.doi:10.1029/2003PA000921.
Reale, V., Monechi, S., 2005. Distribution of the calcareous nannofossil Reticulofenestraasanoiwithin the Early–Middle Pleistocene transition in theMediterranean Sea andAtlantic Ocean: correlation with magneto- and oxygen isotope stratigraphy.Geological Society, London, Special Publications; 2005, v. 247, pp. 117–130.doi:10.1144/GSL.SP.2005.247.01.06.
Rey, F., Loeng, H., 1985. The in!uence of ice and hydrographic conditions on thedevelopment of phytoplankton in the Barents Sea. In: Gray, J.S., Christiansen, M.E.(Eds.), Marine biology of polar regions and effects of stress on marine organisms.Wiley, New York, pp. 49–64.
Rickaby, R.E.M., Elder"eld, H., 2005. Evidence from low latitude North Atlantic forvariations in Antarctic water !ow during the last deglaciations. Geochemistry,Geophysics, Geosystems 6, Q05001. doi:10.1029/2004GC000858.
Ruddiman,W.F., 1977. Late Quaternary deposition of ice-rafted sand in the subpolarNorthAtlantic (lat. 40° to 65°). Geological Society of America Bulletin 8, 1813–1827.
Ruddiman,W.F., McIntyre, A., 1981a. The mode andmechanism of the last deglaciation:oceanic evidence. Quaternary Research 16, 125–134.
Ruddiman, W.F., McIntyre, A., 1981b. Oceanic mechanisms for ampli"cation of the23,000-year ice volume cycle. Science 212, 617–627.
Ruddiman, W.F., Raymo, M.E., Martinson, D.G., Clement, B.M., Backman, J., 1989. Mid-Pleistocene evolutionofNorthernHemisphere climate. Paleoceanography 4, 353–412.
Saenko, O.A., Weaver, A.J., 2001. Importance of wind-driven sea ice motion for theformation of Antarctic Intermediate Water in a global climate model. GeophysicalResearch Letters 28, 4147–4150.
Sakshaug, E., Slagstad, D., 1991. Light and productivity of phytoplankton in polarmarine ecosystems: a physiological view. Polar Research 10, 69–85.
Samtleben, C., Schröder, A., 1992. Living coccolithophore communities in theNorwegian–Greenland Sea and their record in sediments. Marine Micropaleontol-ogy 19, 333–354.
Samtleben, C., Shafer, P., Andruleit, H., Baumann, A., Baumann, K.H., Kohly, A.,Matthiessen, J., Scholder-Ritzrau, A., 1995. Plankton in the Norwegian–GreenlandSea: from living communities to sediment assemblages—an actualistic approach.Geologische Rundschau 84, 108–136.
Schmieder, F., von Dobeneck, T., Bleil, U., 2000. The Mid-Pleistocene climate transitionas documented in the deep South Atlantic Ocean: Initiation, interim state andterminal event. Earth and Planetary Science Letters 179, 539–549.
Shipboard Scienti"c Party, 1996. Sites 980/981. In: Jansen, E., et al. (Ed.), Proceedings ofOcean Drilling Program Initial Reports, vol. 162. Ocean Drilling Program, CollegeStation, TX, pp. 49–90.
Solignac, S., de Vernal, A., Giraudeau, J., 2008. Comparison of coccolith and dinocystassemblages in the northern North Atlantic: how well do they relate with surfacehydrography? Marine Micropaleontology 68, 115–135.
Sprovieri, R., Di Stefano, E., Howell, M., Sakamoto, T., Di Stefano, A., Marino, M., 1998. In:Robertson, A.H.F., Emeis, K.C., Richter, C., Camerlenghi, A. (Eds.), Integrated calcareousplankton biostratigraphy and ciclostratigraphy at Site 964: Proceedings OceanDrilling Program, Scienti"c Results, vol. 160, pp. 155–165. College Station, TX.
Steel, B. A. 2001. Physiology, growth andmorphometry of selected extant coccolithophor-ids, with particular reference to Calcidiscus leptoporus (Murray and Blackman, 1889)Loeblich and Tappan 1987. MSc Thesis, University College London, London, 83 pp.
Stolz, K., Baumann, K.-H., 2010. Change in paleoceanography and paleoecology duringMarine Isotope Stage (MIS) 5 in the eastern North Atlantic (ODP Site 980) deducedfrom calcareous nannoplankton observations. Palaeogeography PalaeoclimatologyPalaeoecology 292, 295–305.
Thierstein, H.R., Young, J.R., 2004. Coccolithophores fromMolecular Processes to GlobalImpact. Springer, Berlin. 565 pp.
Thomas, E., Booth, L., Maslin, M., Shackleton, N.J., 1995. Northeastern Atlantic benthicforaminifera during the last 45,000 years: changes in productivity seen from thebottom up. Paleoceanography 10, 452–462.
Venz, K., Hodell, D.A., 2002. New evidence for changes in Plio-Pleistocene deep watercirculation from Southern Ocean ODP Leg 177 Site 1090. PalaeogeographyPalaeoclimatology Palaeoecology 182, 197–220.
Venz, K.A., Hodell, D.A., Stanton, C., Warnke, D.A., 1999. A 1.0 Ma record of Glacial NorthAtlantic water variability from ODP Site 982 in the northeast Atlantic. Paleoceano-graphy 14, 42–52.
Winter, A., Jordan, R.W., Roth, P.H., 1994. Biogeography of living Coccolithophores inocean waters. In: Winter, A., Siesser, W.G. (Eds.), Coccolithophores. CambridgeUniversity Press, London, pp. 161–178.
Wright, A.K., Flower, B.P., 2002. Surface and deep ocean circulation in subpolar NorthAtlantic during the mid-Pleistocene revolution. Paleoceanography 17, 1068.doi:10.1029/2002PA000782.
Young, J.R., Ziveri, P., 2000. Calculation of coccolith volume and its use in calibration ofcarbonate !ux estimates. Deep-Sea Research. Special Part II: Topical studies inoceanography. In: Ganssen, G., Wefer, G. (Eds.), Particle !uxes and theirpreservation in deep sea sediments, vol. 47, pp. 1679–1700.
Young, J., Geisen, M., Cors, L., Klijne, A., Sprengel, C., Probert, I., Osternngaard, J., 2003. Aguide to extant coccolithophores taxonomy. Journal of Nannoplankton Research,Special Issue 1, 125 pp.
Ziegler, P.A., 1982. Geological Atlas of Western and Central Europe. The Hague: ShellInternational Petroleum Maatschappij B.V. Elsevier Scienti"c Publishing Company.130 pp.
Ziveri, P., Baumann, K.-H., Boeckel, B., Bollmann, J., Young, J., 2004. Biogeography ofselected Holocene coccoliths in the Atlantic Ocean. In: Thierstein, H.R., Young, Y.R.(Eds.), Coccolithophores: from Molecular Processes to Global Impact. Springer,Berlin, pp. 403–428.
69M. Marino et al. / Palaeogeography, Palaeoclimatology, Palaeoecology 306 (2011) 58–69