palaeogeography, palaeoclimatology, palaeoecologyib.berkeley.edu/labs/barnosky/kent-corson et al...
TRANSCRIPT
Palaeogeography, Palaeoclimatology, Palaeoecology 387 (2013) 17–26
Contents lists available at ScienceDirect
Palaeogeography, Palaeoclimatology, Palaeoecology
j ourna l homepage: www.e lsev ie r .com/ locate /pa laeo
Possible regional tectonic controls on mammalian evolution in westernNorth America
Malinda L. Kent-Corson a,⁎, AnthonyD. Barnosky b, AndreasMulch c,d,e, Marc A. Carrasco b, C. Page Chamberlain f
a Division of Earth Sciences, Nanyang Technological University, 639798, Singaporeb Department of Integrative Biology and Museum of Paleontology, University of California, Berkeley, CA 94709, USAc Biodiversity and Climate Research Centre (BiK-F), 60325 Frankfurt, Germanyd Institute of Geosciences, Goethe University Frankfurt, 60438 Frankfurt, Germanye Senckenberg Research Institute, 60325 Frankfurt, Germanyf Department of Environmental Earth System Science, Stanford University, Stanford, CA 94305, USA
⁎ Corresponding author. Tel.: +65 9799 7405.E-mail address: [email protected] (M.L. Kent
0031-0182/$ – see front matter © 2013 Elsevier B.V. All rihttp://dx.doi.org/10.1016/j.palaeo.2013.07.014
a b s t r a c t
a r t i c l e i n f oArticle history:Received 5 October 2012Received in revised form 6 July 2013Accepted 11 July 2013Available online 16 July 2013
Keywords:Mammalian evolutionTectonicsStable isotopesMiocenePaleontologyMammal diversity
Previouswork has suggested that tectonically active regions act as speciation pumps formammals and plant spe-cies, but little is known about how fast or widespread tectonismmust be in order to directly influence evolution.Here, we use oxygen and hydrogen isotopic data from Miocene sedimentary deposits to characterize thetopographic evolution of the southern Columbia Plateau/Snake River Plain and northern RockyMountain regionsduring the Yellowstone hotspot passage, with the ultimate goal of understanding whether topographic changescaused by the hotspot influenced mammalian evolution within those regions. We conducted oxygen isotopeanalyses of 130 samples of lacustrine, and paleosol carbonate from Miocene stratigraphic sections that spanmuch of the northern Rocky Mountain region, and combined these data with previously published isotopicrecords. Collectively these isotopic data show that caldera formation associated with the Yellowstone hotspothas modified regional topography and rearranged drainages along the track of the hotspot, and that the hotspothas left a topographic depression in its wake.We explore the extent to which these topographic changes influenced or are decoupled from diversity changesexhibited by the localmammal faunas and conclude that the passage of the hotspot and consequent surface upliftcreated rainshadows in the lee of high-elevation calderas and/or generated large volumes of volcanic materials,influencing soils and vegetation. Collectively, that may explain a possible rise in mammal diversity in the CP/SRPregion at ~14 Ma, coincident with a drop in diversity in the NRM. It is still unclear, however, how differenttaphonomic pathways and sample-standardization problems are influencing apparent diversity peaks at thistemporal and geographic resolution.
© 2013 Elsevier B.V. All rights reserved.
1. Introduction
Theories of mammalian evolution offer a diverse range of hypothe-ses regarding the primary drivers of evolutionary change, with muchdebate about the relative importance of biotic interactions versusperturbations to the physical environment as motors of speciation(e.g., Van Valen, 1973; Bell, 1982; Vrba, 1992; Janis and Wilhelm,1993; Barry et al., 1995; Webb and Opdyke, 1995; Dybdahl and Lively,1998; Martin and Fairbanks, 1999; Barnosky, 2001; Benton, 2009;Badgley, 2010; Finarelli and Badgley, 2010). Biotic interactions involveever-escalating selective pressures rooted in competition and preda-tion. Physical–environmental changes include processes such as climatechange and episodes of tectonic activity. Changing climate ultimatelyrearranges climate zones that species are adapted to, or createsnew combinations of climate parameters without altering topography
-Corson).
ghts reserved.
(Parry et al., 2007; Williams et al., 2007; Barnosky, 2009). Tectonic ac-tivity dramatically alters the topography and as a consequence usuallyalso alters regional climates and sometimes global climate (Ruddimanand Kutzbach, 1990; Kutzbach et al., 1993). Because of the steep tem-perature gradients acrossmountainous topography regional surface up-lift directly correlates with changes in mean annual temperature andfrequently mean annual precipitation.
Both climate change by itself and tectonic events theoretically couldinfluence evolutionary rates because both have the potential to increaseselection pressures while isolating populations and otherwise alteringspecies' geographic ranges (Badgley, 2010; Finarelli and Badgley,2010). For mammals, climate changes influence distributions throughdirect physiological impacts in some cases (for example, restriction ofpikas to high mountain-tops because they cannot tolerate high diurnaltemperatures; Smith and Weston, 1990; Beever et al., 2010), but morecommonly through more complex ecological pathways such as alteringcritical vegetational aspects of habitat (e.g., Carroll and Genoways,1980; Rosenzweig, 1995; Graham, 1999; Lomolino et al., 2010).

16 14 1310
107
A
BC
D
E
F
G
H IJ K
L M
O
P
Q
R
S
42
1CP/SRP Province
C
D
E
F
G
Q
P
OR
S
ML
KJIH
A NRM Province
Basin and Range
42°
48°
46°
44°
116° 112° 108°120°124°
N
0 100 200
miles
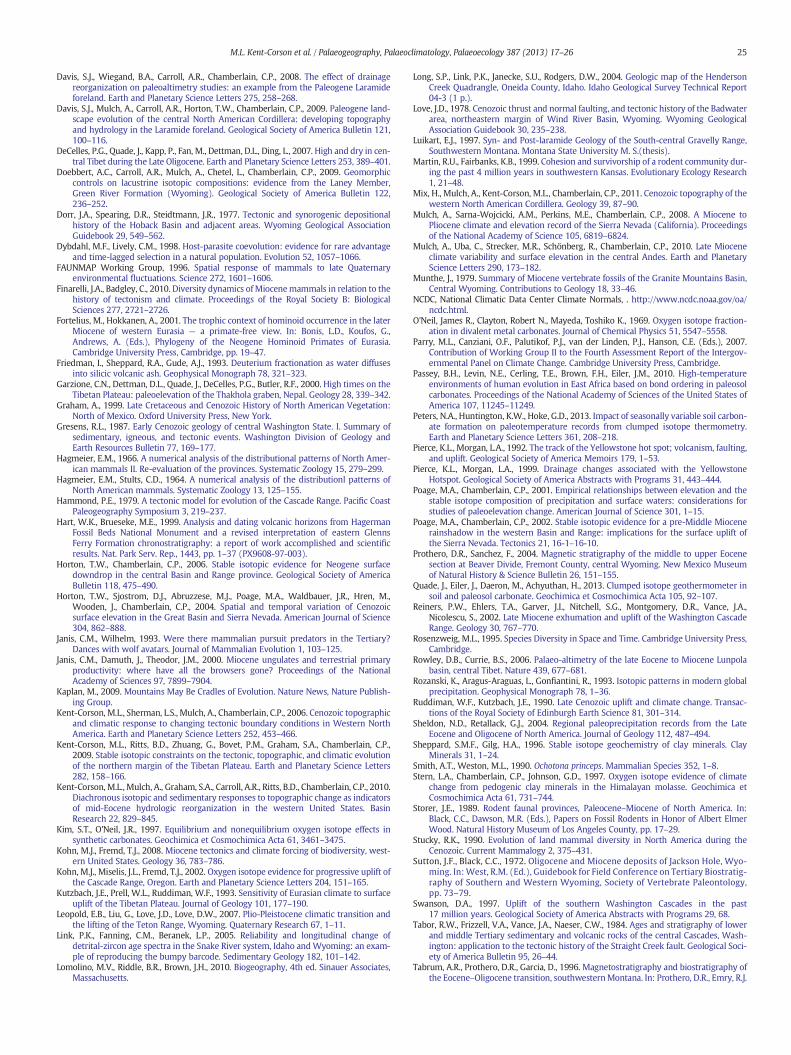
Fig. 1. Shaded relief map of the study area, with stable isotope sample localities shownwith white circles. A) Eastern Washington (Takeuchi and Larson, 2005), B) Virgin Valley(Horton et al., 2004), C) Willow Creek (Horton et al., 2004), D) Carlon-Pinyon (Hortonet al., 2004), E) Twin Falls (Mulch et al., 2008), F) Hagerman Fossil Beds (this study),G) Trapper Creek (Horton et al., 2004; Mulch et al., 2008), H) Railroad Canyon(Kent-Corson et al., 2006), I) Sage Creek Basin (Kent-Corson et al., 2006, this study), J)Ruby Basin (Kent-Corson et al., 2006; this study), K) Gravelly Range (this study), L) Jeffer-son Basin (this study), M) Madison Basin (this study), O) Idaho Falls (Mulch et al., 2008),P) Bannock Basin (this study), Q) Rush Valley (Horton et al., 2004), R) Hoback Basin (thisstudy), S) South Wind River Basin (this study), T) North Wind River Basin (this study).Selected eruptive centers of the Yellowstone hotspot are shown by gray circles, withages of eruption rounded to the closest Ma (from Anders and Hemming, 2004). TheBasin and Range Province is outlined by dashed lines. The Columbian Plateau/NorthernSnake River Plain (CP/SRP) andNorthernRockyMountain (NRM)physiographic provincesare outlined after Hagmeier (1966).
Table 1Temporal bins into which data were sorted.
NALMA subdivision Age boundaries Interval length
Late Late Hemphillian 5.9–4.7 Ma 1.2Early Late Hemphillian 6.7–5.9 Ma 0.8Late Early Hemphillian 7.5–6.7 Ma 0.8Early Early Hemphillian 9–7.5 Ma 1.5Late Clarendonian 10–9 Ma 1Middle Clarendonian 12–10 Ma 2Early Clarendonian 12.5–12 Ma 0.5Late Barstovian 14.8–12.5 Ma 2.3Early Barstovian 15.9–14.8 Ma 1.1Late Hemingfordian 17.5–15.9 Ma 1.6Early Hemingfordian 18.8–17.5 Ma 1.3Late Late Arikareean 19.5–18.8 Ma 0.7Early Late Arikareean 23.8–19.5 Ma 4.3Late Early Arikareean 27.9–23.8 4.1Early Early Arikareean 30–27.9 Ma 2.1
18 M.L. Kent-Corson et al. / Palaeogeography, Palaeoclimatology, Palaeoecology 387 (2013) 17–26
Tectonism, in addition to inevitably producing climatic impacts on biotain the region (Barnosky, 2001; Badgley et al., 2008; Badgley, 2010;Finarelli and Badgley, 2010), also may introduce new topographic bar-riers that can physically fragment and dramatically re-arrange speciesranges and introduce tectonically-controlled niches.
Recent studies that use the rich fossil record of western NorthAmerican mammals to untangle the relationship between speciationrates, climate change, and tectonism reveal little if any correlation be-tween speciation rates and climate changes alone (Alroy et al., 2000;Barnosky and Carrasco, 2002; Barnosky et al., 2005), though other stud-ies have suggested some role for climate based onmore limited subsetsof taxa and alternative temporal and geographic constraints (Janis et al.,2000; Barnosky, 2001; Badgley et al., 2008; Benton, 2009). The case formajor tectonic events as a motor of speciation, on the other hand, hasbeen gaining ground in recent years (Barnosky and Carrasco, 2002;Kohn and Fremd, 2008; Kaplan, 2009; Badgley, 2010; Finarelli andBadgley, 2010), primarily based on a major faunal turnover and specia-tion pulse that occurred in the western United States between ~18 and~16 Ma (Stucky, 1990; Alroy, 2000; Alroy et al., 2000; Barnosky andCarrasco, 2002; Kohn and Fremd, 2008). The timing is coincident withthe breakup of the northern Rocky Mountains into accentuated basinsand ranges, warping of the landscape and volcanism in the ColumbiaPlateau, and development of the Basin-and-Range province. Kohn andFremd (2008) argued that tectonism in fact acts to influence biodiversi-ty on regional to global scales, citing the increase in the percent area un-dergoing extension at around 17.5 Ma in thewestern United States as aregional driver of species diversity. As a potential example of a globaldriver, they pointed to a late Miocene decrease in western NorthAmerican mammal diversity, which they suggested was triggered byuplift of the Tibetan Plateau to an elevation that initiated global coolingthrough teleconnections that affected North American climate dynam-ics. Badgley (2010) expanded on this idea by suggesting that tectonicactivity would be expected to accelerate speciation by creating climaticand topographic heterogeneity, whichwould in turn affect connectivityand resource availability.
Here we explore a potential third geographic scale at which tecto-nism might influence mammalian evolution: the dramatic landscapechanges that resulted as the Yellowstone hotspot traversed thewesternUnited States from Oregon to Wyoming. This event, commencingaround 16 Ma in southwestern Oregon and still ongoing in today'sYellowstone National Park, was spatially and temporally superimposedon the subcontinental-scale tectonic activity that created the Basin andRange and segmented the northern RockyMountain andGreat Basin re-gions beginning ~17.5 Ma. As the hotspot location began to migrate,western American mammal species had already attained their mid-Miocene peak diversity. Subsequently, species experienced the dramat-ic impact of volcanism and rapid tectonic uplift associated with activityof the hotspot, followed by regional subsidence, and development of theSnake River Plain.
To assess the effects of these tectonic events on Miocene mammalfaunas, wefirst determine the extent of topographic change that accom-panied hotspot migration; then we examine the temporal patterns ofmammalian diversity in the provinces of interest. If passage of thehotspot did influence mammalian evolution, we would expect changesin mammalian diversity to coincide with topographic changes inducedby hotspot migration. Finally, we discuss potential mechanisms thatmight relate the reconstructed tectonic events to the observed diversitypatterns, and how taphonomic considerations may influence suchinterpretations.
2. Geologic and biogeographic setting
The landscape of the northwestern quarter of the United Statesunderwent dramatic changes during the Miocene. Beginning ~17 Ma,a broad region that includes much of what is now Nevada, as well asparts of Idaho, Oregon, Utah, and California began undergoing crustal
extension that doubled its width, and created a series of north–southtrending valleys and ranges (Fig. 1).
Volcanism associated with the Yellowstone Hotspot began around16 Ma in northernNevada, and since thenmigrated to its present locationin northwestern Wyoming (Pierce and Morgan, 1992). As the hot spotprogressed along this path, it changed drainage patterns (Link et al.,2005; Beranek et al., 2006), and left in its wake the Snake River Plain.
To thewest, a body of thermochronologic (Reiners et al., 2002), sed-imentologic (Tabor et al., 1984; Gresens, 1987; Vance et al., 1987), struc-tural (Hammond, 1979; Swanson, 1997), and isotopic (Takeuchi andLarson, 2005) evidence shows a pulse of exhumation and uplift in thecentral and northern Cascade Range beginning ~12 Ma, although thepresence of a rainshadow over the Oregon Cascades since the Eocene(Sheldon and Retallack, 2004) indicates that the range has existed insome form since that time.
Within this changing landscape, mammals evolved, immigrated,emigrated, and went extinct, resulting in 15 biochronologic intervalsdefined onmammalian species composition between ~30 and 5 millionyears ago (Tedford et al., 2004; Table 1). That evolution was at least in
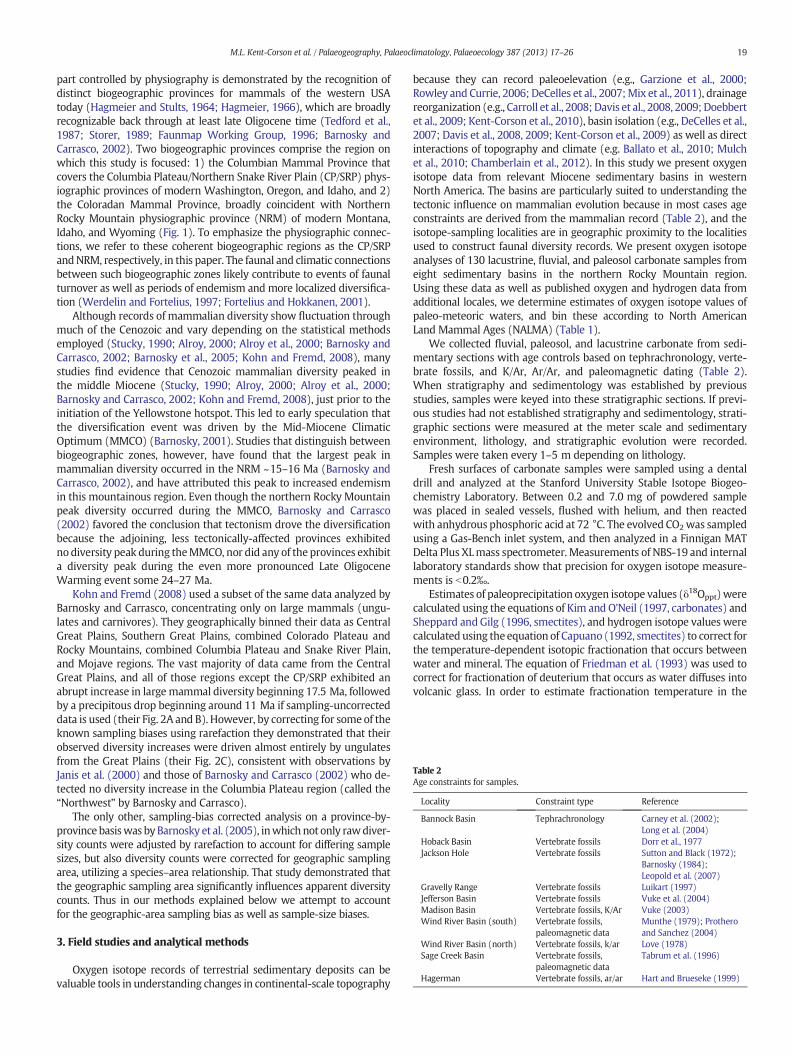
Table 2Age constraints for samples.
Locality Constraint type Reference
Bannock Basin Tephrachronology Carney et al. (2002);Long et al. (2004)
Hoback Basin Vertebrate fossils Dorr et al., 1977Jackson Hole Vertebrate fossils Sutton and Black (1972);
Barnosky (1984);Leopold et al. (2007)
Gravelly Range Vertebrate fossils Luikart (1997)Jefferson Basin Vertebrate fossils Vuke et al. (2004)Madison Basin Vertebrate fossils, K/Ar Vuke (2003)Wind River Basin (south) Vertebrate fossils,
paleomagnetic dataMunthe (1979); Protheroand Sanchez (2004)
Wind River Basin (north) Vertebrate fossils, k/ar Love (1978)Sage Creek Basin Vertebrate fossils,
paleomagnetic dataTabrum et al. (1996)
Hagerman Vertebrate fossils, ar/ar Hart and Brueseke (1999)
19M.L. Kent-Corson et al. / Palaeogeography, Palaeoclimatology, Palaeoecology 387 (2013) 17–26
part controlled by physiography is demonstrated by the recognition ofdistinct biogeographic provinces for mammals of the western USAtoday (Hagmeier and Stults, 1964; Hagmeier, 1966), which are broadlyrecognizable back through at least late Oligocene time (Tedford et al.,1987; Storer, 1989; Faunmap Working Group, 1996; Barnosky andCarrasco, 2002). Two biogeographic provinces comprise the region onwhich this study is focused: 1) the Columbian Mammal Province thatcovers the Columbia Plateau/Northern Snake River Plain (CP/SRP) phys-iographic provinces of modern Washington, Oregon, and Idaho, and 2)the Coloradan Mammal Province, broadly coincident with NorthernRocky Mountain physiographic province (NRM) of modern Montana,Idaho, and Wyoming (Fig. 1). To emphasize the physiographic connec-tions, we refer to these coherent biogeographic regions as the CP/SRPandNRM, respectively, in this paper. The faunal and climatic connectionsbetween such biogeographic zones likely contribute to events of faunalturnover as well as periods of endemism and more localized diversifica-tion (Werdelin and Fortelius, 1997; Fortelius and Hokkanen, 2001).
Although records of mammalian diversity show fluctuation throughmuch of the Cenozoic and vary depending on the statistical methodsemployed (Stucky, 1990; Alroy, 2000; Alroy et al., 2000; Barnosky andCarrasco, 2002; Barnosky et al., 2005; Kohn and Fremd, 2008), manystudies find evidence that Cenozoic mammalian diversity peaked inthe middle Miocene (Stucky, 1990; Alroy, 2000; Alroy et al., 2000;Barnosky and Carrasco, 2002; Kohn and Fremd, 2008), just prior to theinitiation of the Yellowstone hotspot. This led to early speculation thatthe diversification event was driven by the Mid-Miocene ClimaticOptimum (MMCO) (Barnosky, 2001). Studies that distinguish betweenbiogeographic zones, however, have found that the largest peak inmammalian diversity occurred in the NRM ~15–16 Ma (Barnosky andCarrasco, 2002), and have attributed this peak to increased endemismin this mountainous region. Even though the northern Rocky Mountainpeak diversity occurred during the MMCO, Barnosky and Carrasco(2002) favored the conclusion that tectonism drove the diversificationbecause the adjoining, less tectonically-affected provinces exhibitednodiversity peak during theMMCO, nor did any of the provinces exhibita diversity peak during the even more pronounced Late OligoceneWarming event some 24–27 Ma.
Kohn and Fremd (2008) used a subset of the same data analyzed byBarnosky and Carrasco, concentrating only on large mammals (ungu-lates and carnivores). They geographically binned their data as CentralGreat Plains, Southern Great Plains, combined Colorado Plateau andRocky Mountains, combined Columbia Plateau and Snake River Plain,and Mojave regions. The vast majority of data came from the CentralGreat Plains, and all of those regions except the CP/SRP exhibited anabrupt increase in largemammal diversity beginning 17.5 Ma, followedby a precipitous drop beginning around 11 Ma if sampling-uncorrecteddata is used (their Fig. 2A and B). However, by correcting for some of theknown sampling biases using rarefaction they demonstrated that theirobserved diversity increases were driven almost entirely by ungulatesfrom the Great Plains (their Fig. 2C), consistent with observations byJanis et al. (2000) and those of Barnosky and Carrasco (2002) who de-tected no diversity increase in the Columbia Plateau region (called the“Northwest” by Barnosky and Carrasco).
The only other, sampling-bias corrected analysis on a province-by-province basiswas byBarnosky et al. (2005), inwhich not only rawdiver-sity counts were adjusted by rarefaction to account for differing samplesizes, but also diversity counts were corrected for geographic samplingarea, utilizing a species–area relationship. That study demonstrated thatthe geographic sampling area significantly influences apparent diversitycounts. Thus in our methods explained below we attempt to accountfor the geographic-area sampling bias as well as sample-size biases.
3. Field studies and analytical methods
Oxygen isotope records of terrestrial sedimentary deposits can bevaluable tools in understanding changes in continental-scale topography
because they can record paleoelevation (e.g., Garzione et al., 2000;Rowley and Currie, 2006; DeCelles et al., 2007;Mix et al., 2011), drainagereorganization (e.g., Carroll et al., 2008; Davis et al., 2008, 2009; Doebbertet al., 2009; Kent-Corson et al., 2010), basin isolation (e.g., DeCelles et al.,2007; Davis et al., 2008, 2009; Kent-Corson et al., 2009) as well as directinteractions of topography and climate (e.g. Ballato et al., 2010; Mulchet al., 2010; Chamberlain et al., 2012). In this study we present oxygenisotope data from relevant Miocene sedimentary basins in westernNorth America. The basins are particularly suited to understanding thetectonic influence on mammalian evolution because in most cases ageconstraints are derived from the mammalian record (Table 2), and theisotope-sampling localities are in geographic proximity to the localitiesused to construct faunal diversity records. We present oxygen isotopeanalyses of 130 lacustrine, fluvial, and paleosol carbonate samples fromeight sedimentary basins in the northern Rocky Mountain region.Using these data as well as published oxygen and hydrogen data fromadditional locales, we determine estimates of oxygen isotope values ofpaleo-meteoric waters, and bin these according to North AmericanLand Mammal Ages (NALMA) (Table 1).
We collected fluvial, paleosol, and lacustrine carbonate from sedi-mentary sections with age controls based on tephrachronology, verte-brate fossils, and K/Ar, Ar/Ar, and paleomagnetic dating (Table 2).When stratigraphy and sedimentology was established by previousstudies, samples were keyed into these stratigraphic sections. If previ-ous studies had not established stratigraphy and sedimentology, strati-graphic sections were measured at the meter scale and sedimentaryenvironment, lithology, and stratigraphic evolution were recorded.Samples were taken every 1–5 m depending on lithology.
Fresh surfaces of carbonate samples were sampled using a dentaldrill and analyzed at the Stanford University Stable Isotope Biogeo-chemistry Laboratory. Between 0.2 and 7.0 mg of powdered samplewas placed in sealed vessels, flushed with helium, and then reactedwith anhydrous phosphoric acid at 72 °C. The evolved CO2was sampledusing a Gas-Bench inlet system, and then analyzed in a Finnigan MATDelta Plus XLmass spectrometer. Measurements of NBS-19 and internallaboratory standards show that precision for oxygen isotope measure-ments is b0.2‰.
Estimates of paleoprecipitation oxygen isotope values (δ18Oppt)werecalculated using the equations of Kim and O'Neil (1997, carbonates) andSheppard andGilg (1996, smectites), and hydrogen isotope values werecalculated using the equation of Capuano (1992, smectites) to correct forthe temperature-dependent isotopic fractionation that occurs betweenwater and mineral. The equation of Friedman et al. (1993) was used tocorrect for fractionation of deuterium that occurs as water diffuses intovolcanic glass. In order to estimate fractionation temperature in the

20 M.L. Kent-Corson et al. / Palaeogeography, Palaeoclimatology, Palaeoecology 387 (2013) 17–26
past, we modified modern mean annual temperatures (NCDC andNational Climatic Data Center Climate Normals, 2012) using mid-latitude North American terrestrial paleotemperature estimates fromWolfe (1994). Although these temperatures are likely lower than the ac-tual temperature of soil carbonate formation (e.g. Breeker et al., 2009;Passey et al., 2010; Peters et al., 2013; Quade et al., 2013), any offsetinduced by our use of MAT's should be internally consistent.
In cases where only δD values were measured, δ18O estimates werecalculated assuming that samples parallel the global meteoric waterline.
For our mammalian diversity estimates, we used data from theMIOMAP database (Carrasco et al., 2005) and methods explained inBarnosky et al. (2005) and in the Supplementary Text to calculatesample-standardized diversity and geographic-sampling area for eachrelevant time bin in the CP/SRP and NRM. To guard against erroneouslyrecognizing diversity peaks that could result from sampling areas of dif-ferent sizes, we examined the data not only by rarefying occurrences toaccount for differing sample sizes, but also in two ways designed to de-tect species–area effects. First, we divided each diversity value by geo-graphic sampling area. Second, we used the species–area relationship(SAR) previously determined for Neogene mammals (Carrasco et al.,2009) and assessed how far and in what direction observed richnessin each time period and region deviated from expectations of the SAR.We also examined alpha diversity and numbers of sites contributingto species richness in the CP/SRP and NRM, using methods explainedin Barnosky and Carrasco (2002). No standardization methodologywas applied to correct for the unequal time bins sampled because previ-ous work (Barnosky et al., 2005) has shown that there is no correlationbetween bin length and the number of localities per bin. In addition, thesubdivisions of the NALMAs (Table 1) that we used are definable pre-cisely because there is limited turnover during each time interval.Thus, these time bins are well-suited for comparing diversity throughtime.
116° 112° 108°120°124°
42°
48°
46°
44°
I
L
S
CP/SRP Province
NRM Province
Basin and Range
42°
48°
46°
44°
Arikareean(30-18.8 Ma)
16
D
H I
CP/SRP Province
NRM Province
Basin and Range
Hemingfordian(18.8-14.8 Ma)
Fig. 2. Average paleoprecipitation δ18O values through time arranged by North American Landgray circles, with ages rounded to the closestMa (fromAnders andHemming, 2004). To preventobserved isotopic trends, we have adjusted smectite sample values by subtracting 3.5‰ (the avethis we correct for the systematic offset between the values, which does not change significansamples are less legitimate than those obtained fromglasses and carbonate, but simply aim tomWe have not adjusted δ18Oppt from the eastern Washington stratigraphy because these sample
4. Results
4.1. Isotopes
Oxygen and carbon isotope data are shown along with publishedisotope results from Horton et al. (2004), Takeuchi and Larson (2005),Kent-Corson et al. (2006), and Mulch et al. (2008) in SupplementaryTable 1, with groupings determined by NALMA (Tedford et al., 2004;Table 1). Oxygen isotope values measured in this study range from 7.0to 17.5‰ (SMOW), and carbon isotope values range from −15.7 to2.7‰ (PDB).
Study areas south of the Snake River Plain that have been publishedpreviously (Horton et al., 2004; Mulch et al., 2008; Chamberlain et al.,2012) contain isotopic data obtained from carbonate, chert, glass, andsmectite. In these samples, carbonate and chert samples are in disequi-librium with smectite samples (Horton et al., 2004) as has been ob-served in other studies comparing carbonate and smectite oxygenisotope values (Stern et al., 1997; Poage and Chamberlain, 2002).However on the large spatial scales relevant to our analysis, samplesdisplay similar isotopic trends with similar magnitudes through time(see Fig. 3). This offset between carbonate and chert oxygen isotopevalues as compared to smectite oxygen isotope values is systematic,and observed in all of the binned NALMAs.
There are several characteristics that can be noted based on the spa-tial distribution of δ18Oppt (Fig. 2). First, oxygen isotope values vary spa-tially in each time interval. Second, δ18Oppt values adjacent to activevolcanic centers of the Yellowstone hotspot are generallymore negativethan in other sample localities, and δ18Oppt values in the wake of theYellowstone hotspot are generally more positive than other sample lo-calities. This can be seen by referring to Fig. 3, which shows data throughtime in grouped locales (for instance South of the Snake River Plane)spanning the time period of hotspot passage. Finally, although thereare several localities in which δ18Oppt is anomalously negative or
116° 112° 108°120°124°
16 14 13
A
C
D
G
H I
M
CP/SRP Province
NRM Province
Basin and Range
Barstovian(15.9-12.5 Ma)
16 14 1310
107
A
D
E
F
G
IJ
M
O
P
Q
R
CP/SRP Province
NRM Province
Basin and Range
Clarendonianand Hemphillian
(12.5-4.7 Ma)
δ18O precip. (SMOW)
< -18-18 to -16-16 to -14-14 to -12> -12
Mammal Ages. Age-appropriate eruptive centers of the Yellowstone hotspot are shown bythe proportion of smectite vs. calcite and glass samples in each age group from influencingrage difference between the two sample groups) from all smectite sample values. By doingtly through time. We in no way suggest that estimates of δ18Oppt obtained from smectiteake estimates of δ18Oppt fromdifferent sample types comparable through this stratigraphy.s are all of the same type.
0
3
6
9
12
15
-23 -20 -17 -14 -11
Eastern Washington(A)
0
3
6
9
12
15
-23 -20 -17 -14 -11
Bannock Basin(P)
South Snake RiverPlain (C, D, E, G)
0
3
6
9
12
15
-23 -20 -17 -14 -11
Age
(M
a)
δ18Oδ18O
δ18Oδ18O
Age
(M
a)
0
3
6
9
12
15
-23 -20 -17 -14 -11
SW Montana(H, I, J, M)
Fig. 3. Oxygen isotope records of paleoprecipitation (in SMOW) calculated from calcite(shale/limestone blue; sandstone/conglomerate cement purple; paleosol carbonate/calcareous ash black; smectite red; and glass green). Letters in parentheses refer to localesin Fig. 1.
0
10
20
30
40
50
51015202530
Species R
ichness
Richness/log area
Richness
Age (Ma)
Arikareaan Hem. Bars. Clar. Hemp.
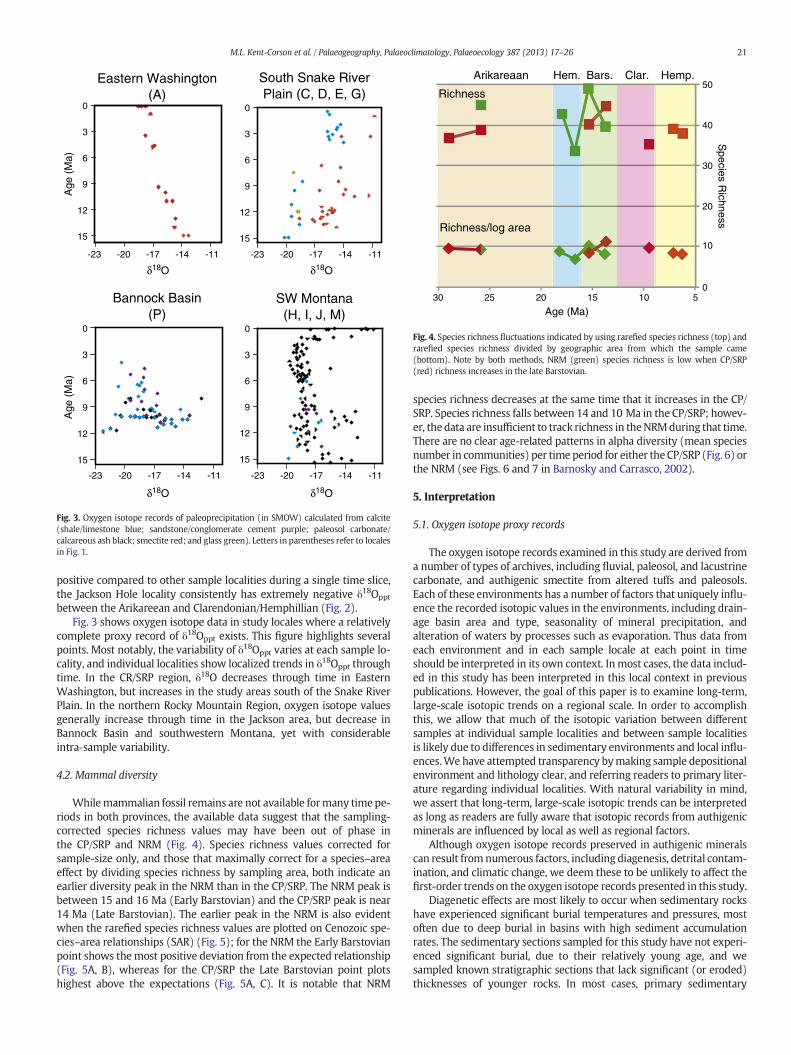
Fig. 4. Species richness fluctuations indicated by using rarefied species richness (top) andrarefied species richness divided by geographic area from which the sample came(bottom). Note by both methods, NRM (green) species richness is low when CP/SRP(red) richness increases in the late Barstovian.
21M.L. Kent-Corson et al. / Palaeogeography, Palaeoclimatology, Palaeoecology 387 (2013) 17–26
positive compared to other sample localities during a single time slice,the Jackson Hole locality consistently has extremely negative δ18Oppt
between the Arikareean and Clarendonian/Hemphillian (Fig. 2).Fig. 3 shows oxygen isotope data in study locales where a relatively
complete proxy record of δ18Oppt exists. This figure highlights severalpoints. Most notably, the variability of δ18Oppt varies at each sample lo-cality, and individual localities show localized trends in δ18Oppt throughtime. In the CR/SRP region, δ18O decreases through time in EasternWashington, but increases in the study areas south of the Snake RiverPlain. In the northern Rocky Mountain Region, oxygen isotope valuesgenerally increase through time in the Jackson area, but decrease inBannock Basin and southwestern Montana, yet with considerableintra-sample variability.
4.2. Mammal diversity
Whilemammalian fossil remains are not available formany timepe-riods in both provinces, the available data suggest that the sampling-corrected species richness values may have been out of phase inthe CP/SRP and NRM (Fig. 4). Species richness values corrected forsample-size only, and those that maximally correct for a species–areaeffect by dividing species richness by sampling area, both indicate anearlier diversity peak in the NRM than in the CP/SRP. The NRM peak isbetween 15 and 16 Ma (Early Barstovian) and the CP/SRP peak is near14 Ma (Late Barstovian). The earlier peak in the NRM is also evidentwhen the rarefied species richness values are plotted on Cenozoic spe-cies–area relationships (SAR) (Fig. 5); for the NRM the Early Barstovianpoint shows themost positive deviation from the expected relationship(Fig. 5A, B), whereas for the CP/SRP the Late Barstovian point plotshighest above the expectations (Fig. 5A, C). It is notable that NRM
species richness decreases at the same time that it increases in the CP/SRP. Species richness falls between 14 and 10 Ma in the CP/SRP; howev-er, thedata are insufficient to track richness in theNRMduring that time.There are no clear age-related patterns in alpha diversity (mean speciesnumber in communities) per time period for either theCP/SRP (Fig. 6) orthe NRM (see Figs. 6 and 7 in Barnosky and Carrasco, 2002).
5. Interpretation
5.1. Oxygen isotope proxy records
The oxygen isotope records examined in this study are derived froma number of types of archives, including fluvial, paleosol, and lacustrinecarbonate, and authigenic smectite from altered tuffs and paleosols.Each of these environments has a number of factors that uniquely influ-ence the recorded isotopic values in the environments, including drain-age basin area and type, seasonality of mineral precipitation, andalteration of waters by processes such as evaporation. Thus data fromeach environment and in each sample locale at each point in timeshould be interpreted in its own context. Inmost cases, the data includ-ed in this study has been interpreted in this local context in previouspublications. However, the goal of this paper is to examine long-term,large-scale isotopic trends on a regional scale. In order to accomplishthis, we allow that much of the isotopic variation between differentsamples at individual sample localities and between sample localitiesis likely due to differences in sedimentary environments and local influ-ences.We have attempted transparency bymaking sample depositionalenvironment and lithology clear, and referring readers to primary liter-ature regarding individual localities. With natural variability in mind,we assert that long-term, large-scale isotopic trends can be interpretedas long as readers are fully aware that isotopic records from authigenicminerals are influenced by local as well as regional factors.
Although oxygen isotope records preserved in authigenic mineralscan result fromnumerous factors, including diagenesis, detrital contam-ination, and climatic change, we deem these to be unlikely to affect thefirst-order trends on the oxygen isotope records presented in this study.
Diagenetic effects are most likely to occur when sedimentary rockshave experienced significant burial temperatures and pressures, mostoften due to deep burial in basins with high sediment accumulationrates. The sedimentary sections sampled for this study have not experi-enced significant burial, due to their relatively young age, and wesampled known stratigraphic sections that lack significant (or eroded)thicknesses of younger rocks. In most cases, primary sedimentary

L BarRed Basin
E BarSucker Creek
10
100
1 102 104 106
Log
Num
ber
of R
aref
ied
Spe
cies
Log Square Kilometers
L Clarendonian
L Barstovian
E Barstovian
LE Arikareean
Holocene
EE Arikareean
Pleistocene
EL Hemphillian
LE Hemphillian
L Barstovian
E Barstovian
L Hemingfordian
E Hemingfordian
Holocene
LE Arikareean
Pleistocene
10
100
1 10 102 103 104 105 106
Log
Num
ber
of R
aref
ied
Spe
cies
Log Square Kilometers
Arikareaan
-12
-8
-4
0
4
8
51015202530
Diff
eren
ce fr
om E
xpec
ted
Div
ersi
ty
Age (Ma)
Hem. Bars. Clar. Hemp.
Fig. 5. a. Deviation of species richness from expected values based on the species-area re-lationship for the Cenozoic (top); Species richness in the NRM per time period comparedto the SAR for the entire Cenozoic (middle); Species richness in theCR/SRP per time periodcompared to the SAR for the entire Cenozoic (bottom).
0
10
20
30
40
50
0 5 10 15 20 25
Est
imat
e T
otal
Spe
cies
Square Root of Number of Specimens
Sucker Creek Red Basin Quartz Basin
L BarstovianE Barstovian
L Barstovian
Fig. 6.Alpha diversity at early and late Barstovian sites in the CP/SRP. Red Basin and SuckerCreek (including the Devil's Gate localities) are interpreted to sample relatively more aridmicrohabitats than Quartz Basin, suggesting that the habitat sampled, rather than geologicage, is a better correlate with diversity in these faunas.
22 M.L. Kent-Corson et al. / Palaeogeography, Palaeoclimatology, Palaeoecology 387 (2013) 17–26
features are extremely well-preserved and samples lack sparry calcitethat is typically due to secondary crystallization. As discussed below,some sample localities where we might expect evaporative effects to
alter oxygen and carbon isotope values in fact show this covariance,suggesting that these are primary isotopic values. Finally, in manystudy areas samples from similar periods of time were taken fromdifferent formations in different locations. The consistency betweenlocations also suggests that samples did not undergo diagenesis.
However, the sedimentary units in Jackson Hole are unique in thatthe Arikareean to late Barstovian Colter Formation records volcanicactivity proximal to the study area itself, and some units even haveevidence of hot emplacement (Barnosky, 1984). Anomalously low oxy-gen isotope values in the Jackson Hole area beginning in the Arikareean(Chamberlain et al., 2012) could well be the result of diagenesis, and sowe have not included samples from Jackson Hole prior to theHemphillian in this analysis.
Detrital carbonate can also influence oxygen isotope values ofauthigenic carbonate. There are several lines of evidence that detritalcarbonate did not significantly alter δ18O values in most sample areas.First, in the study areas south of the Snake River Plain, inmany study lo-cales isotope data are available both from carbonate and smectite sam-ples. These values are in disequilibrium (Horton et al., 2004) as has beenobserved in other studies comparing carbonate and smectite oxygenisotope values (Stern et al., 1997; Poage and Chamberlain, 2002), buthave similar isotopic trends with similar magnitudes. Because smectitewould not be subject to the same detrital influences as carbonate, thissuggests that the carbonate samples have not been significantly alteredby detrital carbonate. Furthermore, carbonate oxygen isotope values aremore negative than those of smectite, an offset opposite from whatwould be expected if detrital carbonate (usually marine) had contami-nated samples.
In other study areas, some samples are from lacustrine carbonate,which should not experience detrital effects. In many study areas,these lacustrine carbonates are associated with periodic paleosol ordetrital sedimentary units. Because these samples have similar oxygenisotope values (Supplementary Table 1), we interpret that detritaleffects were not significant in most study areas.
Climate can affect oxygen isotope values because temperature af-fects isotopic fractionation of precipitation and mineral–water oxygenisotope exchange during formation of minerals. However, in the caseof this study, the relatively high spatial resolution of and isotopic vari-ability between sites allow us to rule out climate as a major influence.This isotopic record spans periods of climate change including theMMCO, but no major systematic changes are seen in these isotopicrecords. This is likely because temperature effects are generally small(0.35‰/ °C; O'Neil et al., 1969; Rozanski et al., 1993) relative to thelarger changes that can occur due to evaporation (e.g., Horton and

23M.L. Kent-Corson et al. / Palaeogeography, Palaeoclimatology, Palaeoecology 387 (2013) 17–26
Chamberlain, 2006; Davis et al., 2009) and change in elevation of drain-age area (Poage and Chamberlain, 2001). Climate has likely influencedoxygen isotope records through evaporative effects, which can increaseboth oxygen and carbon isotope values. Oxygen and carbon valuesof carbonates covary in some intervals in selected sample localesfrom this study and others (including Carlon-Pinyon samples in theChadronian, Jefferson samples in the Arikareean, and Madison samplesin the Barstovian (Supp. Fig. 1)) and to first order we take covariationas evidence that evaporation has likely altered the oxygen isotope re-cord. Evaporative effects seem to occur diachronously between sections,and are not pervasive through any one stratigraphic section sampled aswould be expected if regional climate drove evaporation. Given the lackof indication that regional climate drove evaporation, we interpretpulses of evaporation to record the local balance between the ratebasins are supplied with water and sediment, and the rate at whichaccommodation space is formed (Carroll and Bohacs, 1999). However,a group of eight samples from the Bannock Basin study area havebeen excluded from this study because of their anomalously high oxy-gen isotope values, and the covariance between oxygen and carbon iso-tope values, suggesting evaporative effects in a closed lake environmentto be the predominant influence on oxygen isotope values.
Given these arguments, we conclude that the oxygen isotoperecords presented in this study to first-order reflect the long-termaveraged oxygen isotope composition of meteoric waters in the studylocalities, and thus the oxygen isotopic composition of precipitationand drainages reaching the study localities, asmodified by any evapora-tive effects.
5.2. Mammal diversity
Constructing paleodiversity curves from the fossil record is fraughtwith sampling problems, the most notable being numbers of localitiesper time interval, numbers of specimens per locality, and the size ofthe geographic area sampled per time bin. The procedure used forconstructing Fig. 4 corrects for these known biases as much as possible.Nevertheless, Barnosky et al. (2005) pointed out that the high speciesrichness in the CP/SRP at ~14 Ma (late Barstovian), especially in thearea-corrected data, conceivably could result from the fact that at thattimeperiod the fossils come from collecting sites that are geographicallyclose to one another (~9321 km2), with most data from two very richsites (Red Basin and Quartz Basin in southeastern Oregon), whereasthe ~15 Ma sites (early Barstovian) are a composite of localities distrib-uted across a broader region (~68969 km2). Smaller geographic ranges,such as those of the late Barstovian, will tend to increase diversity levelsrelative to large ones when the data is area-corrected. Such a tapho-nomic influence does not seem likely to be the only explanation, giventhe presence of a late Barstovian diversity peak whether or not speciesrichness is divided by area. However, given the small geographic areasampled in the late Barstovian, if the Red Basin and Quartz Basincollecting regions were sampled from markedly different habitats, thiscould inflate the late Barstovian diversity levels relative to the earlyBarstovian regionally widespread regions. Compared to Red Basin, theQuartz Basin is characterized by a disproportionately large number ofinsectivore species, fewer carnivores and large ungulates; higher pro-portions of castorids, eomyids, and murids; and lower proportions ofheteromyids, mylagaulids, and sciurids (see Supplementary Table 2).This overall pattern suggests that Quartz Basin samples more mesic mi-crohabitats, whereas Red Basin samples more arid ones. Taxonomic dif-ferences also seem to exist when the early Barstovian localities arecompared to the late Barstovian ones. In general, the early Barstovianhas a better representation of large ungulates (~47% of the total repre-sented species), whereas the late Barstovian has a better representationof small mammals (~69% of the represented species) (see Supplemen-tary Table 3).
However, the other side of the taphonomic argument is that bothmesic and arid microhabitats are represented in both early and late
Barstovian sampling sites, and that taphonomic biases explain the dif-fering small vs. large mammal proportions. One early Barstoviancollecting region, Sucker Creek (OR), which includes the Devil's Gate lo-calities, has a sample that can be reasonably compared with the lateBarstovian Red Basin sites in that Sucker Creek samples predominantlyarid microhabitats judging by the high frequencies of heteromyids anddipodids (arid indicators). Similar to Red Basin, Sucker Creek predomi-nantly has a small-mammal fauna and has multiple collecting localitiesthat can be aggregated for rarefaction analysis to determine alpha diver-sity (Fig. 6). This comparison suggests that late Barstovian arid sites(e.g., Red Basin) have higher species richness than their early Barstoviancounterparts (e.g., Sucker Creek), and that both early and lateBarstovian arid sites have higher species richness than late Barstovianmesic ones (e.g., Quartz Basin). That arid CP/SRP late Barstovian sitestend to have higher-than-normal species richness is also suggested bytheir position on the Cenozoic species–area relationship (Fig. 5C) withRed Basin being relatively more species rich than Sucker Creek.
Even though there is only enough data to evaluate alpha diversityfrom three collecting sites, there are no notable differences in alphadiversity that clearly correlate with temporal interval in the CP/SRP(Fig. 6), which is consistent with earlier interpretations for the NRM(Barnosky and Carrasco, 2002). Therefore, whole-province speciesrichness per time interval likely reflects increasing or decreasing betadiversity, rather than broad shifts in alpha diversity.
6. Discussion
6.1. Topographic history of the Northern Rocky Mountain Region
The isotopic records presented in this study offer two main findingsin regard to the topographic evolution of the study region. First, there isconsiderable variation between δ18Oppt, both spatially in individual timeslices (Fig. 2), and in the evolution through time in individual basins(Fig. 3). This observation suggests that the study areas had mainlyunconnected drainage systems, with isotopic histories reflecting indi-vidual changes in surface elevation, relief, and climate for each studyarea.We interpret this to indicate that the landscape has been segment-ed through the entire range of time examined in this study.
Second, the change tomore negative oxygen isotope values near ac-tive eruptive centers of the Yellowstone hotspot (Fig. 2) indicates thatthese centers created significant topographic highs, and most likelyreorganized drainages. Determining the magnitude of elevation changeassociated with the passage of the hotspot is beyond the scope of thisstudy. We would like to point out, however, that δ18Oppt patterns areconsistentwith high-elevation sourcedwaters that reach thebasins sur-rounding the hotspot. The more positive oxygen isotope values in thewake of thehotspot render it likely that these centers eventually subsid-ed to topographic lows. This would cause oxygen isotope values to in-crease both through the decreased elevation of the drainage area, andthe ponding and subsequent evaporation of waters. Individual oxygenisotope stratigraphic sections (Fig. 3) are also consistent with this pro-posed topographic evolution. For instance, oxygen isotope values inthe South Snake River Plain area increase from 15 Ma on, as would beexpected with a decrease in the elevation of drainages reaching thesestudy areas as topography subsided in the wake of the hotspot, whilethe decrease in oxygen isotope values in the Bannock Basin andsouthwestern Montana is consistent with an increasing input ofhigh-elevation sourced, fresh waters through time as the hotspotapproached.While the hotspot likely influenced the evolution of topog-raphy and climate in much of the study area, the northern part of theCP/SRP has most likely experienced topographic and climatic changeof a different source. The decrease in oxygen isotope values in EasternWashington has also been interpreted to result from the formation ofa rainshadow associated with a Miocene pulse of surface uplift in theWashington and Oregon Cascades (Kohn et al., 2002; Takeuchi andLarson, 2005).
24 M.L. Kent-Corson et al. / Palaeogeography, Palaeoclimatology, Palaeoecology 387 (2013) 17–26
These findings based on isotopic records of topographic changes anddrainage reorganizations due to the progression of the Yellowstonehotspot are consistentwith other studies that have used detrital compo-sitions of sedimentary deposits in this region to identify paleodrainages.These studies have also found a pattern of drainage reorganization thatsuggests the movement of a significant topographic bulge associatedwith the Yellowstone hotspot through this landscape, and the down-warping of topography in the wake of this bulge (e.g., Pierce andMorgan, 1992; Pierce and Morgan, 1999; Link et al., 2005; Beraneket al., 2006; Wegmann et al., 2007).
6.2. Topographic influences on mid-Miocene faunal diversity
The constraints on the topographic evolution of the northern RockyMountain region allowus to better understand how changes in topogra-phy may have contributed to the fluctuations in mammalian diversitydocumented in the CP/SRP and NRM provinces.
The diversity background on which our study unfolds had alreadybeen affected by earlier events. Here we recognize that these earlierevents resulted in a diversity peak that occurred in the NRM between16 and 15 Ma (early Barstovian). The timing is consistent with previousinterpretations that suggest regional uplift and fragmentation of thenorthern Rockies triggered a speciation pulse by fragmenting speciesranges (Barnosky and Carrasco, 2002; Kohn and Fremd, 2008;Badgley, 2010; Finarelli and Badgley, 2010). Also consistent with thisfragmented-landscape model are the differences in individual oxygenisotope stratigraphic sections we demonstrate, which suggest that thelandscape was highly dissected during the entire time the study spans.Albeit δ18O records in sedimentary basins along the hotspot trackpresented here do not provide unequivocal evidence of a simple topo-graphic signal, our data strongly support the notion of topographicallyseparated areas whose dividing line moved eastward in concert withthe hotspot. This is concordant with interpretations that observedchanges in species richness were duemainly to changes in beta diversi-ty instead of alpha diversity, as physically isolated areas might beexpected to each show somewhat independent faunal histories.
The changes in topography that our data indicate resulted from ini-tiation and progression of the Yellowstone hotspot between ~16 Maand the present also show an interesting pattern in relation tomamma-lian diversity. As the hotspot apparently raised elevations and dissectedthe landscape near northeastern Oregon around 14 million years ago,mammalian diversity seems to have increased there mainly throughchanges in beta diversity, while simultaneously declining in the north-ern Rockies to the east. After collapse of the bow wave as the hotspotmoved east, by 10 Ma species richness declined to lower values in theCP/SNR region. This pattern of topographic change is consistent with amodel that invokes speciation in the CP/SNR region as the hotspot dis-sected topography and raised elevations there, while diversity simulta-neously decreased farther east in the Rockies as the uplift to the westemplaced a rain shadow that resulted in an overall loss of productivityin the mountains. The diversity decline in the CP/SNR by 10 Ma couldhave been related to the SNR collapsing into flatter topography therebydecreasing beta diversity, or to the overall cooling and drying in theregion thatwas underway at that time. It presently is not possible to dis-tinguish which, if either, cause was more important. We present theseideas as a hypotheses to be tested further; if they are upheld, tectonismmay be implicated in driving evolution not only at the subcontinentalscale (by uplifting and fragmenting major mountain chains) and at theglobal scale (as topographic features like the Tibetan Plateau reach ele-vations critical in influencing global climate), but also at the geologicallymore local scale manifested as uplift from hotspot migration relativeto plate movements. Testing these ideas will require more detailedwork on the taphonomy and paleoecology of the deposits that comprisethe samples from each time period, and a detailed investigation ofthe effects that the Yellowstone hotspot “bulge” had on isotopes inprecipitation.
Supplementary data to this article can be found online at http://dx.doi.org/10.1016/j.palaeo.2013.07.014.
Acknowledgments
AM acknowledges support through the LOEWE funding program(Landes-Offensive zur Entwicklung wissenschaftlich-ökonomischerExzellenz) of Hesse's Ministry of Higher Education, Research, and theArts. This research was supported by the National Science Foundationgrants EAR-0609649 and EAR-1019648 to CPC. ADB andMAC acknowl-edge NSF funding that made compilation of the MIOMAP databasepossible: EAR-9909353, EAR-0310221, and DEB-0543641.
References
Alroy, J., 2000. Successive approximations of diversity curves: ten more years in thelibrary. Geology 28, 1023–1026.
Alroy, J., Koch, P.L., Zachos, J.C., 2000. Global climate change and North Americanmamma-lian evolution. Paleobiology 26, 259–288.
Anders, M.H., Hemming, S.R., 2004. Constant silicic eruption and migration rates ofYellowstone–Snake River plain volcanism; evidence for a classical hotspot model?Geological Society of America Abstracts with Programs 36, 96.
Badgley, C., 2010. Tectonics, topography, and mammalian diversity. Ecography 33,220–231.
Badgley, C., Barry, J.C., Morgan, M.E., Nelson, S.V., Behrensmeyer, A.K., Cerling, T.E., 2008.Ecological changes inMiocenemammalian record show impact of prolonged climaticforcing. Proceedings of the National Academy of Science 105, 12145–12149.
Ballato, P., Mulch, A., Landgraf, A., Strecker, M.R., Dalconi, M.C., Friedrich, A., Tabatabaei,S.H., 2010. Middle to late Miocene Middle Eastern climate from stable oxygen andcarbon isotope data, southern Alborz mountains, N Iran. Earth and Planetary ScienceLetters 300, 125–138.
Barnosky, A.D., 1984. The Colter Formation: evidence for Miocene volcanism in JacksonHole, Teton County, Wyoming. Wyoming Geological Association Earth ScienceBulletin 16, 50–101.
Barnosky, A.D., 2001. Distinguishing the effects of the Red Queen and the Court Jester onMiocene mammal evolution in the northern Rocky Mountains. Journal of VertebratePaleontology 21, 172–185.
Barnosky, A.D., 2009. Heatstroke, Nature in an Age of Global Warming. Island Press,Washington, D.C.
Barnosky, A.D., Carrasco, M.A., 2002. Effects of Oligo–Miocene global climate changes onmammalian species richness in the northwestern quarter of the USA. EvolutionaryEcology Research 4, 811–841.
Barnosky, A.D., Carrasco, M.A., Davis, E.B., 2005. The impact of the species–area relation-ship on estimates of paleodiversity. Public Library of Science Biology 3, e266.
Barry, J.C., Morgan, M.E., Flynn, L.J., Pilbeam, D., Jacobs, L.L., Lindsay, E.H., Raza, S.M.,Solounias, N.M., 1995. Patterns of faunal turnover and diversity in the NeogeneSiwaliks of Northern Pakistan. Palaeogeography, Palaeoclimatology, Palaeoecology115, 209–226.
Beever, E.A., Ray, C., Mote, P.W., Wilkening, J.L., 2010. Testing alternative models ofclimate-mediated extirpations. Ecological Applications 20, 164–178.
Bell, G., 1982. The Masterpiece of Nature: The Evolution and Genetics of Sexuality.University of California Press, Berkeley.
Benton, M.J., 2009. The Red Queen and the Court Jester: species diversity and the role ofbiotic and abiotic factors through time. Science 323, 728–732.
Beranek, L.P., Link, P.K., Fanning, C.M., 2006. Miocene to Holocene landscape evolution ofthe western Snake River Plain region, Idaho: using the SHRIMP detrital zircon prove-nance record to track eastward migration of the Yellowstone hotspot. GeologicalSociety of America Bulletin 118, 1027–1050.
Breeker, D.E., Sharp, Z.D., McFadden, L.D., 2009. Seasonal bias in the formation and stableisotopic composition of pedogenic carbonate in modern soils from central NewMexico, USA. Geological Society of America Bulletin 121, 630–640.
Capuano, R.M., 1992. The temperature dependence of hydrogen isotope fractionationbetween clayminerals and water: evidence from a geopressured system. Geochimicaet Cosmochimica Acta 56, 2547–2554.
Carney, S.M., Janecke, S.U., Oriel, S.S., Evans, J.C., Link, P.K., 2002. Geologic map of theClifton Quadrangle, Franklin and Oneida Counties, Idaho. Idaho Geological SurveyTechnical Report 03–4.
Carrasco, M.A., Craatz, B.P., Davis, E.B., Barnosky, A.D., 2005. Miocene Mammal MappingProject (MIOMAP). University of California Museum of Paleontology (http://www.ucmp.berkeley.edu/miomap/, last accessed 6/13/12).
Carrasco, M.A., Barnosky, A.D., Graham, R.W., 2009. Quantifying the extent of NorthAmerican mammal extinction relative to the pre-anthropogenic. PloS One 4, e8331.
Carroll, A.R., Bohacs, K.M., 1999. Stratigraphic classification of ancient lakes: balancingtectonic and climatic controls. Geology 27, 99–102.
Carroll, L.E., Genoways, H.H., 1980. Lemmiscus curtatus. Mammalian Species 124, 1–6.Carroll, A.R., Doebbert, A.C., Booth, A.L., Chamberlain, C.P., Rhodes-Carson, M.K., Smith,
M.E., Johnson, C.M., Beard, B.L., 2008. Capture of high-altitude precipitation by alow-altitude Eocene lake, western U.S. Geology 36, 791–794.
Chamberlain, C.P., Mix, H.T., Mulch, A., Hren, M.T., Kent-Corson, M.L., Davis, S.J., Horton,T.W., Grapham, S.A., 2012. The Cenozoic climatic and topographic evoltuion of thewestern North American Cordillera. American Journal of Science 312, 213–262.
25M.L. Kent-Corson et al. / Palaeogeography, Palaeoclimatology, Palaeoecology 387 (2013) 17–26
Davis, S.J., Wiegand, B.A., Carroll, A.R., Chamberlain, C.P., 2008. The effect of drainagereorganization on paleoaltimetry studies: an example from the Paleogene Laramideforeland. Earth and Planetary Science Letters 275, 258–268.
Davis, S.J., Mulch, A., Carroll, A.R., Horton, T.W., Chamberlain, C.P., 2009. Paleogene land-scape evolution of the central North American Cordillera: developing topographyand hydrology in the Laramide foreland. Geological Society of America Bulletin 121,100–116.
DeCelles, P.G., Quade, J., Kapp, P., Fan, M., Dettman, D.L., Ding, L., 2007. High and dry in cen-tral Tibet during the Late Oligocene. Earth and Planetary Science Letters 253, 389–401.
Doebbert, A.C., Carroll, A.R., Mulch, A., Chetel, L., Chamberlain, C.P., 2009. Geomorphiccontrols on lacustrine isotopic compositions: evidence from the Laney Member,Green River Formation (Wyoming). Geological Society of America Bulletin 122,236–252.
Dorr, J.A., Spearing, D.R., Steidtmann, J.R., 1977. Tectonic and synorogenic depositionalhistory of the Hoback Basin and adjacent areas. Wyoming Geological AssociationGuidebook 29, 549–562.
Dybdahl, M.F., Lively, C.M., 1998. Host-parasite coevolution: evidence for rare advantageand time-lagged selection in a natural population. Evolution 52, 1057–1066.
FAUNMAP Working Group, 1996. Spatial response of mammals to late Quaternaryenvironmental fluctuations. Science 272, 1601–1606.
Finarelli, J.A., Badgley, C., 2010. Diversity dynamics ofMiocenemammals in relation to thehistory of tectonism and climate. Proceedings of the Royal Society B: BiologicalSciences 277, 2721–2726.
Fortelius, M., Hokkanen, A., 2001. The trophic context of hominoid occurrence in the laterMiocene of western Eurasia — a primate-free view. In: Bonis, L.D., Koufos, G.,Andrews, A. (Eds.), Phylogeny of the Neogene Hominoid Primates of Eurasia.Cambridge University Press, Cambridge, pp. 19–47.
Friedman, I., Sheppard, R.A., Gude, A.J., 1993. Deuterium fractionation as water diffusesinto silicic volcanic ash. Geophysical Monograph 78, 321–323.
Garzione, C.N., Dettman, D.L., Quade, J., DeCelles, P.G., Butler, R.F., 2000. High times on theTibetan Plateau: paleoelevation of the Thakhola graben, Nepal. Geology 28, 339–342.
Graham, A., 1999. Late Cretaceous and Cenozoic History of North American Vegetation:North of Mexico. Oxford University Press, New York.
Gresens, R.L., 1987. Early Cenozoic geology of central Washington State. I. Summary ofsedimentary, igneous, and tectonic events. Washington Division of Geology andEarth Resources Bulletin 77, 169–177.
Hagmeier, E.M., 1966. A numerical analysis of the distributional patterns of North Amer-ican mammals II. Re-evaluation of the provinces. Systematic Zoology 15, 279–299.
Hagmeier, E.M., Stults, C.D., 1964. A numerical analysis of the distributionl patterns ofNorth American mammals. Systematic Zoology 13, 125–155.
Hammond, P.E., 1979. A tectonic model for evolution of the Cascade Range. Pacific CoastPaleogeography Symposium 3, 219–237.
Hart, W.K., Brueseke, M.E., 1999. Analysis and dating volcanic horizons from HagermanFossil Beds National Monument and a revised interpretation of eastern GlennsFerry Formation chronostratigraphy: a report of work accomplished and scientificresults. Nat. Park Serv. Rep., 1443, pp. 1–37 (PX9608-97-003).
Horton, T.W., Chamberlain, C.P., 2006. Stable isotopic evidence for Neogene surfacedowndrop in the central Basin and Range province. Geological Society of AmericaBulletin 118, 475–490.
Horton, T.W., Sjostrom, D.J., Abruzzese, M.J., Poage, M.A., Waldbauer, J.R., Hren, M.,Wooden, J., Chamberlain, C.P., 2004. Spatial and temporal variation of Cenozoicsurface elevation in the Great Basin and Sierra Nevada. American Journal of Science304, 862–888.
Janis, C.M., Wilhelm, 1993. Were there mammalian pursuit predators in the Tertiary?Dances with wolf avatars. Journal of Mammalian Evolution 1, 103–125.
Janis, C.M., Damuth, J., Theodor, J.M., 2000. Miocene ungulates and terrestrial primaryproductivity: where have all the browsers gone? Proceedings of the NationalAcademy of Sciences 97, 7899–7904.
Kaplan, M., 2009. Mountains May Be Cradles of Evolution. Nature News, Nature Publish-ing Group.
Kent-Corson, M.L., Sherman, L.S., Mulch, A., Chamberlain, C.P., 2006. Cenozoic topographicand climatic response to changing tectonic boundary conditions in Western NorthAmerica. Earth and Planetary Science Letters 252, 453–466.
Kent-Corson, M.L., Ritts, B.D., Zhuang, G., Bovet, P.M., Graham, S.A., Chamberlain, C.P.,2009. Stable isotopic constraints on the tectonic, topographic, and climatic evolutionof the northern margin of the Tibetan Plateau. Earth and Planetary Science Letters282, 158–166.
Kent-Corson, M.L., Mulch, A., Graham, S.A., Carroll, A.R., Ritts, B.D., Chamberlain, C.P., 2010.Diachronous isotopic and sedimentary responses to topographic change as indicatorsof mid-Eocene hydrologic reorganization in the western United States. BasinResearch 22, 829–845.
Kim, S.T., O'Neil, J.R., 1997. Equilibrium and nonequilibrium oxygen isotope effects insynthetic carbonates. Geochimica et Cosmochimica Acta 61, 3461–3475.
Kohn, M.J., Fremd, T.J., 2008. Miocene tectonics and climate forcing of biodiversity, west-ern United States. Geology 36, 783–786.
Kohn, M.J., Miselis, J.L., Fremd, T.J., 2002. Oxygen isotope evidence for progressive uplift ofthe Cascade Range, Oregon. Earth and Planetary Science Letters 204, 151–165.
Kutzbach, J.E., Prell, W.L., Ruddiman, W.F., 1993. Sensitivity of Eurasian climate to surfaceuplift of the Tibetan Plateau. Journal of Geology 101, 177–190.
Leopold, E.B., Liu, G., Love, J.D., Love, D.W., 2007. Plio-Pleistocene climatic transition andthe lifting of the Teton Range, Wyoming. Quaternary Research 67, 1–11.
Link, P.K., Fanning, C.M., Beranek, L.P., 2005. Reliability and longitudinal change ofdetrital-zircon age spectra in the Snake River system, Idaho andWyoming: an exam-ple of reproducing the bumpy barcode. Sedimentary Geology 182, 101–142.
Lomolino, M.V., Riddle, B.R., Brown, J.H., 2010. Biogeography, 4th ed. Sinauer Associates,Massachusetts.
Long, S.P., Link, P.K., Janecke, S.U., Rodgers, D.W., 2004. Geologic map of the HendersonCreek Quadrangle, Oneida County, Idaho. Idaho Geological Survey Technical Report04-3 (1 p.).
Love, J.D., 1978. Cenozoic thrust and normal faulting, and tectonic history of the Badwaterarea, northeastern margin of Wind River Basin, Wyoming. Wyoming GeologicalAssociation Guidebook 30, 235–238.
Luikart, E.J., 1997. Syn- and Post-laramide Geology of the South-central Gravelly Range,Southwestern Montana. Montana State University M. S.(thesis).
Martin, R.U., Fairbanks, K.B., 1999. Cohesion and survivorship of a rodent community dur-ing the past 4 million years in southwestern Kansas. Evolutionary Ecology Research1, 21–48.
Mix, H., Mulch, A., Kent-Corson, M.L., Chamberlain, C.P., 2011. Cenozoic topography of thewestern North American Cordillera. Geology 39, 87–90.
Mulch, A., Sarna-Wojcicki, A.M., Perkins, M.E., Chamberlain, C.P., 2008. A Miocene toPliocene climate and elevation record of the Sierra Nevada (California). Proceedingsof the National Academy of Science 105, 6819–6824.
Mulch, A., Uba, C., Strecker, M.R., Schönberg, R., Chamberlain, C.P., 2010. Late Mioceneclimate variability and surface elevation in the central Andes. Earth and PlanetaryScience Letters 290, 173–182.
Munthe, J., 1979. Summary of Miocene vertebrate fossils of the Granite Mountains Basin,Central Wyoming. Contributions to Geology 18, 33–46.
NCDC, National Climatic Data Center Climate Normals, . http://www.ncdc.noaa.gov/oa/ncdc.html.
O'Neil, James R., Clayton, Robert N., Mayeda, Toshiko K., 1969. Oxygen isotope fraction-ation in divalent metal carbonates. Journal of Chemical Physics 51, 5547–5558.
Parry, M.L., Canziani, O.F., Palutikof, P.J., van der Linden, P.J., Hanson, C.E. (Eds.), 2007.Contribution of Working Group II to the Fourth Assessment Report of the Intergov-ernmental Panel on Climate Change. Cambridge University Press, Cambridge.
Passey, B.H., Levin, N.E., Cerling, T.E., Brown, F.H., Eiler, J.M., 2010. High-temperatureenvironments of human evolution in East Africa based on bond ordering in paleosolcarbonates. Proceedings of the National Academy of Sciences of the United States ofAmerica 107, 11245–11249.
Peters, N.A., Huntington, K.W., Hoke, G.D., 2013. Impact of seasonally variable soil carbon-ate formation on paleotemperature records from clumped isotope thermometry.Earth and Planetary Science Letters 361, 208–218.
Pierce, K.L., Morgan, L.A., 1992. The track of the Yellowstone hot spot; volcanism, faulting,and uplift. Geological Society of America Memoirs 179, 1–53.
Pierce, K.L., Morgan, L.A., 1999. Drainage changes associated with the YellowstoneHotspot. Geological Society of America Abstracts with Programs 31, 443–444.
Poage, M.A., Chamberlain, C.P., 2001. Empirical relationships between elevation and thestable isotope composition of precipitation and surface waters: considerations forstudies of paleoelevation change. American Journal of Science 301, 1–15.
Poage, M.A., Chamberlain, C.P., 2002. Stable isotopic evidence for a pre-Middle Miocenerainshadow in the western Basin and Range: implications for the surface uplift ofthe Sierra Nevada. Tectonics 21, 16-1–16-10.
Prothero, D.R., Sanchez, F., 2004. Magnetic stratigraphy of the middle to upper Eocenesection at Beaver Divide, Fremont County, central Wyoming. New Mexico Museumof Natural History & Science Bulletin 26, 151–155.
Quade, J., Eiler, J., Daeron, M., Achyuthan, H., 2013. Clumped isotope geothermometer insoil and paleosol carbonate. Geochimica et Cosmochimica Acta 105, 92–107.
Reiners, P.W., Ehlers, T.A., Garver, J.I., Nitchell, S.G., Montgomery, D.R., Vance, J.A.,Nicolescu, S., 2002. Late Miocene exhumation and uplift of the Washington CascadeRange. Geology 30, 767–770.
Rosenzweig, M.L., 1995. Species Diversity in Space and Time. Cambridge University Press,Cambridge.
Rowley, D.B., Currie, B.S., 2006. Palaeo-altimetry of the late Eocene to Miocene Lunpolabasin, central Tibet. Nature 439, 677–681.
Rozanski, K., Aragus-Araguas, L., Gonfiantini, R., 1993. Isotopic patterns in modern globalprecipitation. Geophysical Monograph 78, 1–36.
Ruddiman, W.F., Kutzbach, J.E., 1990. Late Cenozoic uplift and climate change. Transac-tions of the Royal Society of Edinburgh Earth Science 81, 301–314.
Sheldon, N.D., Retallack, G.J., 2004. Regional paleoprecipitation records from the LateEocene and Oligocene of North America. Journal of Geology 112, 487–494.
Sheppard, S.M.F., Gilg, H.A., 1996. Stable isotope geochemistry of clay minerals. ClayMinerals 31, 1–24.
Smith, A.T., Weston, M.L., 1990. Ochotona princeps. Mammalian Species 352, 1–8.Stern, L.A., Chamberlain, C.P., Johnson, G.D., 1997. Oxygen isotope evidence of climate
change from pedogenic clay minerals in the Himalayan molasse. Geochimica etCosmochimica Acta 61, 731–744.
Storer, J.E., 1989. Rodent faunal provinces, Paleocene–Miocene of North America. In:Black, C.C., Dawson, M.R. (Eds.), Papers on Fossil Rodents in Honor of Albert ElmerWood. Natural History Museum of Los Angeles County, pp. 17–29.
Stucky, R.K., 1990. Evolution of land mammal diversity in North America during theCenozoic. Current Mammalogy 2, 375–431.
Sutton, J.F., Black, C.C., 1972. Oligocene and Miocene deposits of Jackson Hole, Wyo-ming. In:West, R.M. (Ed.), Guidebook for Field Conference on Tertiary Biostratig-raphy of Southern and Western Wyoming, Society of Vertebrate Paleontology,pp. 73–79.
Swanson, D.A., 1997. Uplift of the southern Washington Cascades in the past17 million years. Geological Society of America Abstracts with Programs 29, 68.
Tabor, R.W., Frizzell, V.A., Vance, J.A., Naeser, C.W., 1984. Ages and stratigraphy of lowerand middle Tertiary sedimentary and volcanic rocks of the central Cascades, Wash-ington: application to the tectonic history of the Straight Creek fault. Geological Soci-ety of America Bulletin 95, 26–44.
Tabrum, A.R., Prothero, D.R., Garcia, D., 1996. Magnetostratigraphy and biostratigraphy ofthe Eocene–Oligocene transition, southwesternMontana. In: Prothero, D.R., Emry, R.J.

26 M.L. Kent-Corson et al. / Palaeogeography, Palaeoclimatology, Palaeoecology 387 (2013) 17–26
(Eds.), The Terrestrial Eocene–Oligocene Transition in North America. CambridgePress, Cambridge, pp. 278–311.
Takeuchi, A., Larson, P.B., 2005. Oxygen isotope evidence for the late Cenozoicdevelopment of an orographic rain shadow in eastern Washington, USA. Geology33, 313–316.
Tedford, R.H., Skinner, M.F., Fields, R.W., Rensberger, J.M., Whistler, D.P., Galusha, T.,Taylor, B.E., MacDonald, J.M., Webb, S.D., 1987. Faunal succession and biochronologyof the Arikareean through Hemphillian interval (late Oligocene through earliestPliocene epochs) in North America. In: Woodburne, M.O. (Ed.), Cenozoic Mammalsof North America: Geochronology and Biostratigraphy. University of CaliforniaPress, Berkeley, pp. 153–210.
Tedford, R.H., Albright III, L.B., Barnosky, A.D., Ferrusquia-Villafranca, I., Hunt Jr., R.M., etal., 2004. Mammalian biochronology of the Arikareean through Hemphillian interval(late Oligocene through early Pliocene epochs). In: Woodburne, M.O. (Ed.), LateCretaceous and Cenozoic mammals of North America. Columbia University Press,New York, pp. 169–231.
Van Valen, L., 1973. A new evolutionary law. Evolution Theory 1, 1–30.Vance, J.A., Clayton, G.A., Mattinson, J.M., Naeser, C.W., 1987. Early and middle Cenozoic
stratigraphy of the Mount Rainier–Tieton River area, southernWashington Cascades.Washington Division of Geology and Earth Resources Bulletin 77, 269–290.
Vrba, E.S., 1992.Mammals as a key to evolutionary theory. Journal ofMammalian 73, 1–28.
Vuke, S.M., 2003. Geologic map of western and northern Gallatin Valley southwesternMontana. Montana Bureau of Mines and Geology: Open File Report 481 (39 pp.).
Vuke, S.M., Coppinger,W.W., Cox, B.E., 2004. Geologic map of the Cenozoic deposits of theUpper Jefferston Valley. Montana Bureau ofMines and Geology: Open File Report 505(36 pp.).
Webb, S.D., Opdyke, N.D., 1995. Global climatic influence on Cenozoic land mammalfaunas. In: Kennett, J.P., Stanley, S.M. (Eds.), Effects of Past Global Change on Life.National Academy Press, Washington, D.C., pp. 184–208.
Wegmann, K.W., Zurek, B.D., Regalla, C.A., Bilardello, D., Wollenberg, J.L.,Kopczynski, S.E., Ziemann, J.M., Haight, S.L., Apgar, J.D., Zhao, C., Pazzaglia, F.J.,2007. Position of the Snake River watershed divide as an indicator ofgeodynamic processes in the reater Yellowstone region, western NorthAmerica. Geosphere 3, 272–281.
Werdelin, L., Fortelius, M., 1997. Biogeographic characterization of MN unit referencelocalities. In: Aguilar, J.P., Legendre, S., Michaux, J. (Eds.), Actes du CongresBiochroM'97. Institut de Montpellier, pp. 67–73.
Williams, J.W., Jackson, S.T., Kutzbach, J.E., 2007. Projected distributions of novel anddisappearing climates by 2100 AD. Proceedings of the National Academy of Sciences104, 5738–5742.
Wolfe, J.A., 1994. Tertiary climatic changes at middle latitudes of western North America.Palaeogeography, Palaeoclimatology, Palaeoecology 108, 195–205.