pakistani exports - connecting repositories · in south asian region. ... tactic no. of incidents...
TRANSCRIPT

MPRAMunich Personal RePEc Archive
Daily and monthly costs of terrorism onPakistani exports
Mamoon, Dawood; Akhtar, Sajjad and Hissam, Saadia
Pakistan Institute of Trade and Development
15. May 2011
Online at http://mpra.ub.uni-muenchen.de/30926/
MPRA Paper No. 30926, posted 16. May 2011 / 10:33

Daily and Monthly Costs of Terrorism on Pakistani Exports
By
Dawood Mamoon1
Sajjad Akhtar
Saadia Hissam
Pakistan Institute of Trade and Development2
SUMMARY
This is first of its kind empirical study on the costs of terrorism on Pakistan’s exports. The
analysis finds that intensity of terrorist activity can be divided into three distinct periods. The
LAL Masjid incident in mid 2007 marks the first sign of intensification of terrorism in Pakistan.
The second one is the assassination of Benazir Bhutto. The third one comes in 2008 when the
US announced to shift gear from Iraq to Afghanistan and incumbent government in Pakistan
created a political support for armed action within Pakistani borders against the terrorists. The
analysis finds that terrorism has more significant affect on Pakistani exports post Benazir
assassination. The report calculates the monthly and daily costs of terrorism. On average there
are 2 terrorist attacks every day whereas 5 citizens on average die in these attacks. A single
terrorist attack costs 12 million dollars to the exports. Post Benazir assassination the costs rise
to 18 million dollars due to increased intensity where not only the death toll on average has
risen but the number of terrorist attacks have gone up. Average per month loss in exports due
to terrorism is calculated to be around 500 million dollars. Pakistan in 2006-09 has lost nearly
30 billion dollars in exports as its market shares have fallen. Part of this loss is explained by
terrorism, where we find that 18 billion dollars accounts for it. Please note that extending the
data for later years may make our results more pronounced but suffice to say our calculated β’s
are robust capable of predicting terrorism for coming years. For example, it is found out that
costs of number of deaths and number of injured are different while exports are more sensitive
to the former capturing severity of casualties that is the hall mark of extreme terrorist actions
like suicide attacks.
1 Lead Author
2 Authors like to thank Ministry of Interior, Pakistan for the Terrorism related Data

1. Introduction
Current collapse of Pakistan’s economic growth rates challenge the economic prosperity
achieved during 2003-2006 period. In Pakistan’s case, it was rather clear. With intensification of
war on terror (WOT) post 2006, Pakistan is currently witnessing yet more challenging economic
circumstances. Though, the exogenous factors which relate to current economic situation are
generally associated with rise in oil prices, energy crises, global financial crises and commodity
price hike, there is need also to include factors like WOT into the paradigm. Armed conflict
within a country also affects the economic potential of the country.
It has been nearly a decade now that Pakistan had been participating in the WOT as a front line
ally. The conflict has deepened the structural problems within different sectors of Pakistan’s
economy. Recently there has been some efforts made in the international literature to
associate global shocks like oil price shock, financial meltdown in USA, sub prime mortgage
crises in USA, and global recession to WOT - especially armed conflict initiated by USA in Iraq
which was an extension of WOT in Afghanistan. Likewise, there is a need to revisit the reasons
for Pakistan’s current economic downturn and asses the role played by the ongoing WOT. In
recent years Pakistan’s participation in WOT has deepened with more visible armed action in
Pakistani Northern provinces. So much so that Pakistan ranks close to Sri Lanka and Nepal in
incurring costs of terrorism while both the later countries have precedence of armed conflict
and civil war spanning decades.
Table 1.1 Costs of Terrorism
Rank
Costs
Pakistan
India
China
Bangladesh
Sri Lanka
Nepal
1. The incidence of violence (1=
imposes significant cost on
business, 7= does not impose
significant costs on business),
2007, 2008
99
(3.7)
47
(5.2)
50
(5.1)
93
(3.9)
84
(4.2)
109
(3.2)
2. Business costs of terrorism
(1=imposes significant costs to
businesses, 7= does not impose
significant costs to businesses),
2007, 2008
118
(3.7)
94
(5.0)
79
(5.3)
102
(4.6)
120
(3.0)
119
(3.0)
Source: The Global Enabling Trade Report 2009
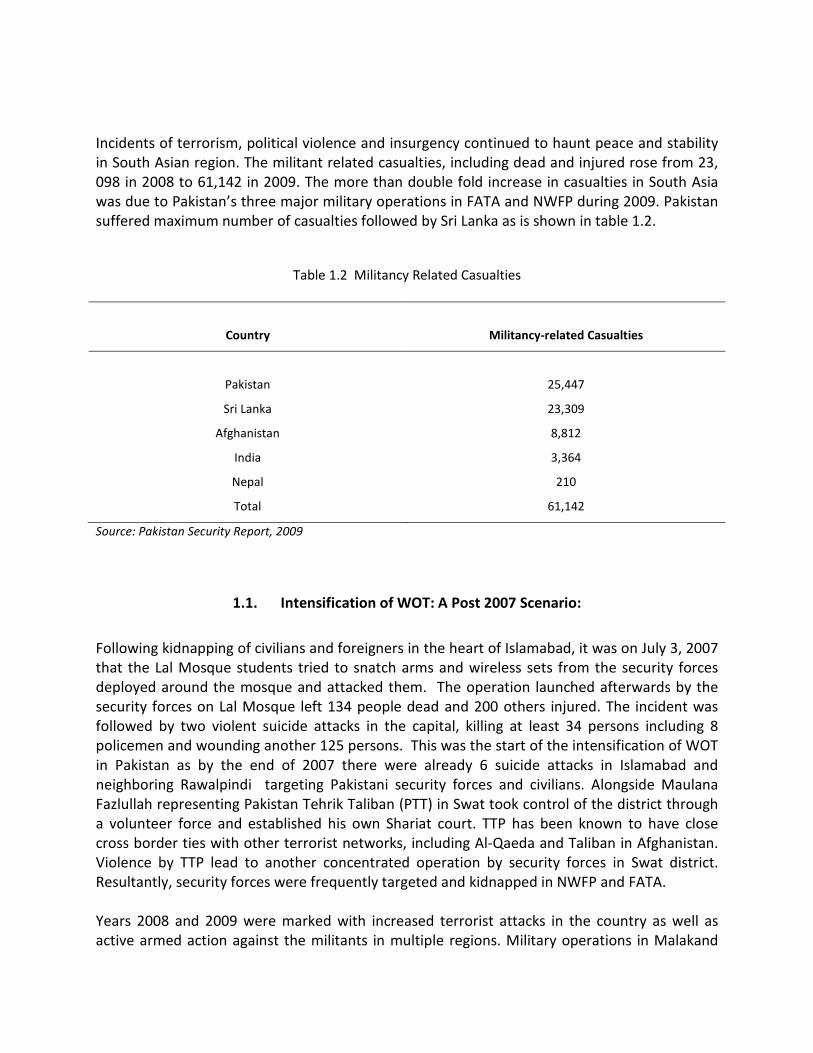
Incidents of terrorism, political violence and insurgency continued to haunt peace and stability
in South Asian region. The militant related casualties, including dead and injured rose from 23,
098 in 2008 to 61,142 in 2009. The more than double fold increase in casualties in South Asia
was due to Pakistan’s three major military operations in FATA and NWFP during 2009. Pakistan
suffered maximum number of casualties followed by Sri Lanka as is shown in table 1.2.
Table 1.2 Militancy Related Casualties
Country
Militancy-related Casualties
Pakistan
25,447
Sri Lanka 23,309
Afghanistan 8,812
India 3,364
Nepal 210
Total 61,142
Source: Pakistan Security Report, 2009
1.1. Intensification of WOT: A Post 2007 Scenario:
Following kidnapping of civilians and foreigners in the heart of Islamabad, it was on July 3, 2007
that the Lal Mosque students tried to snatch arms and wireless sets from the security forces
deployed around the mosque and attacked them. The operation launched afterwards by the
security forces on Lal Mosque left 134 people dead and 200 others injured. The incident was
followed by two violent suicide attacks in the capital, killing at least 34 persons including 8
policemen and wounding another 125 persons. This was the start of the intensification of WOT
in Pakistan as by the end of 2007 there were already 6 suicide attacks in Islamabad and
neighboring Rawalpindi targeting Pakistani security forces and civilians. Alongside Maulana
Fazlullah representing Pakistan Tehrik Taliban (PTT) in Swat took control of the district through
a volunteer force and established his own Shariat court. TTP has been known to have close
cross border ties with other terrorist networks, including Al-Qaeda and Taliban in Afghanistan.
Violence by TTP lead to another concentrated operation by security forces in Swat district.
Resultantly, security forces were frequently targeted and kidnapped in NWFP and FATA.
Years 2008 and 2009 were marked with increased terrorist attacks in the country as well as
active armed action against the militants in multiple regions. Military operations in Malakand

region, South Waziristan, Khyber and other parts of FATA are more notable ones. While
terrorist attacks on military’s General Headquarter in Rawalpindi, Sri Lankan cricket team and
Manawan Police Training Center in Lahore revealed the growing ability of terrorists to strike
any target at will. Militants’ network in South Punjab, drone attacks in Tribal areas, killing of
Baitullah Mehsud, chief of the Tehrik-e-Taliban Pakistan, a surge in the number of NATO and
US troops in Afghanistan are other highlights of WOT in Pakistan. Overall there has been a
phenomenal rise in terrorist attacks in Pakistan since 2007 as can be seen in table 1.3.
Table 1.3 Terrorist Attacks in Pakistan
Year Total Attacks Annual Increase
since 2006
Killed Injured
2006 675 907 1,543
2007 1,503 123 % 3,448 5,353
2008 2,577 282 % 7,997 9,670
2009 3,816 465 % 12,632 12,815
Source: Pakistan Security Report, 2009
Terrorists have used various violent means to attack. They comprise of suicide attacks, rocket
attacks, beheadings, remote–control bombs, kidnappings, landmines, shootings, sabotage,
targeted killings, bomb blasts, hand grenades and improvised explosive devices. The incidence
of target killings and attacks through hand grenades have more than doubled in 2009 when
compared to 2008. Suicide attacks, kidnappings and remote control bomb blasts have also seen
remarkable increase in the span of last one year.
Table 1.4 Attack types
Tactic
No. of Incidents
2008 2009 Growth (%)
Suicide attacks
63
87
38.09
Rocket attacks 381 422 10.76
Beheadings 46 49 6.52
Remote controlled bombs 112 189 68.75
Kidnappings 116 174 50
Landmines 110 111 0.90
Shooting/firing 451 568 25.94
Sabotage/fire/torched 116 89 -23.27
Targeted Killing 26 82 215.38
Bomb blasts 298 341 14.42
Hand grenades 82 219 167.07
Improvised explosive devices
(IEDs)
373 355 -4.82
Source: Pakistan Security Report, 2009

1.2. Suicide Attacks: A Major Terror Tactic
Suicide attacks have been increasingly used by terrorists as a major terror tactic. In 2009, there
is a steep rise of suicide attacks all over Pakistan. The major concentration of attacks in 2007
was in NWFP. In 2009, NWFP remained the worst hit region with total number of suicide
attacks reaching to 52, whereas Punjab/Islamabad also witnessed a sharp increase in attacks
counting to hefty number of 23. Out of 23, 8 attacks occurred only in the capital city of
Islamabad. These suicide attacks targeted civilians as well as security personnel. Table 1.6 in at
the end of the section gives detailed summary of the targets of suicide attacks. In 2009, most
suicide attacks were targeted towards the security forces comprising of either police or army
personnel. Attacks were also carried out on NATO supplies.
Table 1.5 Province Wise Suicide Attacks
Administrative Entity No. of Suicide Attacks
2007 2009
NWFP 33 52
Punjab/Islamabad 11 23
FATA 11 7
Balochistan 4 2
Azad Kashmir - 2
Sindh 1 1
Total 60 87
Source: Pakistan Security Report, 2007 and 2009
1.3. Drone Strikes and Attacks on NATO supplies
51 US drone attacks were reported in 2009, which killed 667 people and injured 310. The major
concentration of attacks were in South and North Waziristan targeting key Al-Qaeda and
Taliban commanders which include Baitullah Mehsud, chief of TTP, Hakimullah Mehsud, chief
of TTP after Baitullah Mehsud, Tahir Yuldushev, chief of Islamic Movement of Uzbekistan,
Nazimuddin Zalallov alias Yahyo and Usama Al-Kini of Al Qaeda. . However, many civilians have
also been killed in these attacks.
A total of 25 attacks were recorded on NATO forces out of which 15 took place in the NWFP and
10 in FATA. Most of the attacks were reported along the Jamrud-Torkhum highway border area
and the outskirts of Peshawar.

Table 1.7. Attacks on NATO supplies in FATA and NWFP
Month
Attacks in NWFP
Attacks in FATA
January 3 0
February 1 3
March 1 2
April 4 0
May 2 1
June 0 0
July 1 3
August 1 2
September 0 1
October 1 0
November 1 0
December 0 0
Total 15 12
Source: Pakistan Security Report, 2009
1.4. Attacks on Schools:
Despite recent rise in terrorist attacks, the intensification of armed action by security forces
against militants in Pakistan was supported by the masses because Taliban not only waged war
against the state but also Pakistani society at large and women in particular. For instance,
incidents of Taliban militants torching girls’ schools grew as Taliban banned girls’ education
altogether. Initially, militants warned against sending girls to schools but later resorted to
directly attacking girls’ schools especially in NWFP and FATA where they destroyed around 100
schools. Only in 2008, Taliban targeted 119 educational institutions, out of which 111 were
girls’. In 2009, Taliban targeted both boys’ and girls’ schools more intensely in NWFP and FATA
where 54 girl’s schools and colleges were destroyed while 86 boy’s schools were attacked.
Table 1.8. Attacks on Schools and Colleges in NWFP and FATA (2009)
NWFP FATA
Girls Boys Girls Boys
Attacks 40 52 14 34
Source: Pakistan Security Report, 2009
1.5. Internally Displaced Persons (IDPs):
Continued violence and increased terrorist activities and attacks on civilians resulted in mass
displacement of populations in FATA and NWFP. More than 300,000 persons have been
displaced, hence stifling the whole socio economic structure of the region.

Table 1.8 Costs of IDP’s
Persons Migrated 310,000
Relief Camps Established 12
No. of IDPs Living in Camps 61,180
Houses destroyed / damaged 38,750
Approximate cost of repair Rs 500,000 per house
Daily expenditure per head on food & facilities US$ 1.875
Total Cost of Rebuilding US$ 232 Million
Daily Cost of IDPs US$ 114.7 Million
Cost of Enhanced Security Infrastructure US$ 6.1 Billion
Source: Ministry of Planning Estimates (2009)
1.6. Disaster Management:
Provincial Disaster Management Authority (PDMA) has been active to cater to the increased
demand of resources to mitigate negative fallout of the conflict in NWFP and FATA. A US$ 1
billion fund has been created by PDMA for this purpose, which in addition to other sectors also
injects needed resources for the housing, education, health and social protection of displaced
population. Table 1.9. Disaster Management Fund
Sector Overall (NWFP + FATA)
PKR (M) US$ (M)
Social Sectors
Livelihood & Social Protection 15,360 192
Housing 6,580 82
Education 5,436 68
Health 1,527 19
Physical Infrastructure
Transport 19,651 246
Water & Sanitation 313 4
Energy 1,866 23
Productive Sectors
Industry, Tourism, Private assets 917 12
Agriculture, Livestock & Irrigation 22,681 284
Cross Cutting Themes
Environment 4,800 60
Governance 7,787 97
Grand Total 86,918 1,087
Source: Provincial Disaster Management Authority (PDMA), 2009

2. Literature Review
2.1. Terrorism and War on Terror (WOT):
The advent of 21st century has witnessed a new form of international conflict which increasingly
relates to acts of terrorism. It was on September 11, 2001 that the basis of this new conflict was
formed when a group of young men of Arabian origin belonging to AL Qaeda, perpetuated a
spectacular act of terrorism against the US capitalist and defense symbols by hitting hijacked
airplanes into the twin towers in New York City and the Pentagon. As an after math, a war was
announced and waged against terrorists by the US which saw US going into Afghanistan and
Iraq with much force and fury to dismantle regimes that supported these terrorists and their
networks. The causes of 9/11 terrorist acts were seen to be derived from Islamic extremism,
and thus a general backlash against Islamic fundamentalism was initiated in Western societies.
Despite this peculiar brand of terrorism later emerging more frequently in the conflict areas of
Afghanistan and Iraq forming the very basis for a prolonged War on Terror (WOT), terrorism
still has very general connotations and it is a phenomenon which is not restricted to Islamic
fundamentalism.
Rather terrorism is an extreme form of a war tactic which leads to violent outcomes mostly
within civilian populations which makes it more deadly and against the norms of traditional
forms of conflicts. Though all armed conflicts lead to casualties, civilian and defense, acts of
terrorism are mostly perpetuated against civil populations. The terrorists seek maximum
casualties through explosive devices. More lethal the explosive device is, more successful their
action is. Terrorists choose targets which are often high in population density to create greater
impacts on their victims.
Since 1983, the U.S. Department of State has employed the following definition of terrorism
which is largely accepted by many governments and international organizations:‘The term
“terrorism” means premeditated, politically motivated violence perpetrated against non
combatant targets by substantial groups or clandestine agents, usually intended to influence an
audience. The term “international terrorism” means terrorism involving citizens or the territory
of more than one country.’
The definitions of terrorism put more emphasis on the intentions of terrorists to cause fear and
terror among a target audience rather than the harm caused to the immediate victims. Nations
states can also be seen as perpetrators of terrorism. Poverty and underdevelopment, which is
generally perceived to be promoters of terrorism, actually has little to do with terrorism. In case
of suicide bombers, the evidence suggests that they are likely to come from economically
advantaged families and have a relatively high level of education as to come from the ranks of
economically disadvantaged and uneducated (Krueger and Maleckova, 2003).

Generally terrorists have three main tactical goals:
1) To gain Publicity for their cause and to have more media attention, terrorists prefer
cities.
2) Terrorists seek to destabilize the political system in a country so that state legitimacy
and control is compromised and anarchy is promoted which in turn would improve their
chances of success.
3) Terrorists are particularly against the economy of the country. A poorly performing
economy would entail higher material costs on the population which increase the
chances that the population would yield to their demands.
There is rich literature available which discuss the economic costs of terrorism. The costs
comprise of slowdown in tourist activities, FDI flows, trade flows and loss of real and human
capital. Table 2.1 Costs of Terrorist Attacks
Author Dependent
Variable
Country Time Length Methodology Cost
Enders and
Sandler (1991)
Tourism Spain 1970-1988 VAR 14,000 less
tourists
Enders et al
(1992)
Tourism
Austria
Italy
Greece
1974-1988
ARIMA
$4.538 billion
$1.159 billion
$0.77 billion
Fleisher and
Buccola (2002)
Tourism
Israel
1992-1998
Supply and
demand model
$ 50 million
Sloboda (2003)
Tourism
US
1998-2001
ARMAX
$ 57 billion
Ito and Lee
(2004)
Tourism
US
Spetember 11
Reduced demand
model for air line
industry
30 % of revenue
passenger miles
Drakos and
Kutan (2003)
Tourism
Austria
Italy
Greece
1991-2000
SURE
$ 4.467 billion
Enders and
Sandler (1996)
FDI Spain
Greece
1975-1991
1976-1991
VAR $ 500 million
$ 400 million
Nitsch and
Schumacher
(2004)
Bilateral
Trade
More than 200
countries
1968-1979
Extended Gravity
Model
4 % of bilateral
trade flows
Becker and
Murphey (2001)
Real and
Human
Capital
US
September 11
-
$ 25-60 billion

George W. Bush introduced the doctrine after 9/11 terrorist acts that ‘either you are with us or
against us’ which forms the basis of War on Terror. Any entity which supports terrorism directly
or indirectly is deemed as part of the terrorism problem. Taliban, who formed the government
in Afghanistan in 2001, were found to be supporters of Al Qaeda and thus a direct war was
waged against them. Taliban had influence in Pakistan’s tribal areas and thus to side with US
meant that Pakistan not only break its ties with the Taliban but wage a war against elements
within its borders who are sympathetic with Taliban and Al Qaeda. Since 2001, Pakistan did act
against Taliban and their sympathizers which resulted in a low intensity conflict in tribal areas
of North Western Province of Pakistan. Al Qaeda became active in Pakistan by perpetuating
terrorist acts against state and the people of Pakistan. All major cities of Pakistan have
witnessed several deadly terrorist acts. Since 2007, Pakistani army has become more proactive
in its actions against Al Qaeda and Taliban networks in tribal belts. The outcome has been an
increased terrorist activity in the country.
The objectives of Al Qaeda in Pakistan are to de stablise the country by increasing economic
and political costs. They have been successful in many counts. For example, just before 2007
elections, the murder of Benazir Bhutto, ex prime minister of Pakistan, through a suicide attack
has been attributed to Pakistani faction of Taliban.
It is important to note here is that literature finds that deterrence against terrorism is best
achieved if the coping strategy is based on benevolence rather than threat (Frey and
Luechinger, 2003). After 9/11 in the US WOT, which is now a global WOT with Pakistan as a key
stakeholder, the emphasis has been on using police and military forces against the terrorists
which according to benevolence theory would deepen the conflict rather than solving it.
2.2. Costs of 9/11 to USA:
Were US justified to wage a global WOT? The economic costs of 9/11 may explain the US
reaction which was based on deterrence through threat.
Various studies have estimated the economic effects of 9/11 on US economy. The direct costs
involve destruction of infrastructure and human capital which goes as high as 60 billion dollars
according to one estimate (Becker and Murphey, 2001). Another study estimates the human
capital loss to be 40 billion dollars and property loss to be between 10 and 13 billion dollars
(Navarro and Spencer, 2001).
The destruction of twin towers alone lead to the loss 13 million square feet of real estate, and
30% of superior office space in down town New York. It is further estimated that budget deficit
of the city worsened after the attacks. The city was running a balance budget regime before but
it witnessed a short fall in revenue by 7 % post 9/11(Bram et al, 2002) The main damage was
done to the public facilities. Initial reports indicate that New York’s public facilities experienced
approximately $ 1.4 billion in damage from the attack.

‘The importance of these facilities to New York City can be illustrated by way of a rough
calculation of the value of the World Trade Center’s PATH station. With the destruction of the
facility on September 11, some 20,000 New Jersey – Lower Manhattan commuters were forced
to find alternate means of transportation to work. For some this required a shift to more
expensive ferries crossing the Hudson River from Hoboken, New Jersey. But for the substantial
number who had commuted from the PATH station in Newark, New Jersey, the quickest option
was to take a commuter rail to Pennsylvania Station in New York City and then a city subway to
Lower Manhattan. New Jersey Transit, the state’s commuter line, estimates that daily ridership
to Pennsylvania Station increased by 15,000 passengers following September 11, despite the
immediate loss of jobs experienced. For these riders, a twenty two minute ride from Newark to
Lower Manhattan was replaced by a twenty minute train ride to midtown plus a twenty to
thirty minute subway ride downtown, with a similar lengthening of the homeward commute.
The additional time cost is thus approximately one hour per commuter per day. If we assume
that 15,000 workers who value their commuting time at $ 25 per hour (half their hourly wage)
are spending an additional hour per day commuting, we obtain the daily cost of $ 375,000,
implying that the first year loss of the World Trade Center PATH station cost nearly $ 100
million in lost time.’ (Bram et al, 2002:91)
Post 9/11 also witnessed a stringent security measures in the US which particularly hit the air
line industry hard. Ito and Lee (2004) estimate that revenue passenger miles were dropped by
30% initially and in the long run a 7.4% reduction took place.
2.3. War on Terror: Identifying the nature of Conflict and related Costs:
Estimating the full costs of conflicts is a very difficult, if not impossible task. The human and
social costs of death, disability, dispossession and the psychological trauma associated with
violence and terror are not really quantifiable. On the other hand, atleast in principle, the
“purely economic costs” are amenable to quantitative measurement. Nisha et al (2001)
Two types of conflict are identified in the literature: (a) Civil war (b) International war. Civil war
is waged inside a country whereas international war is waged between two or more rival
parties with cross border origins. As discussed above War on terror (WOT) was originated in
Afghanistan when in 2001, US lead coalition forces waged war against the Taliban regime in
Afghanistan on the pretext of later’s involvement in international terrorism which included
9/11 terrorist attacks in the US. However, as the time went by, the international conflict
reached Pakistan where Pakistani faction of Taliban was involved in armed conflict with the
security forces in the country. In this respect, WOT has both domestic and international
dynamics. In this paper we are more interested in relationship of WOT with Pakistan and thus
deal it as a civil conflict. More so because the break down of social order and absence of clear
front line in case of WOT in Pakistan makes it more common to civil war than to international
conflict. There are studies which corelate terrorism to civil wars (see Krueger and Maleckova,
2003)

Collier (1999) and Nisha et al (2001) presents some costs of civil conflict:
(a) Part of the country’s labour force is reduced due to death, disability or emigration.
(b) In addition to psychological stresses and trauma, education and other forms of
productive human capital acquisition (such as learning by doing) are disrupted and
resultantly average skill level of the work force declines.
(c) Roads become unsafe.
(d) Civil liberties are suppressed which tend to reduce the efficiency of public expenditure.
(e) Diversion of public expenditure from output-enhancing activities. i.e: As the army and
its powers are expanded, the police force and the rule of law diminish.
(f) Enforcement costs of contracts rise and security of property rights is reduced
(g) There will be dissaving in the economy which leads to the destruction of capital stock.
(h) In response to the deterioration in the economic environment, private agents will
engage in portfolio substitution shifting their assets out of the economy. These assets
include human as well as physical and financial capital. All types of domestic capital can
gradually be transformed into financial capital by reducing investments. Households can
reduce expenditures on education and training and send more educated household
members abroad.
(i) Trade reforms may be abandoned because they may alienate a particular producer
group whose political support is considered vital to the war effort.
In case the conflict is resolved there are still negative effects to the economy. Even if peace
reduces costs of economic activity, suppression of civil liberties due to more involvement of
security apparatus in national affairs may still prevail. There could only be partial
restoration of productive public expenditures because military expenditures decline
gradually.
Above factors are very relevant for a country’s GDP growth potential because civil wars
reduce growth mainly by depleting the domestic capital stock. Knight et al (1996) finds that
physical and human capital, together with military spending and trade policy are most
relevant in explaining negative growth effect of civil conflict. Military expenditure is the
prominent variable in their conflict equations while other effects are indirectly linked with
conflict. For example reduced trade or loss of physical and human capital is an outcome
which arises from the violence rather than their direct effects on civil conflict. For growth
however, civil war is more relevant if it effects the composition of public expenditure
through for example military spending. However, it should also be noted here that in

conflict literature military spending is not always a cost because increases in military
spending is not always associated with outbreaks of war (Nisha et al, 2001).
In finding over all growth impact of conflict, a decent econometric model may not be
constructed due to high correlation of policy variables which are relevant for growth.
Variable choice needs to be made which can prevent estimation problems arising from such
correlations. In this respect most of the studies which capture effects of civil war on growth
adopt simpler methodological choices by restricting the number of variables which enter in
their growth equations. (see for example Collier 1999; Easterly and Levine, 1997; and Sachs
and Warner, 1995)
Here in this paper we are interested in gauging the effects of WOT on Pakistan’s exporting
industry and not growth per say. Thus in line of Collier et al (1998), we adopt simpler
empirical methodologies whereby conflict is measured through violence while variables
which are relevant for trade would be included. A detailed discussion on the variables is
presented in the next section.
3. Pakistan’s Export Performance and War on Terror
3.1. Introduction
It has been nearly a decade now that Pakistan had been participating in the War on Terror
(WoT) as a front line ally. Pakistan’s participation in the international campaign has caused
uncertainty in the country, as it has been facing major challenges, like domestic, political and
economic instability, high trade cost and increased law and order concerns amongst other
reasons. In Pakistan, there are no two opinions about the fact that its economy has been
weakened by the war. The extent of the costs/damages however remains a major
question/controversy with serious policy implications. Where one can put a figure on them the
cost is immense.3
Several reports prepared by National and International organizations have made an attempt to
quantify the cost of war against terrorism in Pakistan, but there is still requirement of an in-
depth analysis of impact, challenges and future constraints that this war holds to quantify the
true cost of this war on Pakistan international trade. The conflict in recent years has deepened
the structural problems within different sectors of Pakistan’s economy. Likewise, there is a
need to revisit the reasons for Pakistan’s current economic downturn and asses the role played
by the ongoing WoT. The following sections highlight the different channels through which WoT
has impacted Pakistan’s economy with special reference to export performance.
3.2. Trends in Macroeconomic Indicators
As Pakistan faced increased involvement in armed conflict against terrorists, Pakistan’s larger
economic landscape presented a bleak picture. GDP growth rate Post 2007 is averaged at
merely 3%. Fiscal deficit has enlarged while development budgets are squeezed (see table 1).
The economic turmoil has many dimensions. Last three years have witnessed many exogenous
shocks to local economies. Financial meltdown, rising oil prices and commodity price hike had
already weakened states all over the globe. Sluggish economic activity all round the world and
specifically in Pakistan have reduced fiscal space as current account deficits ballooned while
investments dried up. Nevertheless Pakistan’s neighbors like China and India have largely
continued with their progress with sustained growth rates even under global recession.
Pakistan may have also followed the footsteps of China and India had it not been for adverse
security situation within the country.
3 See The Three Trillion Dollar War: The True Cost of Iraq Conflict by Joseph Stiglitz

0
1
2
3
4
5
6
7
8
9
10
2001 2002 2003 2004 2005 2006 2007 2008 2009
GDP Growth (%)
-10
-5
0
5
10
15
20
25
2001 2002 2003 2004 2005 2006 2007 2008 2009
Export Growth (%)
Source: Economic Survey of Pakistan
The slowdown in Pakistan’s GDP growth rate started in 2006 but it was still above 6% mark but
by 2008 the rate plummeted to less than 4% and slumped to 2% by end of 2009(see Figure 1).
Pakistan’s exporting sector also slowed down by 2007 with negative growth rates in 2009
suggesting an overall decline in Pakistan’s exports.
Figure 3.1 Trends in GDP and Export Growth
Source: Economic Survey of Pakistan
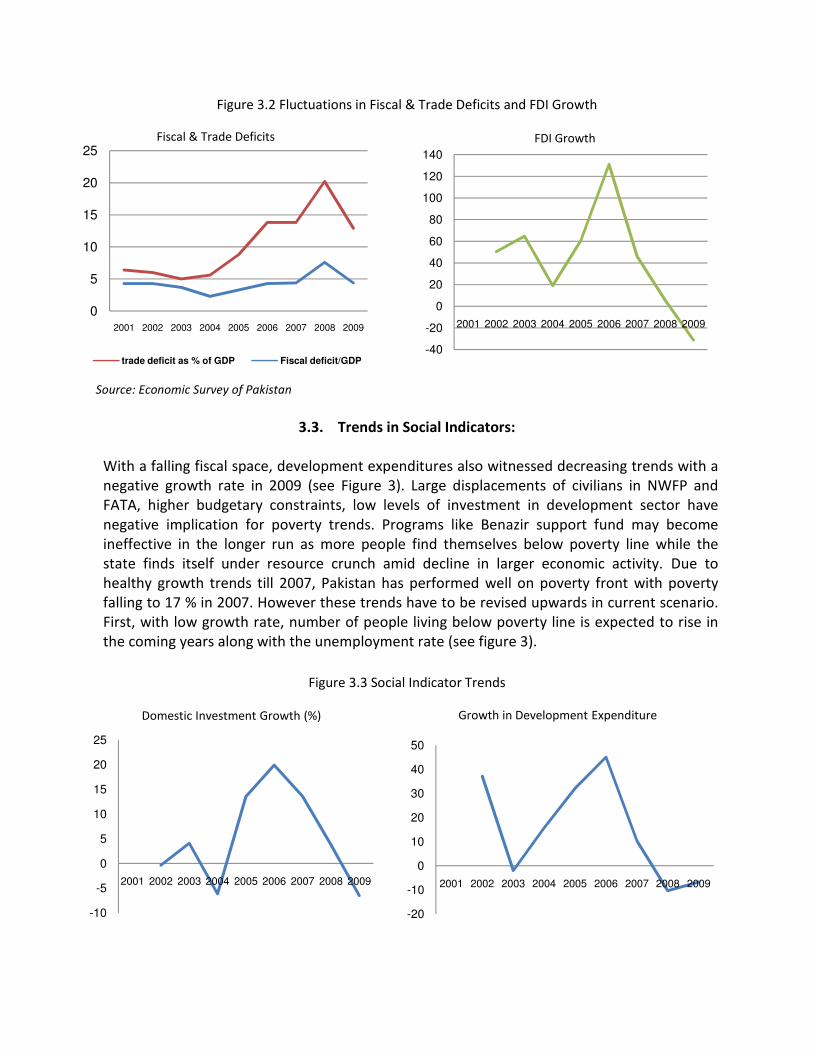
With a slowdown in the economy fiscal deficits have increased and settled at 6 % of the GDP as
an average of last three years of WoT intensification period when compared to 2001-06
average of 3.8 %. A sharper fall has been observed in foreign direct investments (FDI) which
witnessed a negative growth by end of 2009(see Figure 2).
Table 3.1 Trends in Macro Economic Indicators
2006/07 2007/08 2008/09
Inflation (average) 7.8 12.0 20.8
GDP growth 6.8 4.1 2.0
Large-scale manufacturing growth 8.6 4.8 -8.2
Tax revenue (% of GDP) 10.2 10.6 9.2
Fiscal deficit (% of GDP) 4.3 7.6 5.2
External account deficit (% of GDP) 5.1 8.5 5.3
-40
-20
0
20
40
60
80
100
120
140
2001 2002 2003 2004 2005 2006 2007 2008 2009
FDI Growth
0
5
10
15
20
25
2001 2002 2003 2004 2005 2006 2007 2008 2009
Fiscal & Trade Deficits
trade deficit as % of GDP Fiscal deficit/GDP
Figure 3.2 Fluctuations in Fiscal & Trade Deficits and FDI Growth
Source: Economic Survey of Pakistan
3.3. Trends in Social Indicators:
With a falling fiscal space, development expenditures also witnessed decreasing trends with a
negative growth rate in 2009 (see Figure 3). Large displacements of civilians in NWFP and
FATA, higher budgetary constraints, low levels of investment in development sector have
negative implication for poverty trends. Programs like Benazir support fund may become
ineffective in the longer run as more people find themselves below poverty line while the
state finds itself under resource crunch amid decline in larger economic activity. Due to
healthy growth trends till 2007, Pakistan has performed well on poverty front with poverty
falling to 17 % in 2007. However these trends have to be revised upwards in current scenario.
First, with low growth rate, number of people living below poverty line is expected to rise in
the coming years along with the unemployment rate (see figure 3).
Figure 3.3 Social Indicator Trends
-10
-5
0
5
10
15
20
25
2001 2002 2003 2004 2005 2006 2007 2008 2009
Domestic Investment Growth (%)
-20
-10
0
10
20
30
40
50
2001 2002 2003 2004 2005 2006 2007 2008 2009
Growth in Development Expenditure

0
1
2
3
4
5
6
7
8
9
2001 2002 2003 2004 2005 2006 2007 2008
Unemployment rate (%)
Source:Economic Survey
Source: Economic Survey of Pakistan
3.4. Diversion of Resources and Effect on Developmental Plans
National Economic Council approved Rs 334 billion for Public Sector Development Program
(PSDP) for fiscal year 2008-09. However, only Rs 211 billion were made available which is only
63% of the actual amount provided. For 2009-10 fiscal year a hefty amount of Rs 421 billion was
approved but only 10% funds have been released during the first 3 months (July – Oct) showing
a steep fall in state's capacity to promote pro poor economic activity in the country. The Public
Sector Development Program may shrink to Rs 275 billion against the total allocations of Rs 421
billion as per the federal government share. Budget deficit is expected to rise to 5.3 % of GDP as
against the targeted 4.9%. The rationalization of PSDP has resulted due to the unbudgeted
burden of Rs 310 billion, out of which Rs 170 billion is WOT related additional security
expenditure.
The cut in PSDP will have serious implications in terms of critical development projects
remaining underfunded. The allocation of Rs 275 billion would be a thin spread among the
development projects resulting in delays leading to costs over run; the Bhasha dam project is a
clear example for which per year economic loss is estimated to be around Rs 100 billion. The
total PSDP for the 2009-10 was of Rs 621 billion; the share of the federal government was put
at Rs 421 billion while remaining Rs 200 billion were to be met by the provinces. The operation
in Swat, Malakand and Waziristan as well as subsidy on electricity could result in a further cut in
PSDP making the actual allocation even lower then Rs 275 billion.
The rising budget deficit is causing a reduction in developmental spending as the defense
budget cannot be cut due to ongoing operations Swat, Malakand and Waziristan. As the activity
related to war on terror and security concerns increase further diversion of resources is
0
5
10
15
20
25
30
35
40
2001 2005 2006 2007
Poverty (Head count)
Population Below Poverty Line (%)

expected in the latter half of the current fiscal year. The expanding current expenditure with
the intensification of war on terror would lead to further cut in developmental spending. This
would have severe repercussions on the infrastructure requirements of the overall economy
and specially the production sector. The transport sector already stretched due to being utilized
by NATO and ISAF would experience further deterioration because of lack of investment in
enhancing the transport capacity and road infrastructure. The energy and power projects
experiencing delays and remaining underfunded would add more pressure on the business
community in terms of higher input costs.
3.5. The Hard-Hit Exporting Sectors
In the fiscal year 2007-08, the manufacturing sector of Pakistan experienced the weakest
growth in a decade. Large-scale manufacturing which accounts for 69.5% of overall
manufacturing evidenced a growth of only 4.8% in 2007-08 and -8.2% in 2008-09 against
growth of 8.6% in 2006-07. Clearly, the manufacturing sector of Pakistan has been hurt badly
since the intensification of the war. In 2004-05, large-scale manufacturing reached the highest
growth rate of 19.9%.
Export performance of important sectors of Pakistan has been deteriorating rapidly since war
intensification. The two most important sectors of Pakistan, i.e. leather and textiles, have
suffered immensely. Table 2 presents a picture a clear picture declining exports in the leather
sector.
Agha Saiddain Chairman (2008-09), Tanning Industry, North Region, Pakistan Tanning
Association (PTA) in an interview stated that:
“There has been a 27% decline in export of leather products during July – November 2009, while
India’s exports increased by 30% over the same period. Power outages, government negligence
of the sector, and most significantly disruption in the supply chain, raw materials for the
industry coming from Baluchistan, due to WoT have resulted in huge losses for this sector.
Leather sector of Pakistan is the hardest hit since the supply chains of raw materials from
Afghanistan, NWFP and Baluchistan have been disrupted, leading to a loss of competitiveness in
the international market for leather. Imported raw materials are now subject to higher
insurance rates for Pakistan.”

Table 3.2 Month-wise Export Figures of Leather, Leather Apparel & Clothing, Leather Gloves, Leather
Footwear and other Leather Manufactures (2007 and 2008)
Month Export Value
($ millions)
Month Export Value
($ millions)
July 07 96.805 July 08 107.804
August 07 88.393 August 08 90.654
September 07 90.403 September 08 103.540
October 07 83.323 October 08 70.203
November 07 127.252 November 08 93.901
December 07 114.655 December 08 69.239
January 08 77.750 January 09 78.082
February 08 100.628 February 09 65.720
March 08 125.018 March 09 65.261
April 08 96.967 April 09 63.927
May 08 109.200 May 09 72.978
June 08 109.727 June 09 77.837
TOTAL 1220.121 TOTAL 959.146
Source: Federal Bureau of Statistics
Small and Medium Enterprise(SME) sector is critical to inclusive economic growth and
employment. Large corporations can engage with SMEs and localize the creation of value, and
in this way, large corporations build the capacity of SMEs leading to economic development
(WBCSD).
Pakistan’s SME businesses have been adversely affected by the WoT. The negative
consequences to the trading activities of SMEs are mainly attributed to the WoT and to a lesser
extent to the global financial and energy crises. The negative consequences of global financial
crisis are not as great for Pakistan as compared to other countries because the financial sector
of Pakistan is inadequately linked with global markets (Ali 2009). Also, according to the IMF
(2009a), Pakistan has not been adversely affected by the global financial crisis due to non-
integration of the domestic financial sector with the global financial sector. The government
has not been able to deal with the energy crisis because its attention and resources have been
diverted towards the WoT.
Fayyaz Riaz Head, Industrial Support Program SMEDA highlighted that
“New businesses that are small have been harmed as they are not considered credible. They
cannot get customers as easily as the established ones. Both new and old firms have lost many
business opportunities as it is harder to make new customers. New businesses have gone to
competitors. No government assistance to any size of firm. Post quota era subsidy for R&D
support, which encompassed that 6% of export value subsidy was given to all exporters is no
longer there. It was eliminated in June 2007 or 2008. Sales tax refund on exports, the policy has
changed for that as well. It was 100% sales tax refund.”

3.6. Performance in Major Export markets
The result of the WoT is the alarming deterioration in the image/perception of Pakistan, and
poor image of the goods it exports to the extent that clients have requested to have no label on
the products.” Major trading partners of Pakistan have been given travel advice to avoid
travelling to Pakistan. Pakistani exporters also face the problem of visa and hence find it
difficult to make deals and promote & market their products. All these factors have contributed
to the decline/stagnant export share of Pakistan in its major trading partner markets (see Table
3).
Table 3.3 Major Export Markets for Pakistan
Country 2005-06
(%)
2006-07
(%)
2007-08
(%)
2008-09
(%)
USA 25.5 24.6 19.5 18.8
Germany 4.2 4.1 4.3 4.1
Japan 0.8 0.7 0.7 0.7
UK 5.4 5.6 5.4 4.8
Source: Economic Survey of Pakistan, 2009
3.7. Rising Costs in the Export Cycle
The Finance ministry estimated a loss $ 1.4 billion to exports which clearly shows that Pakistan’s
exports have suffered and are still suffering losses due to war on terror. It is feared that these
losses might be much higher once a detailed assessment of the stages involved in the entire
export cycle is carried out. The following sections seek to identify how the efficiency of the
supply chain has been affected leading to higher logistics cost and rising trade cost due to the
negative soft image abroad. High logistics cost to exporters are eventually transformed to
higher export prices, thus reducing the competitiveness level of export commodities. It is most
essential that the total quality of the product and supply chain is bound together to avoid
shortcomings at one end resulting in un-competitiveness at the client end.

3.7.1. Logistics Costs
In the ever increasing race of achieving high level of competitiveness among countries, the
quality of logistics can have a major impact on a firm’s decisions about which country to locate
in, which suppliers to buy from, and which consumer markets to enter. High logistics costs and
more particularly low levels of service are a barrier to trade and foreign direct investment and
thus to economic growth. Countries with higher overall logistics costs are more likely to face
deteriorating overall as well as sectoral competitiveness.
Pakistan’s performance in key logistics indicators has deteriorated significantly from 2006
onwards which also marks the intensification of War on Terror period. A comparison of
Pakistan’s Logistics Performance Index (LPI) with its major competitors reveals the w
logistics in the export supply chain from 2006 to 2010(see Figure
Figure 3.4 Cross-Country Comparison of Logistics Performance Index (LPI)
Source: World Trade Indicators (2007 & 2010)
Late deliveries and transport costs hampers the
total quality of exports is a combination of quality in products and quality in supply. Here
we analyze the quality of supply in Pakistan through different logistics efficiency measures
in the year 2006 which is taken as the Pre war on terror period visa viz its competitors and
in the year 2010 which is taken as the Post war period.
indicators propose a comprehensive approach to supply chain performance. The table
shows a major decline in Pakistan’s performance in all indices with a major fall in the
efficiency of customs and tracking& tracing vis
n’s performance in key logistics indicators has deteriorated significantly from 2006
onwards which also marks the intensification of War on Terror period. A comparison of
Pakistan’s Logistics Performance Index (LPI) with its major competitors reveals the w
logistics in the export supply chain from 2006 to 2010(see Figure 3.4).
Country Comparison of Logistics Performance Index (LPI)
Source: World Trade Indicators (2007 & 2010)
Late deliveries and transport costs hampers the competitiveness of Pakistan’s exports.
total quality of exports is a combination of quality in products and quality in supply. Here
we analyze the quality of supply in Pakistan through different logistics efficiency measures
taken as the Pre war on terror period visa viz its competitors and
in the year 2010 which is taken as the Post war period. Logistics Performance Index and its
indicators propose a comprehensive approach to supply chain performance. The table
major decline in Pakistan’s performance in all indices with a major fall in the
efficiency of customs and tracking& tracing vis-à-vis its major competitors.
n’s performance in key logistics indicators has deteriorated significantly from 2006
onwards which also marks the intensification of War on Terror period. A comparison of
Pakistan’s Logistics Performance Index (LPI) with its major competitors reveals the worsening of
Country Comparison of Logistics Performance Index (LPI)
competitiveness of Pakistan’s exports. The
total quality of exports is a combination of quality in products and quality in supply. Here
we analyze the quality of supply in Pakistan through different logistics efficiency measures
taken as the Pre war on terror period visa viz its competitors and
Logistics Performance Index and its
indicators propose a comprehensive approach to supply chain performance. The table 3.4
major decline in Pakistan’s performance in all indices with a major fall in the

Table 3.4 Cross country Comparison of Logistics Indices
Country Customs Infrastructure Logistics
Competence
Tracking
/ Tracing
Timeliness
India
(2006)
2.69 2.9 3.27 3.03 3.47
(47) (42) (31) (42) (47)
India
(2010)
2.7
2.91
3.13
3.16
3.14
(52) (47) (46) (40) (52)
Pak.
(2006)
2.41
2.37
2.71
2.57
2.93
(69) (71) (63) (76) (88)
Pak.
(2010)
2.05
2.08
2.91
2.28
2.64
(134) (120) (66) (120) (93)
Sri.
(2006)
2.25
2.13
2.45
2.58
2.69
(89) (105) (84) (75) (113)
Sri.
(2010)
1.96
1.88
2.48
2.09
2.23
(143) (138) (117) (142) (142)
Bang.
(2006)
2
2.29
2.33
2.46
3.33
(126) (82) (101) (87) (54)
Bang.
(2010)
2.33
2.49
2.99
2.44
2.64
(90) (72) (61) (96) (92)
Source: World Trade Indicators (2007 & 2010)
According to the Doing Business surveys, there has been a reduction in the number of
documents required for exporting in India and Bangladesh where as Pakistan has remained
stagnant during the period 2006-2008 (see Table 3.5). The Doing Business 2008 report showed
that it is now less costly to export a container consignment from Pakistan than from India, Sri
Lanka and Bangladesh. Pakistan’s days to export are considerably more as compared to its
competitors and have remained stagnant (44 days) between the period 2006-2008 (see table
1). This shows that Pakistan’s performance in these logistics indexes has remained either
stagnant or deteriorated after 2006 which clearly illustrates that exports have potentially been
effected through increase logistics cost.

Table 3.5 Cross Country Comparison of Cost of Doing Business Indicators
Country Days for export
Days for export
No. of documents for export
No. of documents for export
UNCTAD Liner shipping connectivity index (0 to 100, best)
UNCTAD Liner shipping connectivity index (0 to 100, best)
Cost to export (US$ per container)
Cost to export (US$ per container)
2006 2008 2006 2008 2006 2008 2006 2008
Bangladesh 35 28 7 6 5.29 6.4 902 970
India 23 23 10 8 42.9 42.18 864 945
Pakistan 44 44 9 9 21.82 24.61 515 611
Sri Lanka 6 6 7 8 37.31 46.08 797 865
Source: World Trade Indicators year
Moreover the logistics cost and performance may have changed with intensification of WOT
from 2007 onwards. From a policy perspective, one needs to assess the role of worsening
logistic performance (if any) on declining exports in the last two years. Discussed below are
some of the key areas in the logistics supply chain which have been effected most due to the
WoT and its intensification.
3.7.2. Transportation Costs Increased & Capacity Severely Stretched
The long waiting and traveling times, high costs and low reliability are hindering the country’s
economic growth. These factors reduce the competitiveness of the country’s exports and
constrain Pakistan’s ability to integrate into global supply chains, which require just-in-time
delivery. The war on terror is impacting the transportation sector of Pakistan by increasing the:
1. Higher charges due to higher risks
2. Risks of damage/disruption involved in transporting
3. Non-availability of transport due to Diversion to Afghan Transit Trade (ATT),
NATO, ISAF
4. Financial Impact of NATO/ISAF freight on Transit Routes
5. Rush due to strikes
6. One day closure of business activity causes rush the next day further raising the
cost
After carrying out stakeholder consultations it was found that transportation costs have gone
up significantly and they fluctuate on daily bases depending on the current security situation in
the country. The Exporters and freight forwarders interviewed raised similar concerns on the
fact that transporters charge more due to risk associated with traveling, which rises with every

terrorist activity. The average truck transport rates between Lahore and Karachi as presented in
the World Bank logistics study compared to the current prevailing rates are as follows:
Table 3.6 Fluctuating Transport rates
The transport rates have also increased after the Afghan transit as the limited transport
capacity of Pakistan has been diverted to carrying US cargo, resulting in limited transport
available for exporters. This leads to a reduction in the bargaining ability of the exporter and
sometimes trucks are not available, which causes delays in shipment. This problem is more
frequently faced by exporters in Up country. If business closes due to strike for one day the
rates go up the next working day due to backlog as well
3.7.2.1. Freight charges
The global recession has led to a fall in international freight charges world wide but the case for
Pakistan has been entirely opposite because of security issues intensifying in the past 2 to 3
years. All the exporters interviewed have put forth there concern over high freight charges. The
freight forwarders5 justify the high charges due to higher risks of delays arising from strikes
which increase the detention charges on the transport hired. Thus they have increased their
over heads.
In Pakistan Freight forwarders charge higher overhead due to risk and possibility of delays because of
random terrorists attacks, which confounds the already poor shipping connectivity of Pakistan.
3.7.2.2. Insurance Costs
The risks arising from the security situation due to war on terror has affected the insurance
cost. According to freight forwarders the inland transit insurance charges fluctuate on daily
basis and even increase by 400% due to the higher risk resulting from a bomb blast or any other
4 These estimates are taken on average from the information provided by freight forwarders.
5 Freight forwarders and express carriers are in a privileged position to assess how countries perform on logistics. They manage
operations from factory and warehouse to port, from port to overland transit, and through one or more borders to destination, with
each link testing a country’s logistics infrastructure performance
World Bank Logistics study
(2006)
Rs 14,000 per 20’ container
Current prevailing rates4
Rs 35,000-45000 per 20’ container
On the day of strike or terrorist activity the rates shoot up to
Rs 60,000
terrorist activity. Sometimes the insurance companies even refuse or are not willing to cover up
the entire insurance. This shows that insurance cost are highly sensitive to the current security
risk. Shipping charges have also increased due to the fact that Pakistan’s ports have remained in
the red zone which increased the insurance cost of vessels.
Shipping companies in order to cover up the high insurance cost have introduced the War Risk
Surcharge which on average is $50 per container and increases as the security concerns
heightened within the country.
3.7.2.3. Delays in Shipment
Pakistan’s major export commodity is textile which is seasonal in nature. According to a few
textile exporters interviewed
“Buyers are not placing their orders in the prevailing uncertain environment. They doubt the
timely supply of goods from Pakistan. As a result our exports are affected badly, where as
exports serve as one of the major source for earning foreign exchange. Unfortunately the
growth of this important sector of the economy is in a continuous jeopardy.”
The timely export of goods doesn’t remain possible many a times because of war on terror and
the prevailing social unrest/hazards. The different channels through which war on terror is
causing delays in shipments, identified from stakeholders’ experiences are given as follows:
• High security risk for inland transportation
• One day close-down of port costs Rs 4 billion [FBR estimates]
• Frequent port (and entry points) close-downs ▫ Off days, followed by rush (further delays) ▫ Vessels missed + delay/ detention charges on export containers starting from $5
per day demurrage and import container $7 per day as well as $40 per day detention charges.
• Shipment shut-outs due to stricter scrutiny at port/terminals
▫ Karachi International Container terminal alone reported 5,842 Shut-out Teus in 2009
▫ Special checking and scanning and increased cost of compliance for US bound cargo
• Port Congestion faced by both exporters and importers
▫ Rush experienced when business activity is resumed after a strike or terrorists attack
▫ Afghan bound cargo dwell time is 16 days (with 14 days free time resulting in excessive usage of port as a warehouse) compared to 4 days for exports and 10
days for imports.

The rising issue of delays in shipment can worsen in the coming years. The delays in shipment is
closely associated with war on terror, therefore a favorable trade environment is most vital for
reducing these bottlenecks.
3.7.3. Marketing cost
Negative travel advisories against Pakistan by several foreign governments have discouraged
foreign buyers from visiting Pakistan. The following costs have been identified that are having a
detrimental effect on the costs of international marketing:
3.7.3.1. Rising cost of Insurance for travelling to Pakistan
Travel advisories have negatively impacted Pakistan’s exports in many ways. Negative travel
advisories discourage travelling to Pakistan, which has heightened the risk factor. This has
caused the higher business travel insurance premiums. However, some insurance policies do
not even cover travel to vulnerable countries like Pakistan, Iraq and Afghanistan.
“A review of travel insurance premiums charged by major international insurance groups1 for
Pakistan over the past ten years reveals that Pakistan has been categorized as a “high risk” zone
and, depending on the type of insurance policy, the rates have been increased by approximately
three times”
According to the National Insurance Company, exorbitant premium rates under the provision of
‘Terrorism Cover’ are being charged, which are 50% - 200% higher than the normal travel
insurance cover rates6. The high insurance cost coupled with the risk of loss of life or
kidnapping results in foreign buyers refraining from travelling to Pakistan.
3.7.3.2. Inability to Attract Foreign Buyers / Technical Experts
In addition to foreign buyers and their associates not travelling to Pakistan, the negative impact
of travel advisories is that technical experts, especially from USA & EU, are also refraining from
offering their services in Pakistan which has resulted in delays and production losses.
Pakistan Carpet Manufacturers and Exporters Association was of the view that hand knotted
carpets were a unique product and so buyers place orders after inspecting every piece of the
carpet. Since buyers are now reluctant to travel to Pakistan and transporting carpet samples to
other countries is a costly undertaking, as a result exports have almost halved.
6 National Insurance Company Limited “Implementation of Trade Policy 2009-10” Doc NICL/ICBusiness/43-09
0
500
1000
1500
2000
2500
3000
3500
4000
2005
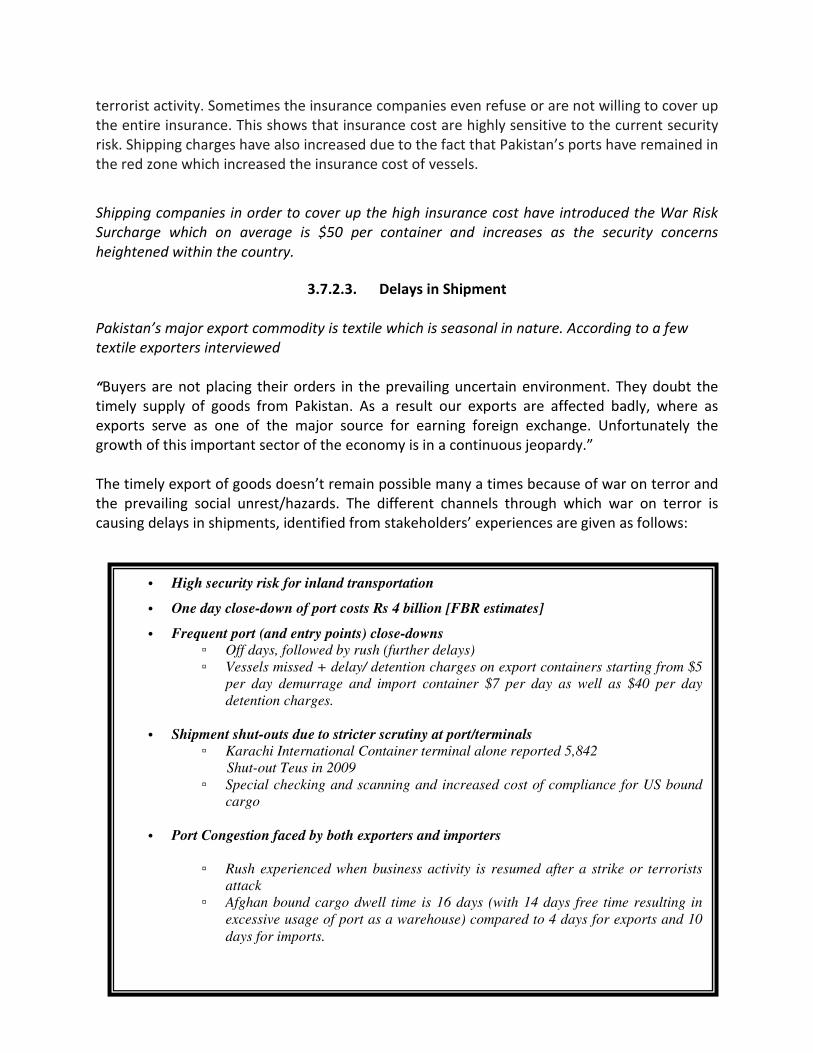
Figure 3.5. Travel Advisories Against
Source: US Embassy
First time the travel advisories of US issued the highest caution against travelling to Pakistan
was in 2003 (see Figure 3.5). Soon after, the negative impact of travel advisories on exports
began to unfold. Exporters and business representatives allayed their fears to government
authorities on this issue. It was due to the gravity of the matter that on every subsequent
foreign visit by the President or Prime Minister the removal of travel advisories was
vociferously articulated at the highest level
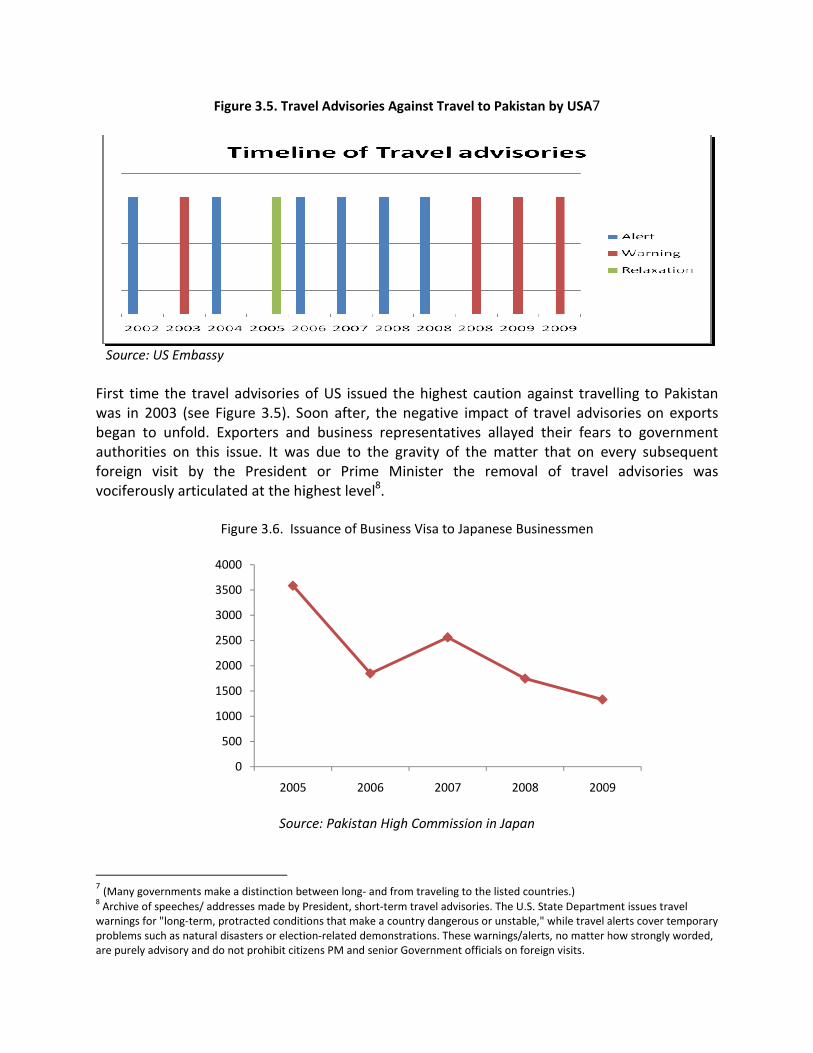
Figure 3.6. Issuance of Business Visa to Japanese Businessmen
Source: Pakistan High Commission in Japan
7 (Many governments make a distinction between long
8 Archive of speeches/ addresses made by President, short
warnings for "long-term, protracted conditions that make a country dangerous or unstable," w
problems such as natural disasters or election
are purely advisory and do not prohibit citizens PM and senior Government officials on foreign v
2005 2006 2007 2008 2009
. Travel Advisories Against Travel to Pakistan by USA7
First time the travel advisories of US issued the highest caution against travelling to Pakistan
5). Soon after, the negative impact of travel advisories on exports
fold. Exporters and business representatives allayed their fears to government
authorities on this issue. It was due to the gravity of the matter that on every subsequent
foreign visit by the President or Prime Minister the removal of travel advisories was
vociferously articulated at the highest level8.
Issuance of Business Visa to Japanese Businessmen
Source: Pakistan High Commission in Japan
(Many governments make a distinction between long- and from traveling to the listed countries.) Archive of speeches/ addresses made by President, short-term travel advisories. The U.S. State Department issues travel
term, protracted conditions that make a country dangerous or unstable," while travel alerts cover temporary
problems such as natural disasters or election-related demonstrations. These warnings/alerts, no matter how strongly worded,
are purely advisory and do not prohibit citizens PM and senior Government officials on foreign visits.
2009
First time the travel advisories of US issued the highest caution against travelling to Pakistan
5). Soon after, the negative impact of travel advisories on exports
fold. Exporters and business representatives allayed their fears to government
authorities on this issue. It was due to the gravity of the matter that on every subsequent
foreign visit by the President or Prime Minister the removal of travel advisories was
term travel advisories. The U.S. State Department issues travel
hile travel alerts cover temporary
related demonstrations. These warnings/alerts, no matter how strongly worded,

There has been a declining trend in the number of visits of foreign business men to Pakistan.
Figure 3.6 shows that the number of business visas issued to Japanese business men has
reduced drastically since 2007 which is the post war intensification period
Due to security concerns, foreign buyers and exhibitors are not coming to Pakistan to attend
trade fairs. TDAP Expo Secretariat officials in Karachi reported that the response of
international buyers and exhibitors to participate in the upcoming event
disappointing despite facilitation by TDAP, in terms of subsidized air tickets etc
Source : Calculation of data from Pakistan Mission abroad
0
2000
4000
6000
8000
10000
12000
14000
16000
Germany USA
Number
Pakistan (2007
There has been a declining trend in the number of visits of foreign business men to Pakistan.
6 shows that the number of business visas issued to Japanese business men has
reduced drastically since 2007 which is the post war intensification period.
Due to security concerns, foreign buyers and exhibitors are not coming to Pakistan to attend
trade fairs. TDAP Expo Secretariat officials in Karachi reported that the response of
international buyers and exhibitors to participate in the upcoming event of EXPO 2010 was
disappointing despite facilitation by TDAP, in terms of subsidized air tickets etc
Figure 3.7. Business Travelers
Source : Calculation of data from Pakistan Mission abroad
UK EU India Total
Number of Business Travelers to
Pakistan (2007-2009)
There has been a declining trend in the number of visits of foreign business men to Pakistan.
6 shows that the number of business visas issued to Japanese business men has
Due to security concerns, foreign buyers and exhibitors are not coming to Pakistan to attend
trade fairs. TDAP Expo Secretariat officials in Karachi reported that the response of
of EXPO 2010 was
of Business Travelers to
2007
2008
2009

3.7.3.3. Increased Foreign visits of Pakistani Exporters
The negative impact of travel advisories has been strongly felt in textiles which is Pakistan’s
largest exporting sector. Since travel advisories are keeping potential buyers away from
Pakistan, textile exporters have to send their representatives to negotiate and deal with buyers
abroad.
The adverse security environment has led to the closure of foreign buyers’ liaison offices in
Pakistan. In comparison Bangladesh, which is not a victim of the War on Terror, has more than
1000 buying houses compared to a negligible few in Pakistan. Closure of liaison offices has
added to the marketing costs of Pakistani exporters as not only do they have to travel abroad
more frequently but exporters also have to open their own liaison offices and display centers in
major markets like US and Germany.
In an interview with S. M Khalid, GAP Buying House it was found that…
“EU and USA buyers no longer feel safe coming to Pakistan. Before the WOT, importers would
visit factories in search of reliable outsourcing partners. They would place orders and when
satisfied, they would divert their orders from other countries towards Pakistan, but after WOT,
they now place orders with India, Bangladesh, etc. While placing a huge order, the stakes are
high and so it is an important consideration that the factory should be easily and frequently
visited and inspected”
“Many foreign buying houses closed down in Pakistan after the WOT, as there is no point in
maintaining them if company executives cannot visit. This has resulted in loss of exports for
Pakistan and a gain for other countries.”
“Pakistan has been USA’s key ally in the WOT, but USA imposes a tariff rate of 19% on garments
from Pakistan, whereas only 16% on Indian garments”
3.7.3.4. Decline in Participation in International Trade Fairs
The absence of foreign buyers has meant that exporters now have to travel more often to
international trade fairs, which charge a hefty participation fee. According to TDAP, the
primary agency responsible for taking trade delegations abroad, exporters participate in
international trade fairs through either TDAP, Chambers of Commerce or at their own expense
which is more costly for an exporter. The war on terror has caused decline in participation in
international trade fairs. The war on terror has resulted in fiscal imbalances and a shift in
resources away from other sectors. The major reason for increase in participation costs has
been the withdrawal of subsidies for participating in trade fairs as TDAP does not have enough
funding to subsidize this activity anymore mainly due to the falling Export Development Fund
(EDF). This is evidenced by the fact that in 1997 TDAP took delegations to over 100 trade fairs
abroad whereas in 2009 it only took about 50 delegations9.
9 Interview with TDAP sources

3.7.3.5. Denial and delay in issuance of visas to Pakistani business travelers
Issuance of visas was not a problem until a few years ago. Due to the current security situation,
many countries have placed stringent visa requirements on Pakistani travelers and high visa
refusal rates can be seen( see Table 3.7). This has resulted in an increase in psychological,
monetary and time costs for Pakistani exporters.
Source: Pakistan High Commissions
3.7.4. Market Share Analysis
In 1999 Pakistan’s share in global exports was 0.2 %. 10However in the coming years Pakistan
failed to retain its export share which first plummeted to 0.149% in 2001 and stands as low as
0.126 % in 2008 (table 3.8, first column). In between 2001 and 2008, the shares fluctuated but
never reached the levels of 1990s. Beyond 2000, the fall in Pakistan’s exports share in global
export market may be attributed to a number of reasons; the prime being fall in the
competitiveness of its exporting industry which is further attributed to the war on terror. In
comparison to other South Asian countries during 2001-2008. India, however, has successfully
improved its share from 0.7 % to 1.105 %.
If everything remains constant and assuming that Pakistan retains its export share of 0.2 %
during 2001-2008 period, table 1 provides annual losses in total exports mounting to a total of
$ 48.69 billion. The losses are calculated by subtracting actual exports (derived from actual
export shares) with potential exports (derived from 0.2 % share retention).
By end of 2005, Pakistan lost GSP+ facility which resulted in yet steeper losses in export shares
during 2006, 2007 and 2008. (see table 9, column 1). Bangladesh, which is a major competitor
of Pakistan in its textiles sector, gained from this as it was able to exploit its position against
10
World Trade Organization Statistics
Table 3.7. Average Business Visa refusal rate by US authorities (2006-2009)
Country Average Refusal rate (%)
China 19.75
India 23.65
Pakistan 39.45

Pakistan with its total export share rising from 0.089 in 2005 to 0.097 in 2006. In later years,
Bangladesh retained its higher shares which indicate that Pakistan continues to lose its market
share to Bangladesh.
However within South Asia, trade is not only diverted to Bangladesh alone. India has also been
able to witness significant improvements in world exports shares while rising from 0.83 in
2004 to 0.95 in 2005 (table 9, column 5). It accounts for annual growth in share of world
exports of 14.23%, the largest gain in this decade for India. Indian export markets continued
to grow steadily during 2006, 2007 and 2008. Part of Pakistan’s export losses are attributed to
Indian gains.
If we account for Bangladesh and Indian world export share growth rates, they were much
higher than that of Pakistan. Pakistan share in world exports have largely witnessed negative
growth. Assuming that both Bangladesh and India have captured Pakistan’s export losses as
their export gains through trade diversion, we can build up a scenario where we calculate
Pakistan’s potential exports if they have grown with the average of India and Bangladesh’s
export share instead of its own. In such a case Pakistan has lost $ 44.17 billion. (Table 3.9; see
columns 11 and 12). To sum up the analysis we suggest that Trade diversion from Pakistan to
Bangladesh and India has taken place due to Trade related cost of war on terror face by
Pakistan in addition to losses accrued by Pakistan due to Loss of GSP Plus initiative in 2005.
Table 3.8. If Pakistan retained a 0.2% Share in World Exports
(US Billions)
Year Pakistan Exports
(A)
Potential
if Pakistan retained
0.2% of World Share in
Exports
(B)
Loss
A-B
2001 9.2 12.3 3.1
2002 9.9 12.9 3.01
2003 11.9 15.2 3.2
2004 13.3 18.4 5.05
2005 16.01 20.9 4.9
2006 16.9 24.2 7.2
2007 17.8 27.9 10.1
2008 20.3 32.1 11.8
48.9
Source: Own Calculations using data from World Trade Organization
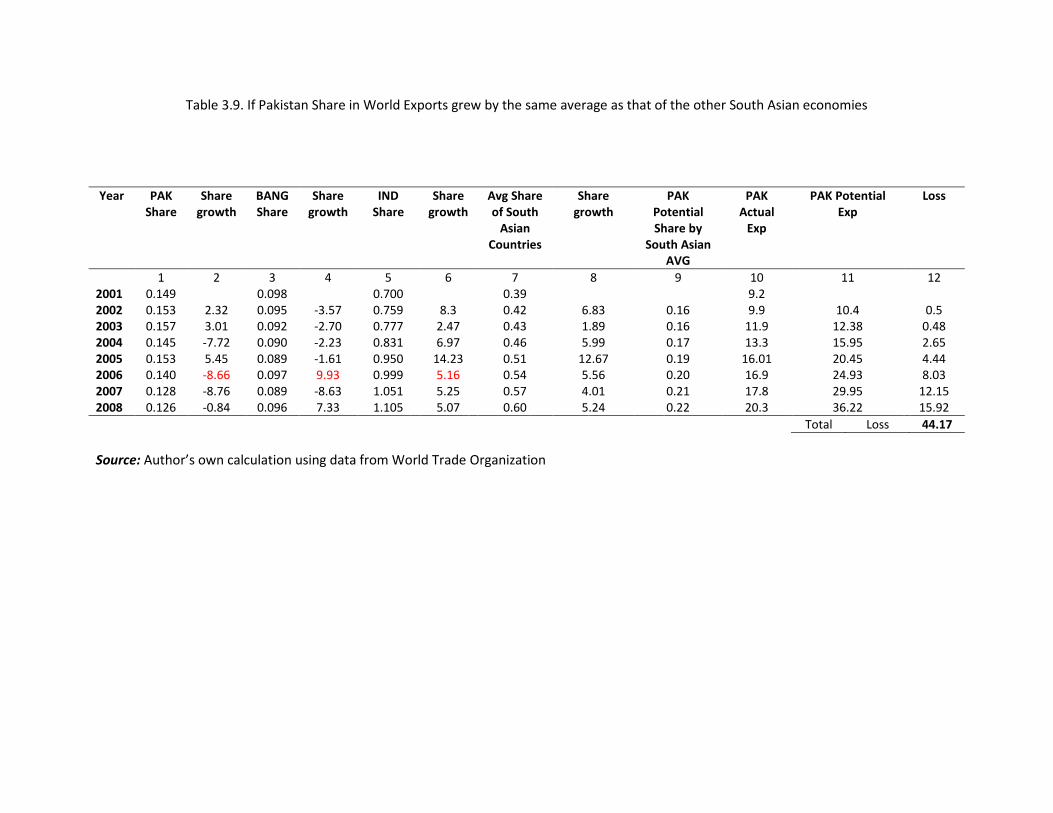
Table 3.9. If Pakistan Share in World Exports grew by the same average as that of the other South Asian economies
Source: Author’s own calculation using data from World Trade Organization
Year PAK
Share
Share
growth
BANG
Share
Share
growth
IND
Share
Share
growth
Avg Share
of South
Asian
Countries
Share
growth
PAK
Potential
Share by
South Asian
AVG
PAK
Actual
Exp
PAK Potential
Exp
Loss
1 2 3 4 5 6 7 8 9 10 11 12
2001 0.149 0.098 0.700 0.39 9.2
2002 0.153 2.32 0.095 -3.57 0.759 8.3 0.42 6.83 0.16 9.9 10.4 0.5
2003 0.157 3.01 0.092 -2.70 0.777 2.47 0.43 1.89 0.16 11.9 12.38 0.48
2004 0.145 -7.72 0.090 -2.23 0.831 6.97 0.46 5.99 0.17 13.3 15.95 2.65
2005 0.153 5.45 0.089 -1.61 0.950 14.23 0.51 12.67 0.19 16.01 20.45 4.44
2006 0.140 -8.66 0.097 9.93 0.999 5.16 0.54 5.56 0.20 16.9 24.93 8.03
2007 0.128 -8.76 0.089 -8.63 1.051 5.25 0.57 4.01 0.21 17.8 29.95 12.15
2008 0.126 -0.84 0.096 7.33 1.105 5.07 0.60 5.24 0.22 20.3 36.22 15.92
Total Loss 44.17

4. QUANTIFYING LOSS IN EXPORT EARNINGS
FROM TERRORIST ATTACKS
4.1. Introduction
In the context of various economies of the world, the review of literature chapter in this report
extensively documented the conceptual framework and empirical evidence linking the impact
of terrorists’ attacks on selected economies as well as international trade/exports,. Some
countries have experienced sporadic terrorist’s attacks over a number of years while others
continue to face them on a continued, i.e., daily, weekly and monthly basis. The nature,
intensity and time profile of episodes of terrorists’ attacks also vary by country and need a
separate study to filter generalized trends and conclusions.
Even prior to 9/11, Pakistan was not immune to sporadic terrorist attacks (whatever the
underlying cause) similar to the experience of many other countries. As a frontline state of war
on terror, frequency and intensity of terrorist attacks in Pakistan increased notably after 9/11,
but the costs to the economy and international trade remained benign and many would regard
them lower then the benefits in terms of re-scheduling of debt, and increased foreign economic
and military assistance. The positive spillover effects from Global expansion of trade and robust
world GDP growth to the national economy further marginalized the costs of terrorists’ attacks
on the national economy and international trade during the period 2001-2007. However in
absence of any empirical analysis it may be difficult to argue against the premises that due to
terrorist attacks the economy failed to realize its full potential in growth and exports even in
that booming period.
A basic premise of this analysis is that any of the following three incidents since 2007 may have
lead to structural shifts in the frequency and intensity of terrorist attacks in the country:- a)
Flushing out of militants from Lal Masjid in the capital city of Islamabad in April/May 2007
thereby raising the security level of travel advisories b) Death of Benazir Bhutto in December
2007 provided a signal of political uncertainty and weak political/military resolve to fight the
militants and c) US government’s announcement to shift gear from Iraq to Afghanistan in mid-
2008. This period since 2007 also marks a gradual end to expansionary and supportive global
economic environment wherein the economic and financial costs outweighed the benefits of
partnership in war on terror.
The outline of this chapter is as follows:- The transmission framework of how the frequency
and intensity of terrorist attacks impact the level and competitiveness (through changing unit
costs) of exports will be discussed in the next section. Outline of a reduced form model to
empirically estimate the impact of terrorist attacks on exports will also form part of this section.
Section 4.3 will be an exploratory analysis (time trends, descriptive statistics) of indicators of
reduced form model of the previous section as well providing statistical support to the
delineation of above a priori time profile of incidents. Section IV will discuss the results of
estimating the reduced form model using simple and sophisticated estimation techniques. The

estimates from modeling will form the basis for quantification of losses to exports since 2007.1
Section V will use the estimates of modeling exercise to quantify the range of losses to export
potential since 2007.
4.2. From terrorist attacks to reduced exports
Terrorist attacks occurring on any single day/night are headline material nationally and
internationally in mostly all types of news media ranging from newspapers to internet. Thus in
a globally wired world, the terrorist attacks are a symbol and signal of national insecurity
increasing the risks to lives and property of the residents as well travelers. Many advanced
countries not only issue travel advisories but also change the level of previously issued travel
advisories based on frequency and intensity of attacks.
The personal travel insurance as well freight insurance are raised and thereby impact on the
cost of doing business as well outward and inward bound trade. Trade facilitation measures
such as national exhibitions and individual as well firm level meetings are re-scheduled to
another time or place or even postponed indefinitely. Visits of technical experts are
discouraged. Frequent and expected occurrence of attacks also change the trading strategy of
importers and exporters. Foreign firms may shift from smaller to larger firms or altogether stop
importing specialty products. The above fallouts from terrorist attacks ultimately impact
directly on the level of traded goods and indirectly on the unit cost of imports and exports. For
exports they erode the competitive edge in the world markets.
In case of Pakistan for the period under consideration, external factors and internal macro
instability further affected the growth of exports. The contagion of financial crisis in developed
nations transmitted to Pakistan in the form of reduced exports of merchandise and foreign
direct investment. Energy shortages and infrastructural bottlenecks within the country also
impacted the domestic manufacturing capacity and thereby meet export orders in a timely and
cost efficient manner, while a 25 percent depreciation of the Pakistani rupee against the US $ in
a matter of 18 months helped to adjust real effective exchange rate in line with galloping
inflation and may have stabilized exports.
The entire analysis of the following sections revolve around analyzing and modeling the above
stated factors as determinants of monthly exports for the 36 month period from July 2006-June
2009. Monthly data from July 2006 onwards related to number of terrorist incidents, including
the number of persons injured and killed provided by the Ministry of Interior is the basis for this
analysis. The Pakistan Customs provided the monthly data on exports, while monthly quantum
index of manufacturing and average monthly Pak Re/US $ is collected, processed and
disseminated by the Federal Bureau of Statistics. Quarterly data of GDP of 30 OECD countries
was obtained from OECD website.

The basic and simple specification of the reduced form model is formulated as:-
Exports = f (Incidents or Intensity, QIM, Exchange, OECDgdp)
Where,
Exports = Monthly total merchandise exports of Pakistan
Incidents = No. of monthly terrorist incidents as reported by the Ministry of Interior
Intensity = Monthly total number of killed +injured divided by INCDNTS.
QIM = Monthly Quantum Index of Manufacturing
Exchange = Average Monthly Pak Re/US $ exchange rate
OECDgdp= Quarterly GDP of OECD countries
4.3. Exploratory Analysis
The above indicators are plotted against time as shown in figures 4.1 to 4.6. The descriptive
summary of trends is as follows:- The no of monthly terrorists attacks (Incidents) fluctuate over
time with a rising trend, and a steep rise in the first half of 2009. The trend of intensity of
attacks in terms of total number of casualties (injured + killed) per terrorist attack plotted in Fig
2, fluctuates around a narrow band except a significant spike in later half of 2008. This was
mainly due to casualties from the terrorist attack on Marriot hotel in Islamabad in the last
quarter of 2008. Monthly exports exhibit a flat trend except short-lived rising trend in first half
of 2008. Quantum Index of manufacturing show a bi-modal distribution in a period of 36
months and discounting for these two spikes, the index is almost flat. The exchange rate
declined steeply during the entire 2008. The quarterly OECDgdp shows a rising trend with
steep decline from latter half of 2008.
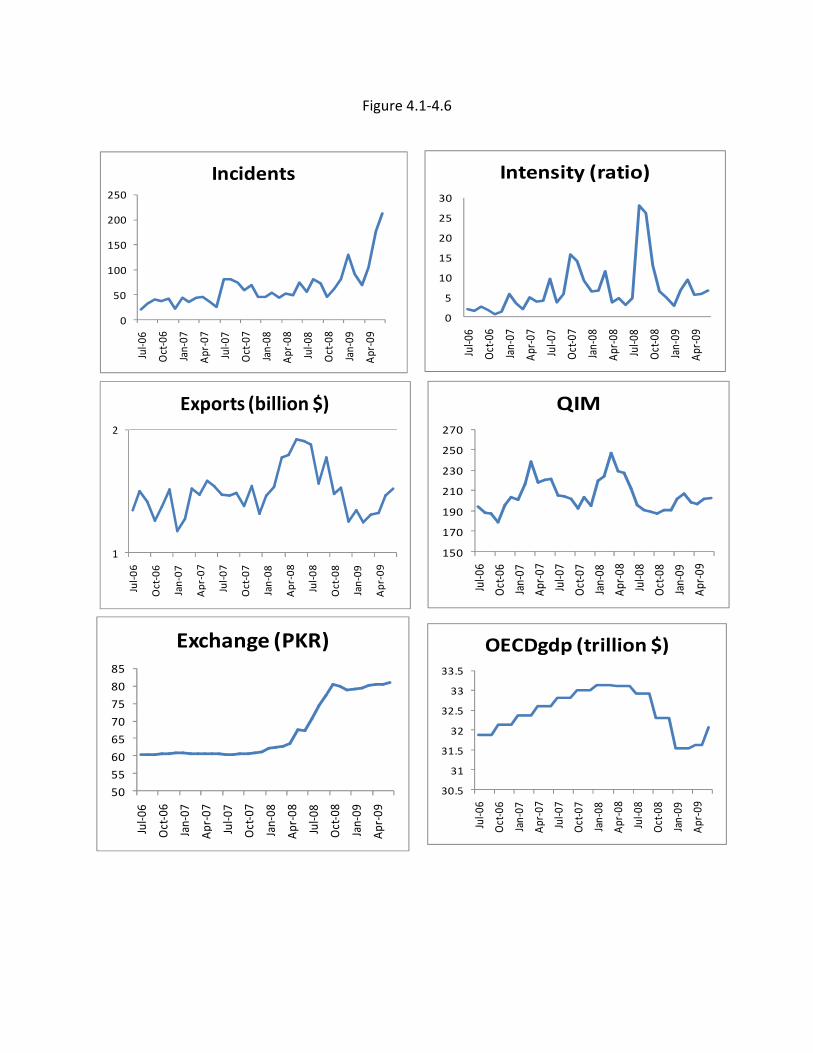
Figure 4.1-4.6
0
50
100
150
200
250
Jul-
06
Oct
-06
Jan
-07
Ap
r-0
7
Jul-
07
Oct
-07
Jan
-08
Ap
r-0
8
Jul-
08
Oct
-08
Jan
-09
Ap
r-0
9
Incidents
0
5
10
15
20
25
30
Jul-
06
Oct
-06
Jan
-07
Ap
r-0
7
Jul-
07
Oct
-07
Jan
-08
Ap
r-0
8
Jul-
08
Oct
-08
Jan
-09
Ap
r-0
9
Intensity (ratio)
1
2
Jul-
06
Oct
-06
Jan
-07
Ap
r-0
7
Jul-
07
Oct
-07
Jan
-08
Ap
r-0
8
Jul-
08
Oct
-08
Jan
-09
Ap
r-0
9
Exports (billion $)
150
170
190
210
230
250
270
Jul-
06
Oct
-06
Jan
-07
Ap
r-0
7
Jul-
07
Oct
-07
Jan
-08
Ap
r-0
8
Jul-
08
Oct
-08
Jan
-09
Ap
r-0
9
QIM
50
55
60
65
70
75
80
85
Jul-
06
Oct
-06
Jan
-07
Ap
r-0
7
Jul-
07
Oct
-07
Jan
-08
Ap
r-0
8
Jul-
08
Oct
-08
Jan
-09
Ap
r-0
9
Exchange (PKR)
30.5
31
31.5
32
32.5
33
33.5
Jul-
06
Oct
-06
Jan
-07
Ap
r-0
7
Jul-
07
Oct
-07
Jan
-08
Ap
r-0
8
Jul-
08
Oct
-08
Jan
-09
Ap
r-0
9
OECDgdp (trillion $)

Table 4.1 and 4.2 give the descriptive statistics and correlations of/among indicators chosen for
analysis. On average 65 terrorist attacks have occurred per month during the analysis period.
In terms of fatalities, on the average 7 persons were injured plus killed during each attack.
Compared to other economic indicators these two variables have the highest and second
highest variability. Terrorist attacks have increased at a monthly compound growth rate of 6.6
percent and average monthly growth is more than twice at 14.5 percent.
Table 4.1. Descriptive Statistics
Variables Mean C.V MCGR AMGR
Exports 1.49 12.75 0.35 0.90
Exchange 67.23 12.52 0.82 0.86
QIM 205.11 7.60 0.11 0.26
Incidents 65.61 60.61 6.64 14.50
Intensity 6.94 88.47 3.51 33.74
OECDgdp 32.65 1.69 -0.02 -0.02
MCGR=Monthly Compound growth rate
AMGR=Average Monthly Growth rate
The growth in monthly average intensity is 33 percent compared to the monthly compound
rate of just 3.5 percent. The rest of the variables exhibit monthly growth rates of less than 1
percent. The correlations among the 6 indicators suggest absence of multicollinearity with
correlation between incidents and exchange rate depreciation the highest at 0.66. Similarly the
correlation between monthly exports and quarterly OECDgdp is the second highest at 0.58. The
absence of multicollinearity among variables in a estimated model will increase the reliability of
individual impacts including terrorist attacks on export performance.
Table 4.2. Correlation Matrix
VARIABLES Exports Incidents Intensity QIM Exchange OECDgdp
Exports 1.00 -0.04 0.17 0.42 -0.03 0.58
Incidents -0.04 1.00 0.15 -0.13 0.66 -0.38
Intensity 0.17 0.15 1.00 -0.20 0.30 0.34
QIM 0.42 -0.13 -0.20 1.00 -0.31 0.40
Exchange -0.03 0.66 0.30 -0.31 1.00 -0.47
OECDgdp 0.58 -0.38 0.34 0.40 -0.47 1.00

4.4. Search for intensification period
Identifying the structural shift in the intensification of the terrorist attack regime during the
period is another objective of the study. The data on these indicators were split into the
following 3 likely candidates for structural shifts. A) The Lal Masjid incident in mid-2007 gives us
a pre-12 month period to be compared with 24 month post-Lal Masjid period. B) Death of
Benazir Bhutto in Dec 2007 splits the 36 month period equally between pre and post- Benazir
period. C) US government’s announcement to shift gear from Iraq to Afghanistan in mid-2008
is another candidate for structural shift in frequency and intensity of terrorist attacks. Thus 24
month prior to this announcement is considered a pre intensification period and a 12 month
period, i.e., July 2008 to June 2009 is considered a post-intensification period.
Table 4.3. Identifying Intensification Regime
Important Indicators/Averages
Factors Period 1(Jul07-Jun09) Period2(Jan08-Jun09) Period3(Jul2008-Jul09
Incidents Pre 36.17 47.16 48.79
Post 80.33 84.05 99.25
T Value 3.65 3.11 4.45
Intensity Pre 2.87 5.15 5.37
Post 8.99 8.74 10.09
T Value 3.15 1.80 2.29
Exports Pre 1.41 1.42 1.50
Post 1.53 1.56 1.47
T Value 1.78 2.26 0.39
QIM Pre 205.40 203.86 209.56
Post 204.97 206.36 196.22
T Value 0.07 0.47 2.61
Exchange Pre 60.63 60.67 61.59
Post 70.52 73.78 78.50
T Value 3.95 7.50 19.85
OECDgdp Pre 32.25 32.47 32.63
Post 32.55 32.44 32.10
T Value 1.60 0.16 3.06
Table 4.3 gives the results of performing two-sample (as defined by the timing of the above
incidents in War on Terror and designated as pre- and post the relevant period) t-test on the
variables of interest.
Intensification Period 1, July 2007-June 2009: The variables incidents, exports, intensity and
exchange rate are statistically different from the earlier period. Adopting another criteria i.e.,

relative absolute gap in the averages, only intensity has the highest gap between the two
periods.
Intensification Period 2, January 2008-June 2009: The variables incidents, exports and exchange
rate are statistically different from the earlier period. However, only exports have the highest
relative absolute gap among the averages. this period is identified as variable WOTDUM2 in the
multivariate analysis.
Intensification Period 3, July 2008-June 2009: Except exports, all other variables are significantly
different in their values in post-intensification from the early 24 month period. Moreover in
this period, 4 variables i.e., terrorist attacks, quantum index of manufacturing, exchange rate
and GDP of OECD countries have the highest absolute relative gap among the calculated
averages.
Thus the above simple exercise suggests that period 3 is not only different in terms of increase
in frequency of attacks but also different in terms of economic environment facing the country.
However the impact on exports in this period is not as severe as expected a priori.
4.5. Modeling the impact of terrorist attacks
In a reduced modeling framework, a priori terrorist attacks can impact on exports with or
without a lag. Moreover, a terrorist attack may even increase exports during the week\month
it occurs as exporters anticipating further attacks may try their best to ship existing orders in
advance. However, once the news spread and future trade is affected, exports may decline and
adverse impact may outweigh the initial kneejerk positive impact.
An exploratory model with 1-6 month lag in terrorist attack plus the frequency of attacks in the
current month was included along with the other variables of the basic model specified above
was estimated. The results in the appendix.A.2 indicate that terrorist attacks significantly
impact exports with a 6 month lag. All other lag terms of terrorist attacks including its
frequency in the contemporaneous month are statistically not significant.
Table 4.4 shows the results from estimating the model with 6 month lag for terrorist attacks in
addition to a 2 month lag interacting with an intensification period identified as the post-
Benazir period, i.e., Jan 2008-June 2009 (Incidents(-2)*WOTDUM2) . Note that not only the lag
is shorter and therefore the transmission is faster but the impact on exports is more adverse
than in the pre-Benazir period. Also all the variables have the correct a priori signs. Observe the
following from the remaining determinants:- a) A one percent change in last quarter’s OECD
gdp results in a 4.3 percent change in our monthly exports. B) An anticipated 1 percent change
next month in depreciation of Pak Re increases current exports by ½ a percent. However it is
statistically significant only at the 80 percent level. c) Quantum index of manufacturing and
exports have a near unitary elasticity, but in post-Benazir era, it increases to more than 1.

Table. 4.4. Model for Total Exports: No of Terrorist Attack
Method: Least Square
Sample (adjusted): 2007M01 2009M05
Included observations: 29 after adjustments
Variable Coefficient Std. Error t-Statistic Prob.
C -21.455 6.559 -3.271 0.004
LOG(Exchange(1)) 0.525 0.361 1.452 0.163
LOG(QIM) 0.933 0.305 3.064 0.006
LOG(LGOECDgdp) 4.341 1.429 3.037 0.007
LOG(Incidents(-6)) -0.118 0.044 -2.652 0.016
LOG(Incidents(-2))*WOTDUM2 -0.149 0.040 -3.716 0.001
LOG(QIM(-1))*WOTDUM2 0.119 0.036 3.268 0.004
DUM1208A -0.065 0.024 -2.666 0.015
MA(1) 0.572 0.038 14.923 0.000
MA(2) 0.995 0.103 9.640 0.000
Adjusted R-squared 0.841 Mean dependent var 0.404
S.E. of regression 0.053 F-statistic 17.494
Durbin-Watson stat 1.958 Prob(F-statistic) 0.000
Similar to exploratory model for identifying lags in terrorist attacks, a model is tested for
assessing the impact of intensity on exports. Appendix A.2 presents results of using 6 lags plus
the concurrent month intensity of attacks. Interestingly only the ongoing monthly intensity of
attacks has an impact on current months’ export performance. It is only statistically significant
at the 80 percent level and has the correct sign. The impact of other variables (except for
coefficient of QIM) is comparable in magnitude and statistical significance to the corresponding
model for number of monthly attacks.
Table 4.7 shows the results from estimating the model with concurrent intensity of attacks in
addition to an interactive dummy of post-Benazir period and 5 month lag in intensity. In
contrast to the model estimates with no. of incidents, the impact of intensification due to
Benazir death on exports is smaller and comes with a delay of 5 months. All the variables have
the correct sign and the impact on exports (excluding intensity indicator) is larger than in the
level model. The explanatory power is smaller from the previous model.

Table 4.7.Model for Total Export: Intensity
Method: Least Squares
Sample (adjusted): 2006M12 2009M06
Included observations: 31 after adjustments
Variable Coefficient Std. Error t-Statistic Prob.
C -27.047 8.226 -3.288 0.003
LOG(Exchange) 0.645 0.342 1.887 0.072
LOG(QIM) 1.315 0.315 4.167 0.000
LOG(OECDgdp) 5.141 1.991 2.582 0.017
LOG(Intensity) -0.078 0.019 -4.036 0.001
LOG(Intensity(-5))*WOTDUM2 -0.042 0.017 -2.419 0.024
MA(1) 0.913 0.051 17.875 0.000
MA(2) 0.994 0.173 5.735 0.000
Adjusted R-squared 0.702 Mean dependent var 0.404
S.E. of regression 0.070 F-statistic 11.085
Durbin-Watson stat 1.776 Prob(F-statistic) 0.000
4.5.1. VEC Analysis:
In any multiple variable analysis, the issue of endogeniety comes up. Clearly the variables
depend on each other. For example, WOT variables put pressure on Pakistan’s exchange rates
or Quantum Index of manufacturing other than effecting the level of exports. Further more
exchange rate depreciation effects manufacturng sector by putting down ward pressure on the
imports of inputs. For robust empirical estimations it is necessary to run a simultaneous
equation model. Since the data is time series, it is appropriate to use vector Autoregressive
model (VAR), which is an extension of univariate Autoregressive (AR) models to capture the
evolution and interdependencies between multiple time series. We treat all variables in a VAR
symmetrically by including an equation for each variable explaining its evolution based on its
own lags and the lags of other variables in the model. The number of equations in a VAR model
depends upon the number of endogenous variables; each endogenous variable is regressed on
its own lagged value, and the lagged values of all oither endogenous variables as well as any
number of exogenous variables. This solves the problem of endogeniety among variables. In
this sense, VAR model is a seemingly unrelated regression (SUR) model with lagged variables
and/or deterministic terms as common regressors so that one can interpret the regression
results for each equation as ordinary least square estimators.
However if the time series variables have unit root a simple VAR analysis cannot be run. Table
4.7 shows that all variables have unit root and are stationary at first difference only. In presence

of unit root, we move to vector error correction model (VECM) where relationship between
unit root variables can exist if they are cointegrated.
Table 4.7. Augmented Dickey Fuller Test for Unit Roots
Variable Coefficient T-statistics
DExports (-1) -1.245 -4.075***
DQIM (-1) -0.906 -3.402***
DExchange (-1) -0.477 -2.430**
DOECDgdp (-1) -0.968 -3.479***
DIncidents (-1) -1.244 -4.251***
DIntensity (-1) -1.362 -5.7888***
Where ***, **, * represents significance at 1%, 5% and 10% levels respectively.
The estimated form of the cointegrating equation with trend which also refers to long term β’
coefficients is as follows:
�������� � ���� � ���������� � ��������� � ����� � ����� ! 0
Alternatively the estimated equation can be written as follows
�������� ! # ���� # ���������� # ��������� # ����� # �����
Where Exports is exports of Pakistan in US dollars term, QIM is quantum index of
manufacturing, Exchange is exchange rate of Pakistan in terms of Pakistan rupees, OECDgdp is
gdp of OECD countries in terms of dollars, and Trend is the trend variable, whereas WOT
represents war on terror proxies (Number of incidence, Killed, Injured or Intensity).
Table 4.8 provides results for Incidents. Both Quantum Index of Manufacturing and Incidents
are insignificant in column 1. Figures 4.7-4.8 provides the clue for selecting optimal lag orders
for the variables to achieve significance. Both figures below are impulse response functions of
Incidents on Exports and QIM. Figure 4.7 shows that upto 2 lags there is positive relationship
between exports and number of Incidents. Exports start to decline only after the second month
as a response to a terrorist attack. Column 2 of table 4.8 provides results with Incidents
regressed at 2 lags. Now there is a significant and negative relationship between Exports and
Incidents. However QIM now enters the equation significantly but with a wrong sign.
Figure 4.8 reveals the possible reason behind this observation. There is a strong correlation
between Incidents and QIM from 2nd month of impact to 5th month. Only after the 5th month
the correlation subside down. The spurious results for QIM in column 2 of table 8 may be due
to this correlation. Extending the lag of Incidents to 5 (see column 3 of table 4.8) solves the
problem. All variables are significantly related with Exports and with right signs. Another
important observation that can be made in table 8 is that OECD gdp has the highest impact on

Pakistan’s export potential. We know that Europe and USA are one of Pakistan’s top exporting
destinations thus their economic performance effects Pakistan’s exporting capabilities.
Table 4.8. Long Run Relationship (β’s) for VEC with Incidents
Endogenous Dependent Variable : Exports
Endogenous
Independent
Variables
Minus β’s
1 2 3
QIM (-1) -0.0019 -0.0049 0.018
(-1.26) (-3.97)*** (3.93)***
Exchange (-1) 0.033 0.0103 0.028
(4.00)*** (1.84)* (2.33)***
OECDgdp (-1) 0.414 0.252 0.522
(6.78)*** (6.58)*** (4.99)***
Incidents (-1) -0.001
(-1.18)
Incidents (-2) -0.007
(-7.44)***
Incidents (-5) -0.017
(-3.13)***
trend -0.018 0.010 0.033
(-2.75)*** (2.07)** (2.09)**
VEC (p) (1) (1) (1)
***, **, * represents significance at 1%, 5% and 10% respectively, VEC(p) represents
the co integration order.

-0.030
-0.025
-0.020
-0.015
-0.010
-0.005
0.000
1 2 3 4 5 6 7 8 9 10
Response of EXPORTS to One S.D. KILLED Innov ation
-8
-6
-4
-2
0
1 2 3 4 5 6 7 8 9 10
Response of QIM to One S.D. KILLED Innovation
-5
-4
-3
-2
-1
0
1 2 3 4 5 6 7 8 9 10
Response of QIM to One S.D. INJURED Innovation
-0.004
-0.002
0.000
0.002
0.004
0.006
0.008
0.010
1 2 3 4 5 6 7 8 9 10
Response of EXPORTS to One S.D. INJURED Innov ation
-0.025
-0.020
-0.015
-0.010
-0.005
0.000
1 2 3 4 5 6 7 8 9 10
Response of EXPORTS to One S.D. INTENSITY Innov at ion
-6
-5
-4
-3
-2
-1
0
1 2 3 4 5 6 7 8 9 10
Response of QIM to One S.D. INTENSITY Innovation
0.000
0.005
0.010
0.015
0.020
1 2 3 4 5 6 7 8 9 10
Response of EXPORTS to One S.D. INCIDENTS Innovation
-4
-3
-2
-1
0
1
1 2 3 4 5 6 7 8 9 10
Response of QIM to One S.D. INCIDENTS Innovation
Figure: 4.7-4. 14

Similar VEC regressions are carried out for Killed, Injured and Intensity and the results are
provided in table 4.9 (see Appendix-2). Impulse response function helps to provide guidance
for the choice of optimal lag length for these WOT variables. For example, column 3 in table 4.9
provides results for Killed with lag 1. All variables except QIM have right signs and are
significant. Figure 10 suggests that correlation between QIM and Killed subside down at lag 3.
For Killed (-3), in column 4 of table 9, the results show that all variables have right signs with
QIM now positively and significantly related with Exports. Figure 4.11 suggests that number of
injured from a terrorist attack decrease exports after the 2nd year while figure 4.12 shows that
correlation between QIM and Injured subside down at lag 5. Table 4.9 gives results for Injured
at lags 1, 2, and 5, For lags 1 and 2 Injured is negatively and significantly related with Exports
fitting our model expectations. The last columns 9 and 10 of table 4.9 give results for Intensity.
Though QIM comes out with the wrong sign, all other variables including Intensity are
significant with right signs. Impulse response functions carried out in figure 4.13 also suggests
that Intensity is negatively related with Exports. Furthermore there are no lags involved for
both Intensity and Killed for their negative effects on Exports suggesting that number of
casualties in a terrorist attack defines the intensity of the incident more than injured and
Pakistan’s exports are most sensitive to those incidents in the conflict where casualties are
higher. These are expected results because casualties in an incident identify the brutal and
destructive methods of terrorists that they employ in the conflict where incidents are
dominated by suicide attacks.
Once we have obtained the coefficients for our WOT variables, we quantify the effects of the
conflict on exports. As noted in table 4.9, we run multiple regressions for each WOT variable
based on optimal lags. These WOT coefficients are averaged out and then multiplied with their
respective monthly average scores and export mean to calculate dollar cost per month of the
conflict. Table 4.10, column 4, provides costs for each variable. Numbers of incidence have the
highest cost at 815 million dollars a month where as for other variables, average costs range
from 400 to 500 million dollars a month. While the average cost of all these variables comes
out to be 564 million dollar a month. We know that average exports of Pakistan each month
are worth 1500 million dollars for 2006 to 2009. Our results suggest that Pakistan’s exports are
short of 500 million dollar each month since WOT has been intensified in 2006. Over all, the
yearly losses amount to 6 billion dollars. This is a staggering figure. We know from our earlier
discussion that Pakistan’s export growth steeply plummeted during the period of the conflict.
Please remember that the costs are averaged out on monthly basis. Column 5, table 4.10 also
calculates per unit costs. Each terrorist incidence lead to 12 million dollar less exports for
Pakistan. Similarly each person killed in the terrorist attack costs Pakistan 3.4 million dollar
worth of exports while each injured person costs 1.4 million dollars. The per month overall loss
of 500 million dollar comes to the better context when we note that on average terrorist
attacks claim 158 lives a month while any given day there are at least two attacks. By any
means this makes up for a high intensity conflict that has sever implications for the local
industry of Pakistan and its exporting capacity.

Table 4.10: Costs of War on Terror (2006-2009)
WOT
Variables
Average
Coefficients
Average
Monthly
Score for
WOT
Variables
Export Mean
(million $)
Per Month
Cost of the
Conflict
(million $)
Per Unit
Cost
(million $)
1 2 3 4=1*2*3 5=1*3
Incidence 0.008 65.61 1492 815.75 12.0
Killed 0.002 157.67 1492 541.06 3.4
Injured 0.001 333.69 1492 497.86 1.4
Intensity 0.039 6.949205 1492 404.36
AVERAGE
Cost: 564.75
Pakistan’s neighboring countries like India and China have been witnessing a steady increase in
their exports since 2005 when both countries were exporting 761 billion and 100 billion worth
of goods and services respectively. By 2009 the exports for both countries nearly doubled and
now stand at 1.2 trillion dollars and 176 billion dollars. In comparison Pakistan could only
witness a modest growth in its exports for the same period from 16 billion dollars to only 17
billion dollars. Assuming that Pakistan followed half good a similar trend in its export growth as
its neighbors; today by any modest estimates Pakistan’s exports would stand at 24 billion
dollars. There is a deficit of 7 billion dollars only for 2009. Had Pakistan maintained its share of
0.2 % in world exports, Pakistan total gain for last 3 years amounts to nearly 30 billion dollars
that is lost due to its falling shares. Our analysis suggest that a significant portion of this loss
can be explained through the costs Pakistani exports have incurred due to war on terror where
the approximate loss for last 3 years is around 18 billion dollars amounting to half of Pakistan’s
over all losses in exports.
For the sample period, there are 2 terrorist attacks every day, whereas on average 5 citizens
die in these attacks. A single terrorist attack on average costs 12 million dollars and each
casualty in the conflict costs 3 million dollars in fewer exports. For the intensification period
post 2008, the figures get more pronounced. For example the number of terrorist attacks and
casualties increase to 3 and 10, with average losses rising to nearly 800 million dollars a month.

5. Conclusions
Pakistan’s economy has been underperforming since 2007. Inflationary trends are rising with
peaks up to 20%. GDP growth rate has gone down to 2% in 2009. FDI has decreased
significantly. Local investors are rushing abroad and investing in countries like Bangladesh. The
government is left with no option but to curtail development expenditures amid high fiscal
deficits and falling tax revenues. Public sector development plans are under utilized because
government has failed to release funds affecting many infrastructure projects much needed for
growing population.
There is a lot of academic interest to understand the causes. One cause shared by Pakistan
with rest of the world is the looming global recession that has caught many a countries.
However looking at South Asian region, one realizes that countries like India, China and
Bangladesh have continued with their economic progress unabated. Pakistan’s economic woes
also have an indigenous dimension. One salient factor is the continuation of war on terror that
has taken a bloody turn since 2007 where there has been a phenomenal rise in terrorist attacks
within Pakistani borders affecting all major cities of the country. War on terror that has
converted into a low intensity conflict within Pakistan has lead to capital flight and political
instability and causing insecurity among private and public agencies with unfavorable
economic and social outcomes. Despite falling resources, Pakistan’s security related
expenditures have ballooned. Hundreds of billions are additionally spent on domestic security
forces like police to equip them with modern technology needed to handle terrorist threats
nationwide. Pakistan is only second to SriLanka where business costs of terrorism are the
highest in South Asia. Pakistan also precedes India, Bangladesh and China in the intensity and
incidence of violence. Currently militancy related casualties are highest for Pakistan within the
region.
Though a larger economic analysis on the costs of WOT is necessary to understand its overall
effect on Pakistan, we restrict our analysis to the exporting sector of Pakistan in this report and
investigate the effects of WOT post 2007.
Export performance of Pakistan’s important sectors has been deteriorating rapidly since 2007.
For example leather and textiles sector witnessed decline in exports due to deterioration in law
and order in Balochistan affecting the supply of raw materials.
The logistics costs have increased due to attacks on transportations raising insurance and
freight rates. There is also an increased movement of transport destined for NATO/ISAF forces
in Afghanistan causing overall rise in transportation costs as transport is becoming increasingly
unavailable for conventional trade. Internationally, freight charges have been following but
Pakistan is trending opposite due to higher risks of delays insured by freight forwarders by
charging higher overheads. With regular incidents of terrorism, inland transit insurance charges
are fluctuating upwards.

Outside buyers are reluctant to place orders to Pakistani businessmen due to the uncertainty
and risk of delays. Pakistani post is already congested due to Afghan bound cargo related
mostly of NATO/ISAF forces in Afghanistan. Terrorist attacks lead to halt in business activity
leading to a rush afterwards causing delay in movement of goods to the ports for export.
Foreign imports do not come to Pakistan to place orders because their travel advisories
prevent then to travel. Even if they are willing to travel, their insurance policies do not cover
travel for Pakistan anymore due to high risks. A major trade fair arranged by TDAP namely
EXPO 2010 failed to attract international buyers and exhibitors suggesting significant affects on
Pakistan’s export promotion capabilities. Pakistani business travelers are also faced with more
stringent visa requirements undermining their efforts to market their products internationally.
Overall one may agree that WOT has significantly affected Pakistani exports. The report carries
out regression analysis where variables like global recession, exchange rate fluctuations are
taken into account while examining the effects of WOT on Pakistani exports.
This report defines WOT through its outcomes. For example number terrorist attacks and
people killed and injured in these attacks represent the conflict as well its intensity.
The analysis finds that WOT can be divided into three distinct periods. The LAL Masjid incident
in mid 2007 marks the first sign of intensification of WOT. The second one is the assassination
of Benazir Bhutto. The third one comes in 2008 when the US announced to shift gear from Iraq
to Afghanistan and incumbent government in Pakistan created a political support for armed
action within Pakistani borders against the terrorists. The analysis finds that WOT has more
significant affect on Pakistani exports post Benazir assassination.
The report finally calculates the monthly and daily costs of WOT. On average there are 2
terrorist attacks every day whereas 5 citizens on average die in these attacks. A single terrorist
attacks costs 12 million dollars to the exports. Post Benazir assassination the costs rise to 18
million dollars due to increased intensity where not only the death toll on average has risen but
the number of terrorist attacks have gone up too. Average per month loss in exports due to
terrorism is calculated to be around 500 million dollars.
Pakistan during 2006-2009 has lost nearly 30 billion dollars in exports as its market shares have
fallen. Part of this loss is explained by WOT, where we calculate that 18 billion dollar accounts
for it.

References:
Becker, Gary S. and Kevin Murphey (2001) ‘Prosperity will rise out of Ashed’ Wall Street
Journal, October 29.
Bram, Jason, Andrew Haughwout and James Orr (2002) ‘Has Spetember 11 Affected New York
City’s Growth Potential? Federal Reserve Bank of New York Economic Policy Review 8(2), pp.81-
96
Collier, P. (1999)’On the economic consequences of Civil War’ Oxford Economic Papers 5,
pp168-83
Drakos, K. and A. M. Kutan (2003) ‘Regional Effects of Terrorim on Tourism in Three
Mediterranean Countries’ Journal of Conflict Resolution 47 (5), pp. 621-641
Easterly W. and P. Livine (1997) ‘Africa’s growth tragedy’ Quarterly Economic Review CXII, pp
1203-1250
Enders, W. and T. Sandler (2996) ‘Terrorism and Foreign Direct Investment in Spain and
Greece’. Kyklos 49(3), pp. 331-352
Enders, W. and T. Sandler (1991) ‘Causality between Transnational Terrorism and Tourism: The
case of Spain’ Terrorism 14(1), pp. 49-58
Enders, W., T. Sandler and G.F. Parise (1992) ‘An Econometric Analysis of the Impact of
Terrorim on Tourim’ Kyklos 45(4), pp. 531-554
Fleischer, A. and S. Buccola (2002) ‘War, Terror and the Tourism Market in Israel’ Applied
Economics 34(11), pp. 1335-1343
Frey, Bruno F. and Luechinger, S. (2003) ‘How to Fight Terrorism: Alternatives to Deterrence’
Defence and Peace Economics, 14(4), pp. 237-249
Ito, H. and D. Lee (2004) ‘Assessing the Impact of the September 11 terrorist Attacks on U.S.
Airline Demand’, Journal of Economics and Business
Knight M., N. Loayza and D. Villanueva (1996) ‘The Peace dividend: military spending cuts and
economic growth’, IMF Staff Papers, Vol.43, pp. 1-37
Krueger, Alan B., and J. Maleckova (2003) ‘Education, Poverty and Terrorism: Is There a Causal
Connection?’ Journal of Economic Perspectives, 17(4), pp. 119-144
Navarro, Peter and Aron Spencer (2001) ‘September 2001: Assessing the Cost of Terrorim’
Milken Institute Review 2, pp. 16-31

Nisha, A., J. Sisira and K. Saman (2001) ‘The economic cost of the war in Srilanka’ World
Development, 29 (9), pp. 1483-1500
Nitsch, V. and D. Schumacher (2004) ‘Terrroism and International Trade: An Empirical
Investigation’ European Journal of Political Economy 20(2), pp. 423-433
Sachs J.D. and A. Warner (1995) ‘Economic reform and the Process of Global Integration,’
Brookings Papers in Economic Activity, 25th Anniversary Issue.
Sloboda, B. W. (2003) ‘Assessing the Effects of Terrorism on Tourism by Use of Time Series
Methods’. Tourism Economics 9(2), pp. 179-190

Appendix A.1
Table 1.6. Suicide Attacks in 2009
Date Place Target
NWFP
4 January D.I. khan Policemen and government collage
23 January Swat Check post
5 February Mingora , Swat Police station
9 February Bannu Police and FC check post
20 february D.I.Khan Funeral Procession of the care taker of an
Imambargah (mosque of Shia community)
23 February Bannu DSP office
11 march Peshawar ANP minister Bashir Bilour
26 March Jandola Tank Peace community of Turkistan
30 March Bannu Army convoy
15 April Charsadda Police check post
18 April Hangu Army check point and convoy
5 May Bera Qadeem, Peshawar FC check post
11 May Dera Adam Khel, Kohat FC check post
21 May Jandola Tank FC fort
28 May Matni, Peshawar Police check post
28 May D.I.Khan Security check post
5 June Dir Upper Friday prayers in a mosque
9 June Peshawar PC hotel
11 June Peshawar Police
12 June Nowshera Military mosque
22 June Battgram, Mardan Police check post
25 July Laki Marwat Police convoy
15 August Khwazakhela, Swat Check post
22 August Kanju, Swat Security forces
23 August Momin Town, Peshawar Ansar-ul-Islam leader’s house
30 August Mingora Swat Police training
12 September Doaba, Hangu Police station
18 September Kohat Shia community
19 Spetember Dara Adam Khel, Kohat Security check post
26 September Sadar, Peshawar Askari bank
26 September Bannu Police station
28 September Bannu Leader of a peace community
9 October Khyber bazaar, Peshawar Civilian
12 October Shangla Army convoy
15 October Kohat Police station
16 October Peshawar CIA office
28 October Pepal-mandi, Peshawar Civilian
3 November Lachi, Kohat PF firing range building
8 November Cattle market in Adezai area, Peshawar Civilian
9 November Ring road, Peshawar Police
10 November Farooq-i-Azam Chowk, Charsadda Civilian
13 November Khyber road, Peshawar ISI’s regional headquarters
13 november Bakakhel, Bannu Police station
14 November Pishtakhara intersection, Peshawar Police check post
16 November Peshawar Police station
19 November Peshawar Judicial complex
1 December Kabal, Swat Awami National party’s (ANP) provincial meeting
7 December Peshawar Session court

17 December Isakhel village, Lakki Marwat District Nazim’s hujra
18 December Timergara, Lower Dir Police lines mosque
22 December Peshawar Press club
24 December Arbab road, Sadar, Peshawar Police check post
Tribal Areas
6 February Jamrud, Khyber Agency NATO supply trucks
12 February Landi Kotal Charbagh
27 March Jamrud, Khyber Agency Mosque? Friday prayers and Khasadar force
4 April Miranshah, North Waziristan Security Forces’ convoy
28 July Miranshah, North Waziristan Khasadar check post
18 August Miranshah, North Waziristan Security check post
27 August Torkham, Khyber Agency Khasadar security post
Balochistan
2 March Killi Karbala Pashin JUI (F) provincial leadership
30 june Qalat NATO containers
Punjab
5 February D.G Khan Procession at Imambargah
16 March Pirwadhai, Rawal pindi Civilain
5 April Chawal Imamabargah
27 May Lahore Police/ ISI
12 june Lahore Dr. Sarfraz Naeemi
2 July Choorh Chowk, Rawalpindi Bus of Kahuta Research Laboratory (KRL)
23 October Kamra, Attock Pakistan Airforce (PAF) Complex
24 October Lillah, Kalarkahar, Rawalpindi Officer of an Intelligence agency
2 November Babu Sabu interchange, Lahore Check post
4 December Parade lane, Rawalpindi Army Mosque
7 December Moon market Iqbal town, Lahore (two attacks) Civilian
8 December Bela Qasim Cantonment area, Multan ISI building
15 December Khosa market, D.G. Khan Senior Adviser to Punjab Chief Minister
Sindh/ Karachi
27 December Orangi Town, Karachi Muharram Procession
Azad Kashmir
26 June Muzaffarabad Army Barracks
27 December Muzaffarabad Muharram procession
Islamabad
23 March Sitara Market, Islamabad Police station
4 April Margala Road, E-7, Islamabad FC check post
6 June G-8/4, Islamabad Rescue 15
5 October F-7, islamabad UNWFP office
20 October H-10, Islamabad (two attacks) International Islamic University
2 December E-8 Sector, Islamabad Pakistan naval Complex
24 December Shakrial, Islamabad Imamabargah

Appendix A.2
Table 4.5.
Dependent Variable: LOG(TEXPT)
Method: Least Squares
Sample (adjusted): 2007M01 2009M06
Included observations: 30 after adjustments
Variable Coefficient Std. Error t-Statistic Prob.
C -30.639 10.014 -3.060 0.007
LOG(XCHNGRT) 0.518 0.391 1.325 0.204
LOG(QIM) 1.537 0.455 3.377 0.004
LOG(LGOECDGDP) 5.977 2.266 2.638 0.018
LOG(INCDNTS) 0.076 0.061 1.250 0.229
LOG(INCDNTS(-1)) 0.057 0.041 1.417 0.176
LOG(INCDNTS(-2)) 0.018 0.059 0.298 0.770
LOG(INCDNTS(-3)) 0.016 0.058 0.278 0.785
LOG(INCDNTS(-4)) -0.014 0.059 -0.245 0.809
LOG(INCDNTS(-5)) -0.042 0.046 -0.920 0.371
LOG(INCDNTS(-6)) -0.157 0.069 -2.263 0.038
DUM1208 -0.037 0.051 -0.723 0.480
MA(1) 0.499 0.069 7.223 0.000
MA(2) 0.995 0.099 10.028 0.000
Adjusted R-squared 0.748 Mean dependent var 0.404
S.E. of regression 0.065 F-statistic 7.630
Durbin-Watson stat 1.716 Prob(F-statistic) 0.000

Table 4.6.
Dependent Variable: LOG(TEXPT)
Method: Least Squares
Sample (adjusted): 2007M01 2009M06
Included observations: 30 after adjustments
Variable Coefficient Std. Error t-Statistic Prob.
C -24.076 9.975 -2.414 0.028
LOG(XCHNGRT) 0.432 0.388 1.114 0.282
LOG(QIM) 0.887 0.319 2.781 0.013
LOG(LGOECDGDP) 5.198 2.472 2.103 0.052
LOG(INTENSITY) -0.048 0.036 -1.330 0.202
LOG(INTENSITY(-1)) 0.018 0.028 0.652 0.524
LOG(INTENSITY(-2)) -0.023 0.033 -0.703 0.492
LOG(INTENSITY(-3)) -0.015 0.030 -0.509 0.618
LOG(INTENSITY(-4)) -0.018 0.029 -0.599 0.558
LOG(INTENSITY(-5)) -0.003 0.022 -0.127 0.900
LOG(INTENSITY(-6)) -0.013 0.024 -0.533 0.602
DUM0809 0.039 0.050 0.787 0.443
MA(1) 1.034 0.053 19.666 0.000
MA(2) 0.995 0.097 10.224 0.000
Adjusted R-squared 0.733 Mean dependent var 0.404
S.E. of regression 0.067 F-statistic 7.123
Durbin-Watson stat 2.236 Prob (F-statistic) 0.000

Table 4.9: Long Run Relationship (β’s) for VEC with Killed, Injured and Intensity
Endogenous Dependent Variable : Exports
Endogenous
Independent
Variables
Minus β’s
4 5 6 7 8 9 10
QIM (-1)
-0.002
0.0064
-0.002
-0.005
0.096
-0.0014
-0.0003
(-2.00)** (1.82)* (1.79)* (-2.37)** (0.31) (-1.54) (0.19)
Exchange (-1) 0.028 0.197 0.038 0.091 -1.29 0.028 0.070
(5.72)*** (2.29)** (6.35)*** (5.55)*** (-0.28) (6.11)*** (5.02)***
OECDgdp (-1) 0.395 2.02 0.455 1.025 -10.408 0.431 0.921
(10.37)*** (2.41)*** (9.92)*** (6.39)*** (-0.28) (11.66)*** (6.039)***
Killed (-1) -0.0006
(-7.24)***
Killed (-3) -0.004
(-2.106)**
Injured (-1) -0.0002
(-3.31)*** Injured (-2) -0.001
(-5.13)*** Injured (-5) -0.002
(-0.29) Intensity (-1) -0.021
(-8.01)***
Intensity (-3) -0.057
(4.56)***
trend -0.013 -0.063 -0.020 -0.029 0.77 -0.012 -0.021
(-3.98)*** (-2.16)** (-4.88)*** (-4.38)*** (0.29) (4.21)*** (0.006)
VAR (p) (1) (1) (1) (1) (1) (1) (1)
***, **, * represents significance at 1%, 5% and 10% respectively, VEC(p) represents the co integration order.