pair-wise, list-wise, and clustering apporaches · web viewcronbach alpha for each approach is:...
TRANSCRIPT
1
A comparison of pair-wise, list-wise, and clustering approaches
for eliciting structural knowledge
Roy B. Clariana, College of Education, Penn State University
Patricia Wallace, School of Business, The College of New Jersey
Editorial Contact:
Roy B. Clariana
Associate Professor of Education
The Pennsylvania State University
30 E Swedesford Road
Malvern, PA 19355
phone: 610-648-3253
email: [email protected]
Accepted for publication on November 2, 2006 in
International Journal of Instructional Media 36 (3), in press.

2
A comparison of pair-wise, list-wise, and clustering approaches
for eliciting structural knowledge
Abstract
The Pathfinder network technique using multiple pair-wise similarity ratings of terms
is a well established method for eliciting, representing, and comparing the structural
knowledge of individuals and of groups. However, the pair-wise approach becomes
unwieldy when the number of comparison terms is large, for example, for more than
30 terms. This experimental investigation considers two alternate approaches for
eliciting proximity data, list wise and clustering, which require substantially less time
to complete. Undergraduate students (n = 84) in an introductory business course
completed the three approaches after taking the final examination for the course.
Results indicate that the three approaches are related but differently sensitive to
structural knowledge. The pair-wise approach was most sensitive to nonlinear content
organization while the list-wise approach was relatively most sensitive to its linear
organization. The clustering and list-wise average raw proximity data were most alike
(r = 0.81) while clustering and pair-wise were less alike (r = 0.68). For averaged
PFNet data, the pair-wise and list-wise were most alike (71% links in common),
while the pair-wise and cluster were relatively least alike (57% links in common).
These findings suggest that the list-wise and clustering approaches complement the
pair-wise approach for eliciting structural knowledge.
3
A comparison of pair-wise, list-wise, and clustering approaches
for eliciting structural knowledge
Classroom assessment often focuses on declarative content knowledge and sometimes on
procedural knowledge. Jonassen, Beissner, and Yacci (1993) have proposed a separate type of
knowledge called structural knowledge that may be intermediate between declarative and
procedural knowledge, or that is a distinct dimension of declarative knowledge. Structural
knowledge refers to the tacit and explicit associations between concepts in memory (or the lack
of such relations) that allow for fluency in cognitive activity. For example, as students learn a
discipline, their structural knowledge of the field becomes more coherent and more like that of
an expert (Goldsmith, Johnson, & Acton, 1991; Schvaneveldt, Durso, Goldsmith, Breen, &
Cooke, 1985; Schoenfeld & Herrmann, 1982; Shavelson, 1972). For many reasons, such as the
relationship between expertise in a domain and structural knowledge, it seems important to
assess students’ structural knowledge as a part of and complement to regular classroom
assessment and evaluation.
The Pathfinder technique is a well established method for measuring structural
knowledge in research settings (Jonassen et al., 1993). The Pathfinder technique uses a data
reduction approach to form network representations (PFNets) of a matrix of proximity data in
which concepts are represented as nodes, and relationships as unlabeled links connecting the
nodes. PFNets visually resemble concept maps, but without linking terms. The Pathfinder
technique was intentionally designed to measure knowledge structure, and has been applied in
various ways such as predicting course performance, comparing individuals to groups,

4
representing group consensus, predicting combat pilot performance, and for comparing naïve,
novice, intermediate, and expert computer programmers (Villachica, 2000).
The Pathfinder Network Technique
The Pathfinder technique for measuring knowledge structure has three steps. In Step 1,
raw proximity data is collected typically using a pair-wise word-relatedness judgment task.
Participants are shown a set of terms two at a time, and judge the relatedness of each pair of terms
on a scale from low to high. The number of pair-wise comparisons that participants make is equal
to (n2 – n)/2; n is the number of terms in the list. In Step 2, a software tool such as Knowledge
Network and Orientation Tool for the Personal Computer (KNOT, 1998) is used to calculate the
PFNet representation. KNOT reduces the raw proximity data to a least-weighted path that links
all of the terms. The algorithm for calculating the least-weighted path can be modified by
adjusting two parameters, q and r. As q and r increase, the number of links in the resulting PFNet
usually decrease (refer to Dearholt & Schvaneveldt, 1990). The resulting PFNet represents the
most salient relationships in the raw proximity data. In Step 3, the similarity of the participant’s
PFNet to a referent PFNet is calculated. KNOT software provides several measures of similarity
that are described in more detail later.
The pair-wise rating approach in Step 1 can be problematic in a classroom setting
because the number of pair-wise comparisons that students must make quickly becomes
unwieldy as the number of terms involved increases. For example, 5 terms require participants to
consider 10 comparisons, 15 terms requires 105 comparisons, while 30 terms requires 435
comparisons. Thus, this approach becomes impractical when many terms are used.
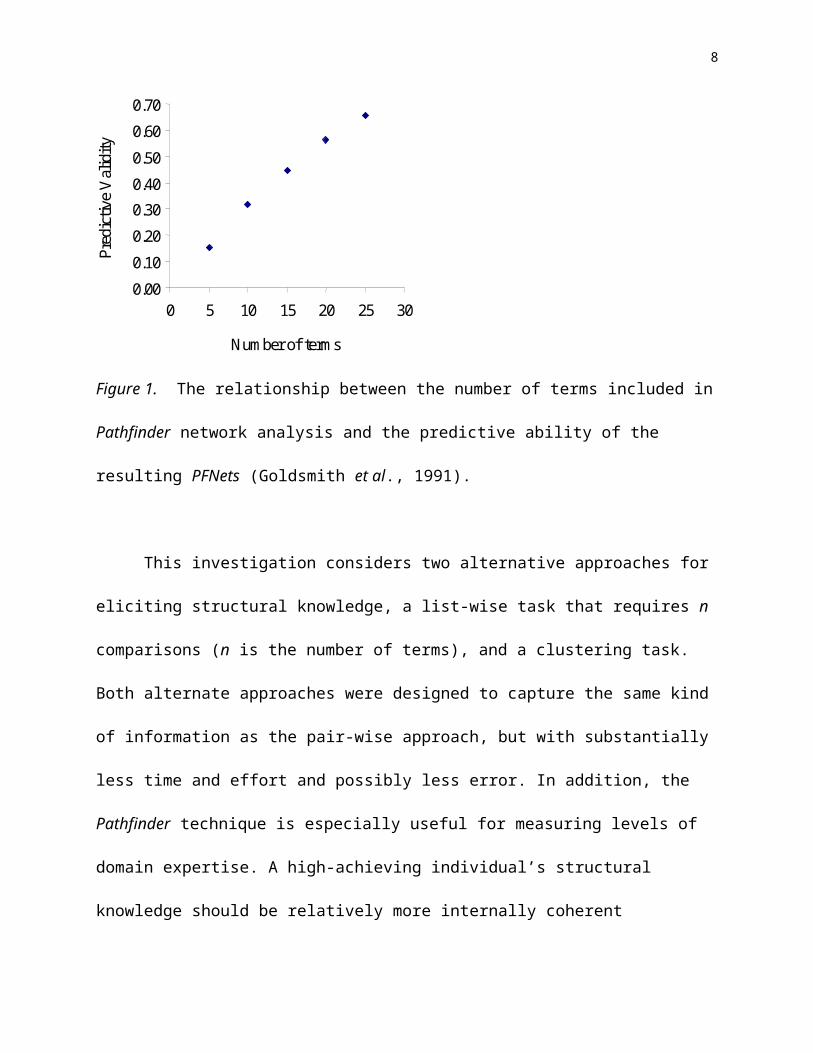
On the other hand, Goldsmith et al. (1991) have shown experimentally that increasing the
number of terms used in the pair-wise rating task increases the predictive validity of the resulting
5
PFNets with domain performance measures (e.g., final course grades) in a nearly linear way (see
Figure 1). This premise is consistent with the traditional test heuristic that more test items are
usually better than fewer items. These Goldsmith et al. findings suggest that more terms should
be used to elicit structural knowledge if the aim is to maximize the relationship of PFNet
measures of structural knowledge to other criterion measures.
Pred
ictiv
e V
alid
ity
0.00
0.10
0.20
0.300.40
0.50
0.60
0.70
0 5 10 15 20 25 30
Number of terms
Figure 1. The relationship between the number of terms included in Pathfinder network analysis
and the predictive ability of the resulting PFNets (Goldsmith et al., 1991).
This investigation considers two alternative approaches for eliciting structural
knowledge, a list-wise task that requires n comparisons (n is the number of terms), and a
clustering task. Both alternate approaches were designed to capture the same kind of information
as the pair-wise approach, but with substantially less time and effort and possibly less error. In
addition, the Pathfinder technique is especially useful for measuring levels of domain expertise.
A high-achieving individual’s structural knowledge should be relatively more internally coherent
(Gaultieri, Fowlkes, & Ricci, 1996; Housner, Gomez, & Griffey, 1993; Stout, Salas, & Kraiger,
6
1997), more like other high-achieving students, and more like a domain expert than that of a low-
achieving individual (Schvaneveldt et al,, 1985; Schvaneveldt, Durso, & Dearholt, 1989;
Schvaneveldt, Beringer, Lamonica, Tucker, & Nance, 2000; Thompson, 1992; Villachia, Lohr,
Summers, Lowell, Roberts, Javeri, Hunt, Mahoney, & Conn, 2001). In this investigation,
participants are sorted into low- and high-achieving groups based on course final examination
performance in order to establish two contrasting groups that are likely to have different levels of
structural knowledge of the course content. By using this approach, the sensitivity of the list-wise
and clustering tasks for eliciting structural knowledge relative to the pair-wise approach can be
examined as one measure of criterion-related validity of these approaches.
Method
Participants
Four sections of the course, Business 100, Computer Fundamentals, consisting of 96
students were selected as a sample of convenience for this investigation. Twelve students were
deleted from the initial sample due to incomplete data, for a final sample size of 84, with 29
females and 55 males.
Instructional Setting
This course is the first computer course in the School of Business that students are advised
to complete in their freshman year. All four sections of the course included in this investigation
were taught by the same instructor. The course is designed to enhance computer literacy, and also
considers the importance of information and the impact of computers on work and society. The
course includes the fundamentals of a computer system, microcomputer concepts and usage,
operating systems, electronic communications, and applications such as using a spreadsheet

7
software program. Course assignments include researching topics using search engines,
designing a web page, and using spreadsheets to solve financial problems.
During the regularly scheduled examination week at the end of the semester, all students
completed the customary final examination for the course, and then participant volunteers also
completed computer-based measures of structural knowledge. The final examination for the
course consisted of a 100-item multiple-choice test that was comprehensive in scope. A median
split of the final examination score was used to establish low and high achievement groups. For
the low group (n = 41), the mean was 65.1% (sd = 8.2); and for the high group (n = 43), the
mean was 82.1% (sd = 4.1). KU-Mapper software (Clariana, 2003) was designed specifically for
this investigation to deliver the three approaches in a random order to each individual. For this
investigation, 15 terms were selected to be implemented in the KU-Mapper software. These
terms are the most important topics covered through the course and include in order of
instruction: (1) computer literacy, (2a) Internet, (2b) WWW, (3) applications, (4a) system unit,
(4b) CPU, (5) input, (6) output, (7) storage, (8) operating system, (9a) network, (9b)
communications, (10a) privacy, (10b) ergonomics, and (10c) ethics (Note: numbers represent
lesson delivery order, while letters represent order within a lesson.)
Pair-Wise Task
The KU-Mapper pair-wise task was designed for this investigation to integrate with
Pathfinder KNOT software. The task format and directions were adapted from the pair-wise
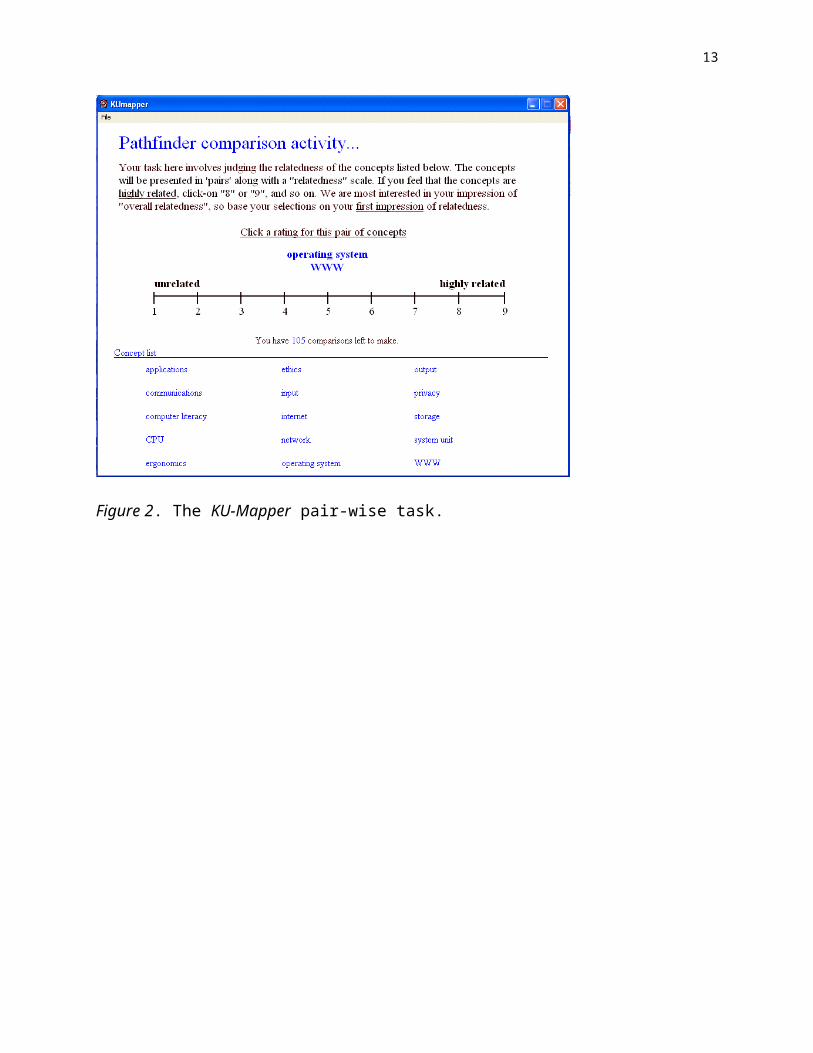
approach available within the KNOT software RATE program (see Figure 2). The directions on
each screen stated, “Your task here involves judging the relatedness of the concepts listed below.
The concepts will be presented in ‘pairs’ along with a ‘relatedness’ scale. If you feel that the
concepts are highly related, click-on “8” or “9”, and so on. We are most interested in your
8
impression of ‘overall relatedness’, so base your selections on your first impression of
relatedness.” Then, randomly selected pairs of terms were displayed in the middle of the screen,
and a statement on the screen said “Click a rating for this pair of concepts” on a scale from 1
(unrelated) to 9 (highly related). The 15 concept terms were displayed on the bottom of the
screen, and above the list was a progress indicator that stated “You have 105 comparisons left to
make.” The progress indicator decreased by one with each response. After the last pair-wise
comparison, the KU-Mapper software saves the data as a 105-element Pathfinder proximity
(prx) file.
Figure 2. The KU-Mapper pair-wise task.
9
List-Wise Task
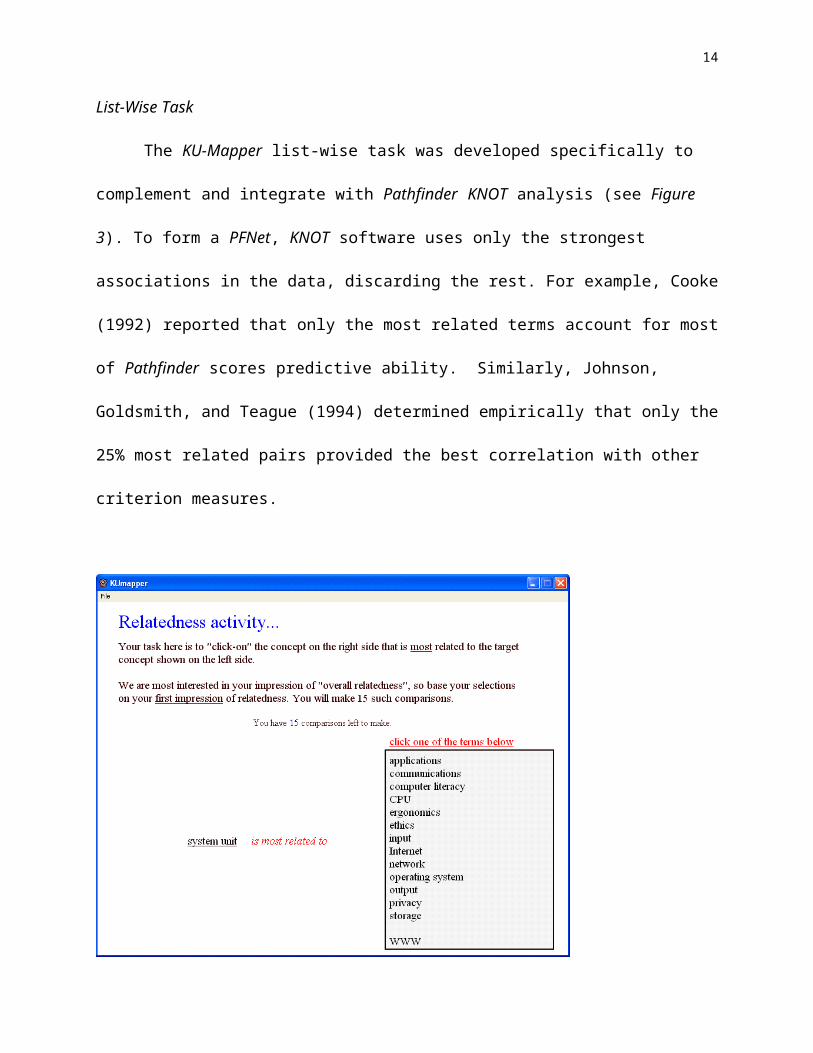
The KU-Mapper list-wise task was developed specifically to complement and integrate
with Pathfinder KNOT analysis (see Figure 3). To form a PFNet, KNOT software uses only the
strongest associations in the data, discarding the rest. For example, Cooke (1992) reported that
only the most related terms account for most of Pathfinder scores predictive ability. Similarly,
Johnson, Goldsmith, and Teague (1994) determined empirically that only the 25% most related
pairs provided the best correlation with other criterion measures.
Figure 3. The KU-Mapper list-wise task.
In the list-wise task, participants select the most related terms from a list. The directions
on the first screen stated, “Your task is to ‘click-on’ the concept on the right side that is most
related to the target concept shown on the left side. We are most interested in your impression of

10
‘overall relatedness’, so base your selections on your first impression of relatedness. You will
make 15 such comparisons.” Then, one randomly selected term is displayed on the left-hand side
of the screen, a statement in the middle of the screen said “is most related to”, and a list of terms
was displayed on the right-hand side of the screen in alphabetical order. A header above the list
stated, “click one of the terms below”. After selecting the most related term from the list, another
term was randomly displayed on the left-hand side and so on until all 15 terms had been used
exactly once.
The list-wise task software was designed so that “self-self” comparisons are not possible.
For example, if the term “system unit” is displayed on the left-hand side, then it is not displayed
on the right-hand side. The software also dynamically alters the right-hand list to exclude
previously associated terms. For example, if a participant has already selected “ethics” from the
list as being most related to “privacy”, then later when “ethics” is displayed on the left-hand side,
“privacy” will not appear as a choice on the right-hand side. In that case, rather than 14 terms
appearing on the list on the right-hand side, only 13 terms would be displayed.
The list-wise task software generates Pathfinder raw proximity data array files (prx) that
can be directly analyzed by KNOT software. These arrays contain 105 elements that represent
every possible pair-wise relationship between the terms, however the list-wise task arrays
contain only zeros (not related) and ones (related).
Clustering Task
Using closeness in visual space as a measure of semantic relationship has intuitive appeal
(Elman, 2004). Free clustering approaches such as card sorting (Dunn-Rankin, Knezek, Wallace,
& Zhang, 2004) have a long history as well as extensive experimental application (e.g.,
Vygotsky, described in Luria, 1979). During clustering, terms written on cards or postit™ notes
11
are moved closer together or further apart to indicate relationship and then the results are usually
tallied by hand. Also computer software can be used for the clustering task (Taricani & Clariana,
2006). Such software can easily convert geometric distances between terms on a computer screen
into precise distance proximity data that can be analyzed by Pathfinder KNOT.
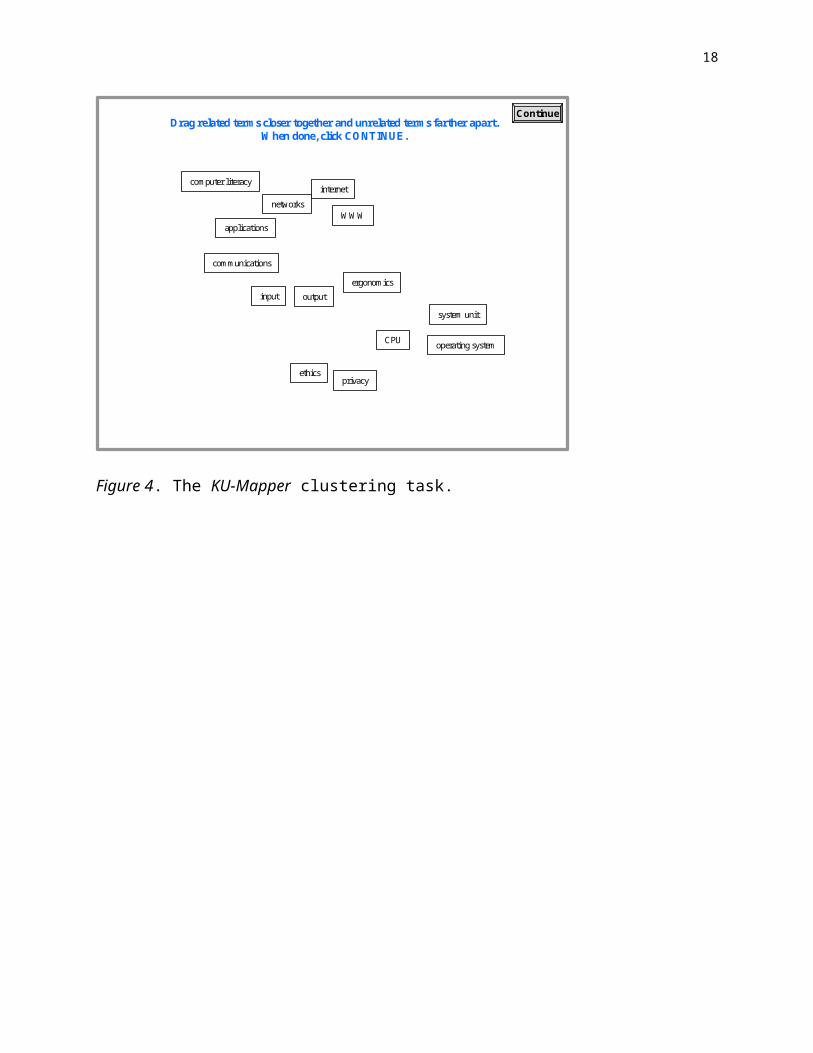
The KU-Mapper clustering task was designed for this investigation to integrate with
Pathfinder KNOT software. The clustering task used the same 15 terms as the pair-wise and list-
wise tasks. The 15 terms were randomly positioned on the screen and directions on the screen
stated, “Drag related terms closer together and unrelated terms further apart. When done, click
CONTINUE” (see Figure 4). On completion, the KU-Mapper software converted the distances
between terms on the screen, measured in screen pixels, into a 105-element proximity file (prx)
that can be directly analyzed by KNOT software.
computer literacyinternet
networks
applicationsWWW
communications
ergonomicsinput output
system unit
CPU operating system
privacyethics
Drag related terms closer together and unrelated terms farther apart.When done, click CONTINUE.
Continue
Figure 4. The KU-Mapper clustering task.
12
Linear and Nonlinear Referents
The similarity of participants’ PFNets are determined by comparing the participants’
PFNets to each other, and also by comparing these to logical external referent PFNets. In this
investigation, two external referent PFNets were established that describe the linear and the
nonlinear organization of the domain content. A linear referent was established by creating a
proximity array file containing “1”s to designate every possible valid link between serially
contiguous course concept terms. For example, the linear referent array contains a link between
term 1, “computer literacy”, and term 2a, “Internet”, and between term 2a, “Internet”, and term
2b, “WWW”, and so on. The linear referent has 14 links (1s) to describe the linear instructional
order of the 15 concept terms.
A nonlinear referent array was also created that shows links between the 15 concept
terms that are also appropriate links because the terms were the focus of contiguous lessons, but
have not already been represented in the linear referent array. For example, since the terms 2a
and 2b, “Internet” and “WWW”, were taught together in the same lesson, the nonlinear referent
array contains a link between terms 1 and 2b, “computer literacy” and “WWW”, to show valid
linkage between lessons 1 and 2. Other terms that were taught together in the same lesson
include terms 4a and 4b, “system unit” and “CPU”, terms 9a and 9b, “network” and
“communication”, and terms 10a, 10b, and 10c, “privacy”, “ergonomics”, and “ethics”. Using
this approach, the nonlinear referent has 11 links (1s) to describe all of the nonlinear
relationships of the 15 concept terms.
Converting Proximity Array Files into Posttest Scores
KNOT software was used to convert the participants’ pair-wise, list-wise, and clustering
raw proximity data into PFNets. The software requires several input parameters that are used to
13
describe the raw data and the desired analysis technique. In this investigation the following
parameters were used in all KNOT analyses, Minkowski’s r was set equal to infinity and q was
set to 14 (i.e., number of terms minus 1). In addition, the pair-wise proximity raw data was
defined as similarity data, the maximum value was set to 9, and the minimum value was set to 1.
For the list-wise proximity raw data, the data was defined as similarity data, the maximum value
was set to 1, and the minimum value was set to 0.1 (note, with this unusual data set, the
minimum must be set to a value slightly greater than 0, otherwise spurious links between terms
will occur). The clustering proximity raw data was defined as dissimilarity data, the maximum
value was set to 999, and the minimum value was set to 0.
After all of the PFNets were formed, KNOT software was used to calculate the
relationship of each of the participants’ three PFNets compared to the linear and the nonlinear
referents. KNOT software calculates a measure of the amount of relationship between two PFNets
called similarity (Goldsmith & Davenport, 1990). Similarity is calculated by dividing the number
of links in common by the number of unique links in the two PFNets. Similarity ranges from 0,
no structural similarity, to 1, complete structural similarity.
Raw Proximity Data Consistency
The internal consistency of the raw proximity data was determined using Cronbach alpha
and also using the coherence measure available within the KNOT software. Cronbach alpha for
each approach is: pair-wise .93, list-wise -0.22, and cluster .95. Cronbach alpha
for this data does not have its traditional interpretation. For the pair-wise approach, this high
alpha indicates that individuals tended to score all pairs within a narrow band of mainly high,
medium, or low values. For example, Student A used mainly 7s, 8s, and 9s, while Student B used
mainly 5s, 6s, and 7s. In the cluster approach, the high alpha value indicates that some students
14
clustered all 15 terms in a small space while other students clustered all 15 terms in a large space.
The negative value for alpha for the list-wise raw proximity data is not interpretable.
The coherence of a set of proximity data is based on the assumption that relatedness
between a pair of items can be predicted by the relations of the items to other items in the set,
called the indirect measure. Coherence is the Pearson product-moment correlation between the
raw proximity data and the indirect measure. Values lower the 0.20 indicate low coherence,
possibly due to random responses by the participants or error in entering the proximity data.
Previous investigations show a positive relationship between coherence and domain knowledge
(Gaultieri et al., 1996; Housner et al., 1993; Stout et al., 1997), so coherence data is presented
separately for the low- and high-achieving groups. For the pair-wise proximity raw data, the
mean coherence for the high-achieving group was X = .35 (sd = .20) and X =.26 (sd = .23) for the
low-achieving group (t-test not significant). For the list-wise proximity raw data, the mean
coherence for the high-achieving group was X = .16 (sd = .14) and X =.16 (sd = .18) for the low-
achieving group (t-test not significant). For the cluster proximity raw data, the mean coherence
for the high-achieving group was X = .94 (sd = .05) and X =.93 (sd = .04) for the low-achieving
group (t-test not significant). In addition, the coherence data of each of the three approaches were
correlated with final examination performance. None of the three approaches were significantly
related to examination performance (pair-wise r = .21, list-wise r = -.03, and cluster r = -.05).
Coherence data did not relate to domain knowledge in this investigation.
Results
The various types of data were analyzed in different ways. First, completion time data is
examined to determine if the list-wise and clustering approaches are substantially faster to
complete than the pair-wise approach. Next, PFNet similarity data (relative to the linear and
15
nonlinear referent) are analyzed for low- and high-achieving students to determine if the three
approaches are sensitive to differences in structural knowledge of the content organization.
Finally, descriptive analyses are applied to the raw proximity data and to the PFNet data to
determine the relatedness of the three approaches.
Time Data
The amount of time required to complete each approach, in seconds, was recorded by the
KU-Mapper software. For the pair-wise approach, X = 447.4 s (sd = 140.6), the maximum time
was 866.9 s and the minimum time was 152.2 s. For the list-wise approach, X = 193.3 s (sd =
79.6) with a maximum time of 586.9 s and a minimum time of 74.7 s. For the cluster approach, X
= 115.5 s (sd = 62.7), the maximum time was 397.8 s and the minimum time was 13.5 s. The
two alternate approaches did require less time than the pair-wise approach, however, considering
that the pair-wise approach required 105 comparisons (4.3 decisions per second) and the list-
wise approach only required 15 comparisons (12.9 decisions per second), the time savings,
though substantial, was not as great as expected.
PFNet Similarity Data
The PFNet similarity data (see Table 1) were analyzed by a 2 (Achievement: low and
high) x 2 (Organization: linear and nonlinear) x 3 (Format: pair-wise, list-wise, and cluster)
mixed ANOVA, the first is a between subjects factor and the second and third are within subjects
factors. For similarity data (see Table 2), Organization, F(1,82) = 333.796, MSe = 0.004, p
< .001, was highly significant, with the linear organization mean (X = 0.17) significantly greater
than the nonlinear organization mean (X = 0.07). In addition, the interaction of Organization and
Format was significant, F(1,82) = 4.369, MSe = 0.003, p = .04.
16
Table 1. PFNet similarity means (and standard deviations) for each approach.
Group Linear Nonlinearpair-wise
list-wise cluster
pair-wise
list-wise cluster
Low 0.16 0.18 0.16 0.08 0.07 0.07
(N = 41)(0.05
) (0.06) (0.07)(0.04
) (0.04) (0.04)
High 0.16 0.18 0.17 0.09 0.05 0.06
(N = 43)(0.05
) (0.06) (0.07)(0.04
) (0.03) (0.05)
Table 2. Mixed ANOVA analysis of PFNet similarity data.
Source SS df MS F Sig. 2Intercept 7.009 1 7.009 2829.776 < 0.001 .972Achievement (Ach) 0.000 1 0.000 0.071 0.790 .001
Error 0.203 82 0.002Within-Subjects ContrastsOrganization (Org) 1.173 1 1.173 333.796 < 0.001 ** .803Org x Ach 0.003 1 0.003 0.804 0.372 .010
Error (Org) 0.288 82 0.004
Format 0.002 1 0.002 0.577 0.450 .007Format x Ach 0.000 1 0.000 0.014 0.908 .002
Error (Format) 0.219 82 0.003
Org x Format 0.011 1 0.011 4.369 0.040 * .051Org x Format x Ach 0.004 1 0.004 1.386 0.243 .017
Error (Org * Format) 0.209 82 0.003* significant
Scheffe´ follow-up analysis of the significant Organization by Format interaction (see
Figure 4) shows that for linear similarity data, list-wise was greater than cluster and pair-wise (p
< .05). For the nonlinear data, pair-wise was greater than cluster and list-wise (p < .05). This
indicates that the list-wise approach tends to capture the linear organization of content relative to
the cluster and pair-wise approaches, while the pair-wise approach tends to capture the nonlinear
organization of content relative to the cluster and list-wise approaches.
17
Linear Nonlinear
.08
.16
.20
.12
.04
pair-wise
list-wisecluster
Sim
ilarit
y
Figure 4. The significant interaction of Organization and Format for PFNet similarity data.
Descriptive Analyses
Comparison of individuals’ raw proximity data
How similar are the individual participant’s raw proximity data arrays for the three
techniques? For example, if the participant places the terms “privacy” and “ethics” close together
in the clustering task (i.e., 30 pixels or less), did the participant also associate these two terms in
the list-wise task (i.e., a “1”) and in the pair-wise task (i.e., an “8” or “9”)? To determine this,
three correlation values were calculated for each student using the students’ three 105-element
raw proximity data arrays, a pair-wise by list-wise correlation (P x L), a pair-wise by cluster
correlation (P x C), and a list-wise by cluster correlation (L x C). For P x C and L x C, negative
correlations are expected since the cluster proximity raw data are dissimilarity data (e.g., smaller
value means stronger relationship), while the pair-wise and list-wise proximity raw data are
similarity data (e.g., larger value means stronger relationship). The average correlations for the
18
low- and high-achieving students, though small, are remarkably consistent for each of the three
comparisons (see left panel of Table 3).
Table 3. Relatedness correlations of individual and group average raw proximity data.
Group Individuals Group AverageP x L P x C L x C P x L P x C L x C
Low (n = 41) 0.31 -0.21 -0.30 0.68 -0.63 -0.79(.09) (.15) (.14) na na na
High (n = 43) 0.31 -0.25 -0.29 0.68 -0.67 -0.78(.16) (.19) (.13) na na na
P – pair-wise, L – list-wise, C – cluster
These low correlations for individual students’ raw proximity array data should not be
over-generalized to infer that the three techniques are not related. Goldsmith et al. (1991) point
out that “…although the proximity matrix itself can be thought of as a representation of domain
knowledge, these raw proximities are usually assumed to be ‘noisy’, and a better representation
that reflects the underlying organization of the data is often sought…” (p. 88). To further
consider this question, the raw proximity data were reanalyzed by averaging the proximity data
within each group and then comparing the three approaches by correlation of this averaged raw
data.
Comparison of group average raw proximity data arrays
One interesting feature of representing proximity data elements in arrays is that separate
arrays can be averaged together to obtain a “group average” representation (Ozgungor &
Guthrie, 2004). For example, representing how groups view content can inform instructional
decisions before, during, and after instruction. Also, this group average technique has been used
19
to show knowledge change from novice to expert. Besides providing a visual PFNet
representation of the group structural knowledge, averaging raw proximity data before KNOT
analysis has the advantage of reducing the influence of idiosyncratic responses as well as
removing error responses. Commonly occurring strong associations survive the averaging
process, while “uncommon” strong associations and all weak associations tend to average out.
The low- and the high-achieving participant’s raw proximity data arrays were separately
averaged together and then these three 105-element arrays were correlated together including a
pair-wise by list-wise correlation (P x L), a pair-wise by cluster correlation (P x C), and a list-
wise by cluster correlation (L x C). As with individual raw proximity data, the low- and high-
achieving groups obtained remarkably similar correlation values (see right panel of Table 3).
Also, the group average raw proximity data correlation values were considerably larger than
those observed for the individual raw proximity data.
Comparison of group average PFNet data
All of the previous analyses indicate no difference in structural knowledge for the low-
and high-achieving groups, so the following descriptive analysis of group average PFNet data is
conducted on the full sample. The group average pair-wise, list-wise, and cluster raw proximity
data were rendered into PFNets and then compared visually and numerically.
For example, note by visual inspection that the group pair-wise PFNet has 10 of 14 links
in common with the group list-wise PFNet (see Figure 5). Also observe that the lesson linear
structure, for example, the link between terms 5 and 6, “input” and “output”, provides a base or
“skeleton” in all three PFNets. However, the common network structure is more complex and
interesting than just a linear and nonlinear distinction. Specifically, there are similar links in the
three PFNets that are not part of the defined linear and nonlinear organization, for example,

20
terms 3 and 8, “operating system” and “applications”. An important conception in this course is
that certain software applications work under certain operating systems, and this link suggests
this conception. Also observe the difference between the cluster PFNet compared to the list-wise
and pair-wise PFNets. The terms taught in the same lesson, such as terms 2a and 2b and terms 4a
and 4b, form branches from the linear path of the list-wise and pair-wise PFNets
representations, but are within the linear flow of the cluster PFNet representation.
9a. network
9b. communication
2a. Internet
2b. www
10a. privacy
10c. ethics
1. computer literacy
3. applications
8. opsys
4b. CPU
4a. system unit7. storage
5. input
6. output 10b. ergonomics
9a. network
9b. communication
2a. Internet
2b. www10a. privacy
10c. ethics
1. computer literacy
3. applications
8. opsys
4b. CPU
4a. system unit
7. storage
5. input
6. output
10b. ergonomics
9a. network
9b. communication
2a. Internet2b. www
10a. privacy
10c. ethics
1. computer literacy
3. applications8. opsys4b. CPU
4a. system unit
7. storage5. input6. output
10b. ergonomics
Figure 5. PFNets derived from the pair-wise (left), list-wise (right), and cluster (bottom)
averaged raw proximity data.
21
The number of links in common between the averaged pair-wise, list-wise, and cluster
PFNets as well as with the linear and nonlinear referents shows substantial overlap for the three
approaches (see Table 4), similar to that observed for the averaged proximity raw data (see right
panel of Table 3). For example, the pair-wise and list-wise average PFNets have 71% links in
common (10 of 14). All three approaches are more like each other than they are like the linear
and nonlinear referents, with the list-wise approach most like the linear referent (43%).
Table 4. Links in common (below the diagonal) and percent of total links (above the diagonal)
for each PFNet and referent with the maximum number of links shown on the diagonal in
parenthesis.
P L C Lin NonPair-wise (P) (14) 71% 57% 36% 7%List-wise (L) 10 (14) 64% 43% 7%Cluster (C) 8 9 (14) 36% 7%Linear (Lin) 5 6 5 (14) 7%Nonlinear (Non) 1 1 1 1 (11)
Discussion
This investigation examined the criterion-related validity of list-wise and clustering
approaches for eliciting relationship data for Pathfinder analysis relative to the conventional
pair-wise approach. Participants’ individual raw proximity data for the three approaches were
only weakly related, though correlation values of the low- and high-achieving groups were
consistent within each approach. On the other hand, for group average raw proximity data,
moderately strong correlations were observed (i.e., list-wise by cluster r = -0.79, 62% related).
For group average PFNet similarity data, the three approaches were strongly related (i.e., pair-
wise by list-wise, 71% related). ANOVA of individual PFNet similarity data indicates that the
22
pair-wise approach was most sensitive to nonlinear content organization while the list-wise
approach was relatively most sensitive to its linear organization.
Taken together, the results indicate that the three approaches did elicit fairly similar
network representations at the group level, and so the list-wise and cluster approach might be
used for group comparison purposes. However, the three approaches elicited fairly dissimilar
network representations at the individual level. The three approaches are differently sensitive to
structural knowledge, for example with the pair-wise approach relatively best suited for eliciting
the nonlinear network structure of an individual’s structural knowledge and the list-wise
approach best suited for eliciting the linear network structure of an individual’s structural
knowledge.
In terms of efficiency, the pair-wise approach (X = 447.4 s) took longest to complete,
then the list-wise approach (X = 193.3 s) with the clustering approach taking the least time (X =
115.5 s). Perhaps during the list-wise task, participants re-read the entire list on each new
response, whereas during the pair-wise task, only two terms are read and considered on each
response. If so, list-wise decision making has a higher cognitive load and this could have strong
negative implications as the number of terms in the list increases, say for example, to 100 terms.
Also, the question remains, are many simple decisions better than a few complex decisions?
The clustering task required the least time to complete. Perhaps sliding the terms around
is simply more efficient. However, the nature of the clustering task is fundamentally different
than for the list-wise and pair-wise approaches. Participants may feel that the cluster approach is
more authentic than the pair-wise and list-wise approaches. Also, in the clustering task, it is
possible to miss or skip some comparisons, especially as the number of terms on the screen
increases, thus introducing error. The clustering approach should be modified so that terms that
23
have been moved change appearance, a color change for example, so that it is easy to spot terms
that have not yet been sorted.
In summary, the results indicate that the three approaches did elicit fairly similar network
representations at the group level, thus, the list-wise and cluster approach are most useful for
group comparison purposes. Students enjoyed the clustering approach which is most similar to
concept mapping. Like concept mapping, computer-based approaches for determining student
knowledge have been proven to provide a valid, low-cost, easy to use, and easy to interpret
measure of students’ content knowledge (Koul, Clariana, & Salehi, 2005). Future research on
these computer-based approaches is suggested due to their appeal to both students and educators
at all levels of instruction.
References
Clariana, R.B. (2003). Knowledge unit mapper (KU-Mapper) software. Downloaded April 17, 2004 from http://www.personal.psu.edu/rbc4/KUmapper.htm
Cooke, N. M. (1992). Predicting judgment time from measures of psychological proximity. Journal of Experimental Psychology: Learning, Memory, and Cognition, 18, 640-653.
Dearholt, D. W., & Schvaneveldt, R. W. (1990). Properties of Pathfinder networks. In R. Schvaneveldt (Ed.), Pathfinder associative networks: Studies in knowledge organization. (pp. 1-30). Norwood, NJ: Ablex.
Dunn-Rankin, P., Knezek, G.A., Wallace, S., & Zhang, S. (2004). Scaling methods, 2nd edition. Mahwah, NJ: Lawrence Erlbaum.
Elman, J.L. (2004). An alternative view of the mental lexicon. Trends in Cognitive Science, in press. Retrieved December 10, 2004 from http://www.crl.ucsd.edu/~elman/Papers/elman_tics_opinion_2004.pdf
Gaultieri, J. Fowlkes, J., & Ricci, K.E. (1996). Measuring individual and team knowledge structures for use in training. Training Research Journal, 2, 117-141.
Goldsmith, T.E., & Davenport, D.M. (1990). Assessing structural similarity in of graphs. In Schvaneveldt (ed.), Pathfinder associative networks: studies in knowledge organization, 75-87. Norwood, NJ: Ablex.
Goldsmith, T.E., Johnson, P. J., & Acton, W. H. (1991). Assessing structural knowledge. Journal of Educational Psychology, 83, 88-96.
Housner, L.D., Gomez, R.L., & Griffey, D.C. (1993). Pedagogical knowledge structures in prospective teachers: Relationships to performance in a teaching methodology course. Research Quarterly for Exercise and Sport, 64, 167-177.
24
Johnson, P. J., Goldsmith, T. E., & Teague, K. W. (1994). Locus of the predictive advantage in Pathfinder-based representations of classroom knowledge. Journal of Educational Psychology, 86 (4), 617-626.
Jonassen, D. H., Beissner, K., & Yacci, M. (1993). Structural knowledge: techniques for representing, conveying, and acquiring structural knowledge. Hillsdale, NJ: Lawrence Erlbaum Associates.
KNOT (1998). Knowledge Network and Orientation Tool for the Personal Computer, version 4.3. Retrieved October 3, 2003 from http://interlinkinc.net/
Koul, R., Clariana, R.B., & Salehi, R. (2005). Comparing Several Human and Computer-Based Methods for Scoring Concept Maps and Essays. Journal of Educational Computing Research, 32 (3), 227-239.
Luria, A.R. (1979). The making of mind. A personal account of Soviet psychology. Cambridge, MA: Harvard University Press.
Ozgungor, S., & Guthrie, J.T. (2004). Interactions among elaborative interrogation, knowledge, and interest in the process of constructing knowledge from text. Journal of Educational Psychology, 96, 437-443.
Schvaneveldt, R.W., Durso, F.T., Goldsmith, T.E., Breen, T.J., & Cooke, N.M. (1985). Measuring the structure of expertise. International Journal of Man-Machine Studies, 23, 699-728.
Schvaneveldt, R.W., Durso, F.T., & Dearholt, D.W. (1989). Network structures in proximity data. In G.H.Bower (Ed.), The psychology of learning and motivation: Advances in research and theory (pp. 249-284). New York, NY: Academic Press.
Schvaneveldt, R.W., Beringer, D.B., Lamonica, J., Tucker, R., & Nance, C. (2000). Priorities, organization, and sources of information accessed by pilots in various phases of flight. FAA Office of Aviation Medicine Reports. (DOT-FAA-AM-00-26)
Schoenfeld, A. H., & Herrmann, D. J. (1982). Problem perception and knowledge structure in expert and novice mathematical problem solvers. Journal of Experimental Psychology: Learning, Memory, and Cognition, 8, 484-494.
Shavelson, R.J. (1972). Some aspects of the correspondence between content structure and cognitive structure in physics instruction. Journal of Educational Psychology, 63, 225-234.
Stout, R.J., Salas, E., & Kraiger, K. (1997). The role of trainee knowledge structures in aviation team environments. International Journal of Aviation Psychology, 7, 235-250.
Taricani, E. M. & Clariana, R.B. (in press). A technique for automatically scoring open-ended concept maps. Educational Technology Research and Development, , 54, 61-78.
Thompson, C.A.B. (1992). The cognitive structure of clinical expertise (nurse clinicians). Doctoral Dissertation, University of Rochester. Dissertation Abstracts International, 53 (10), B5145.
Villachia, S.W. (2000). An investigation of the stability of Pathfinder-related measures. Doctoral dissertation, University of Northern Colorado. Dissertation Abstracts International, 60 (12), A4393.
Villachia, S.W., Lohr, L.L., Summers, L., Lowell, N., Roberts, S., Javeri, M., Hunt, E., Mahoney, C., & Conn, C. (2001). A cognitive map of human performance technology: a study of domain expertise. 24th Annual proceedings of selected research and development papers presented at the convention of the Association for Educational Communications and Technology, Atlanta, GA, November 8-12, 2001. ED470122