pages (including this page):88 - new zealand exchange · contact details tel: +61 3 9670 8668 fax:...
TRANSCRIPT

A.B.N. 45 066 383 971
NZX Limited NZX 11 Cable Street, Level 1 Wellington, New Zealand Annual Report for 2013 Attached please find Cue Energy Resources Limited’s release with respect to the above mentioned. Yours faithfully
Andrew M Knox Chief Financial Officer
14 October 2013 PAGES (including this page):88
CUE ENERGY OVERVIEW Cue is an Australian based oil & gas company with activities in Australia, New Zealand, Indonesia and PNG. THE COMPANY HAS: Long life production A strong balance sheet An active exploration program
CUE ENERGY DIRECTORS Geoffrey King (Chairman) Timothy Dibb Paul Moore Andrew Young
CUE ENERGY MANAGEMENT David Biggs (CEO) Andrew Knox (CFO) David Whittam (Exp Man)
OFFICE
Level 21 114 William Street Melbourne Vic 3000
CONTACT DETAILS Tel: +61 3 9670 8668 Fax: +61 3 9670 8661
EMAIL [email protected]
WEBSITE www.cuenrg.com.au
LISTINGS ASX: CUE NZX: CUE POMSOX: CUE ADR/OTCQX: CUEYY

ABN 45 066 383 971
Level 21, 114 William Street Melbourne Victoria 3000 Australia T: +61 3 9670 8668 F: +61 3 9670 8661 W: www.cuenrg.com.au E: [email protected]
CUE EN
ERG
Y RESO
UR
CES LIMITED
AN
NU
AL R
EPO
RT 2012/
13
Annual Report 2012/13
Exciting times ahead
Photo courtesy of OMV
Cue Energy Resources has petroleum assets in New Zealand, Papua New Guinea, Indonesia, and Australia. The company has continuously grown over recent years through a mix of acquisitions and discoveries.
It is Cue Energy’s objective to develop a robust and substantial E & P company with a focus on the SE Asia and Australasia region through:
• maximising value of existing assets
• building organisational capability
• aggressively pursuing new E & P assets
• developing a balanced portfolio of exploration, development and production opportunities
• increasing stakes in assets to 20-40% and take up operatorship as required
• actively pursuing value accretive acquisitions
About Cue Energy
Cue Energy Resources Limited is an oil and gas exploration and production company with a focus on SE Asia and Australasia.
Company snapshotOrdinary Shares 698,119,720
12 Month Trading Range 10.5¢ – 15.5¢
12 Month Average Daily Volume ~400,000
Cash at 30 June 2013 A$58.83 million
Debt Nil
Avg FY13 Production ~2600 boe/day
Contents2 Highlights and Results 2012/13
4 Corporate Directory
5 Joint Venture Interests
6 Chairman’s Overview
8 Chief Executive Officer’s Review
20 Corporate Governance Statement
24 Directors’ Report
37 Auditor’s Independence Declaration
38 Directors’ Declaration
40 Consolidated Statement of Profit or Loss and Other Comprehensive Income
41 Consolidated Statement of Financial Position
42 Consolidated Statement of Changes in Equity
43 Consolidated Statement of Cash Flows
44 Notes to the Financial Statements
80 Independent Auditor’s Report
82 Shareholder Information

1
Cue
Ener
gy R
esou
rces
Lim
ited
Annu
al R
epor
t 201
2-13
Abou
t Cue
Ene
ry R
esou
rces
1
Cue was engaged during the year in planning for a number of wells to be drilled in the 2013/14 year. In the Maari-Manaia field, the Kan Tan IV semi-submersible drilling unit is drilling the Manaia-2 appraisal well and the Ensco 107 jack-up rig will be on location in early 2014 for Maari field development activities.
Photo courtesy of OMV

Highlights and Results 2012/13
2
Production Revenue
$49.8million
Cue’s Debt
ZeroCash at Year End
$58.8million
The 2012/13 year was another good year for Cue. The Company experienced strong production cashflows with reported production revenue of $49.8 million, up $8.6 million from the 2011/12 year, and reported net profit after tax of $6.4 million up from $5.7 million last year. Cue’s cash balance increased during the year to $58.8 million from $33.7 million in 2011/12. Cue currently has no debt and no hedging and continues to fully enjoy the current robust oil prices.
Gross profit - Production
$30.7million

3
Cue
Ener
gy R
esou
rces
Lim
ited
Annu
al R
epor
t 201
2/13
High
light
s an
d Re
sults
201
2/13
Corporate Results• Production revenue of $49.8 million
• Production of 0.93 million boe
• Gross profit of $30.7 million
• Profit after income tax expense of $6.4 million
• Cash at year end of $58.8 million
• Group is debt free
Papua New Guinea • SE Gobe gas sale negotiations near completion
Indonesia• First full year of gas production from Wortel field
asset, reliably delivering contract gas quantity to Indonesia Power
• Appraisal drilling planned to commence in Mahakam Hilir PSC, onshore Kalimantan, Indonesia
• Infill well drilled in Oyong field increasing production by over 40%
New Zealand• Free carried exploration well scheduled on Whio
Prospect in New Zealand PEP 51313
• Pipeline 3D seismic survey acquired over PEP 51313. Potential further exploration well in Q2 calendar 2014
• Development and appraisal drilling planned at Maari offshore Taranaki, New Zealand
• PEP 51313 renewal application made with well commitment Q2 calendar 2014 planned
Australia• Carnarvon Basin block Inversion study in
WA-359-P to define potential oil prospect
• Carnarvon Basin block WA-389-P renewed with increased equity at 40%
Eight wells minimum and potentially 11 wells expected over next 12 months in Indonesia and New Zealand
Operating Cash Flow $ Millions
Production Calendar year mmboe
3
0
10
20
30
40
50
60Sa
les
Rece
ipts
Prod
ucti
on C
osts
Expl
orat
ion
Cost
s
Oth
er P
aym
ents
Net
ope
rati
ng C
ash
Flow
2011
2012
2013
f
2014
f
2015
f
2016
f
Sampang PSCMaariSE Gobe
0.0
0.2
0.4
0.6
0.8
1
1.2
Photo courtesy of OMV

4
Corporate Directory
DirectorsGeoffrey J. King BA, LL.B (Chairman)
Paul D. Moore BSc, MBA
Timothy E. Dibb BSc, PhD
Andrew A. Young BE, MBA (Hons)
Chief Executive OfficerD.A.J. Biggs LL.B
Chief Financial Officer/ Company SecretaryA.M. Knox B.Com
Co-Company SecretaryP.M. Moffatt B.Com
Registered OfficeLevel 21, 114 William Street
Melbourne Victoria 3000 Australia
Telephone: + 61 3 9670 8668
Facsimile: + 61 3 9670 8661
Website: www.cuenrg.com.au
Email: [email protected]
ABN 45 066 383 971
Stock Exchange ListingsAUSTRALIA
Australian Securities Exchange Ltd
525 Collins Street
Melbourne, Victoria 3000 Australia
NEW ZEALAND
New Zealand Exchange Limited
Level 1, NZX Centre, 11 Cable Street
PO Box 2959
Wellington, New Zealand
PAPUA NEW GUINEA
Port Moresby Stock Exchange
Level 4, Defence Haus
Port Moresby, Papua New Guinea
UNITED STATES OF AMERICA
OTCQX
OTC Markets
304 Hudson Street, 3rd Floor
New York, NY 10013 USA
AuditorBDO East Coast Partnership
Level 14, 140 William Street
Melbourne Victoria 3000 Australia
BankersANZ Banking Group Limited
91 William Street
Melbourne Victoria 3000 Australia
Investec Bank (Australia) Limited
Level 23, The Chifley Tower
2 Chifley Square, Philip Street
Sydney NSW 2000 Australia
ASB Bank Limited
PO Box 35, Shortland Street
Auckland 1140 New Zealand
National Australia Bank Limited
Level 4, 330 Collins Street
Melbourne Victoria 3000 Australia
Share RegistryAUSTRALIA
Computershare Investor Services Pty Ltd
Yarra Falls, 452 Johnston Street
Abbotsford, Victoria 3067 Australia
GPO Box 2975
Melbourne, Victoria 3000 Australia
Telephone: 1300 850 505 (within Australia)
or +61 3 9415 4000 (outside Australia)
Email: [email protected]
Website: www.computershare.com.au
PAPUA NEW GUINEA
Computershare Investor Services Pty Limited
C/- Kina Securities
Level 2, Deloitte Tower
Douglas Street
(PO Box 1141)
Port Moresby, National Capital District
Papua New Guinea
Telephone: +67 5 308 3888
Facsimile: +67 5 308 3899

5
Cue
Ener
gy R
esou
rces
Lim
ited
Annu
al R
epor
t 201
2/13
Join
t Ven
ture
s / C
orpo
rate
Dire
ctor
y
5
Joint Ventures
INDONESIA
Sampang PSC Santos# 45%SPC 40%Cue(i) 15%
Mahakam Hilir PSC SPC# 60%Cue(i) 40%
AUSTRALIA
Carnarvon Basin PermitsWA-389-P BHP Billiton# 60%Cue 40%WA-359-P Cue# 100%WA-360-P MEO#^^ 62.5%Cue 37.5%WA-361-P MEO#^^ 50%Mineralogy 35%Cue 15%WA-409-P Apache# 40%Cue 30%Rankin Trend 30%
NEW ZEALAND
Maari Oil FieldPMP 38160 OMV# 69%Todd 16%Horizon 10%Cue 5%PEP 51149 Todd# 80%Cue 20%PEP 51313 OMV# 30%Todd 35%Horizon 21%Cue(ii) 14%PEP 54865 Todd# 80%Cue 20%
PAPUA NEW GUINEA
PDL 3Santos#*** 15.9%SHP 40.1%Oil Search 36.4%Cue 5.6%PRG 2.0%(SE Gobe Unit 3.286%)
PRL14Oil Search# 62.5%Murray 26.5%Cue 11%
PRL9 Santos*** 40%Oil Search# 45.1%Cue 14.9%
(i) 8.181878% in the Jeruk field
(ii) 5% in the Whio prospect on commercial success
# Operator
^^ Title held by North West Shelf Exploration Pty Ltd
*** Title held by Barracuda Ltd

The development of a business plan and model for the systematic growth of the company was discussed in detail at a company strategic planning forum in January 2013, when the creation of the plan was initiated and work commenced under the direction of the acting CEO, Andrew Young who was appointed from the Board to fill temporarily the vacancy resulting from the resignation of the former CEO. Andrew oversaw the development of the Cue business plan and model over the ensuing following months, which work was completed under the supervision of David Biggs when he was appointed as CEO in April this year.
The business plan and model to which all members of the company have contributed, now forms one of the most important management resources of the company, providing a robust system for evaluating investment opportunities. I am confident that the plan lays a foundation for real growth in the value of Cue’s assets.
Turning to the performance of the company during 2012/13, it is fair to say that it was another excellent year for Cue.
The Company experienced strong production cashflows with reported production revenue of $49.8 million, up $8.6 million from the 2011/12 year, and reported profit after tax of $6.4 million up from $5.7 million last year.
Gas production and related revenues during the year were significantly higher at 4.0 bcf (2.0 bcf in 2011/12) as a result of the first full year of production at Wortel. This was partially offset by a higher amortisation charge due to a move to a more gas based production profile. Total oil production volumes were steady at 0.28 million barrels.
Cue’s cash balance increased during the year to $58.8 million from $33.7 million in 2011/12. Cue currently has no debt and no hedging and continues to enjoy the current robust oil prices. The Board will, of course, consider raising debt if required to fund profitable ventures or acquisitions.
The company was engaged during the year in planning for a number of wells to be drilled in the 2013/14 year. In the Maari-Manaia field, the Kan Tan IV semi-submersible drilling unit is currently drilling the Manaia-2 appraisal well and the Ensco 107 jack-up rig will be on location in early 2014 for Maari field development activities.
In the past year, several key executives left the company, and at Board level we experienced considerable change when Leon Musca and the former Chairman, Richard Tweedie, retired from the Board. I thank Leon and Richard on behalf of the Board and shareholders for their solid contributions to the advancement and growth of the company during their directorships of many years, and I am delighted that Richard and Leon continue to retain significant shareholdings in Cue.
Sadly, we also lost from the Board Steven Koroknay who died suddenly during June 2013. Steve’s death at a relatively young age deprives us of his friendship and wise counsel on the Board. Steve was a well-known and respected figure in the oil and gas industry with over thirty-five years of experience over that time as an executive in very large international oil and gas companies, and in significant Australian focused energy companies.
With Steve’s passing, the Cue Board now comprises four members and the Board has resolved to stay with a Board of four which we believe meets the current needs of Cue and our growth strategy.
The company has moved to fill key vacancies and David Biggs has been welcomed as CEO to lead the company and implement the new focus and strategy adopted by the Board which addresses fundamental issues for any company in our industry – reserves replacement and growth – and the increase of the value of our shareholders’ investments in the company.
David comes to the Company with more than 30 years’ experience in the international oil and gas industry with a strong background in oil and gas business development, marketing, joint ventures, and business strategy. He has worked for the past 19 years at senior levels with BHP Billiton Petroleum Ltd in both Melbourne and Houston and prior to that with Petroleum Corporation of New Zealand and Natural Gas Corporation of New Zealand.
During the 2012 AGM when it was announced that I would become interim Chairman when Richard Tweedie stepped down as Chairman, I made a very brief comment that while Chairman my goal would be to persuade the Board to adopt an enhanced systematic and planned approach to directing the business of the company, with particular emphasis on reserves replacement which is the life blood of any oil and gas company, and the implementation of strategies to increase Cue’s oil and gas reserves.
Chairman’s Overview
6
I am very pleased to provide my first report to shareholders as Chairman of the Board.
It is a fortunate Chairman who is able to report the very positive results for our company for the twelve months to June 2013 and I must acknowledge the hard work, judgement and commitment of the Board as it was constituted up to the end of 2012, and to the management and staff for their efforts in the past year.

7
Cue
Ener
gy R
esou
rces
Lim
ited
Annu
al R
epor
t 201
2/13
Chai
rman
’s O
verv
iew
7
Planning is in progress for drilling the Whio-1 well in PEP 51313 with the Kan Tan IV with the well expected to spud by the end of the first quarter 2014.
In Indonesia, the Naga Utara-2 well is expected to spud in late September on the Mahakam Hilir block onshore Kalimantan. If Naga Utara-2 is successful, the drill rig will move to Naga Utara-3.
In all, we expect that at least three, and up to six exploration and appraisal wells, will be drilled over the next 12 months in Indonesia and New Zealand. In addition five wells will be drilled to support Maari development activities.
In the Carnarvon Basin, Western Australia, Cue increased its interest in WA-389-P to 40%. Cue sees significant remaining hydrocarbon potential in the permit which is already substantially covered by 3D seismic that will underpin continuing exploration of the block. BHP Billiton Petroleum, the operator, holds the other 60%.
In the WA-359-P Carnarvon Basin permit, Cue is conducting a programme of geological and geophysical studies to firm-up a drilling location for a likely well in 2015. Cue plans to farmdown its 100% interest in the permit, commencing later this year, to bring in partners capable of operating the drilling phase of the work programme.
In WA-409-P the joint venture varied the work programme for the final year of the current permit term and drilling will now be deferred until the renewal of the permit in 2014. Cue will be carried through the work programme and any well the Operator elects to drill.
In Papua New Guinea the construction of facilities to process the associated gas and gas cap from SE Gobe continues. The gas will be exported to the PNG LNG gas pipeline and LNG processing plant from June 2014.
As part of the overall emphasis on business planning, the Company reviewed its exploration strategy during the year. The Board is very aware that Cue needs to replenish its exploration acreage holdings over the next two years and the company is currently putting in place the resources required to significantly lift the company’s screening of exploration opportunities and to capture new acreage.
The Board concluded that the company should seek to add at least 5 million barrels of reserves by the end of calendar year 2018, by exploration and acquisition, which amounts to a reserves replacement ratio of 142%. The exploration component of this target will require Cue to drill at least 3 – 5 wells a year with a focus on fiscally attractive opportunities that can be quickly commercialised in onshore Australia, New Zealand and Asia.
The Company’s balance sheet again remains strong. At the end of the financial year the Company had cash reserves of $58.8 million and no debt. Our strong existing production and cashflow forecast indicates that the Company has sufficient financial resources to deliver the Company’s growth strategy.
Geoffrey J. King
Chairman
26th September 2013
Photo courtesy of OMV

A large part of the year was spent preparing for a very active 2013/14 year with wells to be drilled in Indonesia and New Zealand. Apart from the significant activity comprising the Maari growth project which continues the appraisal and development of the Maari field in New Zealand, significant wells in PEP 51313 (Whio) and the Mahakam Hilir PSC in Indonesia (Naga Utara-2) will be drilled. These wells will have implications for the further exploration of PEP 51313 in New Zealand and the Mahakam Hilir PSC block in Indonesia, respectively. In PMP 38160, the Manaia-2 well will appraise reservoirs in the Moki and Farewell formations which were oil-bearing in the Manaia field discovery. A successful Manaia appraisal well could add significant contingent resources to the Maari project with implications for its future development.
Our producing fields in Indonesia (Oyong and Wortel) performed well during the year. Production from the fields in the Sampang PSC averaged 15,719 boes per day (2,045 boes Cue share). The Maari field produced 8,794 barrels per day (440 barrels per day Cue share).
The Maari field continued to have operational issues. Whilst a series of workovers to replace the troublesome electrical submersible pumps were successfully executed resulting in improved pump reliability, post year end the facility encountered problems with the integrity of the mooring system on the FPSO Raroa and then subsequently the failure of the swivel on the vessel. The swivel was scheduled to be replaced in 2014, so the opportunity has been taken to bring forward the swivel replacement and at the same time, to reinstate the mooring system. These issues are dealt with in more detail later in this report, but at the time of writing, the root cause of the failure of the swivel has yet to be ascertained and the joint venture is reviewing whether design inadequacies in the mooring system were responsible for its failure.
Achievements in 2012/13Cue’s share of production for the year from our New Zealand, Indonesian and Papua New Guinea fields was 0.93 mmboe. This is a good outcome given ongoing operational issues at Maari. Our production benefitted from the first full year of gas production from the Wortel field and increased production from the Oyong field after a successful infield well.
Global oil prices remained steady during the year, contributing to total revenue of $49.8 million. Reported profit after tax of $6.4 million was higher than 2011/12 primarily due to increased production revenue, lower tax and foreign exchange gains.
We continue to generate strong cash flows which are used to fund our exploration activities. The company’s financial position is healthy with $58.8 million in cash reserves as at 30 June 2013 and no debt.
During the year the company undertook a strategic review of its activities and focus. The review entailed an assessment of our current exploration acreage, static resources and future exploration direction.
Arising from that review a number of conclusions and actions were agreed:
• continue to explore in Australia, New Zealand and Asia
• refocus exploration away from expensive deep water opportunities to onshore where discoveries can be more quickly commercialised and brought into production
• seek participating interests in the range of 20-40%
• continue to build our exploration team
• focus on creating value from our static resources by seeking to monetise them either by maturing them to the point that they can be booked as reserves or otherwise
• aim to drill 3-5 exploration wells per year, consistent with the company’s ability to fund
• add 5 million boes to current booked reserves by the end of calendar year 2018 (equates to replacing production in the period to end 2018 and increasing current booked reserves by 30%)
Chief Executive Officer’s Review
8
The 2012/13 year was a year of solid progress on our core exploration and production activities. With several wells to be drilled in New Zealand and Indonesia over the next 12 months, 2013/14 promises to be a key year for the Company.

9
Cue
Ener
gy R
esou
rces
Lim
ited
Annu
al R
epor
t 201
2/13
Chie
f Exe
cutiv
e O
ffice
r’s R
evie
w
9
The Year AheadThe company will participate in a number of key wells in 2013/14 – including Naga Utara-2, Manaia-2, Whio-1 and possibly Te Whatu-3. The outcome of two of these wells will impact significantly on Cue’s view of the prospectivity of two of our exploration permits – PEP 51313 in New Zealand and the Mahakam Hilir PSC in Indonesia. If the results of these two wells are positive, the technical view of further targets in each block will be enhanced and will probably lead to further exploration activity on the blocks. If however, the wells are not successful, Cue will have to reappraise its continuing interest in these properties.
The Company can look forward to strong production numbers for calendar years 2014 and 2015. However, post 2015, forecast production, assuming no near term exploration or appraisal success, begins to decline rapidly. Cue’s Board and management are acutely aware of the challenge this presents and are focused on taking steps to secure Cue’s ongoing reserves position and production post 2015.
In the meantime, the Company is in the fortunate position of being able to fund its exploration commitments and activities from cash flow. Consistent with the Company’s new exploration strategy and reserves booking target, Cue will focus on increasing its presence onshore Australia, in New Zealand and in Asia as it seeks to restock its exploration acreage portfolio by securing material positions in prospective acreage, and executing exploration activities to secure reserves replacement and growth.
Photo courtesy of OMV

10
Australia
Scale: 25km
LEGENDCue PermitOil FieldGas FieldProspectLead
Caterina The Point
Flower Drum
Moriarty
Sherlock Watson
Attica
Brigadier Updip
Intimo
Python(North/South)
AndromedaEast
WA-409-P
WA-359-P
WA-360-P
WA-389-P
WA-389-P
WA-389-P
WA-361-P
WA-361-P
WA-361-P
WA-360-P
Hepphaestus
HeraclesMaxwell
Cue has developed a new potential oil play modelled on the Victoria syncline.Permit equities have been increased.

11
Cue
Ener
gy R
esou
rces
Lim
ited
Annu
al R
epor
t 201
2/13
Chie
f Exe
cutiv
e O
ffice
r’s R
evie
w
11
ExplorationWA-359-P
Cue Interest: 100%
Operator: Cue Exploration Pty Ltd
The permit was renewed for a five year term on a reduced area in October 2012 after Cue has identified encouraging potential for both oil and gas in the permit. Structural traps with Triassic-aged reservoirs which are prospective for gas have been mapped on the existing 3D seismic data, however the emergence of a new potential oil play based on the Victoria Syncline is attracting most interest. The play fairway extends across several adjacent permits including WA-359-P and WA-409-P and Cue is well positioned with a number of possible drilling candidates in both permits.
A programme of geological and geophysical studies is being conducted to firm-up a drilling location for a likely well in 2015. Reprocessing of the existing multi-client 3D seismic data over the permit commenced in early July and is expected to be complete in November 2013.
Cue plans to farmdown its interest in the permit, commencing later this year after essential preliminary technical work is complete, to bring in a partner capable of operating the drilling phase of the work programme.
WA-389-P
Cue Interest: 40%
Operator: BHP Billiton Petroleum (Australia) Pty Ltd
Cue and BHP Billiton agreed to increase their respective interests in the permit following Woodside’s decision to withdraw (and resign as Operator). Cue now holds a 40% interest in the permit which we consider to hold significant remaining petroleum potential, particularly Triassic gas. BHP Billiton Petroleum has been appointed Operator and the Joint Venture has submitted an application to renew the permit on a reduced area for a further five year exploration term.
WA-409-P
Cue Interest: 30%
Operator: Apache Northwest Pty Ltd
The Joint Venture received approval in April 2013 to vary the work programme for the final year of the current permit term (Year 6), which commenced on 30th April 2013. The revised work programme includes reprocessing of 566 km² of existing multi-client 3D seismic data, seismic attribute studies and other technical studies to assess the petroleum potential of the permit and select a drilling location. Drilling will now be deferred until the renewal of the permit in 2014. Under the terms of the farmout agreement with Apache, Cue is carried through the work programme and any well Apache elect to drill.
WA-360-P WA-361-P
Cue Interest: 37.5% Cue Interest: 15%
Operator: MEO Australia Ltd Operator: MEO Australia Ltd
Cue has decided to reduce its interest in both permits and MEO and Cue have agreed to market jointly their respective interests to potential new entrants.

12
New Zealand
Appraisal drilling has commenced at Manaia. Maari / Manaia development drilling due to commence Q1 calendar 2014.
Dry hole
Gas wells with oil shows
LEGENDCue PermitOil FieldGas FieldProspectLead
PMP 51149PEP 54865
PEP 51313
PMP 38160
ManaiaMaari
Te Whatu
PaikeaAiha Pukeko-1
Hochstetter-1
Kiwa-1Hector-1
North Tasman-1
Tasman-1
Taranaki Peninsula
Photo courtesy of OMV

13
Cue
Ener
gy R
esou
rces
Lim
ited
Annu
al R
epor
t 201
2/13
Chie
f Exe
cutiv
e O
ffice
r’s R
evie
w
13
ExplorationPEP 51149
Cue Interest: 20%
Operator: Todd Exploration Limited
Geological and geophysical studies in the onshore permit are progressing. The permit reached the end of Year 5 in September 2013 and the Joint Venture has applied to the New Zealand government for renewal of the permit. It is planned to drill a well on the Te Kiri prospect which has prospectivity for oil in relatively shallow Miocene age reservoirs and gas in deeper Eocene objectives during the latter half of 2014. A commercial gas discovery in this permit could be brought into production relatively quickly, given the proximity of the permit to existing infrastructure and markets for gas.
PEP 54865
Cue Interest: 20%
Operator: Todd Exploration Limited
The permit carries a minimum work programme of 285 km² of 3D seismic to be acquired, processed and interpreted prior to June 2015, at which point the Joint Venture may elect to drill a well before December 2016 to test Early Tertiary and Late Cretaceous reservoir objectives, or surrender the permit.
PEP 54865 complements Cue’s existing acreage holdings in the Taranaki Basin, particularly PEP 51313. The work programme is structured to allow the Joint Venture to quickly develop potential drilling opportunities, but defer the decision to enter the drilling phase of the permit until after the results of exploration activities in adjacent blocks become available.
PEP 51313
Cue Interest: 14% interest
Operator: OMV New Zealand Ltd
In November 2012, the PEP 51313 Joint Venture agreed to farm-out a 30% interest in the permit to OMV New Zealand Ltd. OMV will earn its interest by funding all of the drilling, testing and completion of the first well on the Whio prospect which is located approximately 4 km south of the Maari production facilities. OMV assumed the operatorship of the permit (from Todd Exploration) at the beginning of April 2013. Cue retains a 14% interest in the permit.
Planning is in progress for drilling the Whio well in the fifth slot of the Kan Tan IV, a semi-submersible drilling unit, drilling programme. The expected commencement of drilling is by the end of the first quarter calendar 2014. In the event that Whio is a commercial discovery (or additional activity is required to determine commerciality), OMV will increase its interest to 69% within a predefined area of the permit that covers the Whio prospect.
Cue will, in this event, retain a 5% interest in a Whio development and any oil discovered will flow through the Maari facilities at minimal cost.
Dry hole
Gas wells with oil shows
LEGENDCue PermitOil FieldGas FieldProspectLead
PMP 51149PEP 54865
PEP 51313
PMP 38160
ManaiaMaari
Te Whatu
PaikeaAiha Pukeko-1
Hochstetter-1
Kiwa-1Hector-1
North Tasman-1
Tasman-1
Taranaki Peninsula
A successful well at Whio will open up additional drilling opportunities along the Tasman Ridge which extends southward from the Maari field.
A 450 km² 3D seismic survey was acquired in March 2013 and the processed data was received in August. The Joint Venture has committed to further processing to obtain depth migration which will be completed in January 2014.
The new data will be used to further evaluate the Pukeko North-East and Te Whatu Deep prospects and to select a drilling location for a well that is required to be drilled before July 2014 to fulfill the permit work programme obligations. Subject to joint venture approval, it is expected that this well will be drilled from the Kan Tan IV in the first half of 2014.
Cue continues to view both PEP 51313 and PEP 54865 as important components of its exploration portfolio with potential to deliver both material new discoveries in the emerging Paleocene and Late Cretaceous plays in the relatively under-explored south western Taranaki Basin and add incremental reserves to the Maari development with relatively low-risk, near-field prospects such as Whio.
ProductionPMP 38160
Cue Interest: 5%
Operator: OMV New Zealand Ltd
Maari and Manaia Fields
Cue’s net share of oil sales receipts for the year from the Maari and Manaia fields was 178,889 barrels which generated $19.6 million in revenue. Oil from Maari and Manaia is being commingled and produced jointly.
The production facilities have been shut in since 21 July 2013 as a precaution to effect interim repair works on the mooring system. However, in the interim, a problem was encountered with the swivel on the field FPSO, the Raroa and the decision has been taken to replace the swivel. The swivel was scheduled for replacement in 2014 and this work has been brought forward and the vessel relocated to port in New Zealand for the work to be effected. At the same time, the opportunity will be taken to fully remediate the mooring system and carry out planned enhancements to the offshore production system. The facility is expected to resume production in late December 2013, resulting in estimated deferred production (Cue’s share) of 50,000 barrels.
Planning for the Maari growth project is continuing with a final investment decision taken by the Joint Venture in July 2013. The Kan Tan IV commenced work in the Maari-Manaia field with the spudding of the Manaia-2 appraisal well and the Ensco 107 jack-up rig will be used for field redevelopment activities from the existing wellhead platform, commencing in early 2014.

14
Indonesia
SambutanGas/OilField
South Pelarang-1
Naga Utara-1
Naga Selatan-1
Pelarang Samarinda Oil Field
Sei Nangka Oil Field
Mahakam Hilir PSC
Sanga Sanga Oil Field500mmbbls recoverable
Pamaguan Gas Field
Well
Scale: 5km
Gas well
LEGENDCue PermitOil FieldGas FieldProspect
The Naga Utara-2 appraisal drilling is expected to commence Q4 calendar 2013.

15
Cue
Ener
gy R
esou
rces
Lim
ited
Annu
al R
epor
t 201
2/13
Chie
f Exe
cutiv
e O
ffice
r’s R
evie
w
15
ExplorationMahakam Hilir PSC - Kutei Basin
Cue Interest: 40%
Operator: SPC Mahakam Hilir Pte Ltd
Naga Utara
Planning for the 2013 drilling campaign is underway. The first well in the programme will be Naga Utara-2 which is expected to spud in the third quarter 2013. The well will evaluate the Naga Utara-1 gas discovery (drilled in the first quarter 2012) and will have the key objectives of acquiring information on potential flow rates, pay thickness and gas quality to fully characterise the resource. Following the gathering of additional data from the gas-bearing reservoirs seen in Naga Utara-1, the well will be deepened to intersect potential gas-bearing intervals below the known pay. If successful it is intended to complete the well as a future producer and drill a further appraisal well, Naga Utara-3.
Sampang PSC – Madura Strait
Cue interest: 15%
Operator: Santos (Sampang) Pty Ltd
The Sampang PSC Joint Venture continues to investigate the potential for development of the Jeruk oilfield which is technically challenging due to high formation pressures, fractured reservoirs and impurities in the hydrocarbons. The main technical issues to be resolved are the range of uncertainty in the size of the accumulation and the connectivity of the fracture network which will control the quantity of oil which may be recovered by each well and the flow rates that can be achieved. Work is currently being carried out by the Operator on possible development scenarios that can maximize the amount of reservoir information obtained from early production.
ProductionSampang PSC - Madura Strait
Cue interest: 15%
Operator: Santos (Sampang) Pty Ltd
Oyong Field
During the year, Cue’s share of oil sales receipts from the Oyong field was 85,430 barrels which generated $9.88 million in revenue; condensate sales receipts were 714 barrels, which generated $0.048 million in revenue and gas sales receipts of 1.816 Bcf which generated $4.85 million in revenue received during the year. The contract for the current in-field crude oil storage facility ends in October 2013 and the vessel will be replaced by a newer, Indonesian-flagged double-hulled tanker the Surya Putra Jaya. The new vessel is undergoing conversion work in Batam. The replacement of the storage vessel will result in approximately 23 days shutdown of Oyong production during October 2013. The new vessel will conform to Indonesian regulations requiring double-hull construction and local vessel registration. The change of vessel will also result in a significant reduction in operating expenditures.
Oil production from the Oyong field is in natural decline and the current forecast is that oil production will end in the fourth quarter of calendar 2014.
Wortel Field
Cue’s receipts from gas sales during the year was 2.152 Bcf, which generated $13.07 million in revenue. Condensate sales receipts were 1063 barrels which generated $0.073 million in revenue.
Wortel-3 and Wortel-4 are both flowing gas at a combined rate of 46.25 MMscfd. The combined rate of Oyong and Wortel gas production is 83.24 MMscfd (89.1 BBTU/d) (Billion British thermal units per day) which is equal to the contract quantity to be sold to PT Indonesia Power.

16
Papua New Guinea
Scale: 10km
LEGENDCue PermitOil FieldGas FieldGas DiscoveryLeads
Kotubu to Kumul pipeline
Gob
e lin
k
PPL 338
PDL 4
PDL 3PDL 1
APPL 387
PRL 9
W Gobe-1
Gobe-4
Gobe-2
Gobe Gap-1
Makas-1
Wasuma 1/5T2
Gobe-7 Gobe-1Gobe-3
SE Gobe-12Saunders-1
Bilip-1NW Iehi-1
Iehi-1
Barikewa-2
Barikewa-1
PPL 315
PRL 13
PPL 338
PPL 318
PPL 317
PPL 387
Beaver-1
Cobra-1/1A/5T3
PRL 14
Dry hole
Gas
Gas well with oil shows
Oil
SEG unitisation
Gas production from the SE Gobe gas field planned to commence Q2 calendar 2014.

17
Cue
Ener
gy R
esou
rces
Lim
ited
Annu
al R
epor
t 201
2/13
Chie
f Exe
cutiv
e O
ffice
r’s R
evie
w
17
ExplorationPRL14
Cue Interest: 10.947%
Operator: Oil Search (PNG) Limited
PRL9
Cue Interest: 14.894%
Operator: Oil Search (PNG) Limited
The joint venture is still awaiting PNG government advice of the renewal of PRL9. The renewal application was lodged on the 8th June 2012. The PRL9 permit contains the Barikewa gas discovery currently estimated to contain 300 bcf and the Operator is continuing to work economic development options for the gas. The PNG government has agreed to defer the drilling of the commitment well in the permit, which was scheduled to be drilled in the fourth quarter of 2012, into the next permit term. Appraisal drilling will be completed once there is more certainty regarding a commercialisation path for these licenses.
ProductionPDL 3 SE Gobe Field, PNG
Cue Interest: 5.568892%
SE Gobe Unit, PNG
Cue Interest: 3.285646%
Operator: Oil Search (PNG) Limited
Cue’s share of oil sales receipts in the financial year was 21,014 barrels of oil from the SE Gobe field, which generated $2.28 million in revenue received.
The construction of facilities to process the associated gas and gas cap from SE Gobe continues. The gas will be exported to the PNG LNG gas pipeline and LNG processing plant from June 2014.
The gas export rate from the SE Gobe field is expected to be approximately 35 MMscfd for ten years from June 2014.

18
2012 Reserves and Resources SummaryReserves and Resources as at 31 December 2012
Net to Cue Energy Resources Limited
PROVED (1P) PROVED & PROBABLE (2P)
FIELD (LICENCE)CUE
INTERESTLIQUIDS MMBBL
GAS BSCF
OIL EQUIVALENT(4) MMBOE
LIQUIDS MMBBL
GAS BSCF
OIL EQUIVALENT(4) MMBOE
Reserves
INDONESIA
Oyong(1)(2) (Sampang PSC) 15% 0.039 2.259 0.415 0.082 4.523 0.836
Wortel(1) (Sampang PSC) 15% 0.008 6.240 1.048 0.011 7.730 1.299
NEW ZEALAND
Maari (PMP 38160) 5% 1.099 - 1.099 2.309 - 2.309
PAPUA NEW GUINEA
SE Gobe(3) (PDL 3) 3.286% 0.054 3.760 0.680 0.077 4.584 0.841
Total Reserves 1.199 12.259 3.242 2.478 16.837 5.284
Contingent Resources High Estimate 1C Mid to Low Estimate 2C
INDONESIA
Jeruk (Sampang PSC) 8.182% - - - 1.244 - 1.244
PAPUA NEW GUINEA
Barikewa (PRL 9) 14.894% - - - - 44.533 7.422
Cobra(5) (PRL 14) 10.947% - - - - 33.826 5.638
Iehi(5) (PRL 14) 10.947% - - - - 27.368 4.561
Bilip(5) (PRL 14) 10.947% - - - - 3.941 0.657
Total Contingent Resources - - - 1.244 109.668 19.522
Total Reserves and Resources 1.199 12.259 3.242 3.722 126.504 24.806
(1) Cue reserves are net of Indonesian government share of production.
(2) Estimates of in-place and recoverable gas volumes include both free gas and solution gas.
(3) SE Gobe 1P Gas reserves are pending the expected conclusion of an agreement to commercialise the gas.
(4) Oil equivalent conversion factor: 6MSCF per BBL.
(5) PRL 14 Contingent Resource estimates were based on 2009 volumetric studies. Some uncertainties still needed to be addressed.
Competent Persons Statement
The information contained in these statements has been compiled by Aung Moe, Senior Petroleum Engineer, who is a full time employee of the Company, is qualified in accordance with ASX listing rule 5.11 and has consented to the publication of this report.
Summary of Movements in Reserves
PROVED (1P) PROVED & PROBABLE (2P)
LIQUIDS MMBBL
GAS BSCF
OIL EQUIVALENT MMBOE
LIQUIDS MMBBL
GAS BSCF
OIL EQUIVALENT MMBOE
Total 2011 2.280 17.030 5.118 2.694 25.254 6.903
Plus/(less) adjustments (0.762) (1.025) (0.933) 0.103 (4.671) (0.676)
Less production 0.319 3.746 0.943 0.319 3.746 0.943
Total 2012 1.199 12.259 3.242 2.478 16.837 5.284
David Biggs
Chief Executive Officer
26th September 2013

19
Cue
Ener
gy R
esou
rces
Lim
ited
Annu
al R
epor
t 201
2/13
Chie
f Exe
cutiv
e O
ffice
r’s R
evie
w
19
Photo courtesy of OMV

Corporate Governance Statement
20
The Directors of Cue Energy Resources Limited recognise the need for high standards of corporate governance and are focused on fulfilling their responsibilities individually and as a Board to all of the Company’s stakeholders.
The Company endorses the ASX Corporate Governance Council’s Corporate Governance Principles and Recommendations (with 2010 amendments) (“ASX Principles”).
Unless otherwise disclosed, the Company has in place corporate governance practices which comply with the ASX Principles.
The following statement outlines the practices adopted by the Company.
Principle 1: Laying Solid Foundations for Management and Oversight
Recommendation 1.1: Companies should establish the functions reserved to the board and those delegated to senior executives and disclose those functions.
The role of the Board is to lead and oversee the management and direction of the Company.
After appropriate consultation with Executive Management, the Board:
• Defines and sets the Company’s business objectives and subsequently monitors performance and achievement of those objectives;
• Oversees the reporting on matters of compliance with corporate policies and laws, takes responsibility for risk management processes, review of Executive management remuneration practices and insurance needs of the Company;
• Monitors financial performance and approves budgets; and
• Reports to shareholders.
The Board has delegated authority for the running of the day to day business to the CEO.
Recommendation 1.2: Companies should disclose the process for evaluating the performance of senior executives.
The performance of senior executives is reviewed annually as part of the duties performed by the Remuneration and Nomination Committee. Performance measures and targets for the Company and individual personnel are established annually. Company and individual performance in achieving these targets is assessed by the Board and line management.
Principle 2: Structure the Board to add value
Recommendation 2.1: A majority of the board should be independent directors.
Recommendation 2.2: The Chair should be an independent director
Recommendation 2.3: The role of the Chairman and the CEO should not be exercised by the same individual.
The current board is made up of 4 non-executive directors, including 3 independent directors. The chairman is non-executive and independent:
• Geoffrey J. King (Chairman)
• Timothy E. Dibb
• Paul D. Moore
• Andrew A. Young
The board comprises a broad base of industry, business, technical, administrative, corporate skills and experience considered necessary to represent the shareholders and fulfil the business objectives of the Company. The details of background, experience and professional skills of each Director are set out in the Company website and on pages 26 to 27 of this report.
Each of the directors is entitled to seek independent advice at Company’s expense to assist them to carrying out their responsibilities.

21
Cue
Ener
gy R
esou
rces
Lim
ited
Annu
al R
epor
t 201
2/13
Corp
orat
e G
over
nanc
e St
atem
ent
21
The Board reviews at least annually, the composition of the board to determine if additional core strengths are required to be added in light of the nature of the Company businesses and its objectives.
One third of the Directors retires annually and is free to seek re-election by shareholders.
Further details on the company’s directors can be found in the Directors’ Report on pages 24 to 36.
Recommendation 2.4: The board should establish a nomination committee.
The board has established a Remuneration and Nomination Committee charter. The charter outlines the responsibilities of the committee, and is available on the Company website.
The committee is comprised of:
• Paul D. Moore (Chairman)
• Andrew A. Young
Geoffrey J. King was also a member of this committee until 15 November 2012 when he stepped down to become Chairman of the full board.
Steven J. Koroknay was also a member of this committee whilst a director of the company.
Recommendation 2.5: Companies should disclose the process for evaluating the performance of the board, its committees and individual directors.
The Remuneration and Nomination Committee have delegated responsibility to the Chairman of the Board to undertake annual performance evaluations. The performance evaluations are designed to review the board’s performance and effectiveness of achieving its set objectives and targets. The Chairman also discusses with each Director their requirements, performance and aspects of involvement in the Company. The Remuneration and Nomination Committee is also responsible for the performance evaluations of the senior executives, individually and together. This is reviewed against the discussed and agreed objectives of the Company and the effectiveness in carrying out those objectives.
Principle 3: Promote Ethical and Responsible Decision Making
Recommendation 3.1: Companies should establish a code of conduct and disclose the code or a summary of the code as to the practices necessary to maintain confidence in the Company’s integrity, the practices necessary to take into account their legal obligations and the reasonable expectations of their stakeholders and the responsibility and accountability of the individuals for reporting and investigating reports of unethical practices.
The Company has established a code of conduct which recognises the Company’s commitment to business and corporate ethics and recognition of the interests of shareholders. Directors, senior management, employees and where relevant and to the extent possible, contractors of the Company are required to comply with the code of conduct.
Directors are required to disclose to the Board actual or potential conflicts of interest that may or might reasonably be thought to exist between the interests of the Director or the interests of any other party in so far as it affects the activities of the Company and to act in accordance with the Corporations Act if conflict cannot be removed or persists. That involves taking no part in the decision making process or discussions where that conflict does arise.
Directors are required to make disclosure of any share trading. The Company policy in relation to share trading is that officers, employees and contractors are prohibited from trading whilst in possession of unpublished price sensitive information concerning the Company. That is information which a reasonable person would expect to have a material effect on the value of the Company’s shares. An officer must discuss the proposal to acquire or sell shares with the Chairman prior to doing so to ensure that there is no price sensitive information of which that officer might not be aware. The undertaking of any trading in shares must also be notified to the Company Secretary who makes disclosure to the ASX.

22
Recommendation 3.2: Companies should establish a policy concerning diversity and disclose the policy or a summary of that policy. The policy should include requirements for the Board to establish measureable objectives for achieving gender diversity for the board to assess annually both the objectives in achieving them.
The Company established a formal policy on diversity in June 2012. This policy supports the existing equal opportunity policy and non discrimination policy as well as states a commitment to improving gender diversity within the Company. The Remuneration and Nomination Committee has adopted the policy and set annual objectives for achieving gender diversity.
Recommendation 3.3: Companies should disclose in each annual report the measureable objectives for achieving gender diversity set by the Board in accordance with the diversity policy and progress towards achieving them.
The measurable objectives set by the Board for achieving gender diversity include:
• Adopting a Company wide Diversity policy
• Disclosing the policy in the corporate governance section on the website
• Tracking and reporting on the percentages of women employed by the Company as a whole, in senior management positions and on the board.
Recommendation 3.4: Companies should disclose in each annual report the proportion of women employees in the whole organisation, women in senior management and women on the board.
As at 30 June 2013 the proportion of women in the whole organisation is 3 out of 11 (27%), the proportion of women in senior executive positions is 0 of 3 (0%) and proportion of women on the Board is 0 of 4 (0%).
Principle 4: Safeguarding Integrity in Financial Reporting
Recommendation 4.1: The board should establish an audit committee.
Recommendation 4.2: The audit committee should be structured so that it consists only of non-executive directors, a majority of independent directors, is chaired by an independent chair who is not the chair of the board, and has at least two members.
Recommendation 4.3: The audit committee should have a formal charter.
An Audit and Risk Committee and charter have been established. The charter is available on the Company website.
The Committee consists of:
• Timothy E. Dibb (Chairman)
• Geoffrey J. King
Up until his date of resignation, Leon Musca was also a member of this committee, along with Steven J. Koroknay who was a member of this committee during his time as a director.
The primary role of the Audit and Risk Committee is to assist the Board to fulfil its corporate governance responsibilities relating to financial accounting practises, external financial reporting, financial risk management and internal control, the internal and external audit function, compliance with laws and regulations relating to these areas of responsibility and identification and development of strategies and actions to manage business risk.
All members of the Audit and Risk Committee are non-executive directors. It is chaired by an independent chair who is not the chairman of the board.
Principle 5: Make timely and balanced disclosure
Recommendation 5.1: Companies should establish written policies designed to ensure compliance with the ASX listing rules disclosure requirements and to ensure accountability at a senior executive level for that compliance and disclose those policies or a summary of those policies.
The Company has in place an ASX Compliance procedure which outlines the requirements to comply with the ASX listing rules disclosure requirements and to ensure accountability at senior executive level for that compliance.
The Public Officer, Company Secretary and Chief Financial Officer, A.M Knox, has been nominated as the person responsible for communications with the ASX. This role includes responsibility for ensuring compliance with the ASX listing rules and overseeing and co-ordinating information disclosure to the ASX, analysts, brokers, shareholders, secondary exchanges, the media and the public.
Principle 6: Respect the rights of shareholders
Recommendation 6.1: Companies should design a communications policy for promoting effective communication with shareholders and encouraging their participation at general meetings and disclose their policy or a summary of that policy.
The Company has established a Communications Policy for promoting effective communication with shareholders and encouraging their participation at general meetings.
The Company maintains a website which is kept up to date with all relevant announcements to the market and related information after release to the ASX. The web address is www.cuenrg.com.au.
A copy of the communications policy is available on the Company website.

23
Cue
Ener
gy R
esou
rces
Lim
ited
Annu
al R
epor
t 201
2/13
Corp
orat
e G
over
nanc
e St
atem
ent
23
The CEO and CFO state in writing to the board every financial year that the statements made by them regarding the integrity of the financial statements are founded on a sound system of risk management, internal compliance and control, which in all material respects implements the policy as adopted by the Board and that the risk management and internal compliance control to the extent that they relate to financial reporting are operating effectively and efficiently in all material respects.
Principle 8: Remunerate Fairly and Responsibly
Recommendation 8.1: The board should establish a remuneration committee.
Recommendation 8.2: The remuneration committee should be structured so that it consists of a majority of independent directors, is chaired by an independent chair and has at least two members.
The board has established a Remuneration and Nomination Committee. It consists of two non-executive members. The chair is not the chairman of the overall board.
The committee consists of:
• Paul D. Moore (Chairman)
• Andrew A. Young
Geoffrey J. King was also a member of this committee until 15 November 2012 when he stepped down to become Chairman of the full board.
The Remuneration and Nomination Committee makes recommendations to the full Board on remuneration packages and other terms and conditions of employment and reviews the composition of the Board having regard to the Company’s present and future needs.
Remuneration and other terms and conditions of employment are reviewed annually by the committee having regard to the performance and relevant comparative data. As well as a base salary, remuneration packages include superannuation, termination entitlements, fringe benefits, annual cash bonuses linked to short term performance and shares and options linked to long term Company performance.
Remuneration packages are set at levels that are intended to attract and retain high calibre staff and align the interest of the executives with those of the Company shareholders.
Recommendation 8.3: Companies should clearly distinguish the structure of non-executive director’s remuneration from that of executive directors and senior executives.
Remuneration of non-executive directors is determined by the Board within the maximum amount approved by the shareholders from time to time.
Further information on Directors and Executives remuneration is set out in the Directors’ Report and Remuneration Report on pages 24 to 36.
The Remuneration and Nomination committee charter is available on the company’s website.
Principle 7: Recognise and Manage Risk
Recommendation 7.1 Companies should establish policies for the oversight and management of material business risks and disclose a summary of those policies.
Risk recognition and management are viewed by the Company as integral to the Company’s objectives of creating and maintaining shareholder value, and to the successful execution of the Company’s strategies. The board is responsible for the overall risk management framework and has delegated to the Audit and Risk Committee the responsibility for:
• reviewing the adequacy and effectiveness of CUE’s risk management framework;
• Assisting the Board with regards to oversight of CUE’s risk management by gaining assurance that all major identified risks are being adequately managed and that mitigation practices are appropriate.
Recommendation 7.2: The Board should require management to design and implement the risk management and internal control system to manage the Company’s material business risks and report to it on whether those risks are being managed effectively. The board should disclose that management has reported to it as to the effectiveness of the Company’s management of its material business risks.
Management is responsible for designing, implementing and reporting on the adequacy of the Company’s risk management and internal control system and has to report to the Audit and Risk Committee on:
• The risk management and internal control system during the year; and
• The Company’s management of its material business risks.
Management of the Company annually perform an assessment of Company risks and identify measures to reduce the risk levels to as low as possible. A risk register for the Company is maintained to document the risks identified. The risk register is reviewed as part of the Board meetings. A risk assessment procedure is used to assess all risks when the Company is contemplating a new business venture. Should the risk profile of the Company change, the risk register will be updated to reflect this accordingly and any further controls required will be implemented.
Recommendation 7.3: The Board should disclose whether it has received assurance from the chief executive officer and the chief financial officer that the declaration provided in accordance with section 295A of the Corporations Act is founded on a sound system of risk management and internal control and that the system is operating effectively in all material respects in relation to financial reporting risks.

24
Directors’ Report
Directors
The names of Directors of the Company in office during the year and up to the date of this report were:
Geoffrey J. King (Chairman)
Paul D. Moore
Timothy E. Dibb
Andrew A. Young
Leon Musca (retired 15 November 2012)
Richard G. Tweedie (retired 25 February 2013)
Steven J. Koroknay (deceased 6 June 2013)
Chief Executive Officer
David A.J. Biggs (commenced 22 April 2013)
Chief Financial Officer/Company Secretary
Andrew M. Knox
Co-Company Secretary
Pauline M. Moffatt
Principal ActivitiesThe principal activities of the group are petroleum exploration, development and production.
Cue Energy Resources Limited (‘Cue’) is listed on the Australian Securities Exchange, the New Zealand Stock Exchange and the Port Moresby Stock Exchange. The Company has an American Depositary Receipt (ADR) program sponsored by the Bank of New York and these are traded via the OTCQX Market in the US.
Principal Place of Business
Level 21
114 William Street
Melbourne 3000
Australia
Registered Office
Level 21
114 William Street
Melbourne 3000
Australia
Dividends
No dividends were paid during the financial year or have been approved subsequent to balance date (2012: nil).
Your Directors present their report on the Company and its controlled entities (“the Group” or “consolidated entity”) for the financial year ended 30 June 2013.

25
Cue
Ener
gy R
esou
rces
Lim
ited
Annu
al R
epor
t 201
2/13
Dire
ctor
s’ R
epor
t
25
been a number of incidents that have been reported and investigated by all the relevant parties. The increased reporting is showing a growth in the reporting culture and an openness to share learnings in order to reduce risk not only within Cue Energy Resources but within the industry. Cue Energy Resources continues to monitor the progress and close out of these incidents and work with the JV partners and operators to improve overall health and safety and minimise any impact on the environment.
There have been a number of steps taken in order to improve Health, Safety and Environment (HSE) and to implement an HSE Management system that is suitable for all countries and all levels of operations that the business may wish to be involved with. The overall aim of the system is to not only meet legislative requirements but to show a true commitment to HSE for the sake of Cue Energy Resources personnel, contractors, assets and the environment.
Throughout this year, internally the HSE Management system is in effect and beginning to grow a proactive safety culture with the business in line with industry best practice. While Cue is still a relatively small business, it has in place a Management System that is fit for purpose regardless of the size of the company. The System will now be able to grow with the business.
Through ongoing commitment by both Senior Management and staff alike, this system will move Cue Energy Resources forward and will continually improve overall Health, Safety and Environmental risk to the company. This will demonstrate that Cue Energy Resources is a leader in all its current and projected fields of expertise and will give Cue Energy Resources the ability to remain competitive, whilst managing its risks to as low as reasonably practicable.
Likely developments and expected results of operations
The particular information required by Section 299(1) (e) of the Corporations Act 2001 has been omitted from the report because the Directors believe that it would result in unreasonable prejudice to the economic entity.
Review of OperationsProduction income for the year ended 30 June 2013 was $49.8 million (2012: $41.2 million).
Production and amortisation expenses totalled $36.7 million for the year (2012: $24.3 million).
Profit before income tax expense for the year was $8.4 million (2012: $13.6 million). Tax expense for the year was $2.0 million (2012: $8.0 million), resulting in profit after income tax expense of $6.4 million for the year (2012: $5.7 million).
Further information on the operations and financial position of the group and its business strategies and prospects is set out in the Chairman’s Overview and Chief Executive Officer’s Review sections of this annual report.
Significant changes in the state of affairs
During the financial year, there was no significant change in the state of affairs of the consolidated entity.
Equity and Capital Structure
Total Equity as at 30 June 2013 was $131.6 million (2012: $125.2 million). At the reporting date Cue had issued share capital of $152.4 million (2012: $152.4 million). No further shares have been issued subsequent to the reporting date.
The total number of shares on issue at 30 June 2013 was 698,119,720 (2012: 698,119,720).
Share options and Performance Rights
As at 30 June 2013 Cue had 1,600,000 performance rights on issue that had yet to be exercised (2012: 3,200,000).
Environmental Regulation
Within the last year there have been zero incidents, zero lost time injuries and zero significant spills within Cue Energy Resources. Among the joint venture operations there have
Directors Meetings, Qualifications and Experience
The following table sets out the number of meetings of the Board of Directors held during the year and the number of meetings attended by each Director.
Board Audit and Risk CommitteeRemuneration and
Nomination Committee
Held Attended Held Attended Held Attended
Geoffrey J. King 13 13 1 1 1 1
Timothy E. Dibb 13 13 2 2 - -
Paul D. Moore 13 11 - - 1 1
Andrew A. Young 13 12 - - 1 1
Leon Musca(i) 9 9 1 1 - -
Richard G. Tweedie(ii) 10 6 - - - -
Steven J. Koroknay(iii) 13 13 2 2 - -
(i) Leon Musca (retired 15 November 2012)
(ii) Richard G. Tweedie (retired 25 February 2013)
(iii) Steven J. Korokany (deceased 6 June 2013)
Held: represents the number of meetings held during the time the director held office or was a member of the relevant committee.

26
Information on directors and executives, including qualifications and experience is as follows:
Directors Qualifications and Experience Special Responsibilities
Particulars of Directors’ Interests in shares of Cue
Energy Resources Limited at the date of this report
Direct Indirect
G.J. King BA, LL.BNon-Executive Chairman – Phoenix Oil and Gas Limited (ii)
-Appointed 17 December 2008Non-Executive Chairman of Cue Energy Resources Limited(i)
-Appointed 24 November 2011
Non-Executive Chairman Board of DirectorsMember of Audit and Risk CommitteeMember of Remuneration and Nomination Committee (until 15 November 2012)
20,000 2,500
P.D. Moore(iii) BSc-Civil Eng, MBADirector of Otto Energy Limited(i)
-Appointed 1 July 2009 -Resigned 1 July 2011Non-Executive Director of Cue Energy Resources Limited(i)
-Appointed 24 November 2011
Non-Executive DirectorChairman of Remuneration and Nomination Committee
Nil Nil
T.E. Dibb BSc, PhD, Dip M’gmtNon-Executive Director of Cue Energy Resources Limited(i) -Appointed 24 November 2011
Non-Executive DirectorChairman of the Audit and Risk Committee
Nil Nil
A.A. Young BE (Chemical Engineering), MBA (Hons)Non-Executive Director of National Safety Council of Australia Limited(ii)
-Appointed March 2009Non-Executive Director of Cliq Energy Berhad(ii) -Appointed May 2012 -Resigned 31 March 2013 -Re-appointed June 2013Non-Executive Chairman of Real Energy Corporation Limited(ii)
-Appointed 1 July 2012 -Resigned 31 March 2013Non-Executive Director of New Guinea Energy Limited(i) -Appointed 20 October 2010 Non-Executive Director of Cue Energy Resources Limited(i)
-Appointed 13 December 2011Non-Executive Chairman of Galilee Energy Limited -Appointed 19 August 2013(i)
Non-Executive DirectorMember of Remuneration and Nomination CommitteeActing CEO/Executive Director 14 November 2012 to 21 April 2013
Nil 150,000
L. Musca LL.BBarrister and SolicitorNon-Executive Director of Cue Energy Resources Limited(i)
-Appointed 17 November 1999 -Retired 15 November 2012
Non-Executive Director Member of Audit and Risk Committee (until 15 November 2012)
1,628,572(iv) 11,142,655(iv)
R.G. Tweedie LL.BDirector of Todd Petroleum MiningCompany Limited(ii)
-Appointed 4 September 1987 -Retired 31 December 2010Non-Executive Director of Cue Energy Resources Limited -Appointed 16 July 2001 -Retired 26 February 2013
Non-Executive Director 568,784(iv) 3,363,477(iv)

27
Cue
Ener
gy R
esou
rces
Lim
ited
Annu
al R
epor
t 201
2/13
Dire
ctor
s’ R
epor
t
27
Information on directors and executives, including qualifications and experience is as follows:
Directors Qualifications and Experience Special Responsibilities
Particulars of Directors’ Interests in shares of Cue
Energy Resources Limited at the date of this report
Direct Indirect
S.J. Koroknay BE(Hons)-Civil Eng (Sydney), FAICD, FIEANon-Executive Director Innamincka Petroleum Limited(i)
-Appointed 15 May 2008 -Resigned 24 June 2011Non-Executive Chairman Galilee Energy Limited(i)
-Appointed 20 January 2009 -Deceased 6 June 2013Non-Executive Director Metgasco Limited(i)
-Appointed 20 January 2010 -Deceased 6 June 2013Non-Executive Director Cue Energy Resources Limited(i)
-Appointed 9 October 2009 -Deceased 6 June 2013
Non-Executive Director Member of Audit and Risk Committee (until 6 June 2013)
50,000(iv) 200,000(iv)
Executives Qualifications and Experience Special Responsibilities Direct Indirect
D.A.J. Biggs LL.B Chief Executive Officer -Appointed 22 April 2013
8,045 -
A.M. Knox B.Com, CA, CPA, FAICDDirector of Rimfire Pacific Mining NL(i)
-Appointed 8 July 2005(i) -Resigned 31 March 2011Director of Axis Mining NL(ii)
-Appointed 8 July 2005 -Resigned 31 March 2011
Chief Financial Officer Company Secretary
2,321,007 2,137,245
D.B. Whittam BSc, MSc Exploration Manager -Appointed 18 June 2012
Nil Nil
M.J Paton B.SC (Hons), MIChemE Chief Executive OfficerAppointed 8 February 2011Resigned 14 November 2012
Nil(iv) 1,492,881(iv)
(i) Refers to ASX listed directorships held over the past three years.
(ii) Refers to unlisted public company directorships held over the past three years.
(iii) P.D. Moore is an employee of the Todd Group of Companies which hold 189,023,314 shares in Cue Energy Resources Limited.
(iv) As at date of ceasing to be a director or executive.
Qualifications and Experience Special Responsibilities Direct Indirect
P.M. Moffatt B. Com, CSA(Cert) Co Company Secretary -Appointed 31 May 2013
114,645 Nil
No shares in subsidiary companies are held by the Directors and no remuneration or other benefits were paid or are due and payable by subsidiary companies. No share options are held in the company by Directors or Executives. Performance Rights held by Executives are detailed in the Remuneration Report.

28
(B) Remuneration Policy
The Board’s policy for remuneration of Executives and Directors is detailed below.
Remuneration packages are set at levels that are intended to attract and retain high calibre directors and employees and align the interest of the Directors and Executives with those of the company’s shareholders. The Remuneration policy is established and implemented solely by the Remuneration and Nomination Committee which is comprised of Non-Executive Directors only.
Remuneration and other terms and conditions of employment are reviewed annually by the Remuneration and Nomination Committee having regard to performance and relevant employment market information. As well as a base salary, remuneration packages include superannuation, annual incentive plan cash bonuses, termination entitlements, fringe benefits and share based incentives in the form of share options or performance rights. From 1 July 2011, the company has implemented a Performance Rights Plan as the primary share based incentive for services provided from that date. The Performance Rights Plan is described under heading D Equity Based Remuneration.
Performance measures and targets applicable to the award of performance rights and annual cash bonuses will be established by the board on an annual basis.
The Board is conscious of its responsibilities in relation to the performance of the Company. Directors and Executives are encouraged to hold shares in the Company to align their interests with those of shareholders.
No remuneration or other benefits are paid to Directors or Executives by any subsidiary companies.
(C) Details of Remuneration
The structure of non-executive Director and Executive remuneration is separate and distinct.
Non-Executive Directors
Remuneration of Non-Executive Directors is determined by the Board within the maximum amount approved by the shareholders from time to time. The amount currently approved is $700,000, which was approved at the Annual General Meeting held on 24 November 2011. The Company’s policy is to remunerate Non-Executive Directors at a fixed fee based on their time involvement, commitment and responsibilities. Remuneration for Non-Executive Directors is not linked to individual or company performance, however, to align Directors’ interests with shareholders’ interests, Non-Executive Directors are encouraged to hold shares in the Company. The Board retains the discretion to award options or performance rights to Non-Executive Directors based on the recommendation of the Remuneration and Nomination Committee, which is always subject to shareholder approval.
Remuneration Report (Audited)This Remuneration Report which has been audited, and which forms part of the Directors’ Report, sets out information about the remuneration of Cue Energy Resources Limited’s Directors and its senior management for the financial year ended 30 June 2013, in accordance with the Corporations Act 2001 and its regulations.
The prescribed details for each person covered by this report are detailed below under the following headings:
(A) Director and Executive Details
(B) Remuneration Policy
(C) Details of Remuneration of Directors and Executives
(D) Equity Based Remuneration
(E) Relationship between Remuneration Policy and Company Performance
(A) Director and Executive Details
The following persons acted as Directors of the company during or since the end of the financial year:
G.J. King (Non-Executive Chairman)
T.E. Dibb (Non-Executive Director)
P.D. Moore (Non-Executive Director)
A.A. Young (Non-Executive Director)
L. Musca (Non-Executive Director – retired 15 November 2012)
R.G. Tweedie (Non-Executive Director – retired 25 February 2013)
S.J. Koroknay (Non-Executive Director – deceased 6 June 2013)
The term “Key Management Personnel” is used in this Remuneration Report to refer to the following persons:
D.A.J. Biggs (Chief Executive Officer – commenced 22 April 2013)
A.M. Knox (Chief Financial Officer/Company Secretary)
D.B. Whittam (Exploration Manager)
M.J. Paton (Chief Executive Officer – resigned 14 November 2012)
A.B. Parks (Chief Commercial Officer – resigned 30 August 2012)
Unless otherwise stated the persons named above held their current position for the whole of the financial year and since the end of the financial year.

29
Cue
Ener
gy R
esou
rces
Lim
ited
Annu
al R
epor
t 201
2/13
Dire
ctor
s’ R
epor
t
29
Executives
Executives receive a mixture of fixed and variable pay and a blend of short and long term incentives as appropriate. Remuneration packages contain the following key elements:
• Fixed compensation component inclusive of base salary, superannuation and non-monetary benefits.
• Short term incentive programme incorporating performance based cash bonuses.
• Superannuation.
• Long term incentives incorporating share based payments including performance rights (from 1 July 2011) and share options granted as long term performance incentives or in lieu of services.
The award of long term incentives, such as share options and performance rights ensures that the total compensation package awarded to executives matches the stage of development of the Company at a given point in time. The grant of share options or performance rights is designed to recognise and reward the efforts of executives as well as to provide additional incentive. These grants may be subject to the successful completion of performance hurdles. Executives are prohibited from entering into transactions or arrangements which limit the economic risk of participating in unvested entitlements.
The Remuneration and Nomination Committee is responsible for determining and reviewing remuneration arrangements. The Remuneration and Nomination Committee assesses the appropriateness of the nature and amount of remuneration of executives on a periodic basis, by reference to relevant employment market conditions, with the overall objective of ensuring maximum stakeholder benefit from the retention of a high quality, high performing Director and executive team. The charter adopted by the Remuneration and Nomination Committee aims to align rewards with achievement of strategic objectives and creation of shareholder wealth.
Fixed compensation
Fixed compensation consists of base salary (which is calculated on a total cost base and including any FBT charges related to employee benefits including motor vehicles), as well as employer contributions to superannuation funds.
The base salary is reflective of market rates for companies of similar size and industry which is reviewed annually to ensure market competitiveness. During 2013, the Remuneration and Nomination Committee reviewed the salaries paid to peer company executives in determining the salary of Cue’s Key Management Personnel. This base salary is fixed remuneration and is not subject to performance of the company. Base salary is reviewed annually and adjusted as determined by the Remuneration and Nomination Committee on 1 January each year. There is no guaranteed base salary increase included in any executive’s contracts.
Short term incentives
The Board, at its sole discretion, may elect to pay short term incentives in the form of performance based cash bonuses to executives based on the recommendation of the Remuneration and Nomination Committee. Any payment of short term incentives is dependent on the achievement of performance targets as determined by the Board. These targets shall include a combination of key strategic, financial and personal performance measures which have major influence over company performance in the short term. Short term incentive payments may also be made at the discretion of the Board to reward an executive’s participation in ad-hoc projects or activities. Short term incentives, in the form of performance based cash bonuses, were granted post year end for the 30 June 2013 financial year.
Long term incentives
The Board implemented a Performance Rights Plan effective from 1 July 2011. The Remuneration and Nomination Committee recommends the grant of performance rights as incentives for its executives, to maintain their long term commitment to the Company. The use of long term incentives is considered a valuable means of aligning the interest of shareholders and the individuals to whom such long term incentives are provided. It also provides the Remuneration and Nomination Committee with a range of incentives to attract and retain key management, including executives. The number of share options or performance rights granted and their terms and conditions are determined by the Board and defined in the Performance Rights Plan Rules and can be adjusted to reflect specific performance hurdles (as discussed below) in order to best match such awards with the actual circumstances of the Company at a given point in time.

30
During the year ended 30 June 2013, 3.2 million Performance Rights were granted to executives (for services provided from 1 July 2012):
Vesting Date Vesting Target D.B. Whittam A. M. Knox M.J. Paton(iii)
2013 Performance Rights Issue
Expire 30 June 2014 if not vested
ASX 0.60 cents 800,000 800,000 1,600,000
The Performance Rights granted, during the year, and outstanding at year end, will vest as ordinary shares on 30 June 2014 if the volume weighted average share price in Cue Energy Resources Limited quoted on ASX increases, for thirty consecutive days, to 60 cents per share from 1 July 2013 to 30 June 2014. If the price target is not met the Performance Rights lapse. Employees receiving Performance Rights must also be employees on the vesting date or these rights will lapse.
During the year ended 30 June 2012, 4 million Performance Rights were granted to executives (for services provided from 1 July 2011):
Vesting Date Vesting Target M.J. Paton(iii) A.M. Knox A.B. Parks(i) T. White(ii)
2011 Performance Rights Issue
Expire 30 June 2013 if not vested
ASX 0.53 cents 1,600,000 800,000 800,000 800,000
(i) A.B. Parks resigned 30 August 2012 and all performance rights outstanding lapsed.
(ii) T. White retired 17 May 2012 and all performance rights outstanding lapsed.
(iii) M. Paton resigned 14 November 2012 and all performance rights outstanding lapsed.
All 2011 Performance Rights issued have lapsed or expired.
Post employment benefits
The Company makes superannuation contributions for the Australian based employees and directors as required by law.
Employment contracts
Remuneration and other terms of employment for D.A.J. Biggs and D.B. Whittam is formalised in a service agreement. Details of the agreement are as follows:
D.A.J. Biggs
Title: Chief Executive Officer
Agreement commenced: 22 April 2013
Details: Base salary of $450,000 plus statutory superannuation to be reviewed annually by the Remuneration and Nomination Committee. 6 months termination notice by either party and eligible to receive a discretionary short term incentive as per Remuneration and Nomination Committee approval and KPI achievement. Eligible for Long Term Incentive Program. Non solicitation and non compete clauses included.
D.B. Whittam
Title: Exploration Manager
Agreement commenced: 18 June 2012
Details: Base salary of $420,000 including superannuation to be reviewed annually by the Remuneration and Nomination Committee. 3 months termination notice by either party and eligible to receive a short term incentive up to 50% of base salary as per Remuneration and Nomination Committee approval and KPI achievement. Eligible for Long Term Incentive Program. Non solicitation and non compete clauses included.
No other Key Management Personnel at present has a service contract. Employment letters outline the components of compensation paid to other Key Management Personnel but does not prescribe how compensation levels are modified year to year. Compensation levels are reviewed each year to take into account cost of living changes, any change in the scope of the role performed and any changes to meet the principles of the compensation policy.
Details of the nature and amount of each major element of remuneration of each Director of the Company and other Key Management Personnel of the consolidated entity are:

31
Cue
Ener
gy R
esou
rces
Lim
ited
Annu
al R
epor
t 201
2/13
Dire
ctor
s’ R
epor
t
31
Compensation of Key Management Personnel – 2013:
2013 Short-Term Post Employment
Name
Cash Salary and
Fees $
Non Monetary Benefits (i)
$
Super- annuation
$
Performance Rights (ii)
$Total
$
Non-Executive Directors
G.J. King 104,800 - - - 104,800
T.E. Dibb 98,000 - 25,000 - 123,000
P.D. Moore 100,000 - - - 100,000
A.A. Young(ix) 386,500 - - - 386,500
L. Musca(iii) 37,500 - - - 37,500
R.G. Tweedie(iv) 65,862 - - - 65,862
S.J. Koroknay(v) 85,695 - 7,712 - 93,407
Total 878,357 - 32,712 - 911,069
Other Key Management Personnel
D.A.J. Biggs(vi) 83,159 - 6,249 - 89,408
A.M. Knox 324,679 25,060 25,000 11,200 385,939
D.B. Whittam 403,336 - 16,664 11,200 431,200
M.J. Paton(vii) 616,919 - 6,865 - 623,784
A.B. Parks(viii) 284,402 - 2,746 - 287,148
Total 1,712,495 25,060 57,524 22,400 1,817,479
Total remuneration of Executives and Directors 2,590,852 25,060 90,236 22,400 2,728,548
(i) Non performance based salary sacrifice benefits, including motor vehicle expenses.
(ii) See note 22 for more information.
(iii) L Musca retired 15 November 2012.
(iv) R.G. Tweedie retired 25 February 2013.
(v) S.J. Koroknay deceased 6 June 2013.
(vi) D.A.J. Biggs commenced 22 April 2013.
(vii) M.J. Paton resigned 14 November 2012.
(viii) A.B. Parks resigned 30 August 2012.
(ix) A.A. Young was acting CEO/Executive Director 14 November 2012 to 21 April 2013.

32
Compensation of Key Management Personnel – 2012:
2012 Short-Term Post Employment
Name
Cash Salary and
Fees $
Non Monetary Benefits (i)
$
Super- annuation
$
Share Purchases (ii)
$
Performance Rights (iii)
$Total
$
Non-Executive Directors
R.G. Tweedie - - - 100,000 - 100,000
T.E. Dibb 60,326 - - - - 60,326
G.J King 60,326 - - - - 60,326
S.J. Koroknay 68,807 - 31,193 - - 100,000
P.D. Moore 60,326 - - - - 60,326
L. Musca 100,000 - - - - 100,000
A.A. Young 55,163 - - - - 55,163
Total 404,948 - 31,193 100,000 - 536,141
Other Key Management Personnel
M.J. Paton 368,121 - 50,000 - 22,400 440,521
A.M. Knox 281,940 42,918 50,000 - 11,200 386,058
A.B. Parks(iv) 409,224 - 15,204 - - 424,428
T. White(v) 200,970 - 45,837 - - 246,807
D.B. Whittam(vi) 15,547 - 607 - - 16,154
Total 1,275,802 42,918 161,648 - 33,600 1,513,968
Total Remuneration of Executives and Directors 1,680,750 42,918 192,841 100,000 33,600 2,050,109
(i) Non performance based salary sacrifice benefits, including motor vehicle expenses.
(ii) Shares purchased on market (refer Directors Saving Plan below).
(iii) Performance Share Rights granted see note 22.
(iv) A.B. Parks resigned 30 August 2012.
(v) T White retired 17 May 2012.
(vi) D.B. Whittam commenced 18 June 2012.
All remuneration paid to D.A.J. Biggs, A.M. Knox and D.B. Whittam is incurred by the parent entity.
A.M. Knox is a Director of all the subsidiaries in the Group and an Executive of the parent company.
Fixed remuneration At risk – STI At risk - LTI
Name 2013 2012 2013 2012 2013 2012
Non-Executive Directors:
G.J. King 100% 100% - - - -
T.E. Dibb 100% 100% - - - -
P.D. Moore 100% 100% - - - -
A.A. Young 100% 100% - - - -
S.J. Koroknay 100% 100% - - - -
R.G. Tweedie 100% 100% - - - -
L. Musca 100% 100% - - - -
Other Key Management Personnel:
D.A.J. Biggs 100% - - - - -
A.M. Knox 98% 97% - - 2 3
D.B. Whittam 98% 100% - - 2 -
M.J. Paton 100% 95% - - - 5
A.B. Parks 100% 100% - - - -

33
Cue
Ener
gy R
esou
rces
Lim
ited
Annu
al R
epor
t 201
2/13
Dire
ctor
s’ R
epor
t
33
(D) Equity Based Remuneration
Overview of Share Options and Performance Rights
For services provided from 1 July 2012, the Company has granted 3.2 million Performance Rights to certain Key Management Personnel as detailed above. These Performance Rights were granted under a Performance Rights Plan which was approved by shareholders at the Company’s Annual General meeting on 24 November 2011. The Performance Rights Plan is a mechanism for providing a share based performance incentive for Key Management Personnel and to achieve alignment between Key Management Personnel and Shareholder objectives. Options were previously granted to the Executives as part of their remuneration as approved by the Directors. Options granted were not related to a specific performance condition. Options were granted to reward key management personnel for their contribution to achieving specific milestones.
Performance rights and share options are granted under the plan for no consideration, neither carry dividend or voting rights. No share options were granted during the financial year to 30 June 2013 (2012: Nil), and performance rights were issued as in note 22.
Performance rights over shares in Cue Energy Resources Limited granted during the 30 June 2013 financial year were granted under the Cue Energy Resources Ltd Performance Rights Plan (“Plan”) for services provided from 1 July 2012 as approved by the Board on 28 September 2012. The performance rights were granted under the Company’s Performance Rights Plan which was approved by shareholders at the Annual General Meeting on 24 November 2011.
The Plan is designed to align the interests of executives with shareholders by providing direct participation in the benefits of future Company performance over the medium to long term. It is contemplated that Performance rights will be granted to Key Management Personnel on an annual basis. Non Executive Directors will not be eligible to participate in the 2013/14 Plan.
Long term performance targets of the Company will be established every year and the future award of performance rights may be made at the Board’s sole discretion.
Performance Rights – 30 June 2013 Financial Year
Performance rights granted to Executives during the 30 June 2013 financial year, that have not lapsed, for services provided from 1 July 2012 were:
Grant Date Expiry Date Vesting Date A.M. Knox D.B. Whittam
2012/2013 Performance Rights Issue
28/09/2012 Expire 30 June 2014 if not vested
Target ASX 60 cents(i)
800,000 800,000
(i) The performance rights granted vest as ordinary shares on 30 June 2014 if a 30 day volume weighted average share price in Cue Energy Resources Ltd quoted on the ASX increases to 60 cents per share for the period 1 July 2013 to 30 June 2014. On 30 June 2013 the share price for Cue Energy Resources Limited ordinary shares on the ASX was 11 cents per share. If the ASX Price Target is not met the Performance Rights lapse. Executives receiving performance rights must also be employees on the vesting date or the rights will lapse.
Performance rights granted to Executives during the 30 June 2012 financial year for services provided from 1 July 2011 were:
Grant Date Expiry Date Vesting
Date M.J. Paton A.M. Knox A.B. Parks T. White
2011 Performance Rights Issue 24/11/2011
Expire 30 June 2013 if not vested
Target ASX
53 cents(i) 1,600,000 800,000 800,000 800,000
(i) The performance rights granted vest as ordinary shares on 30 June 2013 if a 30 day volume weighted average share price in Cue Energy Resources Ltd quoted on the ASX increases to 60 cents per share for the period 1 July 2012 to 30 June 2013. On 30 June 2012 the share price for Cue Energy Resources Limited ordinary shares on the ASX was 18 cents per share. If the ASX Price Target is not met the Performance Rights lapse. Executives receiving performance rights must also be employees on the vesting date or the rights will lapse. All Performance Rights granted during 2011 have lapsed or expired.
Following exercise of a performance right, the Company must issue or transfer to the person exercising the performance right the number of shares in respect of which the performance right has been exercised and credited as fully paid. All shares issued or transferred to a participant under this Plan, will, from the date of issue or transfer, rank equally with all other issued shares. Once rights have vested as shares in the company 50% of the shares may be sold on vesting but 50% must be held by the participant for a period of 12 months.
Participants will not be required to make any payment for the grant of the performance rights or on the exercise of a vested performance right.

34
The following performance rights granted to key management personnel of the Company lapsed during the year as a result of a failure to meet a vesting condition (including employment conditions):
Participant TrancheNumber of Performance
Rights Lapsed Value at lapse date*
A.M. Knox 2011/2012 Plan 800,000 88,000
M.J. Paton(i) 2012/2013 Plan 1,600,000 224,000
M.J. Paton(i) 2011/2012 Plan 1,600,000 224,000
T. White(iii) 2011/2012 Plan 800,000 184,000
A.B. Parks(ii) 2011/2012 Plan 800,000 128,000
(i) M.J. Paton resigned 14 November 2012.
(ii) A.B. Parks resigned 30 August 2012.
(iii) T. White retired 17 May 2012
* The value is determined at the date of lapsing using the closing share price on the date of lapse multiplied by the number of Performance Rights assuming the condition was satisfied. The performance rights lapsed due to the resignation of an employee or vesting conditions not being met.
The performance hurdles for the grant of performance rights under the Plan to participants, as described above, are classified as market-based hurdles. In determining the value of the performance rights granted to participants, a risk based statistical analysis was used that took into account, as at the grant date, the following variables and assumptions:
• Expected life of the instrument – the performance rights will expire on 30 June 2014 should they not be exercised.
• Share price of the underlying share on grant date of 14 cents.
• Expected volatility – the price volatility of the shares was approximately 45%.
• Expected dividends – there was no dividends presently expected to be paid in respect of the underlying shares.
• The risk free interest rate for the expected life of the instrument – the average risk free interest rate at grant date was 3%.
On the basis the implied value of the 2012/2013 performance rights was 0.28 cents per right. The implied value (share based payment charge) of the performance rights that could vest in the future are:
Grant Date Expiry Date Vesting Date A.M. Knox D.B. Whittam
2012/2013 Performance Rights Issue
28/09/2013 Expire 30 June 2014 if not vested
Target ASX 60 cents
800,000 800,000
30 June 2013 financial year $11,200 $11,200
30 June 2014 financial year $11,200 $11,200
Total $22,400 $22,400
Directors Savings Plan
Pursuant to the Directors Savings Plan, Directors can purchase through an appointed trustee, Cue Energy Resources Limited, shares on market in lieu of being paid Directors fees in cash.
No ordinary shares were purchased for the Directors as part of the Plan during the current financial year (2012: $100,000).

35
Cue
Ener
gy R
esou
rces
Lim
ited
Annu
al R
epor
t 201
2/13
Dire
ctor
s’ R
epor
t
35
(E) Relationship Between Remuneration Policy and Company Performance
Company Performance Review
The tables below set out summary information about the company’s earnings and movements in shareholder wealth and key management remuneration for the five years to 30 June 2013.
Profit Performance30 June 2013
$000’s30 June 2012
$000’s30 June 2011
$000’s30 June 2010
$000’s30 June 2009
$000’s
Production Income 49,798 41,222 52,506 54,700 30,445
Profit/(loss) before income tax expense 8,409 13,621 25,761 39,351 (20,905)
Profit/(loss) after income tax expense 6,369 5,663 19,107 27,510 (24,958)
Total Key Management Personnel Remuneration 2,729 2,050 2,237 963 970
Share Performance 30 June 2013 30 June 2012 30 June 2011 30 June 2010 30 June 2009
Share price at start of year (cents) 18.0 26.5 25.0 14.5 22.5
Share price at end of year (cents) 11.0 18.0 26.5 25.0 14.5
Dividends (cents) - - - - -
Basic earnings/(loss) per share (cents) 0.91 0.81 2.7 4.0 (4.0)
Diluted earnings/(loss) per share (cents) 0.91 0.81 2.7 4.0 (4.0)
The company’s remuneration policy seeks to reward staff members for their contribution to adding shareholder value so there is a direct link between a portion of remuneration and company share price or financial performance.
This concludes the Remuneration Report which has been audited.

36
Directors’ Insurance and Indemnification of Directors and Auditors
During the financial year, the company paid a premium in respect of a contract insuring the directors of the company, the company secretary, and all executive officers of the company against a liability incurred as a director, company secretary or executive officer to the extent permitted by the Corporations Act 2001. In accordance with commercial practice, the insurance policy prohibits disclosure of the terms of the policy, including the nature of the liability insured against and the amount of the premium.
The company has not otherwise, during or since the end of the financial year indemnified or agreed to indemnify an officer or auditor of the company or any related body corporate against a liability incurred as an officer or auditor.
Matters subsequent to the end of the financial year
The Company wishes to advise that production from the Maari field will be deferred until December 2013 to effect repairs to the facilities. The costs of the repairs are yet to be finalised, but it is expected that some of the costs will be covered by insurance. Cue’s share of deferred production while the vessel is out of service is estimated to be 50,000 boe, or 5.3% of Cue’s production for the year to 30 June 2013.
Apart from the above, the Directors are not aware of any matter or circumstance since the end of the financial year, not otherwise dealt with in this report that has significantly or may significantly affect the operations of Cue Energy Resources Limited, the results of those operations or the state of affairs of the Company or Group.
Proceedings on behalf of the company
No person has applied to the Court under section 237 of the Corporations Act 2001 for leave to bring proceedings on behalf of the company, or to intervene in any proceedings to which the company is a party for the purpose of taking responsibility on behalf of the company for all or part of those proceedings.
On behalf of the Board
Geoffrey J. King
Chairman
26th September 2013
AuditorIn accordance with the provisions of the Corporations Act 2001 the Company’s auditor, BDO East Coast Partnership, continues in office.
Non-audit Services
The Company may decide to employ the auditor on assignments additional to its statutory audit duties where the auditor’s expertise and experience with the Company are important.
The Board of Directors has considered the position and is satisfied that the provision of the non-audit services is compatible with the general standard of independence for auditors imposed by the Corporations Act 2001. The Directors are satisfied that the provision of non-audit services by the auditor as set out below, did not compromise the audit independence requirement, of the Corporations Act 2001, based on advice received from the Audit and Risk Committee, for the following reasons:
• All non-audit services have been reviewed by the Board to ensure they do not impact the impartiality and objectivity of the auditor.
• None of the services undermine the general principle relating to auditor independence as set out in the Code of Ethics for Professional Accountants, including reviewing or auditing the auditor’s own work, acting in a management or a decision making capacity for the Company, acting as advocate for the Company or jointly sharing economic risk and reward.
Audit Services
2013 $
2012 $
Audit and review of financial reports 84,000 81,000
Non-Audit Services
Tax compliance services including review of tax accounting, tax returns and tax advice regarding tax losses 36,950 39,250
Total 120,950 120,250
Independence Declaration
A copy of the auditor’s independence declaration as required under section 307C of the Corporations Act 2001, is set out on page 37.
Rounding Off of Amounts
The Company is a company of the kind referred to in ASIC Class Order 98/100, dated 10 July 1998, and in accordance with the Class Order amounts in the directors’ report and the financial report are rounded off to the nearest thousand dollars, unless otherwise indicated.

37
Cue
Ener
gy R
esou
rces
Lim
ited
Annu
al R
epor
t 201
2/13
37
Dire
ctor
s’ R
epor
t / In
depe
nden
ce D
ecla
ratio
n

38
The directors of Cue Energy Resources Limited declare that:
(a) in the Directors’ opinion the financial statements and notes and the Remuneration report in the Directors’ Report set out on pages 28 to 35, are in accordance with the Corporations Act 2001, including:
(i) giving a true and fair view of the consolidated entity’s financial position as at 30 June 2013 and of its performance, for the financial year ended on that date; and
(ii) complying with Australian Accounting Standards (including the Australian Accounting Interpretations) and Corporations Regulations 2001.
(b) the financial report also complies with International Financial Reporting Standards as disclosed in note 1; and
(c) there are reasonable grounds to believe that the company will be able to pay its debts as and when they become due and payable.
The Directors have been given the declarations required by Section 295A of the Corporations Act 2001 by the Chief Executive Officer and Chief Financial Officer for the financial year ended 30 June 2013.
Signed in accordance with a resolution of the Directors.
Dated in Melbourne 26th day of September 2013
Geoffrey J. King
Chairman
Cue Energy Resources LimitedDirectors’ Declaration

39
Cue
Ener
gy R
esou
rces
Lim
ited
Annu
al R
epor
t 201
2/13
Fina
ncia
l Rep
ort 2
012/
13
39
Cue Energy Resources LimitedFinancial Report 2012/13for the financial year ended 30 June 2013
Photo courtesy of OMV

40
Note
2013 $000’s
2012 $000’s
Production income 3 49,798 41,222
Production costs 4 (19,131) (13,778)
Gross profit from production 30,667 27,444
Other income 3 160 274
Amortisation of production properties 4 (17,520) (10,500)
Interest expense 4 (3) (84)
Net realised gain on oil hedge derivatives 3 - 158
Net foreign currency exchange gain 3 3,702 2,616
Other expenses 4 (8,597) (6,287)
Profit before income tax expense 8,409 13,621
Income tax expense 6 (2,040) (7,958)
Profit after income tax expense for the year 6,369 5,663
Other comprehensive income for the year, net of tax - -
Total comprehensive income for the year 6,369 5,663
Profit for the year is attributable to:
Owners of Cue Energy Resources Limited 6,369 5,663
Total comprehensive income for the year is attributable to:
Owners of Cue Energy Resources Limited 6,369 5,663
Basic earnings per share (cents) 20 0.91 0.81
Diluted earnings per share (cents) 20 0.91 0.81
The accompanying notes form part of and are to be read in conjunction with these Financial Statements.
Consolidated Statement of Profit or Loss and Other Comprehensive Income for the financial year ended 30 June 2013
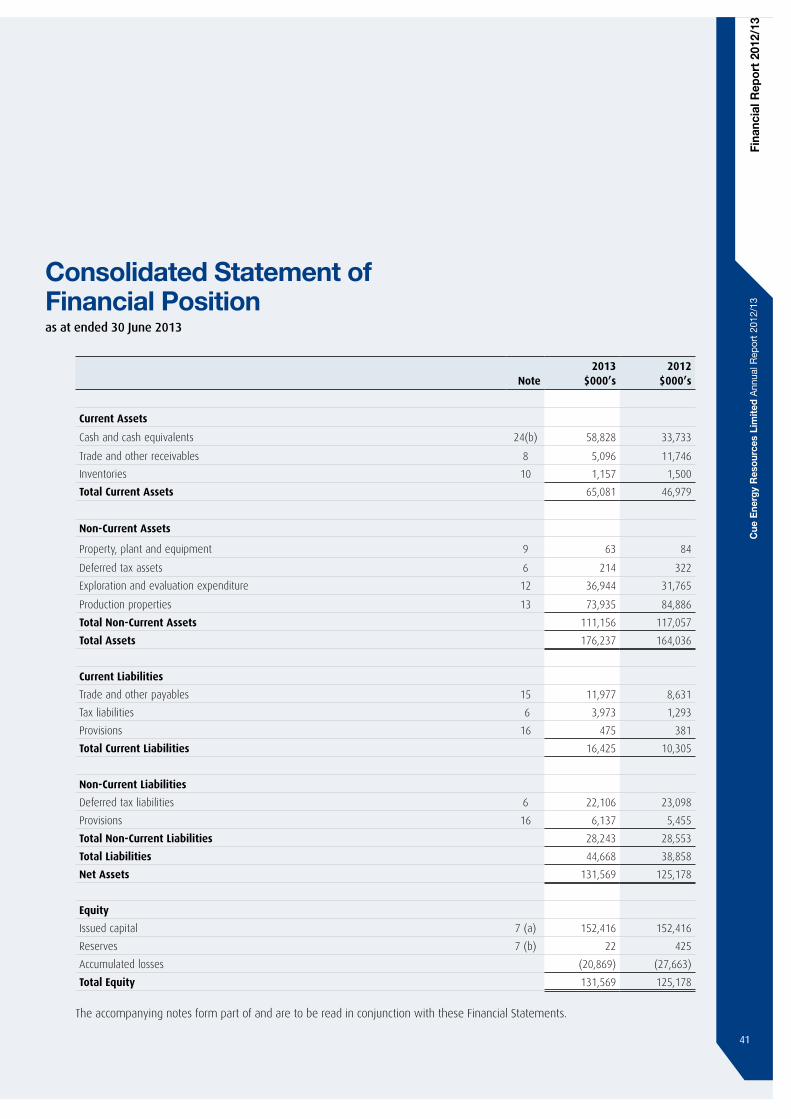
41
Cue
Ener
gy R
esou
rces
Lim
ited
Annu
al R
epor
t 201
2/13
Fina
ncia
l Rep
ort 2
012/
13
41
Note
2013 $000’s
2012 $000’s
Current Assets
Cash and cash equivalents 24(b) 58,828 33,733
Trade and other receivables 8 5,096 11,746
Inventories 10 1,157 1,500
Total Current Assets 65,081 46,979
Non-Current Assets
Property, plant and equipment 9 63 84
Deferred tax assets 6 214 322
Exploration and evaluation expenditure 12 36,944 31,765
Production properties 13 73,935 84,886
Total Non-Current Assets 111,156 117,057
Total Assets 176,237 164,036
Current Liabilities
Trade and other payables 15 11,977 8,631
Tax liabilities 6 3,973 1,293
Provisions 16 475 381
Total Current Liabilities 16,425 10,305
Non-Current Liabilities
Deferred tax liabilities 6 22,106 23,098
Provisions 16 6,137 5,455
Total Non-Current Liabilities 28,243 28,553
Total Liabilities 44,668 38,858
Net Assets 131,569 125,178
Equity
Issued capital 7 (a) 152,416 152,416
Reserves 7 (b) 22 425
Accumulated losses (20,869) (27,663)
Total Equity 131,569 125,178
The accompanying notes form part of and are to be read in conjunction with these Financial Statements.
Consolidated Statement of Financial Position as at ended 30 June 2013

42
Consolidated Statement of Changes in Equity for the financial year ended 30 June 2013
Issued Capital $’000
Accumulated Losses $’000
Share-based Payments
Reserve $’000
Total $’000
Balance at 1 July 2012 152,416 (27,663) 425 125,178
Profit after income tax expense for the year - 6,369 - 6,369
Other comprehensive income for the year, net of tax - - - -
Total comprehensive income for the year - 6,369 - 6,369
Transactions with the owners in their capacity as owners:
Share based payments - 425 (403) 22
Balance at 30 June 2013 152,416 (20,869) 22 131,569
Issued Capital $’000
Accumulated Losses $’000
Share-based Payments
Reserve $’000
Total $’000
Balance at 1 July 2011 151,768 (33,326) 391 118,833
Profit after income tax expense for the year - 5,663 - 5,663
Other comprehensive income for the year, net of tax - - - -
Total comprehensive income for the year - 5,663 - 5,663
Transactions with the owners in their capacity as owners:
Share based payments - - 34 34
Contributions of equity, net of transaction costs 648 - - 648
Balance at 30 June 2012 152,416 (27,663) 425 125,178
The accompanying notes form part of and are to be read in conjunction with these Financial Statements.

43
Cue
Ener
gy R
esou
rces
Lim
ited
Annu
al R
epor
t 201
2/13
Fina
ncia
l Rep
ort 2
012/
13
43
Note
2013 $000’s
2012 $000’s
Cash Flows From Operating Activities
Receipts from customers 58,127 41,548
Interest received 149 266
Payments to suppliers and employees (23,420) (20,585)
Income taxes paid (244) (8,257)
Royalties paid (1,880) (1,191)
Interest paid (3) (52)
Net Cash Provided by Operating Activities 24(a) 32,729 11,729
Cash Flows From Investing Activities
Payments for exploration and evaluation expenditure (4,932) (13,156)
Payments for production properties (5,905) (22,190)
Proceeds on sale of exploration tenements - 7,407
Payments for property, plant and equipment (18) (55)
Net Cash Used In Investing Activities (10,855) (27,994)
Cash Flows From Financing Activities
Proceeds from issue of shares - 648
Repayment of borrowings - (5,086)
Net Cash Used In Financing Activities - (4,438)
Net Increase/(Decrease) in Cash and Cash Equivalents 21,874 (20,703)
Cash and cash equivalents at the beginning of the year 33,733 52,811
Effect of exchange rate change on foreign currency balances held at the beginning of the year 3,221 1,625
Cash and Cash Equivalents at the End of the Year 24(b) 58,828 33,733
The accompanying notes form part of and are to be read in conjunction with these Financial Statements.
Consolidated Statement of Cash Flows for the financial year ended 30 June 2013

44
Notes to the Financial Statements for the financial year ended 30 June 2013
Cue Energy Resources Limited is a for-profit Public Company listed on the Australian Securities Exchange incorporated and domiciled in Australia. The financial report was authorised for issue by the Directors on the date the Directors’ Declaration was signed.
(a) Operations and Principal Activities
Operations comprise petroleum exploration, development and production activities.
(b) Statement of Compliance
The financial report is a general purpose financial report presented in Australian dollars which has been prepared in accordance with Australian Accounting Standards and Interpretations issued by the Australian Accounting Standards Board (“AASB”) and the Corporations Act 2001, as appropriate for for-profit oriented entities. International Financial Reporting Standards (“IFRSs”) form the basis of Australian Accounting Standards adopted by the AASB. The financial reports of the consolidated entity also comply with IFRS and interpretations adopted by the International Accounting Standards Board.
The accounting policies set out below have been applied consistently to all periods presented in this report.
(c) Basis of Preparation
The financial report has been prepared on a going concern basis using the historical cost convention.
In accordance with the Corporations Act 2001, these financial statements present the results of the consolidated entity only. Supplementary information about the parent entity is disclosed in note 25.
(d) Critical Accounting Estimates and Judgements
The preparation of a financial report in conformity with Australian Accounting Standards requires management to make judgements, estimates and assumptions that affect the application of policies and reported amounts of assets and liabilities, income and expenses. The estimates and associated assumptions are based on historical experience and various other factors that are believed to be reasonable under the circumstances, the results of which form the basis of making the judgements about carrying values of assets and liabilities that are not
readily apparent from other sources. Actual results may differ from these estimates. These accounting policies have been consistently applied by each entity in the consolidated entity, and the estimates and underlying assumptions are reviewed on an ongoing basis.
The judgements, estimates and assumptions that have a significant risk of causing a material adjustment to the carrying values of assets and liabilities within the next financial year are discussed below.
(i) Recovery of Deferred Tax Assets
Deferred tax assets resulting from unused tax losses have been recognised on the basis that management considers it is probable that future tax profits will be available to utilise the unused tax losses.
(ii) Share-Based Payment Transactions
The Group measures the cost of equity settled transactions with employees by reference to the fair value of the equity instruments at the date at which they are granted. The fair value is determined for options by using the Black Scholes Option Valuation Model and for Performance Rights a risked statistical analysis technique is used. The accounting estimates and assumptions relating to equity-settled share-based payments would have no impact on the carrying amounts of assets and liabilities within the next annual reporting period but may impact expenses and equity. These assumptions include expected volatility of Cue’s share price, expected dividend yields and other variables necessary in option pricing models.
(iii) Impairment of Production Properties Assets
Production properties impairment testing requires an estimation of the value-in-use of the cash generating units to which deferred costs have been allocated. The value-in-use calculation requires the entity to estimate the future cash flows expected to arise from the cash generating unit and a suitable discount rate in order to calculate present value. Other assumptions used in the calculations which could have an impact on future years includes USD rates, available reserves and oil and gas prices.
1 Summary of Significant Accounting Policies
45
Cue
Ener
gy R
esou
rces
Lim
ited
Annu
al R
epor
t 201
2/13
Fina
ncia
l Rep
ort 2
012/
13
45
(iv) Useful Life of Production Property Assets
As detailed at note 1 (k) production properties are amortised on a unit of production basis, with separate calculations being made for each resource. Estimates of reserve quantities are a critical estimate impacting amortisation of production property assets.
(v) Estimates of Reserve Quantities
The estimated quantities of Proven and Probable hydrocarbon reserves reported by the Company are integral to the calculation of the amortisation expense relating to Production Property Assets, and to the assessment of possible impairment of these assets. Estimated reserve quantities are based upon interpretations of geological and geophysical models and assessments of the technical feasibility and commercial viability of producing the reserves. These assessments require assumptions to be made regarding future development and production costs, commodity prices, exchange rates and fiscal regimes. The estimates of reserves may change from period to period as the economic assumptions used to estimate the reserves can change from period to period, and as additional geological data is generated during the course of operations. Reserves estimates are prepared in accordance with the Company’s policies and procedures for reserves estimation which conform to guidelines prepared by the Society of Petroleum Engineers.
(vi) Restoration Provisions
Provisions for future environmental restoration are recognised where there is a present obligation as a result of exploration, development, production, transportation or storage activities having been undertaken, and it is probable that an outflow of economic benefits will be required to settle the obligation. The estimated future obligations include the costs of removing facilities, abandoning wells and restoring the affected areas.
(vii) Legal Claim
As a result of an economic project arrangement in the Jeruk field within the Sampang PSC, Indonesia, Cue may in certain circumstances have an obligation to reimburse certain monies spent by the incoming party from future profit oil within the Sampang PSC. There is a dispute between Cue and the incoming party as to the quantum of monies that they may be entitled to claim by way of such reimbursement and when any such reimbursement would be payable. The Company is of the view that any amount which might eventually become payable would not be likely to exceed the amount of USD5.3 million which has been provided for in the accounts. The Company awaits the outcome of an arbitration hearing.
(e) New, revised or amending Accounting Standards and Interpretations adopted
The consolidated entity has adopted all of the new, revised or amending Accounting Standards and Interpretations issued by the Australian Accounting Standards Board (‘AASB’) that are mandatory for the current reporting period. The adoption of these accounting standards and interpretations has not have any significant impact on the financial performance or position of the consolidated entity.
(f) Principles of Consolidation
The consolidated financial statements incorporate the assets and liabilities of all subsidiaries of Cue Energy Resources Limited (‘’company’’ or ‘’parent entity’’) as at 30 June 2013 and the results of all subsidiaries for the year then ended. Cue Energy Resources Limited and its subsidiaries together are referred to in this financial report as the Group or the consolidated entity.
Subsidiaries are all those entities over which the Group has the power to govern the financial and operating policies, generally accompanying a shareholding of more than one-half of the voting rights. The existence and effect of potential voting rights that are currently exercisable or convertible are considered when assessing whether the Group controls another entity.
Subsidiaries are fully consolidated from the date on which control is transferred to the Group. They are de-consolidated from the date that control ceases.
Intercompany transactions, balances and unrealised gains on transactions between Group companies are eliminated. Unrealised losses are also eliminated unless the transaction provides evidence of the impairment of the asset transferred. Accounting policies of subsidiaries have been changed where necessary to ensure consistency with the policies adopted by the Group.
A change in ownership interest, without the loss of control, is accounted for as an equity transaction, where the difference between the consideration transferred and the book value of the share of the non-controlling interest is recognised directly in equity attributable to the parent.
Investments in subsidiaries are accounted for at cost in the individual financial statements of Cue Energy Resources Limited.
(g) Revenue Recognition
Revenue is recognised in profit or loss when the significant risks and rewards of ownership have been transferred to the buyer. Revenue is recognised and measured at the fair value of the consideration or contributions received, net of goods and service tax (“GST”), to the extent it is probable that the economic benefits will flow to the Group and the revenue can be reliably measured.
1 Summary of Significant Accounting Policies (cont’)

46
Sales Revenue
Sales revenue is recognised on the basis of the Group’s interest in a producing field (“entitlements” method), when the physical product and associated risks and rewards of ownership pass to the purchaser, which is generally at the time of ship or truck loading, or in certain instances the product entering the pipeline.
Revenue earned under a production sharing contract (“PSC”) is recognised on a net entitlements basis according to the terms of the PSC.
Interest Income
Interest revenue is recognised as interest accrues using the effective interest method. This is a method calculating the amortised cost of a financial asset and allocating the interest income over the relevant period using the effective interest rate, which is the rate that exactly discounts estimated future cash receipts through the expected life of the financial assets to the net carrying amount of the financial asset.
Other Income
Other income is recognised in the profit or loss at the fair value of the consideration received or receivable, net of GST, when the significant risks and rewards of ownership have been transferred to the buyer or when the service has been performed.
The gain or loss arising on disposal of a non-current asset is included as other income at the date control of the asset passes to the buyer. The gain or loss on disposal is calculated as the difference between the carrying amount of the asset at the time of disposal and the net proceeds on disposal.
(h) Exploration and Evaluation Project Expenditure
Costs incurred during the exploration, evaluation and development stages of specific areas of interest are accumulated. Such expenditure comprises net direct costs, but does not include general overheads or administrative expenditure not having a specific nexus with a particular area of interest.
Expenditure is only carried forward as an asset where it is expected to be fully recouped through the successful development of the area, or where activities to date have not yet reached a stage to allow adequate assessment regarding existence of economically recoverable reserves, and active and significant operations in relation to the area are continuing. Ultimate recoupment of costs is dependent on successful development and commercial exploitation, or alternatively, sale of respective areas.
Costs are written off as soon as an area has been abandoned or considered to be non-commercial.
No amortisation is provided in respect of projects in the exploration, evaluation and development stages until they are reclassified as production properties.
Restoration costs recognised in respect of areas of interest in the exploration and evaluation stage are carried forward as exploration, evaluation and development expenditure.
(i) Impairment
The carrying amounts of the consolidated entity’s assets, are reviewed at each balance sheet date to determine whether there is any indication of impairment. If any such indications exists, the asset’s recoverable amount is estimated.
An impairment loss is recognised whenever the carrying amount of an asset or its cash generating unit exceeds the recoverable amount. Impairment losses are recognised in profit or loss, unless an asset has previously been revalued, in which case the impairment loss is recognised as a reversal to the extent of that previous revaluation with any excess recognised through profit or loss.
Impairment losses recognised in respect of cash-generating units are allocated to reduce the carrying amount of the assets in the unit (group of units) on a pro rata basis.
(j) Calculation of Recoverable Amount
For oil and gas assets the estimated future cash flows are based on value-in-use calculations using estimates of hydrocarbon reserves, future production profiles, commodity prices, operating costs and any future development costs necessary to produce the reserves. Estimates of future commodity prices are based on contracted prices where applicable or based on forward market prices where available. The recoverable amount of other assets is the greater of their net selling price and value in use.
In assessing value-in-use, the estimated future cash flows are discounted to their present value using a pre-tax discount rate that reflects current market assessments of the time value of money and the risks specific to the asset. For an asset that does not generate largely independent cash inflows, the recoverable amount is determined for the cash-generating unit to which the asset belongs.
(k) Production Properties
Production properties are carried at the reporting date at cost less accumulated amortisation and accumulated impairment losses. Production properties represent the accumulation of all exploration, evaluation, development and acquisition costs in relation to areas of interest in which production licences have been granted.
Amortisation of costs is provided on the unit-of-production basis, separate calculations being made for each resource. The unit-of-production basis results in an amortisation charge proportional to the depletion of economically recoverable reserves (comprising both proven and probable reserves), and is shown as a separate line item in profit or loss.
Amounts (including subsidies) received during the exploration, evaluation, development or construction phases which are in the nature of reimbursement or recoupment of previously incurred costs are offset against such capitalised costs.
1 Summary of Significant Accounting Policies (cont’)

47
Cue
Ener
gy R
esou
rces
Lim
ited
Annu
al R
epor
t 201
2/13
Fina
ncia
l Rep
ort 2
012/
13
47
(l) Property, Plant and Equipment
Class of Fixed Asset Depreciation Rate
Plant and equipment 5-33%
Property, plant and equipment is carried at historical cost less accumulated depreciation and accumulated impairment losses. Depreciation is calculated on a diminishing value basis so as to allocate the cost of each item of equipment over its expected economic life. The economic life of equipment has due regard to physical life limitations and to present assessments of economic recovery. Estimates of remaining useful lives are made on a regular basis for all assets, with annual reassessment for major items. Gains and losses on disposal of property, plant and equipment are taken into account in determining the operating results for the year.
(m) Cash and Cash Equivalents
For purposes of the statement of cash flows, cash includes deposits at call which are readily convertible to cash on hand and which are used in the cash management function on a day-to-day basis, net of outstanding bank overdrafts.
(n) Trade and Other Receivables
Trade receivables amounts due from related parties and other receivables represent the principal amounts due at the reporting date plus accrued interest and less, where applicable, any unearned income and allowance for doubtful accounts. Trade receivables are generally due for settlement within 30 days.
(o) Inventories
Inventories consist of hydrocarbon stock. Inventories are valued at the lower of cost and net realisable value. Cost is determined on a weighted average basis and includes direct costs and an appropriate portion of fixed production overheads where applicable.
(p) Trade and Other Payables
These amounts represent the principal amounts outstanding at the reporting date plus, where applicable, any accrued interest. Trade payables are normally paid within 30 days, and due to their short term nature are generally unsecured and not discounted.
(q) Provisions
A provision is recognised in the statement of financial position when the Group has a present legal or constructive obligation as a result of a past event, it is probable that an outflow of resources embodying economic benefits will be required to settle the obligation and a reliable estimate can be made of the amount of the obligation. Provisions are determined by discounting the expected future cash flows at a pre-tax rate that reflects current market assessments of the time value of money and, where appropriate, the risk specific to the liability.
Restoration
Provisions for future environmental restoration are recognised where there is a present obligation as a result of exploration, development, production, transportation or storage activities having been undertaken, and it is probable that an outflow of economic benefits will be required to settle the obligation. The estimated future obligations include the costs of removing facilities, abandoning wells and restoring the affected areas.
The provision of future restoration costs is the best estimate of the present value of the future expenditure required to settle the restoration obligation at the reporting date, based on current legal requirements. Future restoration costs are reviewed annually and any changes in the estimate are reflected in the present value of the restoration provision at the reporting date, with a corresponding change in the cost of the associated asset.
The amount of the provision for future restoration costs relating to exploration, development and production facilities is capitalised and depleted as a component of the cost of those activities.
(r) Employee Benefits
The following liabilities arising in respect of employee benefits are measured at their nominal amounts:
• wages and salaries and annual leave expected to be settled within twelve months of the reporting date; and
• other employee benefits expected to be settled within twelve months of the reporting date.
All other employee benefit liabilities expected to be settled more than 12 months after the reporting date are measured at the present value of the estimated future cash outflows in respect of services provided up to the reporting date. Liabilities are determined after taking into consideration estimated future increase in wages and salaries and past experience regarding staff departures. Related on-costs are included.
(s) Joint Ventures
When a member of the group participates in a joint venture arrangement, the member recognises its proportionate interest in the individual assets, liabilities, revenue and expenses of the joint venture. The liabilities recognised include its share of those for which it is jointly liable.
Details of major joint venture interests are set out in note 17.
1 Summary of Significant Accounting Policies (cont’)

48
(t) Income Tax
The income tax expense for the year is the tax payable on the current period’s taxable income based on the applicable income tax rate for each jurisdiction adjusted by changes in deferred tax assets and liabilities attributable to temporary differences and to unused tax losses.
Deferred income tax is provided in full, using the liability method, on temporary differences arising between the tax bases of assets and liabilities and their carrying amounts in the consolidated financial statements. However, deferred income tax is not accounted for if it arises from initial recognition of an asset or liability in a transaction other than a business combination that at the time of the transaction affects neither accounting nor taxable profit or loss. Deferred income tax is determined using tax rates (and laws) that have been enacted or substantially enacted by the reporting date and are expected to apply when the related deferred income tax asset is realised or the deferred income tax liability is settled.
Deferred tax assets are recognised for deductible temporary differences and unused tax losses only if it is probable that future taxable amounts will be available to utilise those temporary differences and losses.
Deferred tax assets and liabilities are offset when there is a legally enforceable right to offset current tax assets and liabilities and when the deferred tax balances relate to the same taxation authority. Current tax assets and tax liabilities are offset where the entity has a legally enforceable right to offset and intends either to settle on a net basis, or to realise the asset and settle the liability simultaneously.
Current and deferred tax balances attributable to amounts recognised directly in equity are also recognised directly in equity.
Cue Energy Resources Limited (the ‘head entity’) and its wholly-owned Australian controlled entities have formed an income tax consolidated group under the tax consolidation regime effective 1 July 2010. The head entity and the controlled entities in the tax consolidated group continue to account for their own current and deferred tax amounts. The tax consolidated group has applied the group allocation approach in determining the appropriate amount of taxes to allocate to members of the tax consolidated group.
In addition to its own current and deferred tax amounts, the head entity also recognises the current tax liabilities (or assets) and the deferred tax assets arising from unused tax losses and unused tax credits assumed from controlled entitles in the tax consolidated group.
Assets or liabilities arising under tax funding agreement with the tax consolidated entities are recognised as amounts receivable from or payable to other entities in the tax consolidated group. The tax funding arrangement ensures that the intercompany charge equals the current tax liability or benefit of each tax consolidated group member, resulting in neither a contribution by the head entity to the subsidiaries nor a distribution by the subsidiaries to the head entity.
(u) Foreign Currency
Functional and presentation currency
The financial statements of each group entity are measured using its functional currency, which is the currency of the primary economic environment in which that entity operates. The consolidated financial statements are presented in Australian dollars, as this is the parent entity’s functional and presentation currency.
Transactions and balances
Transactions in foreign currencies of entities within the consolidated entity are translated into functional currency at the rate of exchange ruling at the date of the transaction.
Foreign currency monetary items that are outstanding at the reporting date (other than monetary items arising under foreign currency contracts where the exchange rate for that monetary item is fixed in the contract) are translated using the spot rate at the end of financial year.
Resulting exchange differences arising on settlement or re-statement are recognised as in profit or loss for the financial year.
(v) Share-Based Payment Transactions
Equity settled transactions
The Group provides benefits in the form of share-based payments to executives, senior management and general staff. These personnel render services in exchange for shares or rights over shares (equity-settled transactions). The cost of these equity-settled transactions with employees is measured by reference to the fair value of the equity instruments at the date at which they are granted. The fair value for the options over ordinary shares are determined using the Black-Scholes Option Valuation Model and for Performance Rights a risked statistical analysis pricing technique is used.
In valuing equity-settled transactions, no account is taken of any performance conditions, other than conditions linked to the price of the shares of the Company (market conditions) if applicable. The cost of equity-settled transactions is recognised, together with a corresponding increase in equity, over the period in which the performance and/or service conditions are fulfilled, ending on the date on which the relevant employees become fully entitled to the award (the vesting date).
The cumulative expense recognised for equity-settled transactions at each reporting date until vesting date reflects (i) the extent to which the vesting date has expired and (ii) the Group’s best estimate of the number of equity instruments that will ultimately vest. No adjustment is made for the likelihood of market performance conditions being met as the effect of these conditions is included in the determination of fair value at grant date. The profit or loss charge or credit for a period represents the movement in cumulative expense recognised as at the beginning and end of that period.
1 Summary of Significant Accounting Policies (cont’)

49
Cue
Ener
gy R
esou
rces
Lim
ited
Annu
al R
epor
t 201
2/13
Fina
ncia
l Rep
ort 2
012/
13
49
No expense is recognised for awards that do not ultimately vest, except for awards where vesting is only conditional upon a market condition.
If the terms of an equity-settled award are modified, as a minimum an expense is recognised as if the terms had not been modified. In addition, an expense is recognised for any modification that increases the total fair value of the share-based payment arrangement, or is otherwise beneficial to the employee, as measured at the date of modification.
If an equity-settled award is cancelled, it is treated as if it had not vested on the date of cancellation, and any expense not yet recognised for the award is not recognised. However, if a new award is substituted for the cancelled award and designated as a replacement award on the date that it is granted, the cancelled and new award are treated as if they were a modification of the original award, as described in the previous paragraph.
The dilutive effect, if any, of outstanding options and Performance Rights is reflected as additional share dilution in the computation of earnings per share (see note 20).
(w) Leases
Lease payments for operating leases where substantial risks and benefits remain with the lessor are charged as expenses in the periods in which they are incurred.
(x) Contributed Equity
Ordinary share capital is recognised at the fair value of the consideration received by the company. Any transaction costs arising on the issue of ordinary shares are recognised directly in equity as a reduction of the share proceeds received. Ordinary share capital bears no special terms or conditions affecting income or capital entitlements of the shareholders.
(y) Rounding
The amounts contained in this financial report have been rounded to the nearest $1,000 (where rounding is applicable) under the option available to the company under ASIC Class Order 98/100. The Company is an entity to which the Class Order applies.
(z) New Accounting Standards and Interpretations not yet mandatory or early adopted
Australian Accounting Standards and Interpretations that have recently been issued or amended but are not yet mandatory, have not been early adopted by the consolidated entity for the annual reporting period ended 30 June 2013. The consolidated entity’s assessment of the impact of these new or amended Accounting Standards and Interpretations, most relevant to the consolidated entity, are set out below.
AASB 9 Financial Instruments, 2009-11 Amendments to Australian Accounting Standards arising from AASB 9, 2010-7 Amendments to Australian Accounting Standards arising from AASB 9 and 2012-6 Amendments to Australian Accounting Standards arising from AASB 9
This standard and its consequential amendments are applicable to annual reporting periods beginning on or after 1 January 2015 and completes phase I of the lASB’s project to replace lAS 39 (being the international equivalent to AASB 139 ‘Financial Instruments: Recognition and Measurement’). This standard introduces new classification and measurement models for financial assets, using a single approach to determine whether a financial asset is measured at amortised cost or fair value. The accounting for financial liabilities continues to be classified and measured in accordance with AASB 139, with one exception, being that the portion of a change of fair value relating to the entity’s own credit risk is to be presented in other comprehensive income unless it would create an accounting mismatch. The consolidated entity will adopt this standard from 1 July 2015 but the impact of its adoption is yet to be assessed by the consolidated entity.
AASB 10 Consolidated Financial Statements
This standard is applicable to annual reporting periods beginning on or after 1 January 2013. The standard has a new definition of ‘control’. Control exists when the reporting entity is exposed, or has the rights, to variable returns (e.g. dividends, remuneration, returns that are not available to other interest holders including losses) from its involvement with another entity and has the ability to affect those returns through its ‘power’ over that other entity. A reporting entity has power when it has rights (e.g. voting rights, potential voting rights, rights to appoint key management, decision making rights, kick out rights) that give it the current ability to direct the activities that significantly affect the investee’s returns (e.g. operating policies, capital decisions, appointment of key management). The consolidated entity will not only have to consider its holdings and rights but also the holdings and rights of other shareholders in order to determine whether it has the necessary power for consolidation purposes. The adoption of this standard from 1 July 2013 may have an impact where the consolidated entity has a holding of less than 50% in an entity, has de facto control, and is not currently consolidating that entity.
1 Summary of Significant Accounting Policies (cont’)

50
AASB 11 Joint Arrangements
This standard is applicable to annual reporting periods beginning on or after 1 January 2013. The standard defines which entities qualify as joint ventures and removes the option to account for joint ventures using proportional consolidation. Joint ventures, where the parties to the agreement have the rights to the net assets will use equity accounting. Joint operations, where the parties to the agreements have the rights to the assets and obligations for the liabilities will account for the assets, liabilities, revenues and expenses separately, using proportionate consolidation. Management are yet to determine if the adoption of this standard from 1 July 2013 will have a material impact on the consolidated entity.
AASB 12 Disclosure of Interests in Other Entities
This standard is applicable to annual reporting periods beginning on or after 1 January 2013. It contains the entire disclosure requirement associated with other entities, being subsidiaries, associates and joint ventures. The disclosure requirements have been significantly enhanced when compared to the disclosures previously located in AASB 127 ‘Consolidated and Separate Financial Statements’, AASB 128 ‘Investments in Associates’, AASB 131 ‘Interests in Joint Ventures’ and Interpretation 112 ‘Consolidation - Special Purpose Entities’. The adoption of this standard from 1 July 2013 will significantly increase the amount of disclosures required to be given by the consolidated entity such as significant judgements and assumptions made in determining whether it has a controlling or non-controlling interest in another entity and the type of non-controlling interest and the nature and risks involved.
AASB 13 Fair Value Measurement and AASB 2011-8 Amendments to Australian Accounting Standards arising from AASB 13
This standard and its consequential amendments are applicable to annual reporting periods beginning on or after 1 January 2013. The standard provides a single robust measurement framework, with clear measurement objectives, for measuring fair value using the ‘exit price’ and it provides guidance on measuring fair value when a market becomes less active. The ‘highest and best use’ approach would be used to measure assets whereas liabilities would be based on transfer value. As the standard does not introduce any new requirements for the use of fair value, its impact on adoption by the consolidated entity from 1 July 2013 should be minimal, although there will be increased disclosures where fair value is used.
AASB 127 Separate Financial Statements (Revised)
AASB 128 Investments in Associates and Joint Ventures (Reissued)
These standards are applicable to annual reporting periods beginning on or after 1 January 2013. They have been modified to remove specific guidance that is now contained in AASB 10, AASB 11 and AASB 12. The adoption of these revised standards from 1 July 2013 will not have a material impact on the consolidated entity.
AASB 119 Employee Benefits (September 2011) and AASB 2011-10 Amendments to Australian Accounting Standards arising from AASB 119 (September 2011)
This revised standard and its consequential amendments are applicable to annual reporting periods beginning on or after 1 January 2013. The amendments eliminate the corridor approach for the deferral of gains and losses; streamlines the presentation of changes in assets and liabilities arising from defined benefit plans, including requiring remeasurements to be presented in other comprehensive income; and enhances the disclosure requirements for defined benefit plans. The amendments also changed the definition of short-term employee benefits, from ‘due to’ to ‘expected to’ be settled within 12 months.
This will require annual leave that is not expected to be wholly settled within 12 months to be discounted allowing for expected salary levels in the future period when the leave is expected to be taken. The adoption of the revised standard from 1 July 2013 is not expected to have a significant impact on the consolidated entity.
AASB 2011-4 Amendments to Australian Accounting Standards to Remove Individual Key Management Personnel Disclosure Requirement
These amendments are applicable to annual reporting periods beginning on or after 1 July 2013, with early adoption not permitted. They amend AASB 124 ‘Related Party Disclosures’ by removing the disclosure requirements for individual key management personnel (‘KMP’). The adoption of these amendments from 1 July 2014 will remove the duplication of information relating to individual KMP in the notes to the financial statements and the directors’ report. As the aggregate disclosures are still required by AASB 124 and during the transitional period the requirements may be included in the Corporations Act or other legislation, it is expected that the amendments will not have a material impact on the consolidated entity.
1 Summary of Significant Accounting Policies (cont’)

51
Cue
Ener
gy R
esou
rces
Lim
ited
Annu
al R
epor
t 201
2/13
Fina
ncia
l Rep
ort 2
012/
13
51
AASB 2011-7 Amendments to Australian Accounting Standards arising from the Consolidation and Joint Arrangements Standards
The amendments are applicable to annual reporting periods beginning on or after 1 January 2013. The amendments make numerous consequential changes to a range of Australian Accounting Standards and Interpretations, following the issuance of AASB 10, AASB 11, AASB 12 and revised AASB 127 and AASB 128. The adoption of these amendments from 1 July 2013 will not have a material impact on the consolidated entity.
AASB 2012-2 Amendments to Australian Accounting Standards-Disclosures-Offsetting Financial Assets and Financial Liabilities
The amendments are applicable to annual reporting periods beginning on or after 1 January 2013. The disclosure requirements of AASB 7 ‘Financial Instruments: Disclosures’ (and consequential amendments to AASB 132 ‘Financial Instruments: Presentation’) have been enhanced to provide users of financial statements with information about netting arrangements, including rights of set-off related to an entity’s financial instruments and the effects of such rights on its statement of financial position. The adoption of the amendments from 1 July 2013 will increase the disclosures by the consolidated entity.
AASB 2012-3 Amendments to Australian Accounting Standards-Offsetting Financial Assets and Financial Liabilities
The amendments are applicable to annual reporting periods beginning on or after 1 January 2014. The amendments add application guidance to address inconsistencies in the application of the offsetting criteria in AASB 132 ‘Financial Instruments: Presentation’, by clarifying the meaning of “currently has a legally enforceable right of set-off”; and clarifies that some gross settlement systems may be considered to be equivalent to net settlement. The adoption of the amendments from 1 July 2014 will not have a material impact on the consolidated entity.
AASB 2012-5 Amendments to Australian Accounting Standards arising from Annual Improvements 2009-2011 Cycle
The amendments are applicable to annual reporting periods beginning on or after 1 January 2013. The amendments affect five Australian Accounting Standards as follows: Confirmation that repeat application of AASB 1 (IFRS 1) ‘First time Adoption of Australian Accounting Standards’ is permitted; Clarification of borrowing cost exemption in AASB 1; Clarification of the comparative information requirements when an entity provides an optional third column or is required to present a third statement of financial position in accordance with AASB 101
1 Summary of Significant Accounting Policies (cont’)‘Presentation of Financial Statements’; Clarification that servicing of equipment is covered by AASB 116 ‘Property, Plant and Equipment’, if such equipment is used for more than one period; clarification that the tax effect of distributions to holders of equity instruments and equity transaction costs in AASB 132 ‘Financial Instruments: Presentation’ should be accounted for in accordance with AASB 112 ‘Income Taxes’; and clarification of the financial reporting requirements in AASB 134 ‘Interim Financial Reporting’ and the disclosure requirements of segment assets and liabilities. The adoption of the amendments from 1 July 2013 will not have a material impact on the consolidated entity.
AASB 2012-9 Amendment to AASB 1048 arising from the Withdrawal of Australian Interpretation 1039
This amendment is applicable to annual reporting periods beginning on or after 1 January 2013. The amendment removes reference in AASB 1048 following the withdrawal of Interpretation 1039. The adoption of this amendment will not have a material impact on the consolidated entity.
AASB 2012-10 Amendments to Australian Accounting Standards-Transition Guidance and Other Amendments
These amendments are applicable to annual reporting periods beginning on or after 1 January 2013. They amend AASB 10 and related standards for the transition guidance relevant to the initial application of those standards. The amendments clarify the circumstances in which adjustments to an entity’s previous accounting for its involvement with other entities are required and the timing of such adjustments. The adoption of these amendments will not have a material impact on the consolidated entity.
(aa) Goods and Services tax (‘GST’) and Other Similar Taxes
Revenues, expense and assets are recognised net of the amount of associated GST, unless the GST incurred is not recoverable from the tax authority.In this case it is recognised as part of the cost of the acquisition of the asset or as part of the expense.
Receivables and payables are stated inclusive of the amount of GST receivable or payable. The net amount of GST recoverable from, or payable to, the tax authority is included in other receivables or other payables in the statement of financial position.
Cash flows are presented on a gross basis. The GST components of cash flows arising from investing or financing activities which are recoverable from, or payable to the tax authority, are presented as operating cash flows.
Commitments and contingencies are disclosed net of the amount of GST recoverable from, or payable to, the tax authority.

52
2 Financial InstrumentsThe Group’s principal financial instruments comprise receivables, payables, cash and short term deposits.
The Group manages its exposure to key financial risks, including interest rate and currency risk through management’s regular assessment of financial risks. The objective of the assessment is to support the delivery of the Group’s financial targets whilst protecting future financial security.
The main risks arising from the Group’s financial instruments are interest rate risk, foreign currency risk, commodity price risk, credit risk and liquidity risk. The Group uses different methods to measure and manage different types of risk to which it is exposed. These include monitoring levels of exposure to interest rate and foreign exchange risk and assessments of market forecasts for interest rate, foreign exchange and commodity prices. These risks are summarised below.
Primary responsibility for identification and control of financial risks rests with the Chief Financial Officer under the authority of the Board. The Board reviews and agrees management’s assessment for managing each of the risks identified below.
The carrying amounts and net fair values of the economic entity’s financial assets and liabilities at the reporting date are:
Consolidated Carrying Amount Net Fair Value
2013 $’000
2012 $’000
2013 $’000
2012 $’000
Financial assets
Cash and cash equivalents 58,828 33,733 58,828 33,733
Trade and other receivables 5,096 11,746 5,096 11,746
Non-traded financial assets 63,924 45,479 63,924 45,479
Financial liabilities
Trade and other payables 11,977 8,631 11,977 8,631
Tax liabilities - current 3,973 1,293 3,973 1,293
Non-traded financial liabilities 15,950 9,924 15,950 9,924
Risk Exposures and Responses
(a) Fair Value Risk
The financial assets and liabilities of the Group are recognised in the statement of financial position at their fair value in accordance with the accounting policies set out in note 1. In all instances the fair value of financial amounts and liabilities approximates to their carrying value.
Basis for determining fair values
The following summarises the significant methods and assumptions used in estimating the fair values of financial instruments:
Trade and other receivables
The carrying value less impairment provision of trade receivables is a reasonable approximation of their fair values due to the short-term nature of trade and other receivables.
Financial liabilities
Fair value is calculated based on the present value of future principal and interest cash flows, discounted at the market rate of interest at the reporting date. Where these cash flows are in a foreign currency the present value is converted into Australian dollars at the foreign exchange spot rate prevailing at reporting date.
Trade and other payables
The carrying value of trade payables is a reasonable approximation of their fair values due to the short term nature of trade payables.

53
Cue
Ener
gy R
esou
rces
Lim
ited
Annu
al R
epor
t 201
2/13
Fina
ncia
l Rep
ort 2
012/
13
53
(b) Interest Rate Risk
The Group’s exposure to market interest rates is related primarily to the Group’s cash deposits (see note 24 (b)).
At the reporting date, the Group had the following mix of financial assets and liabilities exposed to Australian and overseas variable interest rate risk that are not designated in cash flow hedges:
Consolidated
2013 $’000
2012 $’000
Cash and cash equivalents 58,828 33,733
The Group constantly analyses its interest rate opportunity and exposure. Within this analysis consideration is given to existing positions and alternative arrangement on fixed or variable deposits.
The following sensitivity analysis is based on the interest rate opportunity/risk in existence at the reporting date.
Based upon the average balance of net exposure during the year, if interest rates changed by +/-1%, with all other variables held constant, the estimated impact on post-tax profit and equity would have been:
Consolidated
2013 $’000
2012 $’000
Impact on post-tax profit
Interest rates +1% 463 510
Interest rates –1% (463) (510)
Impact on equity
Interest rates +1% 463 510
Interest rates –1% (463) (510)
A movement of + and – 1% is selected because this historically is within a range of rate movements and available economic data suggests this range is reasonable.
(c) Foreign Exchange Risk
The Group is subject to foreign exchange risk on its international exploration and appraisal activities where costs are incurred in foreign currencies, in particular United States dollars.
The Board approved the policy of holding certain funds in United States dollars to manage foreign exchange risk.
The Group’s exposure to foreign exchange risk at the reporting date was as follows (holdings are shown in AUD equivalent):
30 June 2013 30 June 2012
Consolidated
USD
$’000
NZD
$’000
PNG KINA
$’000
USD
$’000
NZD
$’000
PNG KINA
$’000
Financial assets:
Cash and cash equivalents 57,908 102 8 32,385 1,152 7
Receivables 4,473 614 - 9,268 171 -
Financial liabilities:
Current payables 3,543 1,966 - 1,621 731 -
2 Financial Instruments (cont’)

54
At the reporting date, if the currencies set out in the table above, strengthened or weakened against the Australian dollar by the percentage shown, with all other variables held constant, net profit for the year would increase/(decrease) and net assets would increase / (decrease) by:
Consolidated
USD $’000
NZD $’000
PNG KINA
$’000
2013 Total
$’000
Impact on post-tax profit
+10% (5,884) 125 (1) (5,760)
-10% 5,884 (125) 1 5,760
Impact on equity
+10% (5,884) 125 (1) (5,760)
-10% 5,884 (125) 1 5,760
Consolidated
USD $’000
NZD $’000
PNG KINA
$’000
2012 Total
$’000
Impact on post-tax profit
+10% (4,003) (59) (1) (4,063)
-10% 4,003 59 1 4,063
Impact on equity
+10% (4,003) (59) (1) (4,063)
-10% 4,003 59 1 4,063
Management believes the risk exposures as at the reporting date are representative of the risk exposure inherent in the financial instruments. A movement of +/– 10% is selected because a review of recent exchange rate movements and economic data suggests this range is reasonable.
(d) Commodity Price Risk
The Group is involved in oil and gas exploration and appraisal, and since April 1998 has received revenue from the sale of hydrocarbons. Exposure to commodity price risk is therefore limited to this production and from successful exploration and appraisal activities the quantum of which at this stage cannot be measured.
The Group is exposed to commodity price fluctuations through the sale of petroleum products denominated in US dollars. The Group may enter into commodity crude oil price swap and option contracts to manage its commodity price risk.
At 30 June 2013 the Group had no open oil price swap contracts (2012: nil).
If the US dollar oil price changed by +/-20% from the average oil price during the year, with all other variables held constant, the estimated impact on post-tax profit and equity would have been:
Consolidated
2013 $’000
2012 $’000
Impact on post-tax profit
US dollar oil price +20% 6,375 3,683
US dollar oil price –20% (6,375) (3,683)
Impact on equity
US dollar oil price +20% 6,375 3,683
US dollar oil price –20% (6,375) (3,683)
Management believes the risk exposures as at the reporting date are representative of the risk exposure inherent in the financial instruments. A movement of + and – 20% is selected because a review of historical oil price movements and economic data suggests this range is reasonable.
2 Financial Instruments (cont’)

55
Cue
Ener
gy R
esou
rces
Lim
ited
Annu
al R
epor
t 201
2/13
Fina
ncia
l Rep
ort 2
012/
13
55
(e) Liquidity Risk
Liquidity Risk is the risk that the group, although balance sheet solvent, cannot meet or generate sufficient cash resources to meet its payment obligations in full as they fall due, or can only do so at materially disadvantageous terms.
Ultimate responsibility for liquidity risk management rests with the board of directors, who have established an appropriate liquidity risk management framework for the management of the Group’s short, medium and long-term funding and liquidity management requirements. The Group manages liquidity risk by maintaining adequate reserves, banking facilities and reserve borrowing facilities and by continuously monitoring forecast and actual cash flows and matching the maturity profiles of financial assets and liabilities.
The Group is consequently more than sufficiently solvent to meet its payment obligations in full as they fall due.
Prudent liquidity risk management implies maintaining sufficient cash and marketable securities, the availability of funding through an adequate amount of committed credit facilities and the ability to close out market positions. The Group aims to maintain flexibility in funding to meet ongoing operational requirements, exploration and development expenditure, and small-to-medium-sized opportunistic projects and investments, by keeping committed credit facilities available.
The following table analyses the contractual maturities of the Group’s financial liabilities into relevant groupings based on the remaining period at the reporting date to the contractual undiscounted cash flows comprising principal and interest repayments. Estimated variable interest expense is based upon appropriate yield curves existing as at 30 June 2013.
12 months or less $000’s
1 to 2 years
$000’s
2 to 5 years
$000’s
More than 5 years $000’s
Consolidated 2013
Non-derivative financial liabilities
Trade and other payables(i) 11,977 - - -
Tax liabilities - current 3,973 - - -
15,950 - - -
Consolidated 2012
Non-derivative financial liabilities
Trade and other payables(i) 8,631 - - -
Tax liabilities - current 1,293 - - -
9,924 - - -
(i) Repayment within 3 months, except for the Jeruk liability of $5.7 million which is expected to be repaid in 12 months.
(f) Credit Risk
Credit risk arises from the financial assets of the group, which comprise cash and cash equivalents and trade and other receivables. The Group’s exposure to credit risk arises from potential default by the counter-party, with maximum exposure equal to the carrying amount of these instruments. Exposure at the reporting date is addressed in each applicable note.
The Group does not hold any credit derivatives to offset its credit exposure.
The Group trades only with recognised, creditworthy third parties, and as such collateral is not requested nor is it the Group’s policy to securitize its trade and other receivables.
It is the Group’s policy that all customers who wish to trade on credit terms are subject to credit verification procedures including an assessment of their independent credit rating, financial position, past experience and industry reputation. The risks are regularly monitored.
At the reporting date there are no significant concentrations of credit risk within the Group.
2 Financial Instruments (cont’)

56
3 Revenue and Other IncomeConsolidated
2013 $000’s
2012 $000’s
Revenue from continuing operations:
Production income 49,798 41,222
Other income:
Interest from cash and cash equivalents 160 274
Net realised gain on oil hedge derivative - 158
Net foreign currency exchange gain 3,702 2,616
4 ExpensesOperating Expenses
Production costs 19,131 13,778
Amortisation of production properties 17,520 10,500
Interest expense 3 84
Other Expenses
Depreciation of property, plant and equipment 39 44
Employee expense 4,485 3,141
Superannuation contribution expense 205 182
Administrative expenses 887 693
Operating lease expenses
Business development expenses
208
2,773
203
2,024
Other expenses 8,597 6,287
5 Auditors RemunerationAmounts paid or due and payable to the auditor – BDO East Coast Partnership for:
Audit or review of the financial statements 84,000 81,000
Other Services:
Tax compliance services 36,950 39,250
120,950 120,250
No other services were provided by the auditor during the year, other than those set out above.

57
Cue
Ener
gy R
esou
rces
Lim
ited
Annu
al R
epor
t 201
2/13
Fina
ncia
l Rep
ort 2
012/
13
57
6 TaxationConsolidated Entity
2013 $000’s
2012 $000’s
Income tax expense
Current tax 3,073 1,967
Adjustment recognised for prior periods (149) (1,670)
Deferred tax (884) 7,661
Aggregate income tax expense 2,040 7,958
Income tax expense is attributable to:
Profit from continuing operations 2,040 7,958
Deferred tax included in income tax comprises:
Decrease in deferred tax assets 2,040 1,782
(Decrease)/increase in deferred tax liabilities (2,924) 5,879
(884) 7,661
Numerical reconciliation of income tax expense and tax at the statutory rate
Profit from continuing operations before income tax expense 8,409 13,621
Tax expense at Australian tax rate of 30% (2012: 30%) 2,523 4,086
Unrealised timing differences (387) 4,688
Difference in overseas tax rates 456 1,701
Non-Allowable/(Allowable) mining deductions (2,914) (629)
Tax losses carried forward 2,766 -
Adjustments to current tax from prior periods (149) (1,670)
Disallowable intercompany interest (175) -
First tranche petroleum tax 1,912 -
Movements in deferred tax (884) -
Unrealised foreign exchange movements (1,108) -
Previously unrecognised tax losses now recognise to reduce tax expense - (218)
Income tax expense 2,040 7,958
Tax losses
Unused tax losses for which no deferred tax asset has been recognised 30,831 19,988
Potential tax benefit at relevant local tax rates 9,181 5,996
Current tax liabilities 3,973 1,293
Non-current assets – deferred tax assets
Movements - Consolidated
Opening balance 10,840 12,622
Debit to the income statement (2,040) (1,782)
Closing balance (i) 8,800 10,840

58
6 Taxation (cont’)Consolidated Entity
2013 $000’s
2012 $000’s
Non-current liabilities – deferred tax liabilities
Movements - Consolidated
Opening balance (33,616) (27,737)
(Debit)/credit to the income statement 2,924 (5,879)
(i) (30,692) (33,616)
Net (i) (21,892) (22,776)
(i) Presentation in the consolidated statement of financial position as follows:
Deferred tax asset 214 322
Deferred tax liability (22,106) (23,098)
Net (21,892) (22,776)
7 Capital and Reserves(a) Issued Capital
Consolidated
2013 $000’s
2012 $000’s 2013 2012
Issued and paid up ordinary fully paid shares
Balance at 1 July 152,416 151,768 698,119,720 694,819,718
3,300,002 options exercised - 648 - 3,300,002
Closing balance at 30 June 152,416 152,416 698,119,720 698,119,720
Ordinary shares entitle the holder to the right to receive dividends as declared and, in the event of winding up the Company, to participate in the proceeds from the sale of all surplus assets in proportion to the number of and amounts paid on the shares held. Ordinary shares entitle holders to one vote, either in person or by proxy at a meeting of the Company. The Company has an unlimited authorised capital and the shares have no par value.
(b) Share Based Payment Reserve
Consolidated
2013 $000’s
2012 $000’s
Balance at 1 July 425 391
Performance Share Rights payment expense 22 34
Performance Share Rights payment transferred (425) -
Closing balance at 30 June 22 425

59
Cue
Ener
gy R
esou
rces
Lim
ited
Annu
al R
epor
t 201
2/13
Fina
ncia
l Rep
ort 2
012/
13
59
7 Capital and Reserves (cont’)Nature and purpose of reserve
This reserve is used to record the value of equity benefits provided as part of agreements entered into by the company during the year. Refer to note 22 and the Remuneration Report within the Directors’ Report for details.
The following reconciles the outstanding options and Performance Share Rights granted as remuneration in the current and prior financial years at the beginning and end of the year.
2013 2013 2012 2012
Number of Performance Share Rights
Number of Options
Number of Performance Share Rights
Number of Options
Balance at beginning of the year 3,200,000 - - 4,300,000
Granted during the year 3,200,000 - 4,000,000 -
Forfeited during the year (4,000,000) - (800,000) -
Exercised during the year - - - (3,300,002)
Lapsed during the year (800,000) - - (999,998)
Balance at end of the year 1,600,000 - 3,200,000 -
(c) Capital Management
When managing capital, management’s objective is to ensure the entity continues as a going concern as well as maintaining optimal return for shareholders and benefits for other stakeholders. Management also aims to maintain a capital structure that ensures the lowest cost of capital available to the entity.
Management are constantly adjusting the capital structure of the entity to take advantage of favourable costs of capital or high returns on assets. As the market is constantly changing, management may change the amount of dividends to be paid to shareholders, return capital to shareholders, issue new shares or sell assets to reduce debt.
During 2013 management did not pay any dividends.
There has been no change during the year to the strategy adopted by management to control the capital of the entity.
The gearing ratios for the year ended 30 June 2013 and 30 June 2012 are as follows:
Consolidated Group
2013 $000’s
2012 $000’s
Trade and other payables (11,977) (8,631)
Tax liabilities (3,973) (1,293)
Total (15,950) (9,924)
Less cash and cash equivalents 58,828 33,733
Surplus cash 42,878 23,809
Total equity 131,569 125,178
Total capital 174,447 148,987
Gearing ratio nil% nil%

60
8 Trade and Other ReceivablesConsolidated Group
2013 $000’s
2012 $000’s
Current receivables
Trade receivables 4,469 11,180
Other receivables and prepayments 627 566
5,096 11,746
The ageing of trade receivables at the reporting date was as follows:
Less than one month 4,469 11,180
4,469 11,180
Trade receivables are non-interest-bearing and settlement terms are generally within 30 days.
Trade receivables are neither past due nor impaired and relate to a number of independent customers for whom there is no recent history of default.
Impaired receivables
At 30 June 2013 there were no current trade receivables that were impaired (2012: nil).
The balance of the allowance for impairment in respect of trade receivables at 30 June 2013 was nil (2012: nil). There has been no movement in the allowance during the year.
The Directors consider that the carrying value of receivables reflects their fair values.
9 Property, Plant and EquipmentConsolidated
2013 $000’s
2012 $000’s
Office and computer equipment
Cost 356 338
Accumulated depreciation (293) (254)
63 84
Reconciliation of the carrying amounts of each class of property, plant and equipment at the beginning and end of the current financial year are set out below:
Consolidated
2013 $000’s
2012 $000’s
Balance at beginning of year 84 72
Additions 18 55
Depreciation expense (39) (43)
Balance at end of year 63 84
10 InventoriesConsolidated
2013 $000’s
2012 $000’s
Current Assets
Inventory 1,157 1,500

61
Cue
Ener
gy R
esou
rces
Lim
ited
Annu
al R
epor
t 201
2/13
Fina
ncia
l Rep
ort 2
012/
13
61
11 Shares in Subsidiaries at Balance DateShares held by the parent entity at balance date:
PARENT
Subsidiary Companies
2013
$
2012
$Interest
HeldCountry of
Incorporation Principal Activity
Cue PNG Oil Company Pty Ltd 1 1 100% AustraliaPetroleum production and
exploration
Cue Energy Holdings Ltd(i) - 1 100% Australia Administration
Cue Mahakam Hilir Pty Ltd
1 1 100% AustraliaPetroleum production and
exploration
Cue (Ashmore Cartier) Pty Ltd 2 2 100% Australia Petroleum exploration
Cue Sampang Pty Ltd 1 1 100% Australia Petroleum exploration
Cue Taranaki Pty Ltd 1 1 100% Australia Petroleum exploration
Toro Oil Pty Ltd(i) - 1 100% Australia Petroleum exploration
Cue Energy Malaysia Sdn Bhd(i) - 2 100% Malaysia Petroleum production
Galveston Mining Corporation Pty Ltd(i) - 1,286,678 100% Australia Petroleum exploration
Less accumulated impairment losses - (1,286,678)
- -
Cue Exploration Pty Ltd 1,929,077 1,929,077 100% Australia Petroleum exploration
Less accumulated impairment losses (1,343,808) (1,343,808)
585,269 585,269
Total 585,275 585,279
All companies in the Group have a 30 June balance date. (i) Companies deregistered at year end.
12 Exploration and Evaluation ExpenditureConsolidated
2013 $000’s
2012 $000’s
Costs carried forward in respect of areas of interest in exploration and evaluation phase 31,765 13,166
Expenditure incurred during the year 5,179 18,599
Closing balance at 30 June 36,944 31,765
Accumulated costs incurred on current areas of interest net of amounts written off -
- Sampang PSC 8,969 8,709
- Mahakam Hilir PSC 11,831 9,572
- PNG PRL 9 2,196 2,080
- PNG PRL14 407 326
- PNG PDL 3 (non unitised) 209 209
- WA-359-P 269 133
- WA-360-P 1,947 1,894
- WA-361-P 539 382
- WA-389-P 2,694 2,667
- WA-409-P 187 148
- PEP 51313 6,163 4,233
- PEP 51149 1,533 1,412
Net accumulated exploration and evaluation expenditure 36,944 31,765

62
13 Production PropertiesConsolidated
2013 $000’s
2012 $000’s
Balance at beginning of year 84,886 68,786
Expenditure incurred during the year 6,569 26,600
Amortisation expense (17,520) (10,500)
Balance at end of year 73,935 84,886
Net accumulated costs incurred on areas of interest:
- PNG PDL 3 (unitized) 601 500
- Oyong and Wortel – Sampang PSC 22,415 34,978
- Maari – PMP 38160 50,919 49,408
Total 73,935 84,886
14 Impairment of Production Property AssetsAt 30 June 2013 the Group reassessed the carrying amount of its oil and gas assets, Production Properties (refer note 13 and note 1(j)), for indicators of impairment such as changes in future prices, future costs and reserves. As a result, the recoverable amounts of cash-generating units were formally reassessed. No impairment loss was recognised during the year (2012: nil).
Estimates of recoverable amounts are based on the assets’ value in use, determined by discounting each asset’s estimated future cash flows at asset specific discount rates. The pre-tax discount rates applied were 14.3% (2012: 14.3%) equivalent to post-tax discount rates of 10% (2012: 10%) depending on the nature of the risks specific to each asset. Where an asset does not generate cash flows that are largely independent from other assets or groups of assets, the recoverable amount is determined for the cash-generating unit to which the asset belongs.
15 Trade and Other PayablesCurrent
Trade payables and accruals 11,652 8,606
Amounts due to directors and director related entities 325 25
11,977 8,631
The Directors consider the carrying amount of payables reflect their fair values. Trade creditors are generally settled within 30 days. The Group does not have any significant concentration of credit risks.
Included within trade payable and accruals is an amount of $5.711 million relating to liabilities associated with a dispute in relation to the Jeruk field within the Sampang PSC. Refer to note 25 for more information.
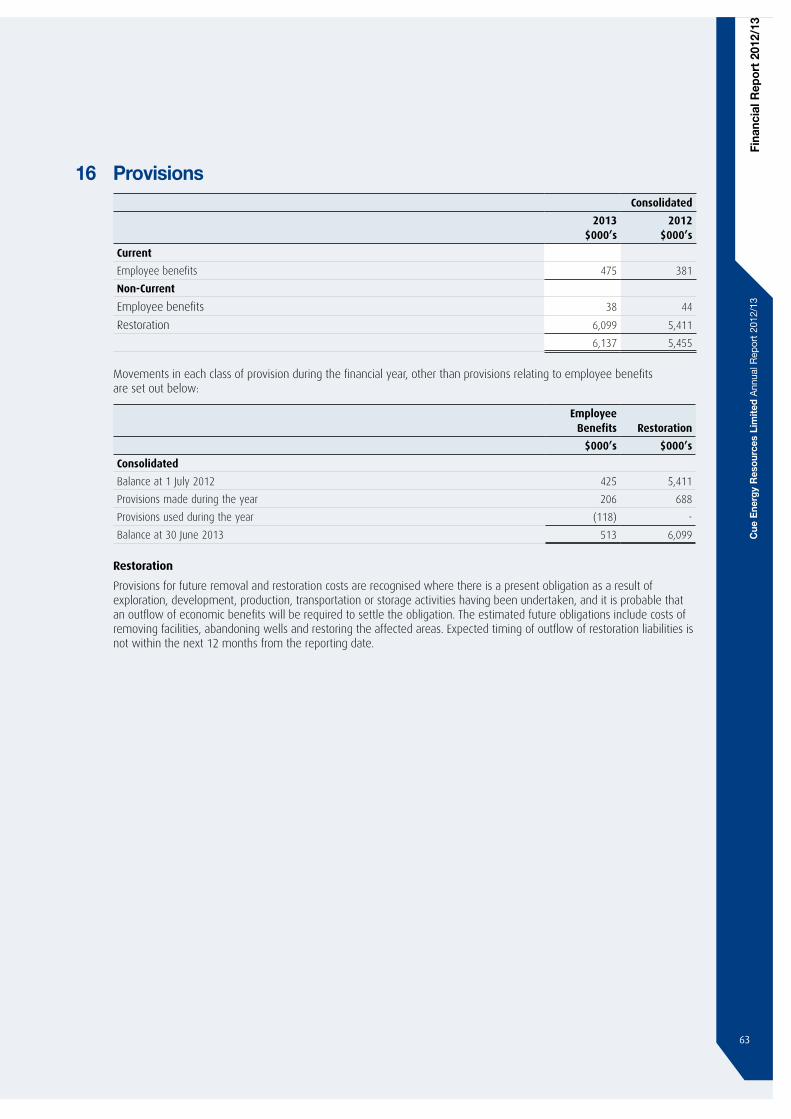
63
Cue
Ener
gy R
esou
rces
Lim
ited
Annu
al R
epor
t 201
2/13
Fina
ncia
l Rep
ort 2
012/
13
63
16 ProvisionsConsolidated
2013 $000’s
2012 $000’s
Current
Employee benefits 475 381
Non-Current
Employee benefits 38 44
Restoration 6,099 5,411
6,137 5,455
Movements in each class of provision during the financial year, other than provisions relating to employee benefits are set out below:
Employee Benefits Restoration
$000’s $000’s
Consolidated
Balance at 1 July 2012 425 5,411
Provisions made during the year 206 688
Provisions used during the year (118) -
Balance at 30 June 2013 513 6,099
Restoration
Provisions for future removal and restoration costs are recognised where there is a present obligation as a result of exploration, development, production, transportation or storage activities having been undertaken, and it is probable that an outflow of economic benefits will be required to settle the obligation. The estimated future obligations include costs of removing facilities, abandoning wells and restoring the affected areas. Expected timing of outflow of restoration liabilities is not within the next 12 months from the reporting date.

64
17 Interests in Joint Ventures
Property OperatorCue Interest
(%)Gross Area
(Km2)Net Area
(Km2)Permit Expiry
Date
Petroleum Exploration Properties
Carnarvon Basin – Western Australia
WA-359-P Cue Exploration Pty Ltd 100 645 645 25/10/2017
WA-360-P MEO Australia Limited 37.50 643 241.1 05/03/2017
WA-361-P MEO Australia Limited 15 644 96.6 30/01/2016
WA-389-P(i) BHP Billiton (Australia) Pty Ltd 40 3,796 1,518.4 29/07/2013
WA-409-P Apache Northwest Pty Ltd 30 565 169.5 29/04/2014
New Zealand
PEP51313 OMV New Zealand Limited 14 2,595 363.3 29/07/2014
PEP51149 Todd Exploration Limited 20 437.7 87.5 22/09/2013
PEP54865 Todd Exploration Limited 20 2,474.97 495 10/12/2017
Indonesia
Mahakam Hilir PSC Singapore Petroleum 40 222.14 88.9 12/11/2014
Papua New Guinea
PRL 9(ii) Oil Search Ltd 14.894 598 89 17/12/2012
PRL 14 Oil Search Ltd 10.947 427 46.7 21/11/2015
Petroleum Production Properties
New Zealand
PMP 38160 OMV New Zealand Limited 5 80.18 4 01/12/2027
Madura - Indonesia
Sampang PSC Santos (Sampang) Pty Ltd 15 (8.181818 Jeruk field)
534.5 80.2 04/12/2027
Papua New Guinea
PDL 3 Barracuda Pty Ltd 5.568892 85 4.7 23/12/2021
(i) Subject to government approval.
(ii) Renewal under consideration by the PNG government.

65
Cue
Ener
gy R
esou
rces
Lim
ited
Annu
al R
epor
t 201
2/13
Fina
ncia
l Rep
ort 2
012/
13
65
17 Interests in Joint Ventures (cont’)Consolidated
2013 $000’s
2012 $000’s
The share of assets and liabilities of the joint ventures and other financial liabilities attributed to Joint Ventures have been included under the relevant headings:
Current Assets:
Receivables 4,469 11,180
Inventory 1,157 1,500
Non-Current Assets:
Exploration and Evaluation Expenditure (note 12) 36,944 31,765
Deferred Tax Assets 214 322
Production Properties (note 13) 73,935 84,886
Total Assets 116,719 129,653
Current Liabilities:
Payables 11,159 8,347
Current Tax Liabilities 3,973 1,293
Non-Current Liabilities:
Restoration 6,099 5,411
Deferred Tax Liabilities 22,106 23,098
Total Liabilities 43,337 38,149
Net Assets 73,382 91,504
Income and expenses of the consolidated entity attributable to joint ventures:
Income 49,798 41,222
Expenses 19,131 13,778
Refer to note 25 in relation to contingent liabilities of the Group. Commitments for expenditure are disclosed in note 18.

66
18 Commitments for Expenditurea) Exploration Tenements
In order to maintain current rights of tenure to petroleum exploration tenements, the Group has discretionary exploration expenditure requirements up until expiry of the primary term of the tenements. These requirements, which are subject to renegotiation and are not provided for in the financial statements, are payable as follows:
Consolidated
2013 $000’s
2012 $000’s
Not later than 1 year 12,700 4,891
Later than 1 year but not later than 2 years 4,000 494
Later than 2 years but not later than 5 years 20,000 -
Later than 5 years - -
36,700 5,385
If the economic entity decides to relinquish certain tenements and/or does not meet these obligations, assets recognised in the Statement of Financial Position may require review in order to determine the appropriateness of carrying values. The sale, transfer or farm-out of exploration rights to third parties could potentially reduce or extinguish these obligations, which comprise primarily drilling commitments entered into during the 2013 financial year.
All commitments relate to Joint Venture projects.
b) Production Development Expenditure
In order to maintain and improve existing production properties the Group has committed to expend funds as follows:
Consolidated
2013 $000’s
2012 $000’s
Not later than 1 year 18,988 412
Later than 1 year but not later than 2 years 10,906 -
Later than 2 years but not later than 5 years 1,161 -
Later than 5 years - -
31,055 412
All development expenditure commitments relates to the development of oil and gas fields.
c) Operating Lease Commitments
Consolidated
2013 $000’s
2012 $000’s
Non-cancellable operating lease relating to rental of premises are payable as follows:
Not later than 1 year 62 123
Later than 1 year but not later than 2 years - 62
Later than 2 years but not later than 5 years - -
Later than 5 years - -
62 185

67
Cue
Ener
gy R
esou
rces
Lim
ited
Annu
al R
epor
t 201
2/13
Fina
ncia
l Rep
ort 2
012/
13
67
19 Events Subsequent to Balance DateThe Company wishes to advise that production from the Maari field will be deferred until December 2013 to effect repairs to the facilities. The costs of the repairs are yet to be finalised, but it is expected that some of the costs will be covered by insurance. Cue’s share of deferred production while the vessel is out of service is estimated to be 50,000 boe, or 5.3% of Cue’s production for the year to 30 June 2013.
Apart from the above, the Directors are not aware of any matter or circumstance since the end of the financial year, not otherwise dealt with in this report that has significantly or may significantly affect the operations of Cue Energy Resources Limited, the results of those operations or the state of affairs of the Company or Group.
20 Earnings Per Share Consolidated
2013 2012
Basic earnings per share (cents) 0.91 0.81
Diluted earnings per share (cents) 0.91 0.81
Basic earnings per share is calculated by dividing profit after income tax expense for the year attributable to ordinary equity holders of the Parent by the weighted average number of ordinary shares outstanding during the year.
Diluted earnings per share is calculated by dividing the profit after income tax expense for the year attributable to ordinary equity of the Parent by the weighted average number of ordinary shares outstanding during the year plus the weighted average number of ordinary shares that would be issued on the conversion of all the dilutive potential ordinary shares into ordinary shares.
Consolidated
2013 2012
Earnings used in the calculation of basic and diluted earnings per share:
Profit for the year attributable to ordinary equity holders of the Parent from continuing operations ($’000) 6,369 5,663
Weighted average number of shares used for the purposes of calculating basic earnings per share 698,119,720 695,672,087
Weighted average adjustments for calculation of diluted earnings per share:
Performance Rights on issue 3,719,452 1,914,754
Share options on issue - 2,739,680
Weighted average number of shares used for the purpose of calculating diluted earnings per share 701,839,172 700,326,521
During the year nil (2012: 3.3 million) share options and nil (2012: nil) performance rights were converted into ordinary shares. The diluted earnings per share calculation includes that portion of these share options and performance rights assumed to be issued for nil consideration weighted with reference to the date of conversion.
Information Concerning the Classification of Securities
All outstanding share options and performance rights are considered to be potential dilutive ordinary shares and have been included in the determination of diluted earnings per share.

68
21 Financial Reporting by Segments Segment Information
AASB 8 requires operating segments to be identified on the basis of internal reports about components of the Group that are regularly reviewed and used by the Board of Directors (who are identified as the Chief Operating Decision Makers (“CODM”)) in assessing performance and in determining the allocation of resources.
The CODM assesses the performance of the operating segments based upon a measure of earnings before interest expense, tax, depreciation and amortisation. The accounting policies adopted for internal reporting to the CODM are consistent with those adopted in the financial statements.
The principal business of the group is the production and exploration for hydrocarbons in Australia, New Zealand, Indonesia and PNG. The board considers the business from both a product and geographic perspective and has identified four reportable segments. Information regarding the Group’s reportable segments is presented below:
2013 Australia NZ Indonesia PNG Total
$’000 $’000 $’000 $’000 $’000
Production Revenue - 19,590 27,926 2,282 49,798
Production Expenses - (8,450) (9,201) (1,480) (19,131)
Gross Profit - 11,140 18,725 802 30,667
Other revenue 160 - - - 160
Foreign exchange movement 4,443 (237) (504) - 3,702
Earnings/(loss) before interest expense, tax, depreciation and amortisation (3,955) 10,903 18,221 802 25,971
Profit/(loss) after income tax expense (3,993) 5,426 4,501 435 6,369
2012 Australia NZ Indonesia PNG Total
$’000 $’000 $’000 $’000 $’000
Production Revenue - 21,874 16,106 3,242 41,222
Production Expenses - (6,085) (6,769) (924) (13,778)
Gross Profit - 15,789 9,337 2,318 27,444
Other revenue 432 - - - 432
Foreign exchange movement 2,616 - - - 2,616
Earnings/(loss) before interest expense, tax, depreciation and amortisation (3,195) 15,789 9,337 2,318 24,249
Profit/(loss) after income tax expense (3,238) 10,941 (3,611) 1,571 5,663
Total segment assets
30 June 2013 63,905 61,394 46,912 4,026 176,237
30 June 2012 38,216 60,554 61,336 3,930 164,036
Total segment liabilities
30 June 2013 1,340 13,949 27,651 1,728 44,668
30 June 2012 1,116 11,851 24,322 1,569 38,858
Depreciation and Amortisation
30 June 2013 (39) (4,048) (13,378) (94) (17,559)
30 June 2012 (44) (3,982) (6,320) (198) (10,544)
Additions to Non-Current Assets
30 June 2013 429 8,250 3,334 402 12,415
30 June 2012 2,732 7,251 36,229 432 46,644

69
Cue
Ener
gy R
esou
rces
Lim
ited
Annu
al R
epor
t 201
2/13
Fina
ncia
l Rep
ort 2
012/
13
69
21 Financial Reporting by Segments (cont’)Reconciliation of earnings before interest expense, tax, depreciation and amortisation (EBITDA) to Profit before Income Tax:
2013 $’000
2012 $’000
EBITDA 25,971 24,249
Interest expense (3) (84)
Depreciation (39) (44)
Amortisation (17,520) (10,500)
Profit before income tax expense 8,409 13,621
22 Share Based PaymentsDirectors and Employee Benefits – Share Based Payment Plans
Performance rights over shares in Cue Energy Resources Limited were granted under the Cue Energy Resources Limited Performance Rights Plan (the ‘Plan’) which was approved by shareholders at the general meeting held on 24 November 2011. The Plan is designed to align the interests of executives with shareholders by providing direct participation in the benefits of future Company performance over the medium to long term.
Ownership based compensation payments for employees and executives of the group are made at the discretion of the Board. At year end the current participants in the Plan are A.M. Knox and D.B. Whittam.
Under the Plan, participants were granted performance rights which only vest if certain performance standards (as disclosed in the Remuneration Report) are met and the executive remains employed by the Company until the end of the vesting period. The selection of suitable performance benchmarks was considered critical to securing the objectives of the Plan, and benchmark price levels for vesting were set at significantly higher levels than those prevailing at the time of structuring the Plan.
Performance rights are not listed and carry no dividend or voting rights. Upon exercise, each option or performance right is convertible into one ordinary share to rank pari passu in all respects with the Company’s existing fully paid ordinary shares.
In addition, the company historically had share options on issue to certain employees and other executives. As at 30 June 2012, all these options had either been exercised or had expired.
Share-Based Payments
The following reconciles the outstanding share options and performance rights granted as remuneration in the current and prior financial years at the beginning and end of the year.
2013 2013 2012 2012
Number of Share Rights
Number of Options
Number of Share Rights
Number of Options
Balance at beginning of the year 3,200,000 - - 4,300,000
Granted during the year 3,200,000 - 4,000,000 -
Forfeited during the year (4,000,000) - (800,000) -
Exercised during the year - - - (3,300,002)
Lapsed during the year (800,000) - - (999,998)
Balance at end of the year 1,600,000 - 3,200,000 -
During the year 4,000,000 performance rights were forfeited following resignation of M.J. Paton and A.B. Parks.
None of the performance rights outstanding as at 30 June 2013 had vested.
The fair value of performance rights granted was calculated using a risked statistical analysis. This expense has been apportioned pro-rata to reporting periods where vesting periods apply.

70
22 Share Based Payments (cont’)Key inputs to the model used to calculate the fair value of performance rights issued during the year are as follows:
Grant date: 28 September 2012
Expected price volatility (i) 45%
Exercise price nil
Expiry date 30 June 2014
Share price at grant date A$0.14
Risk free interest rate (ii) 3.0%
(i) Expected price volatility was 45% (based on the historical volatility adjusted for any expected changes to future volatility due to publicly available information).
(ii) Risk free rates of securities with comparable terms to maturity.
For the full entitlement of these performance rights to vest, the top range of the Performance Hurdle would need to be met of a volume weighted average price of 60 cents for thirty consecutive days between 1 July 2013 and 30 June 2014.
On this basis the weighted average fair value of each of the performance rights at the date of grant was A$0.028.
Performance rights can only be exercised if they have vested and can be exercised at any time until their expiry. The exercise of any vested performance right may only be effected in such form and manner as the Board prescribed.
Participants will not be required to make any payment for the grant of the performance rights on the exercise of a vested performance right. At 30 June 2013 the maximum number of performance rights that could vest in future periods and hence be exercised by the Participants are as follows:
A.M. Knox 800,000
D.B. Whittam 800,000
Grant date Expiry date
Balance at start of
the year
Number
Granted during
the year
Number
Lapsed during
the year
Number
Forfeited during
the year
Number
Balance at end of
the year
Number
Vested and exercisable
at end of the year
Number
24 November 2011 30 June 2013 3,200,000 - (800,000) (2,400,000) - -
28 September 2012 30 June 2014 - 3,200,000 - (1,600,000) 1,600,000 -
Weighted average remaining contractual life of performance rights is one year (2012: one year). The weighted average exercise price for performance rights at 30 June 2013 was nil (2012: nil). Also, the weighted average share price during the year ended 30 June 2013 was A$0.14 (2012: A$0.25).

71
Cue
Ener
gy R
esou
rces
Lim
ited
Annu
al R
epor
t 201
2/13
Fina
ncia
l Rep
ort 2
012/
13
71
23 Key Management Personnel and Related Party Disclosures The following were Directors of Cue Energy Resources Limited during the financial year:
Chairman
G.J. King (Non-Executive)
Non-Executive Directors
T.E. Dibb
P.D. Moore
A.A. Young
L. Musca (retired 15 November 2012)
R.G. Tweedie (retired 25 February 2013)
S.J. Koroknay (deceased 6 June 2013)
Key Management Personnel
The following executives, in addition to those directors identified above comprise Key Management Personnel:
Name Position
D.A.J. Biggs (commenced 22 April 2013) Chief Executive Officer
A.M. Knox Company Secretary and Chief Financial Officer
D.B. Whittam Exploration Manager
M.J. Paton (resigned 14 November 2012) Chief Executive Officer
A.B. Parks (resigned 30 August 2012) Chief Commercial Officer
Remuneration
Management Personnel
Total remuneration payments and equity issued to Directors and Key Management personnel are summarised below. Elements of Directors and executives remuneration includes:
• Short term employments benefits, including non monetary benefits
• Post employment benefits – superannuation
• Share based payments
• Share purchases through Directors’ Saving Plan
Consolidated Entity
2013 $
2012 $
Short term employment benefits (including non-monetary benefits) 2,615,912 1,723,668
Post employment benefits 90,236 192,841
Share purchases - 100,000
Share based payments 22,400 33,600
2,728,548 2,050,109
Refer to the Remuneration Report in the Directors’ Report for detailed compensation disclosures on key management personnel.

72
23 Key Management Personnel and Related Party Disclosures (cont’)Share Options Holdings
The number of options in ordinary shares in the Company held during the financial year by each Director of Cue Energy Resources Limited and each of the Executives, noted above, including their personally related entities are set out below:
2013
Balance at start of year or
appointment date
Granted during year as
remuneration
Exercised during
year
Expired during
yearBalance at end
of year
Vested and exercisable at
end of year
Directors
R.G. Tweedie(i) - - - - - -
T.E. Dibb - - - - - -
G.J. King - - - - - -
S.J. Koroknay(ii) - - - - - -
L. Musca(iii) - - - - - -
P.D. Moore - - - - - -
A.A. Young - - - - - -
Executives
M.J. Paton(iv) - - - - - -
D.A.J. Biggs(v) - - - - - -
A.M. Knox - - - - - -
D.B. Whittam - - - - - -
A.B Parks(vi) - - - - - -
(i) R.G. Tweedie retired 25 February 2013
(ii) S.J. Koroknay deceased 6 June 2013
(iii) L. Musca retired 15 November 2012
2012
Balance at start of year or
appointment date
Granted during year as
remuneration
Exercised during
year
Expired during
yearBalance at end
of year
Vested and exercisable at
end of year
Directors
R.G. Tweedie - - - - - -
T.E. Dibb(i) - - - - - -
G.J. King(ii) - - - - - -
S.J. Koroknay - - - - - -
L. Musca - - - - - -
P.D. Moore(iii) - - - - - -
A.A. Young(iv) - - - - - -
Executives
M.J. Paton - - - - - -
D.B. Whittam - - - - - -
A.B. Parks - - - - - -
T. White - - - - - -
A.M. Knox 1,500,000 - (1,500,000) - - -
(i) T.E. Dibb appointed 24 November 2011
(ii) G.J. King appointed 24 November 2011
(iii) P.D. Moore appointed 24 November 2011
(iv) A.A. Young appointed 13 December 2011
(iv) M.J. Paton resigned 14 November 2012
(v) D.A.J. Biggs commenced 22 April 2013
(vi) A.B. Parks resigned 30 August 2012

73
Cue
Ener
gy R
esou
rces
Lim
ited
Annu
al R
epor
t 201
2/13
Fina
ncia
l Rep
ort 2
012/
13
73
23 Key Management Personnel and Related Party Disclosures (cont’)Options issued have been valued using the Black Scholes option valuation methodology in prior financial years and are not based on Company performance, but industry practice. There are no further conditions attached to these options.
Performance Rights Holdings
The number of performance rights in ordinary shares in the Company held during the financial year by each Director of Cue Energy Resources Limited and each of the Executives, noted above, including their personally related entities are set out below:
Expiry Date
Balance at start of
the year
Number
Granted during
the year
Number
Lapsed during
the year
Number
Forfeited during
the year
Number
Balance at end of
the year
Number
Vested and exercisable
at end of the year
Number
2013
M.J. Paton(i) 30 June 2014 1,600,000 1,600,000 - (3,200,000) - -
A.M. Knox 30 June 2014 800,000 800,000 (800,000) - 800,000 -
A.B. Parks(ii) 30 June 2014 800,000 - - (800,000) - -
D.B. Whittam 30 June 2014 - 800,000 - - 800,000 -
(i) M.J. Paton resigned 14 November 2012.
(ii) A.B. Parks resigned 30 August 2012.
Expiry Date
Balance at start of
the year
Number
Granted during
the year
Number
Lapsed during
the year
Number
Forfeited during
the year
Number
Balance at end of
the year
Number
Vested and exercisable
at end of the year
Number
2012
M.J. Paton 30 June 2013 - 1,600,000 - - 1,600,000 -
A.M. Knox 30 June 2013 - 800,000 - - 800,000 -
A.B. Parks 30 June 2013 - 800,000 - - 800,000 -
T. White(i) 30 June 2013 - 800,000 - (800,000) - -
D.B. Whittam(ii) 30 June 2013 - - - - - -
(i) T. White retired 17 May 2012.
(ii) D.B. Whittam commenced 18 June 2012.

74
23 Key Management Personnel and Related Party Disclosures (cont’)Ordinary Shareholdings
Balance at start of year or
appointment date
Acquired during year on exercise of
options Other purchases
Purchases as part of Directors’
Savings Plan*
Balance at report date, resignation
date or retirement date
Directors 2013
R.G. Tweedie(i) 3,932,261 - - - 3,932,261
T.E. Dibb - - - - -
G.J. King 2,500 - 20,000 - 22,500
S.J. Koroknay(ii) 100,000 - 150,000 - 250,000
P.D. Moore - - - - -
L. Musca(iii) 12,771,227 - - - 12,771,227
A.A. Young - - 150,000 - 150,000
(i) R.G. Tweedie retired 25 February 2013
(ii) S.J. Koroknay deceased 6 June 2013
(iii) L. Musca retired 15 November 2013
Directors 2012
R.G. Tweedie 3,641,018 - - 291,243 3,932,261
T.E. Dibb(i) - - - - -
G.J. King(ii) 2,500 - - - 2,500
S.J. Koroknay 100,000 - - - 100,000
P.D. Moore(iii) - - - - -
L. Musca 12,771,227 - - - 12,771,227
A.A. Young(iv) - - - - -
* Share purchases made on behalf of Directors as part of their remuneration for the year ended 30 June 2012.
(i) T. Dibb appointed 24 November 2011
(ii) G.J. King appointed 24 November 2011
(iii) P.D. Moore appointed 24 November 2011
(iv) A.A. Young appointed 13 December 2011

75
Cue
Ener
gy R
esou
rces
Lim
ited
Annu
al R
epor
t 201
2/13
Fina
ncia
l Rep
ort 2
012/
13
75
23 Key Management Personnel and Related Party Disclosures (cont’)Key Management Personnel 2013
Balance at start of year or
appointment date
Acquired during year on exercise of
options Other Purchases
Purchases as part of Directors’
Savings Plan*
Balance at report date, resignation
date or retirement date
D.A.J. Biggs(i) - - - - -
M.J. Paton(ii) 1,492,881 - - - 1,492,881
A.M. Knox 4,458,252 - - - 4,458,252
D.B. Whittam - - - - -
A.B. Parks(iii) 139,421 - - - 139,421
(i) D.A.J. Biggs commenced 22 April 2013
(ii) M.J. Paton resigned 14 November 2012
(iii) A.B. Parks resigned 30 August 2012
Key Management Personnel 2012
M.J. Paton 1,492,881 - - - 1,492,881
A.M. Knox 2,337,245 1,500,000 621,007 - 4,458,252
A.B. Parks 139,421 - - - 139,421
T. White(i) 24,000 - - - 24,000
D.B. Whittam(ii) - - - - -
(i) T. White retired 17 May 2012
(ii) D.B. Whittam commenced18 June 2012
* Share purchases made on behalf of Directors as part of their remuneration for the year ended 30 June 2012.

76
23 Key Management Personnel and Related Party Disclosures (cont’) Related Party Transactions
Members of the Board of Directors
The Directors in office during the year were R.G. Tweedie, L. Musca, S.J. Koroknay, A.A. Young, T.E. Dibb, P.D. Moore and G.J. King. During the year Directors’ fees were paid by the parent company of $596,769 (2012: $536,141).
2013Director’s fees
$Consulting fees
$Total fees
$Expenses
$Total
$
G.J. King(i) 100,000 4,800 104,800 11,137 115,937
P.D. Moore(ii) 100,000 - 100,000 862 100,862
T.E. Dibb(iii) 100,000 23,000 123,000 12,946 135,946
A.A. Young(iv) (viii) 100,000 286,500 386,500 55,598 442,098
S.J. Koroknay(v) 93,407 - 93,407 7,064 100,471
R.G. Tweedie(vi) 65,862 - 65,862 8,271 74,133
L. Musca(vii) 37,500 - 37,500 20,644 58,144
Total 596,769 314,300 911,069 116,522 1,027,591
(i) G.J. King & Associates
(ii) Heriot Nominees Limited
(iii) 50% Heriot Nominees Limited and 50% T. Dibb/Colonial First State FirstChoice Wholesale Personal Super
(iv) Andrew A. Young and Associates
(v) S.J. Koroknay/SJK Superannuation (deceased 6 June 2013)
(vi) R.G. Tweedie (retired 25 February 2013)
(vii) Leon Nominees Pty Ltd (retired 15 November 2012)
(viii) A.A. Young was acting CEO/Executive Director 14 November 2012 to 21 April 2013.
2012Director’s fees
$Consulting fees
$Total fees
$Expenses
$Total
$
G.J. King(i) 60,326 - 60,326 1,121 61,447
P.D. Moore(ii) 60,326 - 60,326 - 60,326
T.E. Dibb(iii) 60,326 - 60,326 - 60,326
A.A. Young(iv) 55,163 - 55,163 1,065 56,228
S.J. Koroknay 100,000 - 100,000 1,936 101,936
R.G. Tweedie 100,000 - 100,000 12,233 112,233
L. Musca 100,000 - 100,000 - 100,000
Total 536,141 - 536,141 16,355 552,496
(i) G.J. King appointed 24 November 2011
(ii) P.D. Moore appointed 24 November 2011
(iii) T.E. Dibb appointed 24 November 2011
(iv) A.A. Young appointed 24 November 2011
The expenditure has been included in profit or loss and any amounts payable included in note 15.

77
Cue
Ener
gy R
esou
rces
Lim
ited
Annu
al R
epor
t 201
2/13
Fina
ncia
l Rep
ort 2
012/
13
77
23 Key Management Personnel and Related Party Disclosures (cont’) Consolidated Entities
Details of controlled entities are shown in note 11.
Advances to/(from) controlled entities from/by Cue Energy Resources Limited, net of provisions for impairment, at the reporting date are as follows:
2012 $
Movement $
2013 $
Cue Exploration Pty Ltd 4,745,227 409,885 5,155,112
Cue PNG Oil Pty Ltd 1,166,146 404,554 1,570,700
Cue (Ashmore Cartier) Pty Ltd (6,778,780) 4,552,451 (2,226,329)
Cue Mahakam Hilir Pty Ltd 9,555,953 2,250,843 11,806,796
Cue Sampang Pty Ltd 16,293,891 (1,365,790) 14,928,101
Cue Taranaki Pty Ltd 16,028,376 (1,628,829) 14,399,547
Cue Energy Holdings Ltd (573,720) 573,720 -
Cue Energy Malaysia Sdn Bhd 747,171 (747,171) -
Total 41,184,264 4,449,663 45,633,927
Repayment of amounts owing to the Company as at 30 June 2013 and all future debts due to the Company, by the controlled entities are subordinated in favour of all other creditors. Cue Energy has agreed to provide sufficient financial assistance to the controlled entities as and when it is needed to enable the controlled entities to continue operations.
The parent company has provided a financial guarantee for Cue Taranaki’s performance, as required by the Maari FPSO lease and contract.
The parent company provides management, administration and accounting services to the subsidiaries. A management fee of $480,000 (2012: $480,000) and interest of $422,873 (2012: $385,561) were charged by the parent company to Cue PNG Oil Company Pty Ltd. Management fees of $2,494,234 (2012: $1,406,289) and interest of $858,562 (2012: $nil) were charged by the parent company to Cue Taranaki Pty Ltd.

78
24 Notes to the Statement of Cash FlowsConsolidated
2013 $’000
2012 $’000
(a) Reconciliation of operating profit to net cash flows from operating activities:
Profit after income tax expense for the year 6,369 5,663
Adjustments for:
Depreciation 39 44
Amortisation 17,520 10,500
Share based payments 22 34
Net gain on foreign currency conversion (3,752) (1,625)
Impact of changes in working capital items
Decrease/(increase) in assets 7,101 (4,967)
Increase in liabilities 5,430 2,080
Net cash flows from operating activities 32,729 11,729
(b) Cash comprises cash balances held in Australia dollars and foreign currencies, principally US dollars, within Australia and overseas:
Australia 57,554 32,573
New Zealand 102 1,152
Papua New Guinea 8 8
Indonesia 1,164 -
Cash and bank balances 58,828 33,733
Cash Flow Statement cash balance 58,828 33,733

79
Cue
Ener
gy R
esou
rces
Lim
ited
Annu
al R
epor
t 201
2/13
Fina
ncia
l Rep
ort 2
012/
13
79
25 Parent Entity InformationParent Entity
2013 $’000
2012 $’000
Information relating to Cue Energy Resources Limited:
Financial position
Current assets 59,457 33,977
Non-current assets 46,282 41,853
Total assets 105,739 75,830
Current liabilities (1,300) (664)
Non-current liabilities (38) (44)
Total liabilities (1,338) (708)
Net assets 104,401 75,122
Contributed equity 152,416 152,416
Reserves 22 425
Accumulated losses (48,037) (77,719)
Net assets 104,401 75,122
Financial performance
Profit/(loss) for the year 29,257 (35)
Comprehensive profit/(loss) for the year 29,257 (35)
Capital Commitments
The parent entity has no commitments for the acquisition of capital assets as at 30 June 2013 (2012: nil).
Finance Leases
The parent entity has no commitments in relation to finance leases as at 30 June 2013 (2012: nil).
Contingent Liabilities
As a result of an economic project arrangement in the Jeruk field within the Sampang PSC, Indonesia, Cue may in certain circumstances have an obligation to reimburse certain monies spent by the incoming party from future profit oil within the Sampang PSC. There is a dispute between Cue and the incoming party as to the quantum of monies that they may be entitled to claim by way of such reimbursement and when any such reimbursement would be payable. The Company is of the view that any amount which might eventually become payable would not be likely to exceed the amount of USD5.3 million which has been provided for in the accounts. The Company awaits the outcome of an arbitration hearing.
Apart from the above, the parent entity is not subject to any liabilities that are considered contingent upon events known at the reporting date.

80

81
Cue
Ener
gy R
esou
rces
Lim
ited
Annu
al R
epor
t 201
2/13
81
Inde
pend
ent A
udito
r’s R
epor
t

82
Shareholder Information
1) Spread of ShareholdingsSpread of holdings of quoted shares of no par value in the Company as at 30th of September 2013:
Number Held Ordinary
1 – 1,000 285
1,001 – 5,000 1,238
5,001 – 10,000 945
10,001 – 100,000 2,464
Over 100,000 530
Total 5,462
2) Unmarketable Parcels The number of shareholders holding less than a marketable parcel as at 30th of September 2013 is 1,100.
3) Substantial ShareholdersThe names and holdings of substantial shareholders in the Company as at 30th of September 2013:
Quoted Shares Fully Paid
Todd Petroleum Mining Company Limited 163,103,314
UOB Kay Hian Private Limited 114,926,671
4) Voting RightsAt meeting of members or classes of members:
(a) each member entitled to vote may vote in person or by proxy, attorney or representative;
(b) on a show of hands, every person present who is a member or a proxy, attorney or representative of a member has one vote; and
(c) on a poll, every person present who is a member or a proxy, attorney or representative of a member has:
(i) for each fully paid share held by person, or in respect of which he/she is appointed a proxy, attorney or representative, one vote for the share;
(ii) for each partly paid share, only the fraction of one vote which the amount paid (not credited) on the share bears to the total amounts paid and payable on the share (excluding amounts credited).
Subject to any rights or restrictions attached to any shares or class or classes of shares.

83
Cue
Ener
gy R
esou
rces
Lim
ited
Annu
al R
epor
t 201
2/13
83
Shar
ehol
der I
nfor
mat
ion
Shareholder Information (cont’)Shareholder Information (cont’)
5) Registered Top 20 ShareholdersThe registered names and holdings of the 20 largest holdings of quoted ordinary shares in the Company as at 30th of September 2013:
Shareholder Ordinary Shares Percentage Held
1 Todd Petroleum Mining Co 163,103,314 23.36%
2 UOB Kay Hian Private Limited 114,926,671 16.46%
3 Todd Tasman Oil Pty Ltd 25,920,000 3.71%
4 Portfolio Securities Pty Ltd 10,000,000 1.43%
5 Custodial Services Limited 8,602,025 1.23%
6 HSBC Custody Nominees (Australia) Limited 8,089,350 1.16%
7 Gascorp Australia Pty Ltd 7,609,742 1.09%
8 Citicorp Nominees Pty Ltd 5,765,958 0.83%
9 JP Morgan Nominees Australia Limited 5,588,857 0.80%
10 Reviresco Nominees Pty Ltd 5,150,000 0.74%
11 Finot Pty Ltd 5,000,000 0.72%
12 Douglas Financial Consultants Pty Ltd 4,400,000 0.63%
13 Grizzley Holdings Pty Limited 4,312,604 0.62%
14 Berne No 132 Nominees Pty Ltd 4,300,000 0.62%
15 Ultragas Pty Ltd 4,294,286 0.62%
16 Mr Ernest Geoffrey Albers 4,010,784 0.57%
17 Bass Strait Group Pty Ltd 4,000,168 0.57%
18 SCFI Pty Ltd 3,580,000 0.51%
19 Great Missenden Holdings Pty Ltd 3,392,859 0.49%
20 Mr Richard Tweedie 3,363,477 0.48%
395,410,095 56.64%

84
6) HoldersThe number of holders of each class of equity securities as at 30th of September 2013 was:
Class of Security Number
Ordinary Fully Paid Shares 5,462
Unlisted Performance Rights 2
7) Vendor SecuritiesThere are no restricted securities on issue as at 30th of September 2013.
8) Unquoted Securities20 largest holders of Unlisted Performance Rights as at 30th of September 2013:
Name
Number of Unlisted Performance Rights
Held Expiring 30/06/2014
% Held of Total 30/06/2014
Issued Unlisted Performance Rights
Total Number of Performance Rights/
Shares Held
% Held of Total Issued Unlisted Performance
Right/Shares
A.M. Knox 800,000 50 800,000 50
D.B. Whittam 800,000 50 800,000 50
1,600,000 100 1,600,000 100
Shareholder Information (cont’)
Designed and produced by GH2 Design 0409 380199

ABN 45 066 383 971
Level 21, 114 William Street Melbourne Victoria 3000 Australia T: +61 3 9670 8668 F: +61 3 9670 8661 W: www.cuenrg.com.au E: [email protected]
CUE EN
ERG
Y RESO
UR
CES LIMITED
AN
NU
AL R
EPO
RT 2012/
13
Annual Report 2012/13
Exciting times ahead
Photo courtesy of OMV