pages sampleultimate2.shoppepro.com/~ibidcoma/samples/star/ibid biology ia...2.7 guidelines for the...
TRANSCRIPT
SAMPLE PAGES
I B Biology IA Handbook
COPY MASTERS(For use with the IB Diploma programme)
(Third edition)
Author: Chris Talbot
Series editor: David Greig

SAMPLE PAGES
Table of Contents
Chapter 1 - Personal Engagement (Criterion 1) 1
Chapter 2 - Exploration (Criterion 2) 32.1 Defining the Research Question 42.2 Variables 42.3 Hypotheses 72.4 Relationships between variables 92.5 Ethics 92.6 Developing a method for collection of data 112.7 Guidelines for the Design of IB Biology Individual Investigations 11Chapter 3 - Analysis (Criterion 3) 143.1 Recording raw data 153.2 Comparison of features 173.3 Data 203.4 Types of variables 213.5 Organising and presenting biological data in tables 223.6 International System of Units (SI) 263.7 Additional Comments and Guidance 263.8 Measurement 323.9 Significant Figures 343.10 Sources of error in biological data 393.11 Processing raw data 393.12 Descriptive Statistics using Excel 443.13 Presenting processed data 463.14 Graphing Data 523.15 Using Units In Calculations 60Chapter 4 - Evaluation (Criterion 4) 624.1 Interpreting Graphs 634.2 Using Graphs 664.3 Evaluating procedures 694.4 Improving the investigation 714.5 Limitations of measurements and procedures 72
SAMPLE PAGES
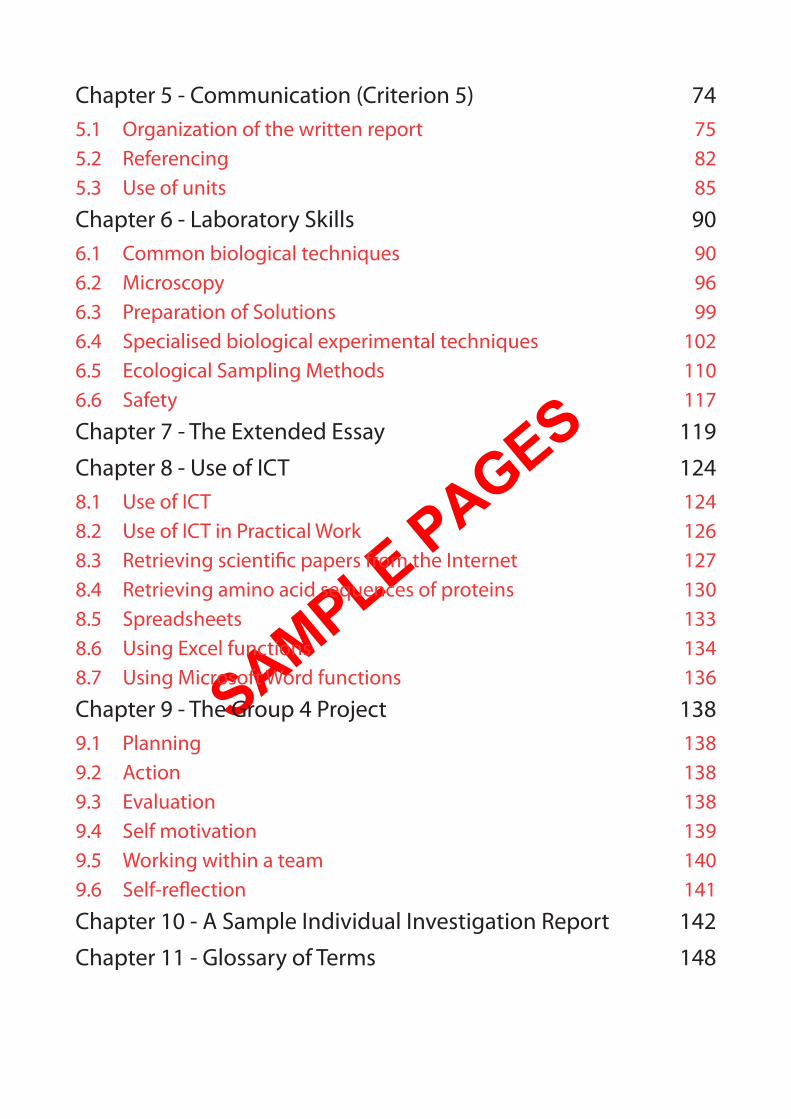
Chapter 5 - Communication (Criterion 5) 745.1 Organization of the written report 755.2 Referencing 825.3 Use of units 85
Chapter 6 - Laboratory Skills 906.1 Common biological techniques 906.2 Microscopy 966.3 Preparation of Solutions 996.4 Specialised biological experimental techniques 1026.5 Ecological Sampling Methods 1106.6 Safety 117
Chapter 7 - The Extended Essay 119
Chapter 8 - Use of ICT 1248.1 Use of ICT 1248.2 Use of ICT in Practical Work 1268.3 Retrieving scientific papers from the Internet 1278.4 Retrieving amino acid sequences of proteins 1308.5 Spreadsheets 1338.6 Using Excel functions 1348.7 Using Microsoft Word functions 136
Chapter 9 - The Group 4 Project 1389.1 Planning 1389.2 Action 1389.3 Evaluation 1389.4 Self motivation 1399.5 Working within a team 1409.6 Self-reflection 141
Chapter 10 - A Sample Individual Investigation Report 142
Chapter 11 - Glossary of Terms 148
SAMPLE PAGES
62
©ib
id.c
om
.au
20
14
Th
is p
ag
e m
ay
on
ly b
e le
ga
lly u
se
d u
nd
er
th
e c
on
dit
ion
s o
f sa
le
IAI
nt
er
na
ti
on
al
B
ac
ca
la
ur
ea
te
Bi
ol
og
y
In
te
rn
al
A
ss
es
sm
en
t
Ha
nd
bo
ok
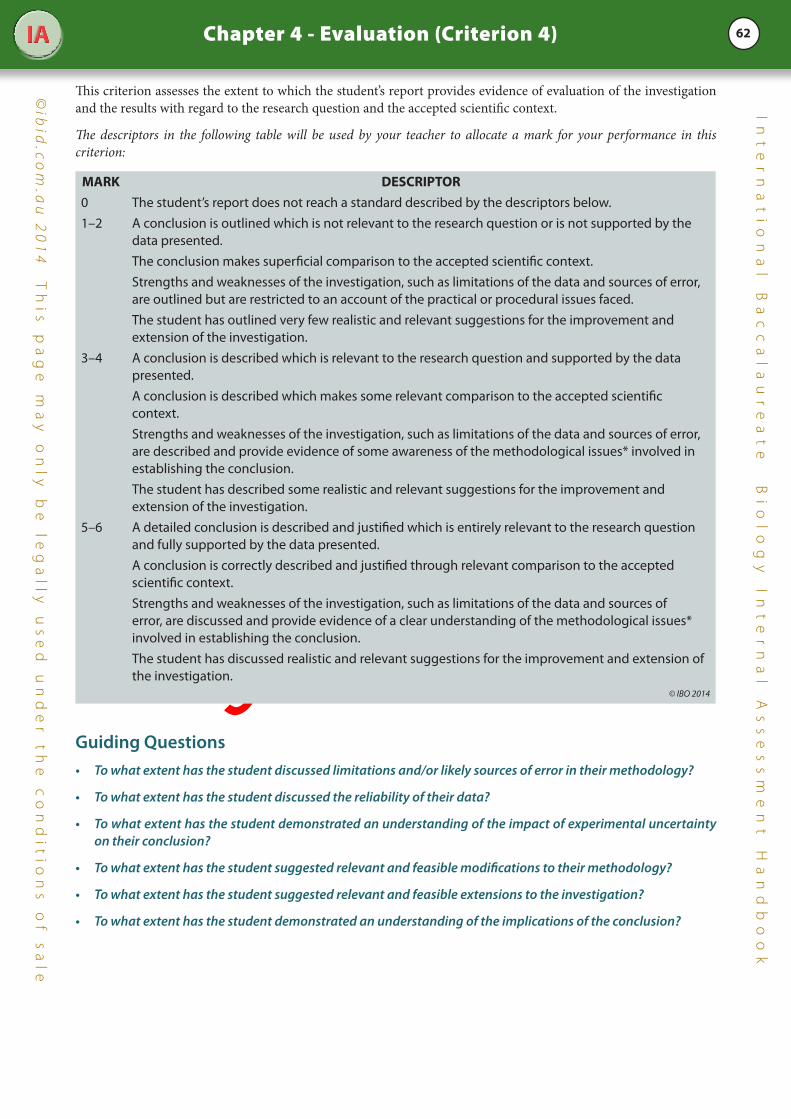
Chapter 4 - Evaluation (Criterion 4)
This criterion assesses the extent to which the student’s report provides evidence of evaluation of the investigation and the results with regard to the research question and the accepted scientific context.
The descriptors in the following table will be used by your teacher to allocate a mark for your performance in this criterion:
MARK DESCRIPTOR0 The student’s report does not reach a standard described by the descriptors below.1–2 A conclusion is outlined which is not relevant to the research question or is not supported by the
data presented.The conclusion makes superficial comparison to the accepted scientific context.Strengths and weaknesses of the investigation, such as limitations of the data and sources of error, are outlined but are restricted to an account of the practical or procedural issues faced.The student has outlined very few realistic and relevant suggestions for the improvement and extension of the investigation.
3–4 A conclusion is described which is relevant to the research question and supported by the data presented.A conclusion is described which makes some relevant comparison to the accepted scientific context.Strengths and weaknesses of the investigation, such as limitations of the data and sources of error, are described and provide evidence of some awareness of the methodological issues* involved in establishing the conclusion.The student has described some realistic and relevant suggestions for the improvement and extension of the investigation.
5–6 A detailed conclusion is described and justified which is entirely relevant to the research question and fully supported by the data presented.A conclusion is correctly described and justified through relevant comparison to the accepted scientific context.Strengths and weaknesses of the investigation, such as limitations of the data and sources of error, are discussed and provide evidence of a clear understanding of the methodological issues* involved in establishing the conclusion.The student has discussed realistic and relevant suggestions for the improvement and extension of the investigation.
© IBO 2014
Guiding Questions• Towhatextenthasthestudentdiscussedlimitationsand/orlikelysourcesoferrorintheirmethodology?
• Towhatextenthasthestudentdiscussedthereliabilityoftheirdata?
• Towhatextenthasthestudentdemonstratedanunderstandingoftheimpactofexperimentaluncertaintyontheirconclusion?
• Towhatextenthasthestudentsuggestedrelevantandfeasiblemodificationstotheirmethodology?
• Towhatextenthasthestudentsuggestedrelevantandfeasibleextensionstotheinvestigation?
• Towhatextenthasthestudentdemonstratedanunderstandingoftheimplicationsoftheconclusion?
SAMPLE PAGES
63
©ib
id.c
om
.au
20
14
Th
is p
ag
e m
ay
on
ly b
e le
ga
lly u
se
d u
nd
er
th
e c
on
dit
ion
s o
f sa
le
IAI
nt
er
na
ti
on
al
B
ac
ca
la
ur
ea
te
Bi
ol
og
y
In
te
rn
al
A
ss
es
sm
en
t
Ha
nd
bo
ok
Chapter 4 - Evaluation (Criterion 4)
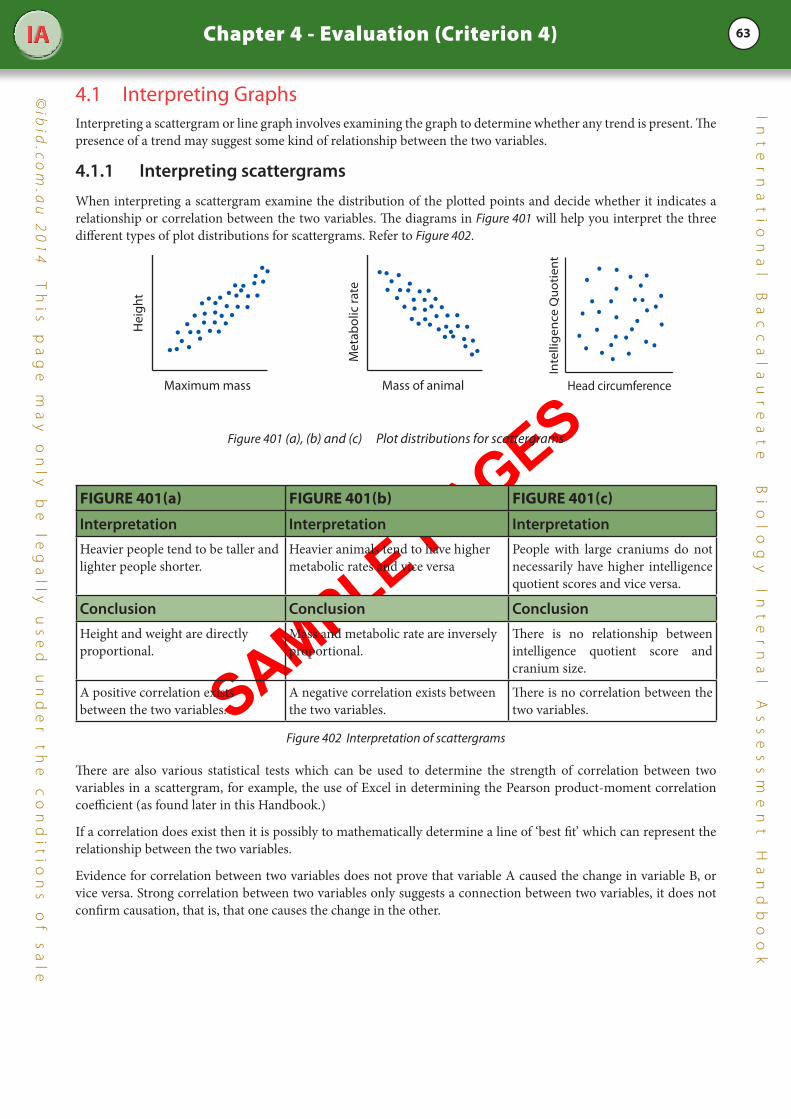
4.1 Interpreting GraphsInterpreting a scattergram or line graph involves examining the graph to determine whether any trend is present. The presence of a trend may suggest some kind of relationship between the two variables.
4.1.1 Interpreting scattergrams
When interpreting a scattergram examine the distribution of the plotted points and decide whether it indicates a relationship or correlation between the two variables. The diagrams in Figure 401 will help you interpret the three different types of plot distributions for scattergrams. Refer to Figure 402.
Maximum mass Mass of animal
Hei
gh
t
Met
abo
lic ra
te
Head circumference
Inte
llige
nce
Quo
tien
t
Figure 401 (a), (b) and (c) Plot distributions for scattergrams
fIGuRE 401(a) fIGuRE 401(b) fIGuRE 401(c)
Interpretation Interpretation InterpretationHeavier people tend to be taller and lighter people shorter.
Heavier animals tend to have higher metabolic rates and vice versa
People with large craniums do not necessarily have higher intelligence quotient scores and vice versa.
Conclusion Conclusion ConclusionHeight and weight are directly proportional.
Mass and metabolic rate are inversely proportional.
There is no relationship between intelligence quotient score and cranium size.
A positive correlation exists between the two variables.
A negative correlation exists between the two variables.
There is no correlation between the two variables.
Figure 402 Interpretation of scattergrams
There are also various statistical tests which can be used to determine the strength of correlation between two variables in a scattergram, for example, the use of Excel in determining the Pearson product-moment correlation coefficient (as found later in this Handbook.)
If a correlation does exist then it is possibly to mathematically determine a line of ‘best fit’ which can represent the relationship between the two variables.
Evidence for correlation between two variables does not prove that variable A caused the change in variable B, or vice versa. Strong correlation between two variables only suggests a connection between two variables, it does not confirm causation, that is, that one causes the change in the other.

SAMPLE PAGES
64
©ib
id.c
om
.au
20
14
Th
is p
ag
e m
ay
on
ly b
e le
ga
lly u
se
d u
nd
er
th
e c
on
dit
ion
s o
f sa
le
IAI
nt
er
na
ti
on
al
B
ac
ca
la
ur
ea
te
Bi
ol
og
y
In
te
rn
al
A
ss
es
sm
en
t
Ha
nd
bo
ok
Chapter 4 - Evaluation (Criterion 4)
4.1.2 Interpretation of line graphs
The initial interpretation of a line graph involves stating the trend in the slope of the graph. Figures 403, 404 and 405 shows some common trends in line graphs of various biological phenomena, though bear in mind that your points will have some ‘scatter’ due to random errors.
Tran
spira
tion
rate
Tran
spira
tion
rate
Windspeed Humidity
Figure 403 (a) and (b)
fIGuRE 403 (a) fIGuRE 403 (b)
Slope Slope
Constantly rising slope. Constantly decreasing slope.
Interpretation Interpretation
Variable A causes variable B to increase in a linear manner.
Variable A causes variable B to decrease in a linear manner.
A
B
A
B
Figure 404 (a) and (b)
fIGuRE 404 (a) fIGuRE 404 (b)
Slope Slope
A rising slope which becomes level. A rising slope which peaks and then decreases.
Interpretation Interpretation
Variable A causes variable B to increase initially, but then has no effect.
Variable A causes variable B to increase to a maximum then to decrease.
SAMPLE PAGES
65
©ib
id.c
om
.au
20
14
Th
is p
ag
e m
ay
on
ly b
e le
ga
lly u
se
d u
nd
er
th
e c
on
dit
ion
s o
f sa
le
IAI
nt
er
na
ti
on
al
B
ac
ca
la
ur
ea
te
Bi
ol
og
y
In
te
rn
al
A
ss
es
sm
en
t
Ha
nd
bo
ok
Chapter 4 - Evaluation (Criterion 4)
A
B
A
B
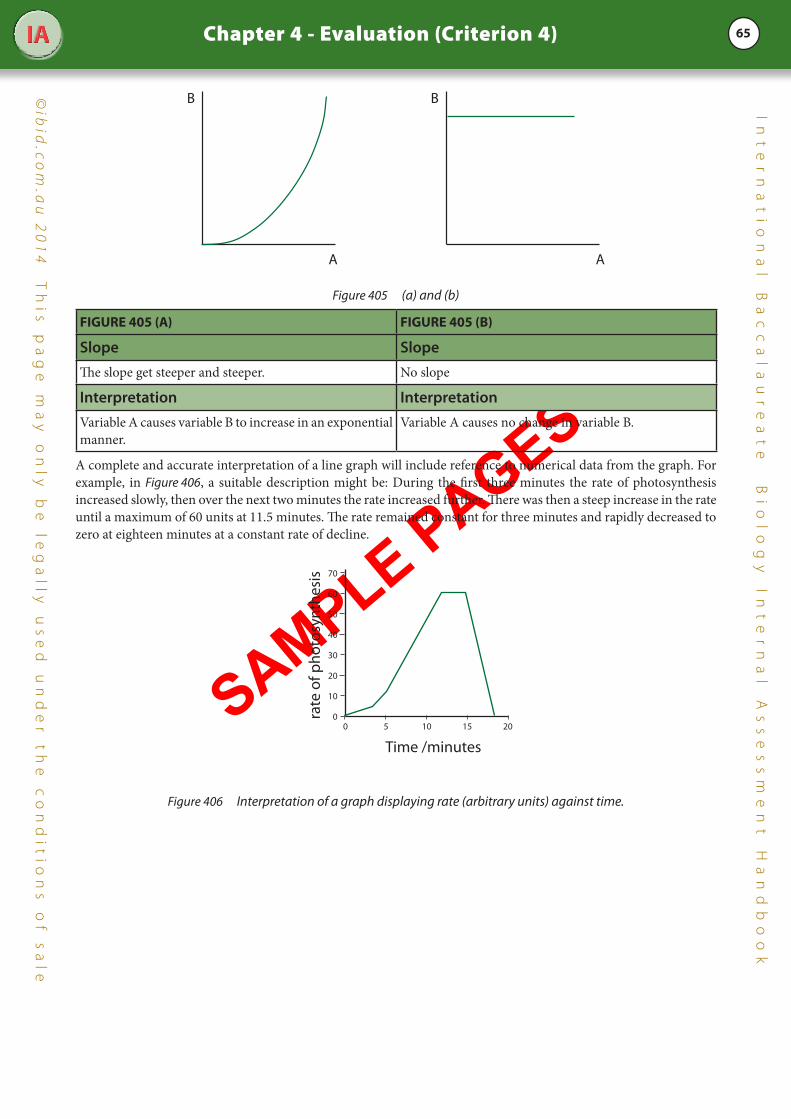
Figure 405 (a) and (b)
fIGuRE 405 (A) fIGuRE 405 (b)
Slope SlopeThe slope get steeper and steeper. No slope
Interpretation InterpretationVariable A causes variable B to increase in an exponential manner.
Variable A causes no change in variable B.
A complete and accurate interpretation of a line graph will include reference to numerical data from the graph. For example, in Figure 406, a suitable description might be: During the first three minutes the rate of photosynthesis increased slowly, then over the next two minutes the rate increased further. There was then a steep increase in the rate until a maximum of 60 units at 11.5 minutes. The rate remained constant for three minutes and rapidly decreased to zero at eighteen minutes at a constant rate of decline.
Time /minutes
rate
of p
hoto
synt
hesi
s
5 15
70
60
50
10
40
30
0
20
10
0 20
Figure 406 Interpretation of a graph displaying rate (arbitrary units) against time.

SAMPLE PAGES
66
©ib
id.c
om
.au
20
14
Th
is p
ag
e m
ay
on
ly b
e le
ga
lly u
se
d u
nd
er
th
e c
on
dit
ion
s o
f sa
le
IAI
nt
er
na
ti
on
al
B
ac
ca
la
ur
ea
te
Bi
ol
og
y
In
te
rn
al
A
ss
es
sm
en
t
Ha
nd
bo
ok
Chapter 4 - Evaluation (Criterion 4)
4.2 Using Graphs 4.2.1 Interpolation
Interpolation means determining a value which has not been plotted, but is within the range of your experimental data, by reading directly from the graph (a so-called graphical method) or by calculation. For example, consider the graph in Figure 407 of osmotic pressure against concentration of sucrose. The dotted construction line illustrates how a student can graphically determine the osmotic pressure generated by a 0.25 mol dm-3 sucrose solution. The value is approximately 680 pascals.
Osm
otic
pre
ssur
e /P
a
Concentration of sucrose /mol dm–3
1500
1250
1000
750
500
250
0 0.600.500.400.300.200.100
Figure 407 Osmotic pressure produced by sucrose solutions
4.2.2 Extrapolation
Extrapolation (see Figure 408) means the determining a value that it outside the range of your experimental data. It involves continuing the interpolated line or curve beyond the range of the plotted points (see Figure 408). This enables you to predict what might occur outside the range of measured values. The extrapolation should always be drawn as a dotted line so that that it contrasts with the continuous line or curve of the rest of the graph. (Although curved graphs may be extrapolated this can lead to large errors since the curved can be smoothly extended by a number of curves. This is one reason why curved graphs should be transformed into straight line graphs).
Figure 408 Extrapolation of straight line and curved graphs
On some occasions extrapolation may be justified, but often it can be misleading. For example, the rate of photosynthesis rises almost linearly with light intensity, but at high levels of light photo-saturation occurs and the graph (see Figure 409) becomes flat at very high levels of light intensity the graph will begin to slope downward as the chloroplasts in the palisade layer migrate downwards and damage to chlorophyll occurs. (Similar plots occur with plotting rates against a limiting factor).

SAMPLE PAGES
67
©ib
id.c
om
.au
20
14
Th
is p
ag
e m
ay
on
ly b
e le
ga
lly u
se
d u
nd
er
th
e c
on
dit
ion
s o
f sa
le
IAI
nt
er
na
ti
on
al
B
ac
ca
la
ur
ea
te
Bi
ol
og
y
In
te
rn
al
A
ss
es
sm
en
t
Ha
nd
bo
ok
Chapter 4 - Evaluation (Criterion 4)
light intensity
rate
of p
ho
tosy
nth
esis
Figure 409 A graph of the rate of photosynthesis (at constant temperature) against light intensity
It is also unwise to extrapolate curved graphs in Biology, especially with enzyme-controlled reactions, since there is a tendency for the reaction to slow down or decrease rapidly after a general increase due to denaturation of the enzyme.
4.2.3 Measuring the Gradient of a Graph
The gradient or slope of a straight line graph is a measure of the steepness with which the graph line is rising.
The gradient of a straight line graph =
�
y increasex increase
.
To calculate this ratio as accurately as possible the increases in x and y should be as large as possible. See Figure 410.
0
50
100
150
200
250
300
0 50 100 150 200 250
y
x
x increase
y in
crea
se
Figure 410 Measuring the gradient of a straight line graph
You may also have to determine the gradient or slope at a particular data point on a curved graph as shown below in Figure 411. This type of calculation is likely to be performed during an investigation into an enzyme-controlled reaction.
0
50
100
150
200
250
300
0 50 100 150 200 250
y
x
x increase
y in
crea
se
Figure 411 Measuring the gradient of a curved line graph

SAMPLE PAGES
68
©ib
id.c
om
.au
20
14
Th
is p
ag
e m
ay
on
ly b
e le
ga
lly u
se
d u
nd
er
th
e c
on
dit
ion
s o
f sa
le
IAI
nt
er
na
ti
on
al
B
ac
ca
la
ur
ea
te
Bi
ol
og
y
In
te
rn
al
A
ss
es
sm
en
t
Ha
nd
bo
ok
Chapter 4 - Evaluation (Criterion 4)
4.2.4 Displaying Errors on Graphs (Extension Material)
When carrying out experimental investigation it is impossible for you to record measurements with 100% accuracy. There will be an error or uncertainty in all your measurements which can be easily determined. For example your measurements of some seedlings obtained with a ruler might be to the nearest millimetre, so all your measurements should be reported as ± 0.05 mm.
This error or uncertainty can be indicated on a line graph (see Figure 412) by means of an error bar drawn above and below the data points on the graph. Often the data plotted are means so the standard deviation can be plotted as an error bar.
Although error bars are not a requirement of the Group 4 Assessment Criteria for Biology they do indicate to your teacher and the moderator that you are aware of the limitations of your apparatus or sampling method. Standard deviations can be readily calculated by Excel and error bars are easily added to an Excel-generated line graph.
0
7
8
9
10
8 10 12 14
Rate
of p
hoto
synt
hesi
s
Temperature /˚C
16 18 20 22
Figure 412 A line graph with associated error bars and their interpretation
SAMPLE PAGES
69
©ib
id.c
om
.au
20
14
Th
is p
ag
e m
ay
on
ly b
e le
ga
lly u
se
d u
nd
er
th
e c
on
dit
ion
s o
f sa
le
IAI
nt
er
na
ti
on
al
B
ac
ca
la
ur
ea
te
Bi
ol
og
y
In
te
rn
al
A
ss
es
sm
en
t
Ha
nd
bo
ok
Chapter 4 - Evaluation (Criterion 4)
4.3 Evaluating procedures
4.3.1 Evaluation
If, however, a conclusion was difficult or impossible to draw, then the hypothesis may not have been formulated correctly. It may then be necessary to reject the original hypothesis and formulate another.
Another possibility is that while the hypothesis is accepted, the data acquired during the investigation is rather limited. You may also have found that your techniques or materials were unsuitable or inaccurate and did not allow you to test your hypothesis.
A final possibility is that the results are too complex or numerous to analyse properly. In this case a family of statistical methods called ANOVA (analysis of variance) might be appropriate, but a detailed knowledge of such techniques is outside the scope of the current IB Biology Programme.
This section will also include identifying weaknesses inherent in the experimental techniques, or experimental design (for example, identification of uncontrolled variables) as well as suggestions for improving the method.
If your method involved sampling then the following approaches will increase the precision of the measurements:
• Increase the size of the experiments by adding more replicates or trials;
• Refine and improve the experimental technique, for example, by using measuring instruments of a higher precision;
• Handle the experimental material so that the effects of variation are reduced.
Other issues that should be raised, where appropriate, are suggestions for further practical work in that area. This should either extend the practical work or help to clarify areas of doubt in your results.
4.3.2 Evaluation of error
PrecisionPrecision indicates how close together the various experimental measurements on a sample are. It is the spread or variation in a set of measurements for several trials or samples of the same experiment. It may be assessed by calculating the mean, range or standard deviation and compared with the maximum experimental error calculated. Random errors affect precision, but it may be improved if a sufficient number of repetitive measurements is performed.
AccuracyAccuracy indicates how close the experimental value is to the true or accepted value, if this is known. Systematic errors affect accuracy, but if the sample size is constant, they have no effect on precision. The concepts of accuracy and precision are illustrated below with darts thrown at a dart board (see Figure 413).

SAMPLE PAGES
70
©ib
id.c
om
.au
20
14
Th
is p
ag
e m
ay
on
ly b
e le
ga
lly u
se
d u
nd
er
th
e c
on
dit
ion
s o
f sa
le
IAI
nt
er
na
ti
on
al
B
ac
ca
la
ur
ea
te
Bi
ol
og
y
In
te
rn
al
A
ss
es
sm
en
t
Ha
nd
bo
ok
Chapter 4 - Evaluation (Criterion 4)
Figure 413 (a), (b), (c) and (d) Concepts of accuracy and precision
• (a) imprecise, and inaccurate
• (b) imprecise and accurate
• (c) accurate and precise
• (d) precise and inaccurate
An illustration of errors and concept of an experimental controlShown below in Figure 414 is a simple respirometer, which is used to measure the volume of oxygen taken up by a small organism, for example, an insect, during a given length of time. The oil droplet moves from right to left along the scale as the animal consumes oxygen.
Rubber bung
Specimen tube
Capillary tube
Figure 414 Simple respirometer
Random experimental errors inherent in the apparatus may arise from the following:• Small temperature fluctuations may occur in the surrounding air during the experiment which will alter the
pressure inside the respirometer and hence move the oil droplet.
• The pressure of a gas is directly proportional to its (absolute) temperature at constant volume. In addition, small variations in the values of measurements due to parallax error when reading from the capillary tube scale may occur.
Systematic errors inherent in the apparatus may arise from the following:• The capillary tube may not be slightly titled away from the horizontal position and gravity may cause the droplet
to move very slowly.
• The soda lime (a dry mixture of calcium and sodium hydroxides) may be exhausted and be unable to absorb any more carbon dioxide gas.
• The apparatus may not be air tight and gases may be leaving and entering via a small hole.
ControlThe control would consist of an identical respirometer set up under identical experimental conditions of air temperature and pressure, except the animal should be excluded. Ideally, the experiment involving the control should be performed at the same time. If there is no movement of the oil droplet in the control apparatus the results of the experimental apparatus require no alteration.
If, however, changes in atmospheric pressure cause the droplet in the control tube to move, the distance should be recorded. If repetition of the experiment yields the same distance then a systematic error is inherent in the experiment.
This distance should be added to the distance measured in the experimental tube, if the droplet moves away from the specimen tube in the control, or subtracted if it moves towards the specimen tube. This is an example of compensating for a systematic error.
SAMPLE PAGES
71
©ib
id.c
om
.au
20
14
Th
is p
ag
e m
ay
on
ly b
e le
ga
lly u
se
d u
nd
er
th
e c
on
dit
ion
s o
f sa
le
IAI
nt
er
na
ti
on
al
B
ac
ca
la
ur
ea
te
Bi
ol
og
y
In
te
rn
al
A
ss
es
sm
en
t
Ha
nd
bo
ok
Chapter 4 - Evaluation (Criterion 4)
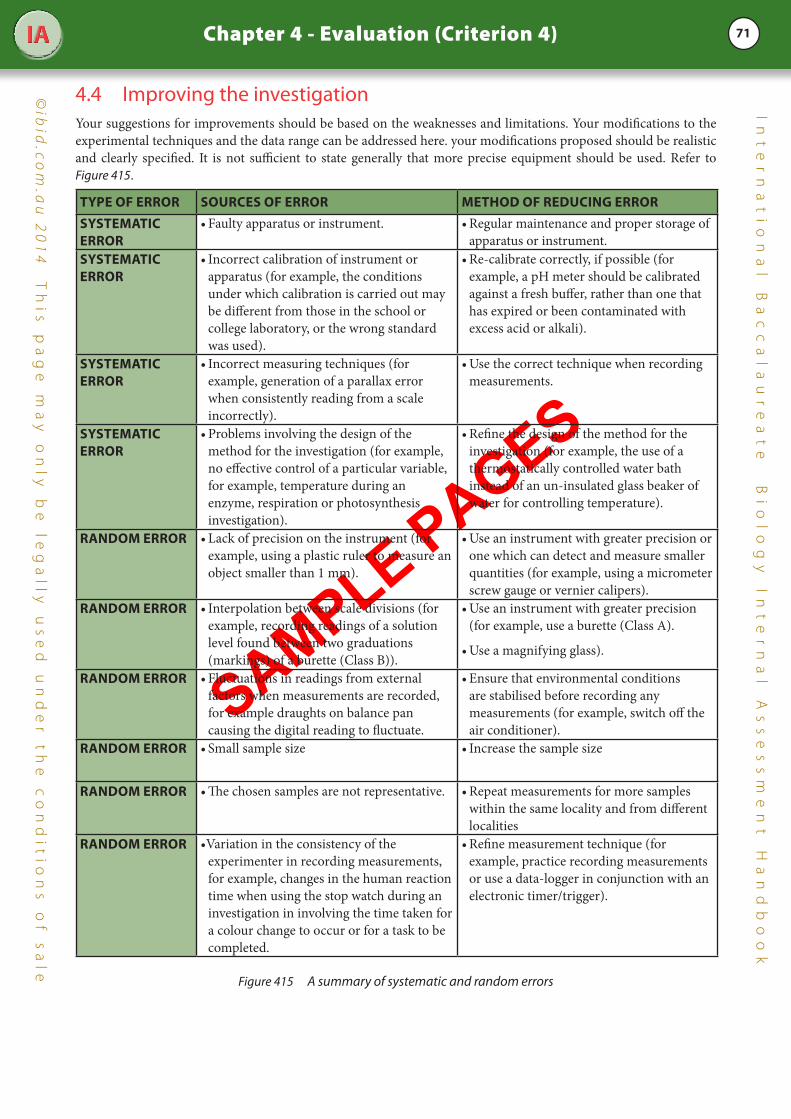
4.4 Improving the investigationYour suggestions for improvements should be based on the weaknesses and limitations. Your modifications to the experimental techniques and the data range can be addressed here. your modifications proposed should be realistic and clearly specified. It is not sufficient to state generally that more precise equipment should be used. Refer to Figure 415.
TYPE Of ERROR SOuRCES Of ERROR METhOD Of REDuCInG ERRORSYSTEMATIC ERROR
•Faultyapparatusorinstrument. •Regularmaintenanceandproperstorageofapparatus or instrument.
SYSTEMATIC ERROR
•Incorrectcalibrationofinstrumentorapparatus (for example, the conditions under which calibration is carried out may be different from those in the school or college laboratory, or the wrong standard was used).
•Re-calibratecorrectly,ifpossible(forexample, a pH meter should be calibrated against a fresh buffer, rather than one that has expired or been contaminated with excess acid or alkali).
SYSTEMATIC ERROR
•Incorrectmeasuringtechniques(forexample, generation of a parallax error when consistently reading from a scale incorrectly).
•Usethecorrecttechniquewhenrecordingmeasurements.
SYSTEMATIC ERROR
•Problemsinvolvingthedesignofthemethod for the investigation (for example, no effective control of a particular variable, for example, temperature during an enzyme, respiration or photosynthesis investigation).
•Refinethedesignofthemethodfortheinvestigation (for example, the use of a thermostatically controlled water bath instead of an un-insulated glass beaker of water for controlling temperature).
RAnDOM ERROR •Lackofprecisionontheinstrument(forexample, using a plastic ruler to measure an object smaller than 1 mm).
•Useaninstrumentwithgreaterprecisionorone which can detect and measure smaller quantities (for example, using a micrometer screw gauge or vernier calipers).
RAnDOM ERROR •Interpolationbetweenscaledivisions(forexample, recording readings of a solution level found between two graduations (markings) of a burette (Class B)).
•Useaninstrumentwithgreaterprecision(for example, use a burette (Class A).
•Useamagnifyingglass).
RAnDOM ERROR •Fluctuationsinreadingsfromexternalfactors when measurements are recorded, for example draughts on balance pan causing the digital reading to fluctuate.
•Ensurethatenvironmentalconditionsare stabilised before recording any measurements (for example, switch off the air conditioner).
RAnDOM ERROR •Smallsamplesize •Increasethesamplesize
RAnDOM ERROR •Thechosensamplesarenotrepresentative. •Repeatmeasurementsformoresampleswithin the same locality and from different localities
RAnDOM ERROR •Variationintheconsistencyoftheexperimenter in recording measurements, for example, changes in the human reaction time when using the stop watch during an investigation in involving the time taken for a colour change to occur or for a task to be completed.
•Refinemeasurementtechnique(forexample, practice recording measurements or use a data-logger in conjunction with an electronic timer/trigger).
Figure 415 A summary of systematic and random errors

SAMPLE PAGES
72
©ib
id.c
om
.au
20
14
Th
is p
ag
e m
ay
on
ly b
e le
ga
lly u
se
d u
nd
er
th
e c
on
dit
ion
s o
f sa
le
IAI
nt
er
na
ti
on
al
B
ac
ca
la
ur
ea
te
Bi
ol
og
y
In
te
rn
al
A
ss
es
sm
en
t
Ha
nd
bo
ok
Chapter 4 - Evaluation (Criterion 4)
4.5 Limitations of measurements and proceduresAs mentioned previously, many sources of errors arise from the limitations of measurements and experimental procedures. Below is a summary of the various limitations that may be present in an experimental investigation. These should be addressed under the heading ‘Conclusion and Evaluation’ in the report or ‘write-up’ for your Individual Investigation.
Limitations of measurements:
• The lack of precision of the instruments used.
• Miscalibration of instruments or apparatus.
• Inconsistency in the recording of measurements.
• Fluctuations in the readings.
• Limitations of experimental procedures:
• Insufficient or small number of repeats or replicates of measurements.
• The experimental sample (if appropriate to the investigation) was too small.
• The range of the independent variable for a specific investigation was too narrow or too wide.
• The intervals between the independent variable were too large.
• There was a failure to control all the controlled variables.

SAMPLE PAGES
73
©ib
id.c
om
.au
20
14
Th
is p
ag
e m
ay
on
ly b
e le
ga
lly u
se
d u
nd
er
th
e c
on
dit
ion
s o
f sa
le
IAI
nt
er
na
ti
on
al
B
ac
ca
la
ur
ea
te
Bi
ol
og
y
In
te
rn
al
A
ss
es
sm
en
t
Ha
nd
bo
ok
Chapter 4 - Evaluation (Criterion 4)
Listed in Figure 416 is a summary of what you need to do to score well in the Evaluation criterion.
Assessment criteria
Evidence required What you must do
Concluding States a conclusion, that is described, justified and supported by the data.
Analyse and explain the data from the experiment and draws a valid conclusion which is relevant to the research question and its scientific context (background information that may include a hypothesis, competing hypotheses and a scientific model).The conclusion must be supported by the raw and processed data, (though it may be tentative and subject to some statistical uncertainty).If a graph is present, the correct graphical relationship is stated and numbers quoted to support the relationship. The graph may be used to obtain a gradient or intercept or be used for extrapolation or interpolation.If appropriate, uses the graph to identify any anomalous data points.Where appropriate, compares the experimental result with the accepted result: calculates absolute and percentage errors from the expected or literature value.Compares results obtained by repetition, or against the chemical literature, and comments on the reliability of the values obtained.Some simple statistics may be included if large numbers of repeated random measurements are recorded.
Evaluating methodology and data
Evaluates strengths and weaknesses, such as limitations of data and sources of error
Outline any limitations to the accuracy/reliability/amount/range of data that you have obtained.States simplifying assumptions that were made which may affect the accuracy of the results.Discusses any limitations of the methodology used.Identifies and quantifies limitations due to the precision and accuracy of the equipment. Performs error propagation with random errors.Identifies possible systematic errors or other unanticipated factors.Strengths may involve control of variables, reduction of random errors and identification of systematic errors.Weaknesses may involve inability to control or monitor important controlled variables, biological variation, large random errors or large percentage errors in small measurements.
Improving and extending the investigation
Suggests realistic improvements in respect of identified weaknesses and limitations.
Suggests modifications to improve the existing investigation to reduce random errors and to identify possible sources of systematic error.
Suggests alternative methodology to improve the investigation, perhaps by better control of controlled variables and more precise measurements of the dependent variable.
Suggests alternative equipment or apparatus (with higher sensitivity) if applicable.
Suggests how to extend the experiment, for example, collecting additional and more precise data outside the current data range
Figure 416 Summary of the Evaluation criterion.