page arizona and oregon departments of … odot select the design alternative with the quickest...
TRANSCRIPT
SHRP2 R09 Case Studies
Table of Contents
R09 Case Studies
page
2
page
6
page
12
Arizona and Oregon Departments of Transportation:Benefits of a Customizable Risk Management Process Case Study
Pennsylvania Department of Transportation: Historic Bridge Replacement Project Case Study
Oregon Department of Transportation: Managing Risk in Rapid Renewal Projects Facilitator Training Case Study
Puerto Rico Highway and Transportation Authority: Bridge Replacement Project Case Study
page
18
PB
Managing Risk in Rapid Renewal Projects
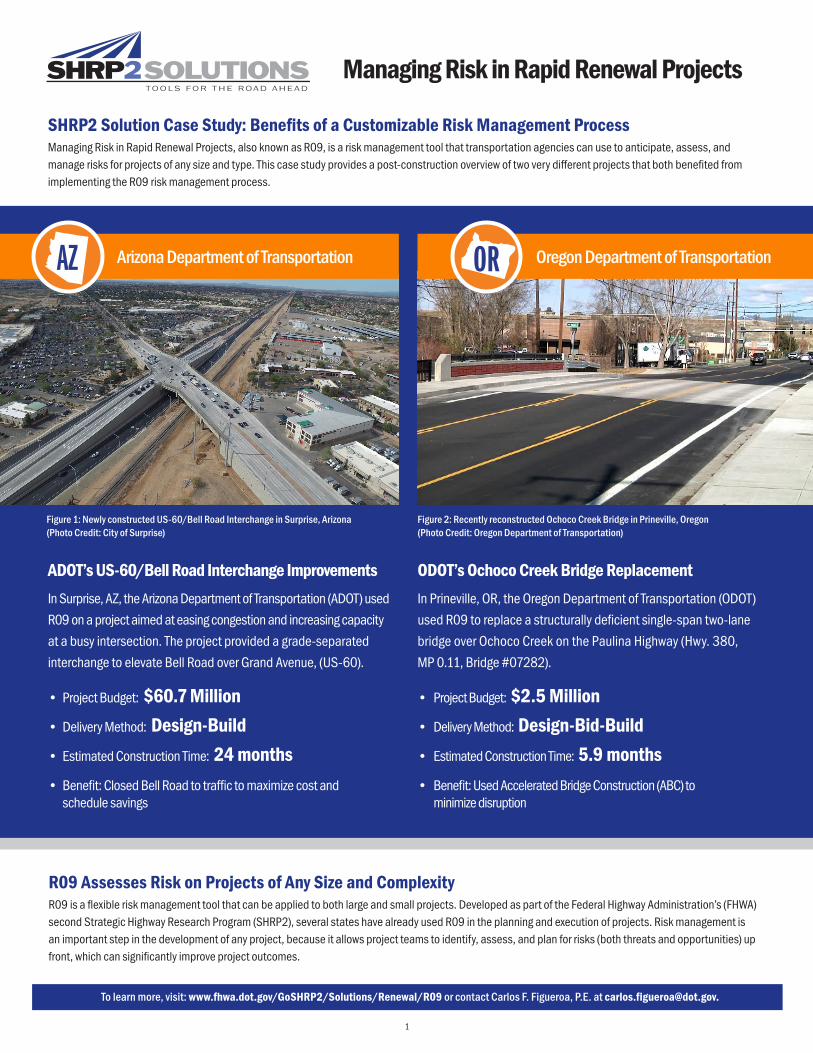
SHRP2 Solution Case Study: Benefits of a Customizable Risk Management Process Managing Risk in Rapid Renewal Projects, also known as R09, is a risk management tool that transportation agencies can use to anticipate, assess, and manage risks for projects of any size and type. This case study provides a post-construction overview of two very different projects that both benefited from implementing the R09 risk management process.
Arizona Department of TransportationAZ
Figure 1: Newly constructed US-60/Bell Road Interchange in Surprise, Arizona (Photo Credit: City of Surprise)
ADOT’s US-60/Bell Road Interchange ImprovementsIn Surprise, AZ, the Arizona Department of Transportation (ADOT) used R09 on a project aimed at easing congestion and increasing capacity at a busy intersection. The project provided a grade-separated interchange to elevate Bell Road over Grand Avenue, (US-60).
• Project Budget: $60.7 Million• Delivery Method: Design-Build• Estimated Construction Time: 24 months• Benefit: Closed Bell Road to traffic to maximize cost and
schedule savings
Oregon Department of TransportationOR
Figure 2: Recently reconstructed Ochoco Creek Bridge in Prineville, Oregon (Photo Credit: Oregon Department of Transportation)
ODOT’s Ochoco Creek Bridge Replacement In Prineville, OR, the Oregon Department of Transportation (ODOT) used R09 to replace a structurally deficient single-span two-lane bridge over Ochoco Creek on the Paulina Highway (Hwy. 380, MP 0.11, Bridge #07282).
• Project Budget: $2.5 Million• Delivery Method: Design-Bid-Build• Estimated Construction Time: 5.9 months• Benefit: Used Accelerated Bridge Construction (ABC) to
minimize disruption
R09 Assesses Risk on Projects of Any Size and ComplexityR09 is a flexible risk management tool that can be applied to both large and small projects. Developed as part of the Federal Highway Administration’s (FHWA) second Strategic Highway Research Program (SHRP2), several states have already used R09 in the planning and execution of projects. Risk management is an important step in the development of any project, because it allows project teams to identify, assess, and plan for risks (both threats and opportunities) up front, which can significantly improve project outcomes.
To learn more, visit: www.fhwa.dot.gov/GoSHRP2/Solutions/Renewal/R09 or contact Carlos F. Figueroa, P.E. at [email protected].
1
2
– Madhu Reddy, ADOT ”
Visit the R09 GoSHRP2 website to learn more
about the R09 process, read case studies, and
view a video on how other states are benefiting
from R09.
Figure 3: R09 GoSHRP2 website, www.fhwa.dot.gov/GoSHRP2/Solutions/Renewal/R09
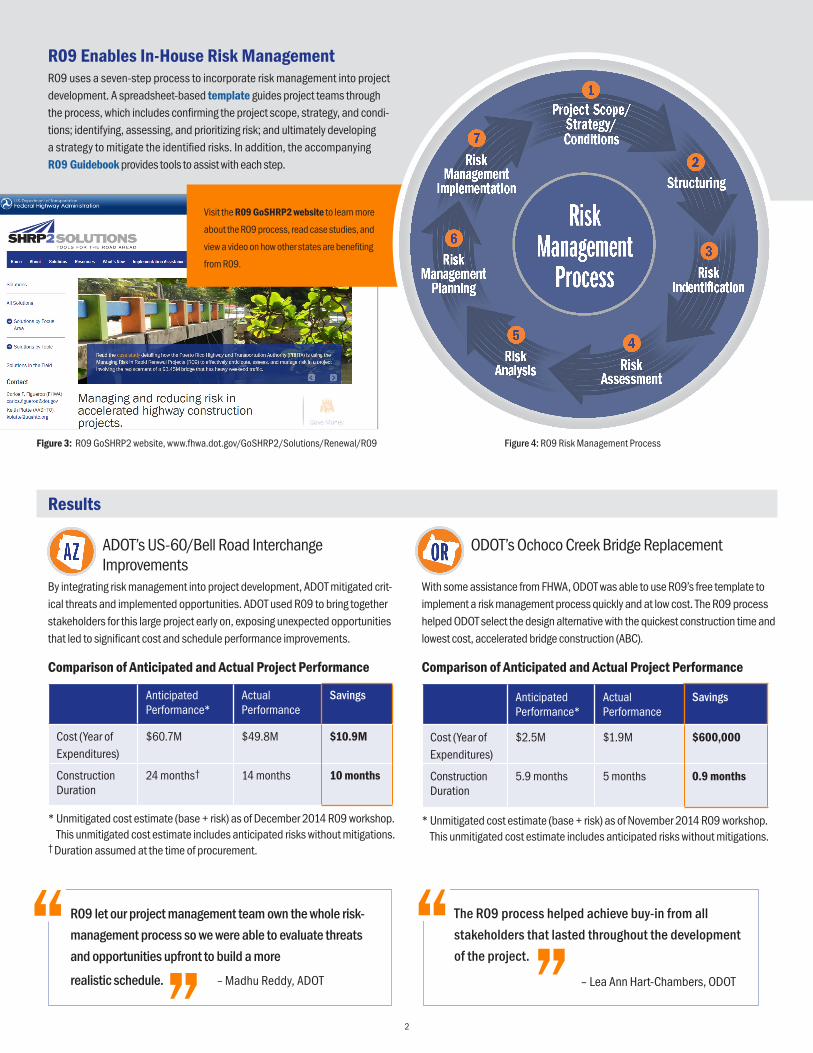
R09 Enables In-House Risk ManagementR09 uses a seven-step process to incorporate risk management into project development. A spreadsheet-based template guides project teams through the process, which includes confirming the project scope, strategy, and condi-tions; identifying, assessing, and prioritizing risk; and ultimately developing a strategy to mitigate the identified risks. In addition, the accompanying R09 Guidebook provides tools to assist with each step.
Figure 4: R09 Risk Management Process
“ ”
Results
ADOT’s US-60/Bell Road Interchange Improvements
By integrating risk management into project development, ADOT mitigated crit-ical threats and implemented opportunities. ADOT used R09 to bring together stakeholders for this large project early on, exposing unexpected opportunities that led to significant cost and schedule performance improvements.
Comparison of Anticipated and Actual Project Performance
Anticipated Performance*
Actual Performance
Savings
Cost (Year of Expenditures)
$60.7M $49.8M $10.9M
Construction Duration
24 months† 14 months 10 months
* Unmitigated cost estimate (base + risk) as of December 2014 R09 workshop. This unmitigated cost estimate includes anticipated risks without mitigations.
† Duration assumed at the time of procurement.
ODOT’s Ochoco Creek Bridge Replacement
With some assistance from FHWA, ODOT was able to use R09’s free template to implement a risk management process quickly and at low cost. The R09 process helped ODOT select the design alternative with the quickest construction time and lowest cost, accelerated bridge construction (ABC).
Comparison of Anticipated and Actual Project Performance
Anticipated Performance*
Actual Performance
Savings
Cost (Year of Expenditures)
$2.5M $1.9M $600,000
Construction Duration
5.9 months 5 months 0.9 months
* Unmitigated cost estimate (base + risk) as of November 2014 R09 workshop. This unmitigated cost estimate includes anticipated risks without mitigations.
R09 let our project management team own the whole risk- management process so we were able to evaluate threats and opportunities upfront to build a more
realistic schedule.
The R09 process helped achieve buy-in from all stakeholders that lasted throughout the development of the project.
– Lea Ann Hart-Chambers, ODOT
“

32
Benefits of R09
ADOT
ADOT used the R09 process to identify and seize opportunities, like closing Bell Road during construction, which led to $10.9 million in savings and a 10 month schedule reduction.
• Opportunity: Proposal to close Bell Road for 6 months to expedite construction
• Opportunity: Modify 134th Drive/Avenue to avoid Right of Way (ROW) impacts to local businesses
• Threat: ROW and utility relocation impacts to local businesses – Response: Modified alignment of Town Center Drive to minimize ROW
impacts to local businesses.• Risk: Past Mechanically Stabilized Earth (MSE) wall performance issues
in other ADOT projects. – Response: ADOT tightened specifications for MSE walls
ODOT
ODOT aimed to minimize cost, schedule, and traffic disruption through con-struction. The R09 process allowed ODOT to implement risk management techniques at low cost, and identify and evaluate two design alternatives:
• Accelerated Bridge Construction (ABC)• Short Detour
The ODOT project team compared the short detour option to the ABC alternative. Ultimately the ABC alternative was chosen because it had the lowest cost and shortest schedule when mitigations were considered.
R09 Improves the Project Development ProcessR09 brings stakeholders together during project development to discuss the planned approach, alternatives, funding, technical conditions affecting the project, performance (cost and schedule) estimates, and other factors — fostering organizational improvements that can last beyond the project duration.
ADOT
Effectively assemble the entire project team (both iand external)
nternal
• Since this was a relatively large project with many stakeholders and potentially major impacts to the public, it was important for the entire team to come together to discuss all potential project risks and potential risk response strategies to positively influence project outcomes. The risk management process allowed the team to better understand each other’s interests and challenges, and helped them work together toward project success.
• T he fact that the entire project team from ADOT was involved in decisions from the onset of the project gave the team a sense of ownership. It also sparked ideas, and allowed ADOT to identify opportunities that led to substantial cost and schedule savings.
• ADOT identified the City of Surprise as an important stakeholder, and was able to work with them and local businesses to reroute utilities and con-dense the construction schedule, mitigating impact to local businesses.
Familiarize Project Details• The risk management process helped familiarize the team with potential
risks, and allowed them to better anticipate and address these risks. • A greater understanding of the project details and challenges allowed the
team to better communicate the rationale for decisions to stakeholders, local businesses, and the public.
• As a better collective understanding of the project was achieved, more opportunities were identified and better mitigation strategies were developed.
Formal Decision-Making Process• As a result of the risk management process, the project team gained an
unbiased and quantitative basis for making a strategic decision to close Bell Road during construction. Although the team was originally opposed to this idea because of the potential impact to the traveling public, this opportunity could not be ignored once the anticipated cost and schedule savings were evaluated.
ODOT
Effectively assemble the entire project team (both internal and external)
• Disruption of emergency services was a concern due to nearby schools and a newly built hospital and fire services. Because of this, local leaders and stakeholders were encouraged to and did ultimately participate in the process.
• Stakeholder involvement created a sustainable and direct means of communication and coordination as well as a better collective under-standing of ODOT project decisions.
• Involving key knowledge sources helped the team arrive at well-informed answers to potential risk questions right away.
Familiarize Project Details• Through familiarizing themselves with the risks, costs, and construc-
tion schedules of the design alternatives, ODOT was able to select the ABC method as the most appropriate for the project.
• The risk management process and the resulting prioritized list of risks (threats and opportunities) drew the project team’s attention to the most significant issues that could affect project performance.
Formal Decision-Making Process• Since the first step of the R09 process encourages teams to come
together for a thorough discussion of the project scope, strategy, and conditions, ODOT was able to discuss project alternatives as a full team. Decisions were formally documented, and the project team did not have to revisit their decisions throughout project development.
• The R09 process allowed ODOT to make a decision about which design alternative would be most likely to have the lowest cost and shortest schedule while also considering impacts to traffic disruption. Because the R09 risk management process is structured and formal, it was an ideal approach for a relatively small project.
R09 Adapts to Fit Different Project ConsiderationsR09’s flexible risk management process adapts to fit both large and small projects. Although ADOT and ODOT used R09 on projects with differences in scope and budget, they both experienced positive benefits.
Project Consideration ADOT – Differences ODOT – Differences
Project Size and Type • Larger budget and schedule• New interchange project
• Smaller budget and schedule• Bridge replacement project
Project Complexities • Highly publicized and politically significant project • Major impacts to the traveling public• Multiple ROW and utility relocation impacts
• Project considerations included maintaining access to the nearby hospital, avoiding disruption of utilities, protecting endangered fish, and avoiding impacts to a nearby historic railroad
Public and Stakeholder Concerns • Worked closely with the City of Surprise and local business owners to maintain access to businessesduring construction
• Leveraged ABC technology to minimize traffic disruption
Risk Management Outcome • Identified and seized opportunities (such as the closing of Bell Road) to expedite construction and save money
• Selected the most cost-efficient option out of two possibilities
Similarities
R09 risk management process saved time and money for both projects Both DOTs avoided or mitigated potential risks by planning ahead, which resulted in cost and schedule savings
Although the projects varied in size, they both had unique complexities and risks
Both DOTs gathered the project teams upfront, which created open channels of communication and a formal decision-making process.
Planning ahead helped both DOTs address concerns from stakeholders and the public
The free, online template guided both teams through a structured and relatively easy risk management process.
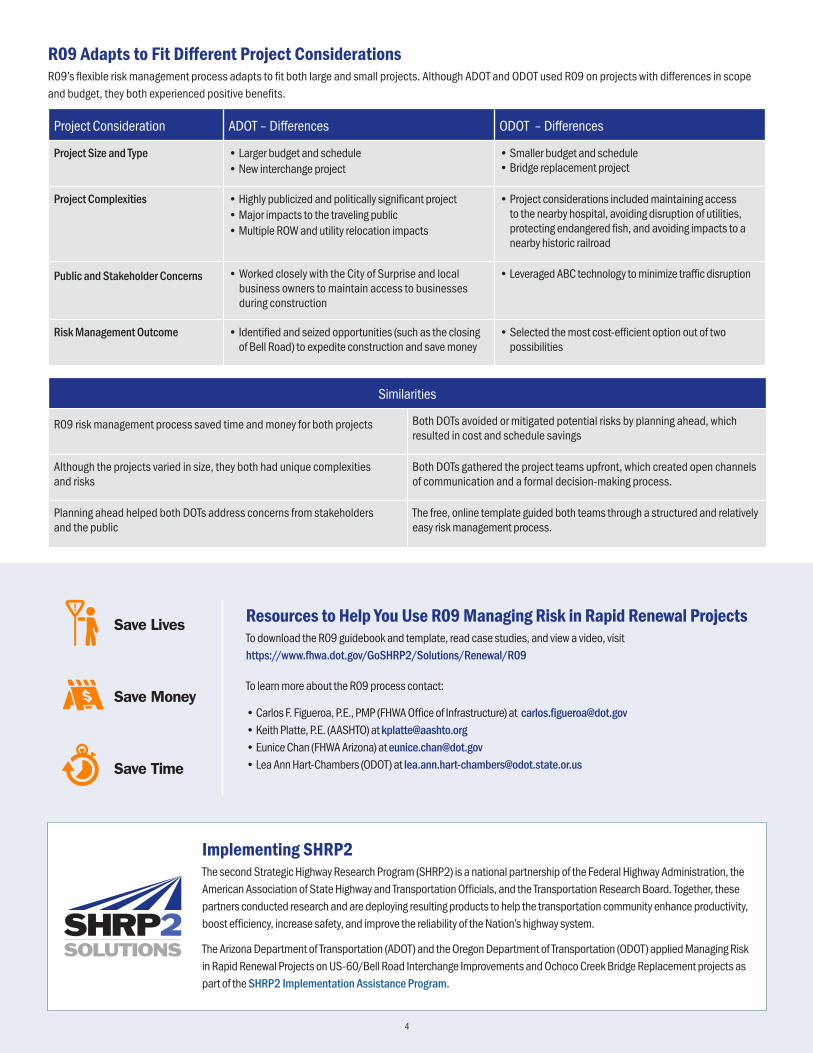
Save Lives
Save Money
Save Time
Resources to Help You Use R09 Managing Risk in Rapid Renewal ProjectsTo download the R09 guidebook and template, read case studies, and view a video, visit https://www.fhwa.dot.gov/GoSHRP2/Solutions/Renewal/R09
To learn more about the R09 process contact:
• Carlos F. Figueroa, P.E., PMP (FHWA Office of Infrastructure) at [email protected]• Keith Platte, P.E. (AASHTO) at [email protected]• Eunice Chan (FHWA Arizona) at [email protected]• Lea Ann Hart-Chambers (ODOT) at [email protected]
4
Implementing SHRP2The second Strategic Highway Research Program (SHRP2) is a national partnership of the Federal Highway Administration, the American Association of State Highway and Transportation Officials, and the Transportation Research Board. Together, these partners conducted research and are deploying resulting products to help the transportation community enhance productivity, boost efficiency, increase safety, and improve the reliability of the Nation’s highway system.
The Arizona Department of Transportation (ADOT) and the Oregon Department of Transportation (ODOT) applied Managing Risk in Rapid Renewal Projects on US-60/Bell Road Interchange Improvements and Ochoco Creek Bridge Replacement projects as part of the SHRP2 Implementation Assistance Program.

1PB
Managing Risk in Rapid Renewal Projects Case Study: Pennsylvania DOT’s $20M Historic Bridge Replacement
Figure 1: The Pennsylvania Department of Transportation (PennDOT) is evaluating several alternatives for replacing the historic Cementon Bridge to understand the impact of risks and related mitigation actions.
Using SHRP2’s Risk Management Approach to Assess Risk on Projects of All ComplexitiesDue in part to its proximity to historic properties, replacing the Cementon Bridge is a complex project with a high risk of cost overruns and schedule delays. To identify and proactively mitigate these risks, the Pennsylvania Department of Transportation (PennDOT) conducted a comprehensive in-house risk assessment using a product developed through the Federal Highway Administration’s (FHWA’s) Second Strategic Highway Research Program (SHRP2).
The Challenge: Calculating and Managing the Impact of Risks PennDOT anticipates that construction of the new Cementon Bridge will begin in 2019, and design and construction combined will cost approxi-mately $20–23 million (base cost estimate). The current bridge is structur-ally deficient, functionally obsolete, and unable to safely and effectively accommodate current and future traffic needs. This project is not only critical to Pennsylvania’s transportation infrastructure, but is also unusually complex, with many constraints that could threaten its on-time, on-budget completion (see Project Snapshot on page 2).
Although this project is large enough to justify a full probabilistic risk assess-ment, PennDOT chose an in-house risk management process that was both comprehensive and easy to apply so that once staff learned the process, they could use it on future projects of various sizes and types.
SHRP2 Solution: A Highly Flexible Risk Management Process and TemplateManaging Risk in Rapid Renewal Projects was the ninth research project in the SHRP2 Renewal Focus Area and is also known as Renewal 09 (R09). The product uses an Excel-based template to guide teams through a risk management process to identify, evaluate, and mitigate risks (threats and opportunities). DOTs can adjust the template settings to fit their project’s unique characteristics by defining the project’s delivery method, base cost, and base schedule. The accompanying R09 Guidebook pro-vides additional tools to assist with each step. During a two and half day workshop hosted by FHWA, PennDOT’s team of project managers, in-house subject matter experts, and consultants applied the product’s iterative process and R09 Excel-based template to the Cementon Bridge project to:
• Holistically identify potential risks• Determine the likelihood of risk occurrence• Calculate the associated schedule, cost, and disruption impacts• Devise strategies to monitor and mitigate risks from planning to construction• Assess the overall impact of mitigated and unmitigated risks on schedule,
cost, and disruption• Implement a risk management plan as part of their overall project
delivery process
PennDOT applied the process to two alternatives they were considering, and will use the results to inform their final choice. The two alternatives, On-Line Accelerated Bridge Construction (ABC) and Downstream Alignment, are described at the top of page 3.
Figure 2: The Cementon Bridge project team discusses potential threats and opportunities while applying the R09 risk management process.
To learn more, visit: www.fhwa.dot.gov/GoSHRP2/Solutions/Renewal/R09 or contact Carlos F. Figueroa, P.E. at [email protected].

2
Project Snapshot: Cementon Bridge Replacement• Four-span, 575-foot long bridge constructed in 1933 • Carries SR 0329 over the Lehigh River and serves as the primary link
between Cementon and Northampton Borough • Connects the Laurys Station and Northampton segments of the
Delaware and Lehigh Trail• Eligible for listing in the National Register of Historic Places (NRHP),
and abuts several other NRHP properties including the Northampton Historic District, Lehigh Valley Railroad, Whitehall Cement Manufacturing Company, Colonel John Siegfried Tavern, and Siegfried Train Station
• Highly constrained location that abuts the Norfolk Southern Railroad and the Siegfried Cemetery
• Structure carries multiple utilities, including fiber optic data lines, a water main, and aerial high voltage power lines
• Determined to be structurally deficient and functionally obsolete • Unable to safely accommodate current and future traffic needs due
to its deteriorated structural condition, posted weight limit, and geometric constraints
Figure 3: The historic Siegfried Cemetery abuts the Cementon Bridge Project. One risk of the Downstream replacement alternative would be the impact of the project alignment on potential unmarked grave sites.
R09 Risk Management Process The 7-step R09 risk management process, described below and in Figure 4, helped PennDOT identify the most severe risks (threats and opportunities) and most beneficial mitigations to reduce overall costs and time. Because the process is so efficient, PennDOT completed the full risk assessment on each of the two alternatives described on page 3 to help determine the best approach.
1 Project Scope/Strategy/ConditionsPennDOT kicked off the risk management process by familiarizing the team with the project scope, strategy, and conditions. The project manager discussed the two bridge replacement alternatives, funding, technical conditions affecting the project, political and external conditions, and performance (cost and schedule) estimates.
2 StructuringNext, the team defined the base project scenario for duration/schedule and cost, without accounting for float, contingency, or inflation. The base performance data is entered into the R09 template and used as a comparison against the project unmitigated and mitigated performance, which includes the threats and opportunities that are identified, assessed, and managed. Table 1 includes the base project performance results for each alternative.
Table 1: Base Project Summary
Alternative A: On-Line Accelerated Bridge Construction (ABC)
Alternative B: Downstream Alignment
Base Cost in Year of Expenditures (YOE) $22.54 M $20.41 M
Construction Notice to Proceed 6/30/2019 12/29/2019
Construction Completion Date 3/29/2022 9/12/2022
Figure 4: R09 Risk Management Process

32
3 Risk Identification The project team then identified the threats and opportunities that could affect the project’s base performance. Threats can degrade project performance, while opportunities can enhance project performance. PennDOT identified 44 threats and 3 opportunities for Alternative A, and 34 threats and 7 opportunities for Alternative B. Threats and opportunities were documented in the risk register developed in the R09 template and categorized by when they are most likely to occur (e.g., construction, preliminary design/environmental process, procurement, etc.). This step captures a comprehensive, non-overlapping list of threats and opportunities, rather than screening out issues prematurely.
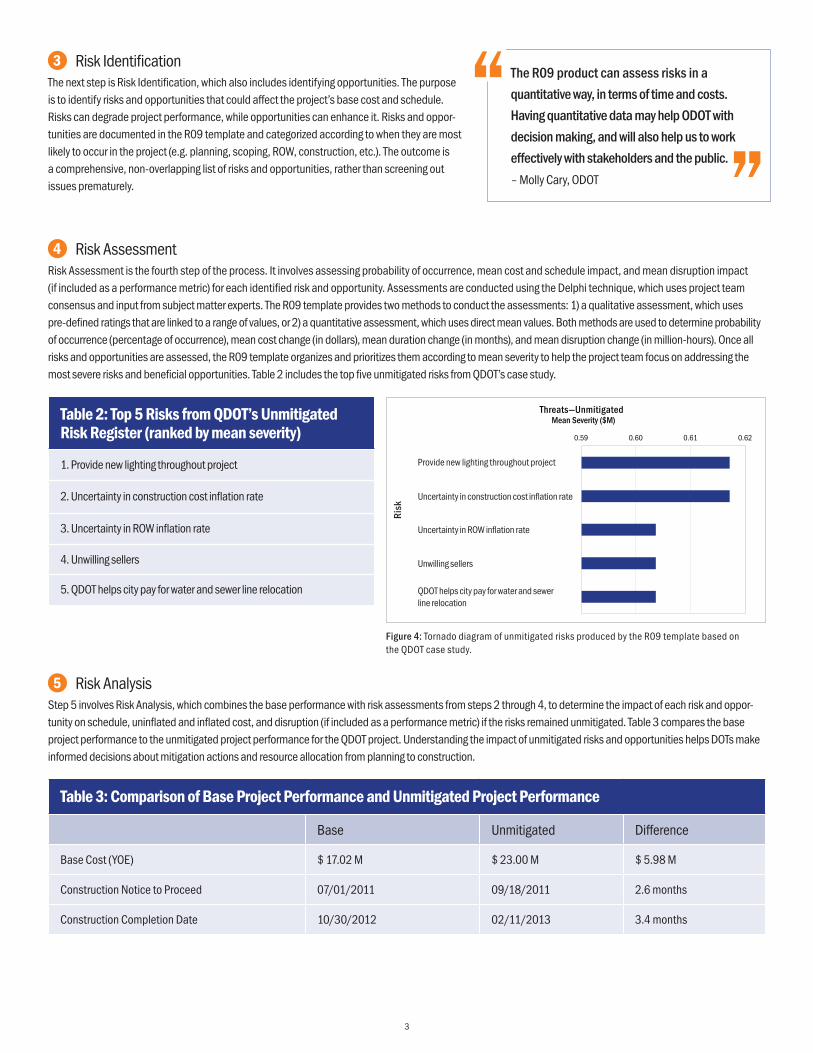
4 Risk Assessment In this step, PennDOT assessed the probability of occurrence, mean cost impact and mean schedule impact of each threat and opportunity. They can be assessed qualitatively using pre-defined ratings that are linked to a range of values, or quantitatively, using direct mean values. Both assessment methods are applied for probability of occurrence (percentage of occurrence), mean cost change (in dollars), and mean duration change (in months). For example, PennDOT noted that for Alternative A, the Department of Environmental Protection may not want to issue a permit for the causeway due to its size and the impact to the migration pattern of a species of fish called “shad” which inhabit the Lehigh River. PennDOT assessed this risk as having a very high probability of occurrence (85% likelihood). Additionally, this risk was assessed as having a high mean impact (8 months) and a low mean cost impact ($370,000). Once all of the threats and opportunities were assessed, the R09 template calculated and documented their mean severity to help the project team address the most severe threats and beneficial opportunities (see Table 2).
Table 2: Top Risks from PennDOT’s Unmitigated Risk Register (ranked by mean severity)
Alternative A (On-Line ABC) Alternative B (Downstream)
1) Preferred alternative proves unfeasible due to constructability concerns 1) Design supplement for Preliminary Engineering (PE) for Downstream alternative
2) High contractor bid price due to bridge slide technology based on project complexity and PennDOT’s minimal experience
2) Preliminary Engineering will require additional time delaying the schedule
3) Pennsylvania Department of Environmental Protection (DEP) does not issue permit for causeway
3) Impact to grave sites during construction due to unknown extent of cemetery boundaries
Alternative A: On-Line Accelerated Bridge Construction (ABC)
• Involves constructing a new bridge superstructure, adjacent to the existing structure, and new piers and abutments under the existing structure, while traffic is maintained on the existing structure
• The existing superstructure will be removed and new pier and abutment seats will be built, and the new superstructure will “slide in” during a short-term bridge closure and traffic/pedestrian detour
• Benefits: Maintains the existing alignment, which minimizes impacts to the ROW, environment, and abutting railroad
• Disadvantages: Higher cost, high uncertainty in contractor bids and capability, utilities will need to be moved twice, and traffic will be detoured during the slide in
Cementon Bridge Replacement: Two Alternatives | Two alternatives are being considered for the Cementon Bridge replacement:
Alternative B: Downstream Alignment
• Involves constructing a new bridge downstream while traffic is maintained on the existing bridge
• Roadway tie-ins will be constructed to connect SR 0329 to the new bridge • Benefits: Minimizes impact to utilities and maintains traffic on the bridge
throughout construction• Disadvantages: New alignment would include a ROW acquisition with
residential displacements, involvement of the Pennsylvania Public Utility Commission (PUC), and relocation of the railroad crossing
The R09 workshop identified a lot of risks with the ABC alternative that the Downstream alternative may alleviate. R09 may lead PennDOT to a different decision about these alternatives than what was previously anticipated. – Brian Shunk, PennDOT ”“

4
5 Risk Analysis Using the outputs from steps 2 to 4, PennDOT combined the base performance data and risk assessments to calculate the impact of each threat and opportunity on project performance measures (i.e., schedule, uninflated and inflated cost) if they remained unmitigated (see Table 3). Understanding the impact of unmitigated threats will help PennDOT make informed decisions from planning to construction.
Table 3: Comparison of Base Project Performance and Unmitigated Project Performance
Base Unmitigated Difference
Alternative A (On-Line ABC)
Base Cost (YOE) Construction Notice to Proceed Construction Completion Date
$22.54 M 6/30/2019 3/29/2022
$29.07 M 3/17/2021 2/6/2024
$6.53 M 21 months 23 months
Alternative B (Downstream)
Base Cost (YOE) Construction Notice to Proceed Construction Completion Date
$20.41 M 12/29/2019 9/12/2022
$24.21 M 2/26/2021 12/18/2023
$3.80 M 14 months 15 months
6 Risk Management Planning PennDOT then planned potential actions to mitigate the top 15 threats and the 2 highest severity opportunities from the unmitigated risk register for Alternative A, and the top 7 threats for Alternative B (see Table 4 for examples). For example, the team recommended performing a constructability review, which would include external experts, to mitigate potential feasibility concerns for Alternative A.
Table 4: Example of Mitigation Actions from PennDOT’s Strategy Register
Risk Description Mitigation Action Applicable Design Alternative
Preferred alternative proves unfeasible due to constructability concerns
Perform constructability review including external experts and implement results
Alternative A
High contractor bid price due to bridge slide technology based on project complexity and PennDOT’s minimal experience
Perform cost review including external experts to review cost estimates and implement suggested changes.
Extend advertisement period and improve information sharing during advertisement process (e.g., publish unofficial plans and specs for review or consider a Value Engineering/Accelerated Construction Technology Transfer session)
Alternative A
Impact to grave sites during construction due to unknown extent of cemetery boundaries
Conduct additional subsurface investigation and testing during design and develop relocation plan if grave sites encountered
Alternative B
Even though it was early in the project, bringing together PennDOT staff and consultants helped us identify risks that we may not have otherwise. Since we are still in the prelimi-nary design phase, there is time to coordinate among agencies to best address risks. That’s the real benefit to the whole R09 product—it’s a great way to identify risks ahead of time and know what you’re up against.
– Laura Montgomery, McCormick Taylor, Consultant Project Manager”“
54
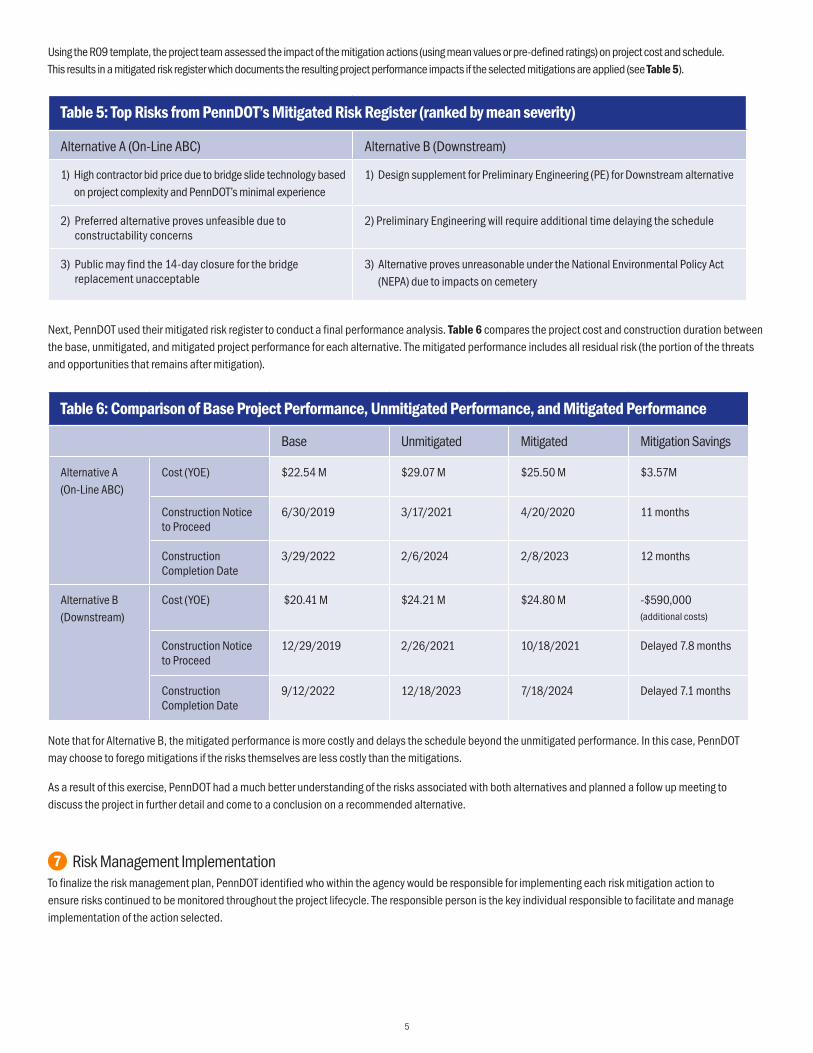
Using the R09 template, the project team assessed the impact of the mitigation actions (using mean values or pre-defined ratings) on project cost and schedule. This results in a mitigated risk register which documents the resulting project performance impacts if the selected mitigations are applied (see Table 5).
Table 5: Top Risks from PennDOT’s Mitigated Risk Register (ranked by mean severity)
Alternative A (On-Line ABC) Alternative B (Downstream)
1) High contractor bid price due to bridge slide technology based on project complexity and PennDOT’s minimal experience
1) Design supplement for Preliminary Engineering (PE) for Downstream alternative
2) Preferred alternative proves unfeasible due to constructability concerns
2) Preliminary Engineering will require additional time delaying the schedule
3) Public may find the 14-day closure for the bridge replacement unacceptable
3) Alternative proves unreasonable under the National Environmental Policy Act (NEPA) due to impacts on cemetery
Next, PennDOT used their mitigated risk register to conduct a final performance analysis. Table 6 compares the project cost and construction duration between the base, unmitigated, and mitigated project performance for each alternative. The mitigated performance includes all residual risk (the portion of the threats and opportunities that remains after mitigation).
Table 6: Comparison of Base Project Performance, Unmitigated Performance, and Mitigated Performance
Base Unmitigated Mitigated Mitigation Savings
Alternative A (On-Line ABC)
Cost (YOE) $22.54 M $29.07 M $25.50 M $3.57M
Construction Notice to Proceed
6/30/2019 3/17/2021 4/20/2020 11 months
Construction Completion Date
3/29/2022 2/6/2024 2/8/2023 12 months
Alternative B (Downstream)
Cost (YOE) $20.41 M $24.21 M $24.80 M -$590,000 (additional costs)
Construction Notice to Proceed
12/29/2019 2/26/2021 10/18/2021 Delayed 7.8 months
Construction Completion Date
9/12/2022 12/18/2023 7/18/2024 Delayed 7.1 months
Note that for Alternative B, the mitigated performance is more costly and delays the schedule beyond the unmitigated performance. In this case, PennDOT may choose to forego mitigations if the risks themselves are less costly than the mitigations.
As a result of this exercise, PennDOT had a much better understanding of the risks associated with both alternatives and planned a follow up meeting to discuss the project in further detail and come to a conclusion on a recommended alternative.
7 Risk Management Implementation To finalize the risk management plan, PennDOT identified who within the agency would be responsible for implementing each risk mitigation action to ensure risks continued to be monitored throughout the project lifecycle. The responsible person is the key individual responsible to facilitate and manage implementation of the action selected.

666
Implementation BenefitsApplying the R09 risk management process has already helped PennDOT to:• Effectively evaluate two alternatives and their associated risks• Create a risk management plan to mitigate and monitor risks• Develop a clearer understanding and better define the project’s scope, strategies, and conditions earlier in the planning stages and prior
to construction• Use the risk assessment data to explore proposed project strategies, document potential mitigations, and evaluate their benefit/cost ratio
PennDOT will continue to use R09 to re-evaluate risks based on changing information leading up to the Cementon Bridge construction phase, scheduled to begin in 2019.
Figure 5: The Cementon Bridge carries SR 0329 over the Lehigh River in eastern Pennsylvania.
Save Lives
Save Money
Save Time
Resources to Help You Use Managing Risk in Rapid Renewal ProjectsThe product’s guidebook is available on the Transportation Research Board website: http://www.trb.org/Main/Blurbs/168369.aspx.
To learn more and to download the Excel-based template, visit http://www.fhwa.dot.gov/GoShrp2/Solutions/Renewal/R09 or contact:
• Carlos F. Figueroa, P.E. (FHWA Office of Infrastructure) at [email protected]• Keith Platte, P.E. (AASHTO) at [email protected]• Brian Shunk, P.E., Risk Program Manager (PennDOT) at [email protected]
Implementing SHRP2The second Strategic Highway Research Program (SHRP2) is a national partnership of the Federal Highway Administration, the American Association of State Highway and Transportation Officials, and the Transportation Research Board. Together, these partners conducted research and are deploying resulting products to help the transportation community enhance productivity, boost efficiency, increase safety, and improve the reliability of the Nation’s highway system.
The Pennsylvania Department of Transportation (PennDOT) applied Managing Risk in Rapid Renewal Projects on the Cementon Bridge replacement project as part of the SHRP2 Implementation Assistance Program.

1
Oregon DOT Case Study:Managing Risk in Rapid Renewal Projects
SHRP2’s risk assessment product, Managing Risk
in Rapid Renewal Projects (R09), is a highly flexible
management tool transportation agencies can use to
anticipate, assess, and manage risk for projects of any
size and type. Through the iterative risk assessment
process, agencies save time and money by identifying
and mitigating risks earlier.
Figure 1: Ochoco Creek Bridge in Prineville, Oregon.
Using SHRP2’s Risk Management Approach to Assess Risk on Projects of All ComplexitiesThe Oregon Department of Transportation (ODOT) has implemented a new risk management process on a series of projects, including the Ochoco Creek Bridge replacement project (photo above).
ODOT used a risk assessment tool developed through the second Strategic Highway Research Program (SHRP2) to begin conducting comprehensive risk assessments in-house, saving both time and money. After realizing the benefits, ODOT developed a risk management framework and supplemental guidance materials to use the tool from project conception through construction. The Agency is now training its project delivery staff to apply the SHRP2 tool to projects of different scopes and complexities, with a goal of integrating risk management into its overall project delivery process.
The Challenge: Calculating and Managing the Impact of RisksState Departments of Transportation (DOTs) commonly hire consultants to complete risk assessments on large projects due to the complex methodology of traditional assessments (i.e., full probabilistic risk assessments), and the Federal Highway Administration’s (FHWA) requirement to conduct cost estimate reviews and risk assessments/analyses on projects that cost $500M and higher. However, complexities and risks may be present in projects of any size. If left unmanaged, these risks could lead to cost overruns, schedule delays, and unmet stakeholder expectations.
DOTs know that risk assessments can save their projects from schedule delays and cost overruns, but traditional assessments are not always practical for small or medium sized projects. Risk assessment could be applied more universally if there was a simplified approach that was customizable to the unique attributes
of each project and could be done in-house.
Figure 2: ODOT participants complete exercises using the R09 template during a training class in Salem, Oregon.
SHRP2 Solution: A Highly Flexible Risk Management Process and TemplateManaging Risk in Rapid Renewal Projects was the ninth research project in the SHRP2 Renewal Focus Area and is also known as Renewal 09 (R09). The product uses a highly flexible Excel-based template to guide teams through a comprehensive risk management process to identify, assess, analyze, and manage risks that are unique to each project. The accompanying R09 Guidebook provides additional tools to assist with each step. The ability to perform these customized assessments in-house saves money in the short and long term, and familiarizes project teams with potential challenges ahead.
During a two-day training workshop hosted by FHWA, ODOT staff applied the prod-uct’s iterative process and template using a hypothetical case study (QDOT project) to:
• Holistically identify potential risks• Determine the likelihood of risk occurrence• Calculate the associated schedule, cost, and disruption impacts• Devise strategies to monitor and mitigate risks from planning to construction• Assess the overall impact of mitigated risks• Explore how to implement a risk management plan as part of their overall
project delivery process
This training was developed by FHWA in the National Highway Institute (NHI) format. It was designed to be interactive and incorporate adult learning principles.
To learn more, visit: www.fhwa.dot.gov/GoSHRP2/Solutions/Renewal/R09 or contact Carlos F. Figueroa, P.E. at [email protected].

2 3
Using the R09 Risk Management TemplateThe R09 template guides agencies step-by-step through the risk management process. DOTs can adjust the template settings to fit their project’s unique characteristics by defining the project’s delivery method, base cost, and base schedule; and by identifying risks. The template then calculates the impact of unmitigated and mitigated risks on schedule, cost, and disruption.
The template includes the following resources and features:
• A Help Guide on every spreadsheet within the template• A comprehensive user guide to better understand risk management terminology• Clearly defined input cells that indicate where to enter data, and output cells that
provide analysis results• The ability to prioritize the most severe risks by project phase in a risk register before and after
mitigation strategies are applied• The option to “retire” a risk if a DOT re-assesses risks on the same project in the future1
• Visual graphs (tornado diagram) showing the most severe unmitigated and mitigated risks (see Figure 4)• A summary report that outlines customized selections from the template to describe risks,
mitigation actions, and unmitigated and mitigated cost and schedule. This can be shared with the project team, DOT management, or the public to advocate for project resources and proposed strategies
Figure 3: R09 Risk Management Process Steps
R09 Risk Management Training Goals Enhance DOT’s capability to conduct risk/opportunity management assessments.
• Identify project conditions and performance require-ments where simple and complex risk/opportunity management (RM) methods can be applied
• Identify the steps of the RM process• Conduct RM assessments for simple projects• Formulate a RM plan for a typical transportation
project (QDOT project)• Document, interpret, and apply the results obtained
with the RM process• Communicate the results of the RM process• Apply the R09 template and implement results
R09 Risk Management Process The 7-step R09 risk management process, described below and in Figure 3, helps DOTs identify and mitigate the most severe risks to reduce overall construction costs and time. Through an FHWA-led training, ODOT personnel applied the R09 risk management process on a hypothetical project, called the QDOT case study. The QDOT example is referenced throughout the R09 Guidebook. It is used during the training because it aims to minimize three key criteria—cost, schedule, and disruption—and is a project that involves multiple risks in several of the project phases. Read additional case studies to see how DOTs are using the process on real-world projects.
1 Project Scope/Strategy/ConditionsThe first step of the process includes familiarizing the participants with the project scope, strategy, and conditions. Elements such as: planned approach, design alternatives, funding, technical conditions affecting the project, political and external conditions, and cost and schedule estimates are discussed among the participants to provide a firm understanding of the project and enable early thinking about potential project risks and opportunities.
2 StructuringStructuring is the second step, which involves defining the base project scenario for cost and schedule/duration (base performance). The base performance does not account for any project risks, which are typically accounted for by way of contingencies and intentional schedule float. The base performance is determined by the R09 template by entering cost and duration information per project phase (e.g. planning, scoping, design/environmental process, procurement, final design, construction) without considering any built-in contingencies and intentional schedule floats. The base performance will be compared against the unmitigated and mitigated project performances later, which include unmitigated risks and some mitigated risks, respectively. Table 1 includes the base project performance results from the QDOT example.
Table 1: Base Project Summary
Base Cost in Year of Expenditures (YOE) $ 17.02 M
Construction Notice to Proceed 07/01/2011
Construction Completion Date 10/30/2012
1A risk can be “retired” under three circumstances: 1) after the risk occurs and is incorporated into the base cost and schedule performance, 2) when the risk can no longer occur (e.g., a design risk after the design phase is completed), or 3) after the risk is mitigated.
2 3
3 Risk Identification The next step is Risk Identification, which also includes identifying opportunities. The purpose is to identify risks and opportunities that could affect the project’s base cost and schedule. Risks can degrade project performance, while opportunities can enhance it. Risks and oppor-tunities are documented in the R09 template and categorized according to when they are most likely to occur in the project (e.g. planning, scoping, ROW, construction, etc.). The outcome is a comprehensive, non-overlapping list of risks and opportunities, rather than screening out issues prematurely. ”
The R09 product can assess risks in a quantitative way, in terms of time and costs. Having quantitative data may help ODOT with decision making, and will also help us to work effectively with stakeholders and the public. – Molly Cary, ODOT
4 Risk Assessment Risk Assessment is the fourth step of the process. It involves assessing probability of occurrence, mean cost and schedule impact, and mean disruption impact (if included as a performance metric) for each identified risk and opportunity. Assessments are conducted using the Delphi technique, which uses project team consensus and input from subject matter experts. The R09 template provides two methods to conduct the assessments: 1) a qualitative assessment, which uses pre-defined ratings that are linked to a range of values, or 2) a quantitative assessment, which uses direct mean values. Both methods are used to determine probability of occurrence (percentage of occurrence), mean cost change (in dollars), mean duration change (in months), and mean disruption change (in million-hours). Once all risks and opportunities are assessed, the R09 template organizes and prioritizes them according to mean severity to help the project team focus on addressing the most severe risks and beneficial opportunities. Table 2 includes the top five unmitigated risks from QDOT’s case study.
Table 2: Top 5 Risks from QDOT’s Unmitigated Risk Register (ranked by mean severity)
1. Provide new lighting throughout project
2. Uncertainty in construction cost inflation rate
3. Uncertainty in ROW inflation rate
4. Unwilling sellers
5. QDOT helps city pay for water and sewer line relocation
0.59 0.60 0.61 0.62
Mean Severity ($M) Threats—Unmitigated
Uncertainty in ROW inflation rate
Unwilling sellers
Figure 4: Tornado diagram of unmitigated risks produced by the R09 template based on the QDOT case study.
“
Risk
5 Risk Analysis Step 5 involves Risk Analysis, which combines the base performance with risk assessments from steps 2 through 4, to determine the impact of each risk and oppor-tunity on schedule, uninflated and inflated cost, and disruption (if included as a performance metric) if the risks remained unmitigated. Table 3 compares the base project performance to the unmitigated project performance for the QDOT project. Understanding the impact of unmitigated risks and opportunities helps DOTs make informed decisions about mitigation actions and resource allocation from planning to construction.
Table 3: Comparison of Base Project Performance and Unmitigated Project Performance
Base Unmitigated Difference
Base Cost (YOE) $ 17.02 M $ 23.00 M $ 5.98 M
Construction Notice to Proceed 07/01/2011 09/18/2011 2.6 months
Construction Completion Date 10/30/2012 02/11/2013 3.4 months
Provide new lighting throughout project
ion rate
er QDOT helps city pay for water and sewline relocation
Uncertainty in construction cost inflat
4 5
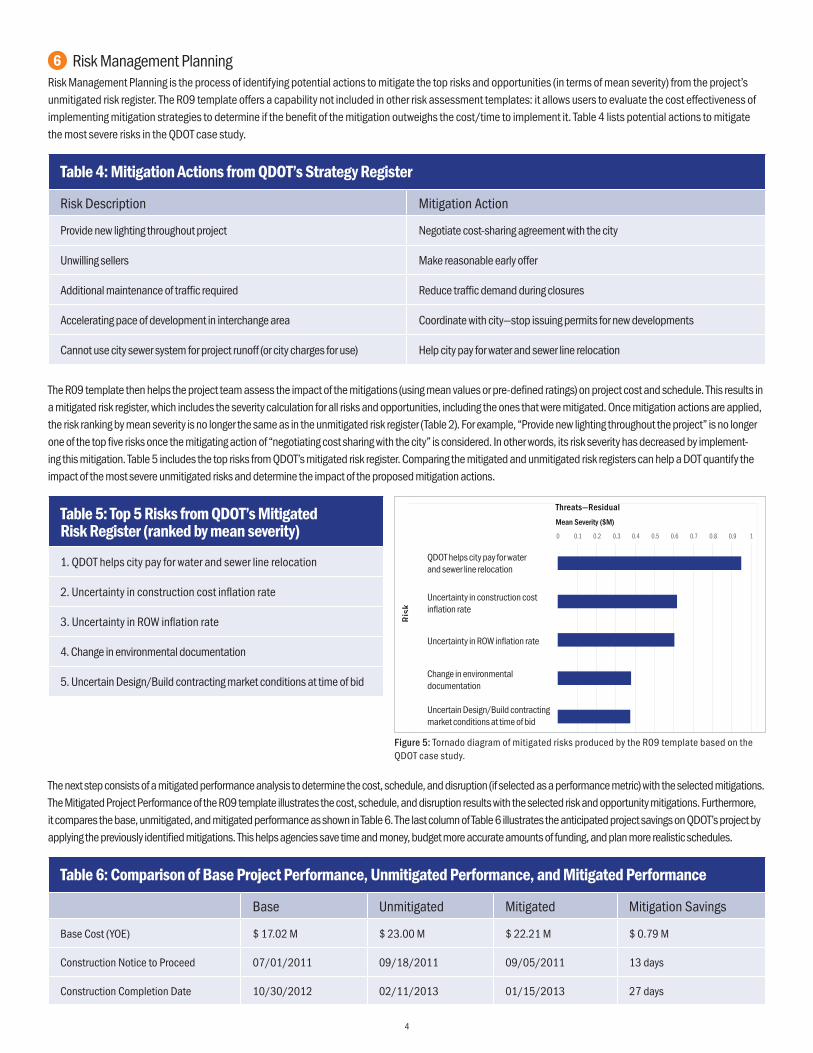
6 Risk Management Planning Risk Management Planning is the process of identifying potential actions to mitigate the top risks and opportunities (in terms of mean severity) from the project’s unmitigated risk register. The R09 template offers a capability not included in other risk assessment templates: it allows users to evaluate the cost effectiveness of implementing mitigation strategies to determine if the benefit of the mitigation outweighs the cost/time to implement it. Table 4 lists potential actions to mitigate the most severe risks in the QDOT case study.
Table 4: Mitigation Actions from QDOT’s Strategy Register
Risk Description Mitigation Action
Provide new lighting throughout project Negotiate cost-sharing agreement with the city
Unwilling sellers Make reasonable early offer
Additional maintenance of traffic required Reduce traffic demand during closures
Accelerating pace of development in interchange area Coordinate with city—stop issuing permits for new developments
Cannot use city sewer system for project runoff (or city charges for use) Help city pay for water and sewer line relocation
The R09 template then helps the project team assess the impact of the mitigations (using mean values or pre-defined ratings) on project cost and schedule. This results in a mitigated risk register, which includes the severity calculation for all risks and opportunities, including the ones that were mitigated. Once mitigation actions are applied, the risk ranking by mean severity is no longer the same as in the unmitigated risk register (Table 2). For example, “Provide new lighting throughout the project” is no longer one of the top five risks once the mitigating action of “negotiating cost sharing with the city” is considered. In other words, its risk severity has decreased by implement-ing this mitigation. Table 5 includes the top risks from QDOT’s mitigated risk register. Comparing the mitigated and unmitigated risk registers can help a DOT quantify the impact of the most severe unmitigated risks and determine the impact of the proposed mitigation actions.
Table 5: Top 5 Risks from QDOT’s Mitigated Risk Register (ranked by mean severity)
1. QDOT helps city pay for water and sewer line relocation
2. Uncertainty in construction cost inflation rate
3. Uncertainty in ROW inflation rate
4. Change in environmental documentation
5. Uncertain Design/Build contracting market conditions at time of bid
-./0"12345"6789"4:9";<=">:82=":?@"52>2="37?2"=23<6:A<?"
B?62=8:7?89"7?"6<?58=C6A<?"6<58"7?D:A<?"=:82"
B?62=8:7?89"7?"E/F"7?D:A<?"=:82"
G1:?H2"7?"2?I7=<?J2?8:3"@<6CJ2?8:A<?"
B?62=8:7?".257H?KLC73@"6<?8=:6A?H"J:=M28"6<?@7A<?5":8"AJ2"<;"N7
E75M
"
Risk
!" !#$" !#%" !#&" !#'" !#(" !#)" !#*" !#+" !#," $"
O2:?"P2I2=789"QROS"
01=2:85"T"E257@C:3"
0 0.1 0.2 0.3 0.4 0.5 0.6 0.7 0.8 0.9 1
Mean Severity ($M)
Threats—Residual
@"
Figure 5: Tornado diagram of mitigated risks produced by the R09 template based on the QDOT case study.
The next step consists of a mitigated performance analysis to determine the cost, schedule, and disruption (if selected as a performance metric) with the selected mitigations. The Mitigated Project Performance of the R09 template illustrates the cost, schedule, and disruption results with the selected risk and opportunity mitigations. Furthermore, it compares the base, unmitigated, and mitigated performance as shown in Table 6. The last column of Table 6 illustrates the anticipated project savings on QDOT’s project by applying the previously identified mitigations. This helps agencies save time and money, budget more accurate amounts of funding, and plan more realistic schedules.
Table 6: Comparison of Base Project Performance, Unmitigated Performance, and Mitigated Performance
Base Unmitigated Mitigated Mitigation Savings
Base Cost (YOE) $ 17.02 M $ 23.00 M $ 22.21 M $ 0.79 M
Construction Notice to Proceed 07/01/2011 09/18/2011 09/05/2011 13 days
Construction Completion Date 10/30/2012 02/11/2013 01/15/2013 27 days
QDOT helps city pay for water and sewer line relocation
Uncertainty in construction cost inflation rate
Uncertainty in ROW inflation rate
Change in environmental documentation
Uncertain Design/Build contractinmarket conditions at time of bid
g

4 5
7 Risk Management Implementation The final step of the process involves identifying the persons who will be responsible for implementing each mitigation and ensuring that risks are monitored throughout the life of the project. When implementing the risk management plan, it is critical to identify roles, responsibilities, authority, and resources. Strong commitment from, and communication among, all parties is essential so the Risk Management Plan can be updated based on changing project conditions.
Best Practices for Instituting a Risk Management ProgramWant to setup your own risk management program? FHWA and ODOT recommend strong organizational support, including a
risk management champion at the leadership level, and someone dedicated to applying and integrating the process and training
project teams. This organizational support is critical to the success of implementing and integrating risk management at your
DOT. Long term commitment from DOT management is crucial in order to institute this program and make it part of the project
delivery process within your DOT.
FHWA also recommends the following steps to help set up and institutionalize a risk management program.
• Develop risk management policies and procedures
• Offer regular training sessions to train staff over time
• Contact other transportation agencies implementing the R09 Risk Management Process to collect best practices (see Table 7)
Table 7: Agencies Using the R09 Risk Management Process
DOT Point of Contact Phone E-Mail
Alabama Vince Calametti 251-470-8204 [email protected]
Alaska Carolyn Morehouse 907-465-8140 [email protected]
Arizona Madhu Reddy 602-712-8965 [email protected]
FHWA Federal Lands Victoria Peters 720-963-3522 [email protected]
Florida Greg Davis 850-414-4170 [email protected]
Georgia Binh Bui 404-608-4798 [email protected]
Minnesota Jenny Read 651-366-4602 [email protected]
Oregon Lea Ann Hart-Chambers 503-986-3798 [email protected]
Pennsylvania Brian Shunk 717-214-1276 [email protected]
Puerto Rico Nydia R. Daniels Vigo 787-721-8787. Ext. 1400, 1401 [email protected]
Puerto Rico Ray Morales 787-721-8787. Ext. 1453 [email protected]
Wisconsin Larry Jones 608-267-7954 [email protected]
Wisconsin Sharon Bremser 608-215-5317 [email protected]
6
Product BenefitsAgencies that adopt this new in-house risk management approach can benefit from:
• Effectively identifying and evaluating the project’s most severe risks and their impact on project cost, schedule, and disruption• Creating a risk management plan to mitigate and monitor risks• Developing a greater understanding of the project’s scope, conditions, and strategies earlier in the planning stages and prior to construction• Using the risk assessment data to explain proposed project strategies and to advocate for necessary project resources• Including key project stakeholders in the risk-management process, which leads to the identification of more risks, opportunities, and
creative mitigations• Creating understanding and buy-in among stakeholders• Collaborating across organizational boundaries to create and leverage the above-mentioned benefits
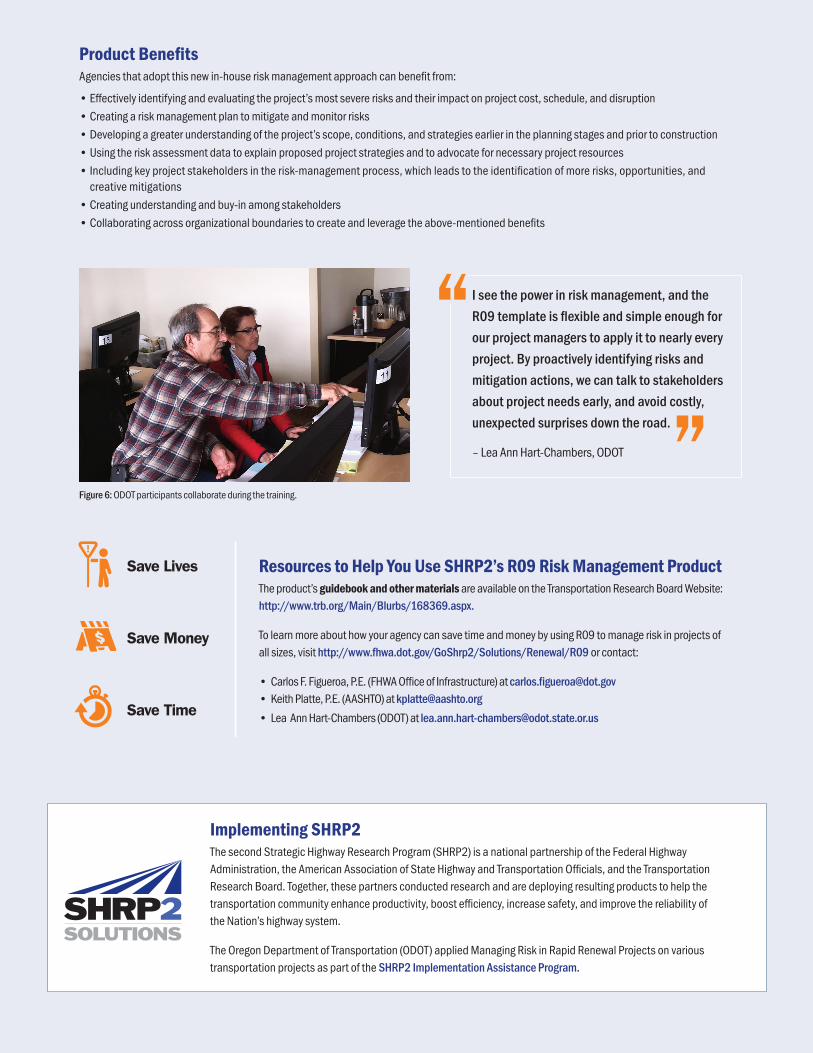
”Figure 6: ODOT participants collaborate during the training.
I see the power in risk management, and the R09 template is flexible and simple enough for our project managers to apply it to nearly every project. By proactively identifying risks and mitigation actions, we can talk to stakeholders about project needs early, and avoid costly, unexpected surprises down the road.
– Lea Ann Hart-Chambers, ODOT
Save Lives
Save Money
Save Time
Resources to Help You Use SHRP2’s R09 Risk Management ProductThe product’s guidebook and other materials are available on the Transportation Research Board Website: http://www.trb.org/Main/Blurbs/168369.aspx.
To learn more about how your agency can save time and money by using R09 to manage risk in projects of all sizes, visit http://www.fhwa.dot.gov/GoShrp2/Solutions/Renewal/R09 or contact:
• Carlos F. Figueroa, P.E. (FHWA Office of Infrastructure) at [email protected]• Keith Platte, P.E. (AASHTO) at [email protected]• Lea Ann Hart-Chambers (ODOT) at [email protected]
Implementing SHRP2The second Strategic Highway Research Program (SHRP2) is a national partnership of the Federal Highway Administration, the American Association of State Highway and Transportation Officials, and the Transportation Research Board. Together, these partners conducted research and are deploying resulting products to help the transportation community enhance productivity, boost efficiency, increase safety, and improve the reliability of the Nation’s highway system.
The Oregon Department of Transportation (ODOT) applied Managing Risk in Rapid Renewal Projects on various transportation projects as part of the SHRP2 Implementation Assistance Program.
“
Managing Risk in Rapid Renewal Projects Case Study: PRHTA’s Bridge Replacement Project
”
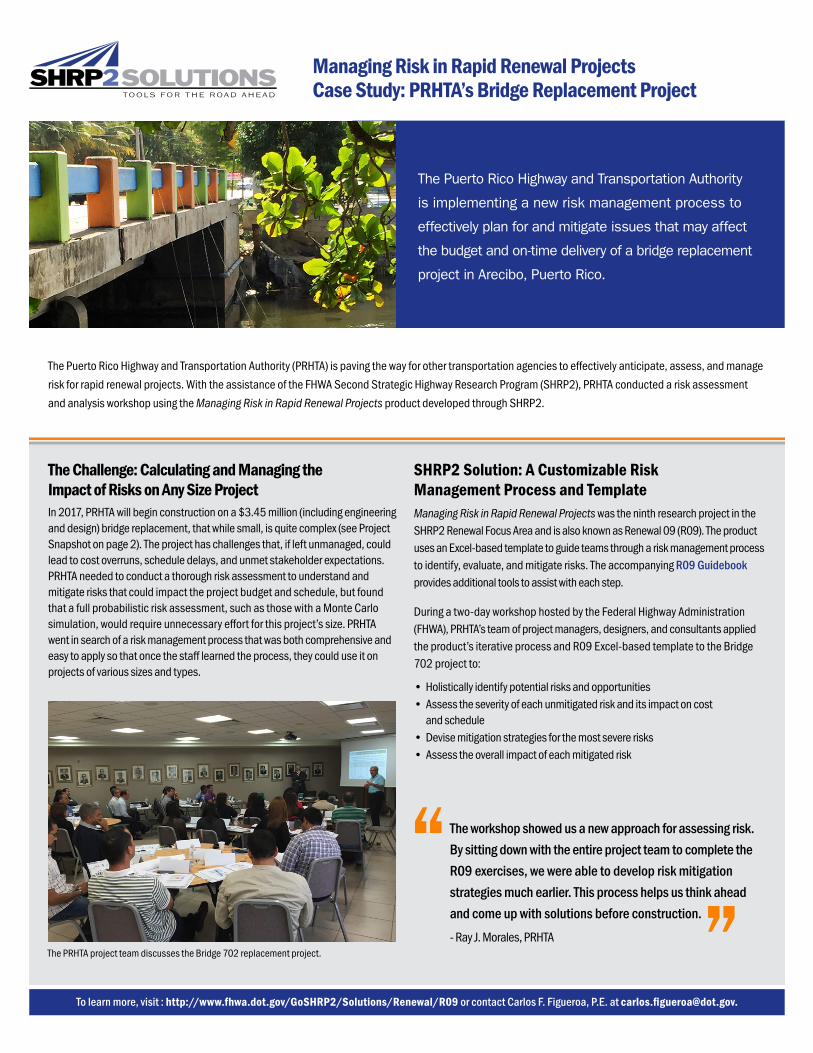
The Puerto Rico Highway and Transportation Authority
is implementing a new risk management process to
effectively plan for and mitigate issues that may affect
the budget and on-time delivery of a bridge replacement
project in Arecibo, Puerto Rico.
The Puerto Rico Highway and Transportation Authority (PRHTA) is paving the way for other transportation agencies to effectively anticipate, assess, and manage risk for rapid renewal projects. With the assistance of the FHWA Second Strategic Highway Research Program (SHRP2), PRHTA conducted a risk assessment and analysis workshop using the Managing Risk in Rapid Renewal Projects product developed through SHRP2.
The Challenge: Calculating and Managing the Impact of Risks on Any Size ProjectIn 2017, PRHTA will begin construction on a $3.45 million (including engineering and design) bridge replacement, that while small, is quite complex (see Project Snapshot on page 2). The project has challenges that, if left unmanaged, could lead to cost overruns, schedule delays, and unmet stakeholder expectations. PRHTA needed to conduct a thorough risk assessment to understand and mitigate risks that could impact the project budget and schedule, but found that a full probabilistic risk assessment, such as those with a Monte Carlo simulation, would require unnecessary effort for this project’s size. PRHTA went in search of a risk management process that was both comprehensive and easy to apply so that once the staff learned the process, they could use it on projects of various sizes and types.
SHRP2 Solution: A Customizable Risk Management Process and TemplateManaging Risk in Rapid Renewal Projects was the ninth research project in the SHRP2 Renewal Focus Area and is also known as Renewal 09 (R09). The product uses an Excel-based template to guide teams through a risk management process to identify, evaluate, and mitigate risks. The accompanying R09 Guidebook provides additional tools to assist with each step.
During a two-day workshop hosted by the Federal Highway Administration (FHWA), PRHTA’s team of project managers, designers, and consultants applied the product’s iterative process and R09 Excel-based template to the Bridge 702 project to:
• Holistically identify potential risks and opportunities• Assess the severity of each unmitigated risk and its impact on cost and schedule • Devise mitigation strategies for the most severe risks• Assess the overall impact of each mitigated risk
The PRHTA project team discusses the Bridge 702 replacement project.
“ The workshop showed us a new approach for assessing risk. By sitting down with the entire project team to complete the R09 exercises, we were able to develop risk mitigation strategies much earlier. This process helps us think ahead and come up with solutions before construction.
- Ray J. Morales, PRHTA
To learn more, visit : http://www.fhwa.dot.gov/GoSHRP2/Solutions/Renewal/R09 or contact Carlos F. Figueroa, P.E. at [email protected].

Project Snapshot: Bridge 702 Replacement
• 10.9 meters-wide bridge, built between 1953 and 1955, located ona narrow, two-lane road (PR-681) that leads to a beach, park, and residential area
• Crosses over the Caño Tiburones canal, the largest wetland in PuertoRico, and abuts a marina and harbor leading to the Atlantic ocean
• Heavy weekend traffic, which is expected to increase after the unveiling of the Christopher Columbus statue in 2016
• Multiple utilities cross the bridge: aerial power lines, undergroundtelephone fiber optic lines, portable sewer and water lines, and a diesel fuel line that supplies a nearby power plant
• Current condition is poor due to severely corrodedbeams and seats
• Key project features: replace bridge using existing alignment upstream; raise the profile to maximize drift clearance under the structure; minimize land acquisition; maintain local access and connections while minimizing environmental impacts
• $3.45M project budget
• Design-Bid-Build project delivery method
• Estimated construction time is 1.5 years (18 months)
Figure 1
R09 Risk Management Process
1 Project Scope/Strategy/Conditions PRHTA kicked off the risk management process by familiarizing the team with the project scope, strategy, and conditions. The project manager discussed the planned approach and alternatives, funding, technical conditions affecting the project, political and external conditions, performance (cost and schedule) estimates, and the team’s strategy to replace the bridge upstream using the existing bridge alignment.
2 Structuring Next, the team defined the “base” project scenario, or the best case scenario, for duration/schedule and cost, without accounting for risk, contingency, or inflation. The “base” performance data is entered into the R09 template and used as a comparison against the project unmitigated and mitigated performance, which includes the risks and opportunities that are identified, assessed, and managed.
Table 1: Base Project Summary
Base Construction Cost in Year of Expenditures (YOE) $3.30M (YOE)
Construction Notice to Proceed 8/21/2017
Construction Completion Date 2/20/2019
3 Risk Identification The project team then identified 33 risks and 3 opportunities that could affect the project’s “base” performance. Risks can degrade project performance, while opportunities can enhance project performance. PRHTA documented risks and opportunities in the risk register in the R09 template and categorized them by when they are most likely to occur (e.g., construction, preliminary design/environmental process, procurement, etc.). This step captures a comprehensive, non- overlapping list of risks and opportunities, rather than screening out issues prematurely.
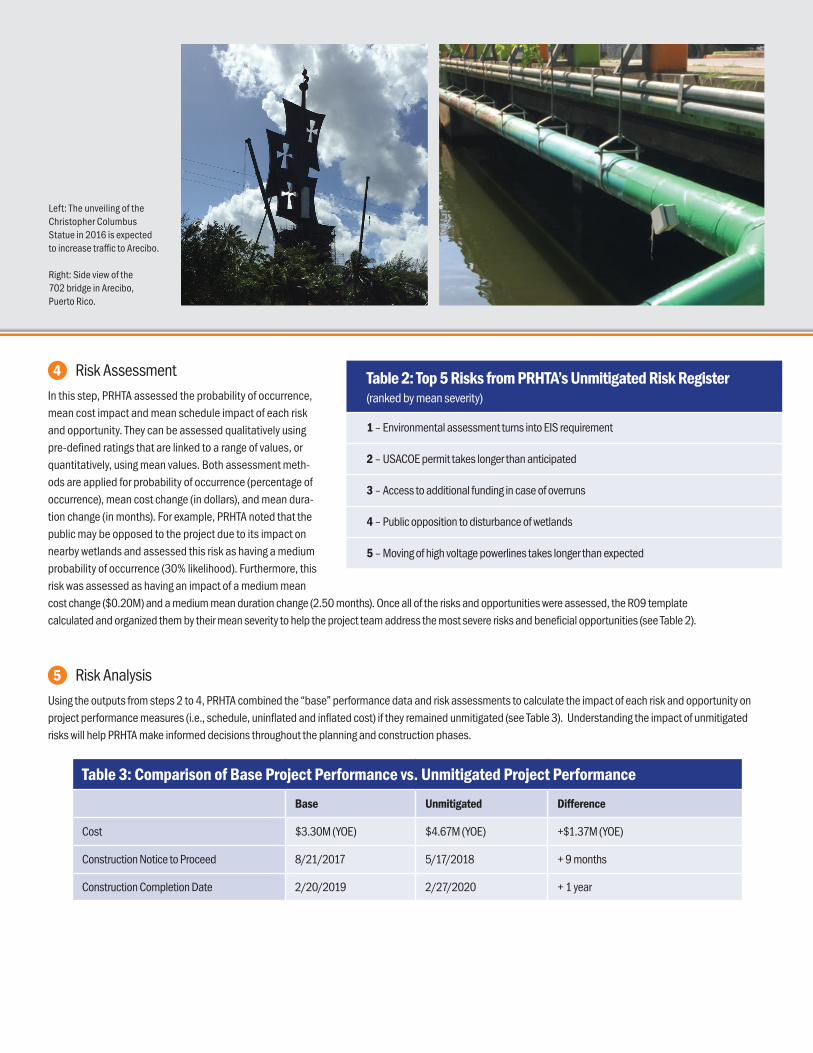
4 Risk Assessment In this step, PRHTA assessed the probability of occurrence, mean cost impact and mean schedule impact of each risk and opportunity. They can be assessed qualitatively using pre-defined ratings that are linked to a range of values, or quantitatively, using mean values. Both assessment meth-ods are applied for probability of occurrence (percentage of occurrence), mean cost change (in dollars), and mean dura-tion change (in months). For example, PRHTA noted that the public may be opposed to the project due to its impact on nearby wetlands and assessed this risk as having a medium probability of occurrence (30% likelihood). Furthermore, this risk was assessed as having an impact of a medium mean cost change ($0.20M) and a medium mean duration change (2.50 months). Once all of the risks and opportunities were assessed, the R09 template calculated and organized them by their mean severity to help the project team address the most severe risks and beneficial opportunities (see Table 2).
5 Risk Analysis Using the outputs from steps 2 to 4, PRHTA combined the “base” performance data and risk assessments to calculate the impact of each risk and opportunity on project performance measures (i.e., schedule, uninflated and inflated cost) if they remained unmitigated (see Table 3). Understanding the impact of unmitigated risks will help PRHTA make informed decisions throughout the planning and construction phases.
Table 3: Comparison of Base Project Performance vs. Unmitigated Project Performance
Base Unmitigated Difference
Cost $3.30M (YOE) $4.67M (YOE) +$1.37M (YOE)
Construction Notice to Proceed 8/21/2017 5/17/2018 + 9 months
Construction Completion Date 2/20/2019 2/27/2020 + 1 year
Table 2: Top 5 Risks from PRHTA’s Unmitigated Risk Register (ranked by mean severity)
1 – Environmental assessment turns into EIS requirement
2 – USACOE permit takes longer than anticipated
3 – Access to additional funding in case of overruns
4 – Public opposition to disturbance of wetlands
5 – Moving of high voltage powerlines takes longer than expected
Left: The unveiling of the Christopher Columbus Statue in 2016 is expected to increase traffic to Arecibo.
Right: Side view of the 702 bridge in Arecibo, Puerto Rico.
6 Risk Management Planning PRHTA then planned potential actions to mitigate the top 9 risks and the highest severity opportunity in the unmitigated risk register (see Table 4). For example, the team recommended launching an early community involvement plan to mitigate their fourth most severe risk: public opposition to disturbance of wetlands.
Table 4: Mitigation Actions from PRHTA’s Strategy Register
Risk Description Mitigation Action
Environmental assessment turns into EIS requirement Minimize affected area of project footprint during construction
USACOE permit takes longer than anticipated Early involvement of US Army Corps of Engineers
Access to additional funding in case of overruns Pass along issues as early as possible
Public opposition to disturbance of wetlands Early community involvement
Moving of high voltage powerlines takes longer than expected Negotiate Memorandum of Understanding with power authority
Using the R09 template, the project team assessed the impact of the mitigation actions (using mean values or pre-defined ratings) on project cost and schedule. This results in a mitigated risk register, which calculates the severity of the risks if selected mitigation actions were applied (see Table 5).
7
Table 5: Top 5 Risks from PRHTA’s Mitigated Risk Register (ranked by mean severity)
1 – Access to additional funding in case of overruns
2 – Public opposition to disturbance of wetlands
3 – Litigious culture of contractors
4 – Extreme weather events/hurricanes
5 – Rock slope instability
Next, PRHTA used their mitigated risk register to conduct a final performance analysis. Table 6 compares the project cost and construction duration between the base, unmitigated and mitigated project performance. The mitigated performance includes any residual risk (the portion of the risk that remains after mitigation).
Table 6: Comparison of Base Performance, Unmitigated Performance, and Mitigated Performance
Base Unmitigated Mitigated Mitigation Savings
Cost $3.30M (YOE) $4.67M (YOE) $3.82M (YOE) $0.85M
Construction Notice to Proceed 8/21/2017 5/17/2018 10/4/2017 7 months
Construction Completion Date 2/20/2019 2/27/2020 5/28/2019 9 months
Risk Management Implementation To finalize the risk management plan, PRHTA identified who within the agency would be responsible for implementing each risk mitigation action to ensure risks continued to be monitored throughout the project lifecycle.

“”
The R09 template methodically steps teams through the risk management process and calculates the impact of both risks and associated mitigation strategies. This process could be applied to a variety of projects—both big and small—to reduce unexpected delays and costs.
– Evelyn Colon, FHWA Puerto Rico Division Office
FHWA and PRHTA review project plans for the Bridge 702 replacement in Arecibo, Puerto Rico.
Implementation BenefitsApplying the R09 risk management process has already helped PRHTA to:
• Effectively identify and evaluate the project’s most severe unmitigated risks and their impact on project cost and schedule
• Create a risk management plan to mitigate risks • Develop a greater understanding of the project’s scope, conditions, and strategies earlier
in the planning stages and prior to construction
PRHTA will continue to use R09 leading up to the Bridge 702 construction phase, scheduled to begin in 2017.
Save Lives
Save Money
Save Time
Resources to Help You Use Managing Risk in Rapid Renewal ProductsThe product’s guidebook and other materials are available on the Transportation Research Board website: http://www.trb.org/Main/Blurbs/168369.aspx
To learn more, visit http://www.fhwa.dot.gov/GoSHRP2/Solutions/Renewal/R09 or contact:
• Carlos F. Figueroa, P.E. (FHWA Office of Infrastructure) at [email protected]• Keith Platte, P.E. (AASHTO) at [email protected]• Ray Morales, Project Manager (PRHTA) at [email protected]
Implementing SHRP2The second Strategic Highway Research Program (SHRP2) is a national partnership of the Federal Highway Administration, the American Association of State Highway and Transportation Officials, and the Transportation Research Board. Together, these partners conducted research and are deploying resulting products to help the transportation community enhance productivity, boost efficiency, increase safety, and improve the reliability of the Nation’s highway system.
The Puerto Rico Highway and Transportation Authority (PRHTA) applied Managing Risk in Rapid Renewal Projects on the Bridge 702 replacement project as part of the SHRP2 Implementation Assistance Program.