pact user manual - atcouncil.org
TRANSCRIPT

FEMA P-58-2 C: PACT User Manual C-1 Second Edition
Appendix C
PACT User Manual
C.1 Introduction
The Performance Assessment Calculation Tool (PACT) provided in Volume 3 is the computational companion to Volume 1. PACT provides a user-friendly platform for scenario-based, intensity-based, and time-based loss calculations. It can accommodate results obtained from nonlinear response history analyses as well as simplified analyses.
PACT provides three basic but integrated functions:
1. Gathering and organizing building information, fragility functions, and demand parameters;
2. Performing loss calculations including repair cost, downtime, and casualty estimates; and
3. Providing overall and performance group specific loss information obtained from the above calculations.
PACT and its associated data management utilities (i.e., the Fragility Specification Manager and Building Population Modeler) are coded in Microsoft C#.net software development platform.
In this Second Edition, PACT has been enhanced to include an algorithm for environmental impact assessment. Further details about the methodology and its development are provided in FEMA P-58-3 BD 3.7.20.
C.2 Hardware and Software Requirements
A computer with the following minimum software and hardware are necessary to use PACT:
• Microsoft Windows 2000, NT, XP, Vista, or 7 operating system
• 200 MB of available hard disk
• A Pentium 500 MHz or faster central processing unit (CPU)
• 256 MB of RAM
• A monitor with a minimum of 800×600 pixels resolution

C-2 C: PACT User Manual FEMA P-58-2 Second Edition
Only one commercial third party control is used (for creating graphs) and PACT users do not need to license any software or utilities in order to use PACT. Those who want to modify the code or further develop PACT need to license only one third party control.
C.3 Installing PACT
PACT is provided as a single file installation executable, version 3.1.2, in Volume 3. The setup program will guide through the installation when double clicked.
PACT requires the free Microsoft Net Framework 3.5 to be installed on the computer. Most newer computers have this utility installed as a part of their operating system. However, the PACT installer checks the computer for presence of the Microsoft Net Framework 3.5 and if necessary it will download it from the Microsoft website and install it. Therefore, internet connectivity during the PACT installation process is prudent.
Once the installation is completed, a shortcut to PACT is placed the desktop as shown in Figure C-1.
Figure C-1 PACT shortcut icon.
It is recommended that users run PACT as an Administrator. To do this, right click on the PACT icon and select “Run as Administrator.”
C.4 PACT Control Panel
When PACT is started, the PACT Control Panel appears. This is the focal point of activities when the program is used. The user will come back to this panel before and after completion of each major task.
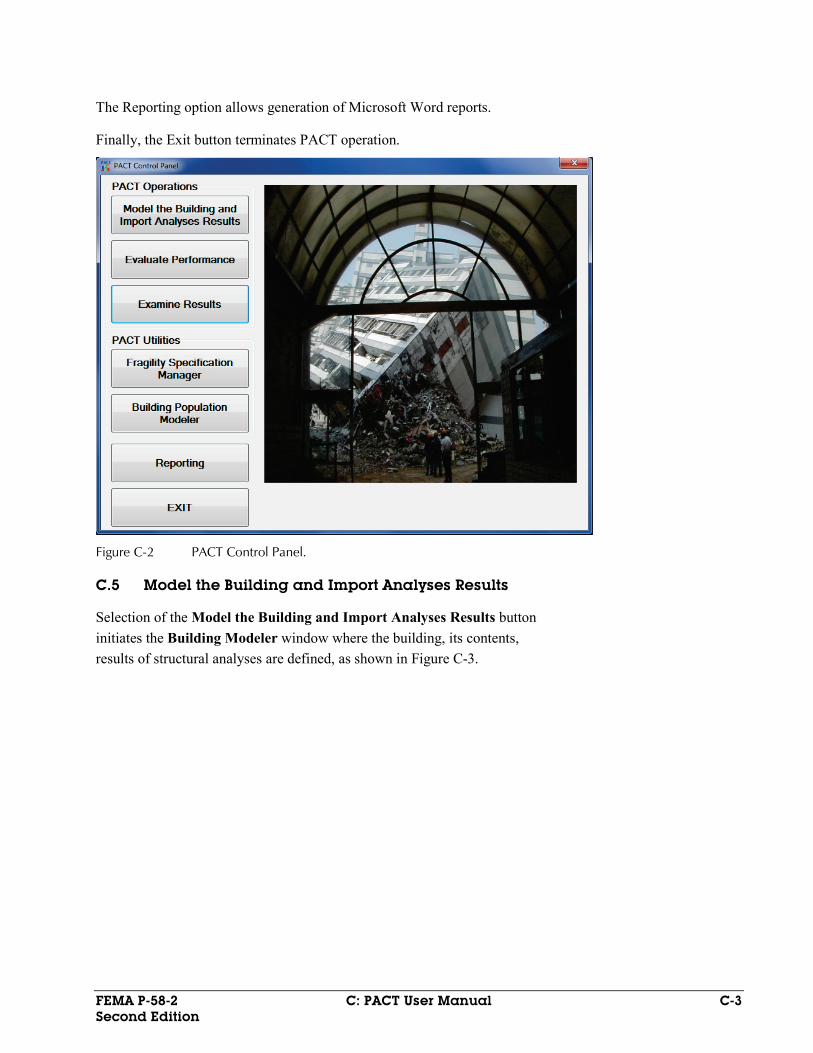
The basic PACT operations are grouped together. They are:
• Model the building and import analyses results
• Evaluate performance, and
• Examine results.
The two PACT utilities that can be operated either within PACT or as totally independent functions are:
• Fragility Specification Manager, and
• Building Population Modeler.
FEMA P-58-2 C: PACT User Manual C-3 Second Edition
The Reporting option allows generation of Microsoft Word reports.
Finally, the Exit button terminates PACT operation.
Figure C-2 PACT Control Panel.
C.5 Model the Building and Import Analyses Results
Selection of the Model the Building and Import Analyses Results button initiates the Building Modeler window where the building, its contents, results of structural analyses are defined, as shown in Figure C-3.

C-4 C: PACT User Manual FEMA P-58-2 Second Edition
Figure C-3 PACT Building Modeler window.
C.5.1 Building Modeler Menus
PACT initially displays a blank canvas assuming that a new performance assessment model is started from scratch. Figure C-4 illustrates how to retrieve existing PACT performance assessment models.
Figure C-4 File menu.
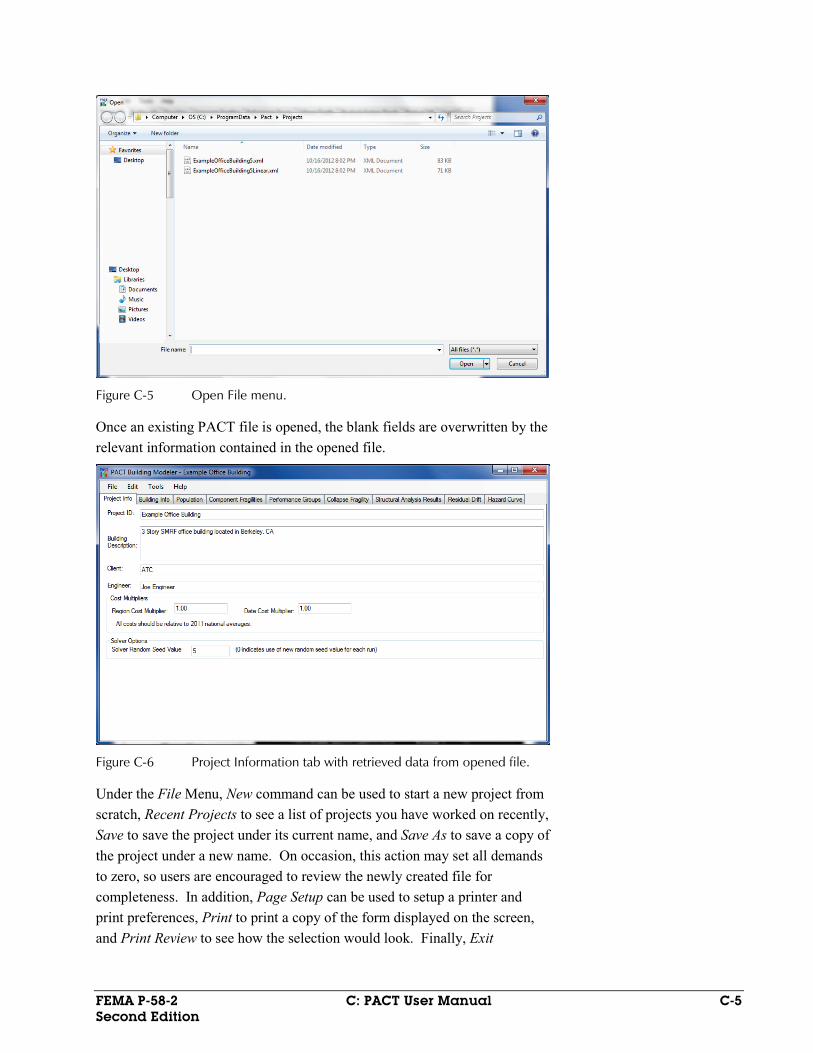
A default five story office building model is built into PACT and can be retrieved as shown in Figure C-5. Two versions of the model are provided: One using the nonlinear response history method and the other using the simplified (linear) method.
FEMA P-58-2 C: PACT User Manual C-5 Second Edition
Figure C-5 Open File menu.
Once an existing PACT file is opened, the blank fields are overwritten by the relevant information contained in the opened file.
Figure C-6 Project Information tab with retrieved data from opened file.
Under the File Menu, New command can be used to start a new project from scratch, Recent Projects to see a list of projects you have worked on recently, Save to save the project under its current name, and Save As to save a copy of the project under a new name. On occasion, this action may set all demands to zero, so users are encouraged to review the newly created file for completeness. In addition, Page Setup can be used to setup a printer and print preferences, Print to print a copy of the form displayed on the screen, and Print Review to see how the selection would look. Finally, Exit

C-6 C: PACT User Manual FEMA P-58-2 Second Edition
command would terminate the Building Modeler and return to the Control Panel.
Under the Edit menu, shown in Figure C-7 Cut, Copy, Paste, and Select All commands can be used to cut and paste contents of one or several cells. This can be used to cut and paste results of analyses from a spreadsheet program like Excel or tables contained in a word processing program such as Word.
Figure C-7 Edit, Tools, and Help menus.
Under the Tools Menu, Options allows for switching between imperial and metric units. PACT is unit independent and both units are accommodated.
C.5.2 Project Information Tab
This tab, shown in Figure C-6, contains input fields for project identification, building description, and client and engineer identifications. In addition, regional and date cost multipliers for the project are to be entered here. Note that PACT cost estimates are based on the 2011 Northern California average costs. The user may choose to use a multiplier based on the year the evaluation is being run and the region where the building is located.
Since performance assessment with PACT involves generation of a multitude of random numbers, in order to get exactly the same result each time the program is executed for the same building, the same solver random seed value should be used. Otherwise, results that are very close but are not necessarily identical to those obtained from previous executions of the program will be output. Putting in a value of zero will mean that the program will generate a new random seed every time the results are calculated.
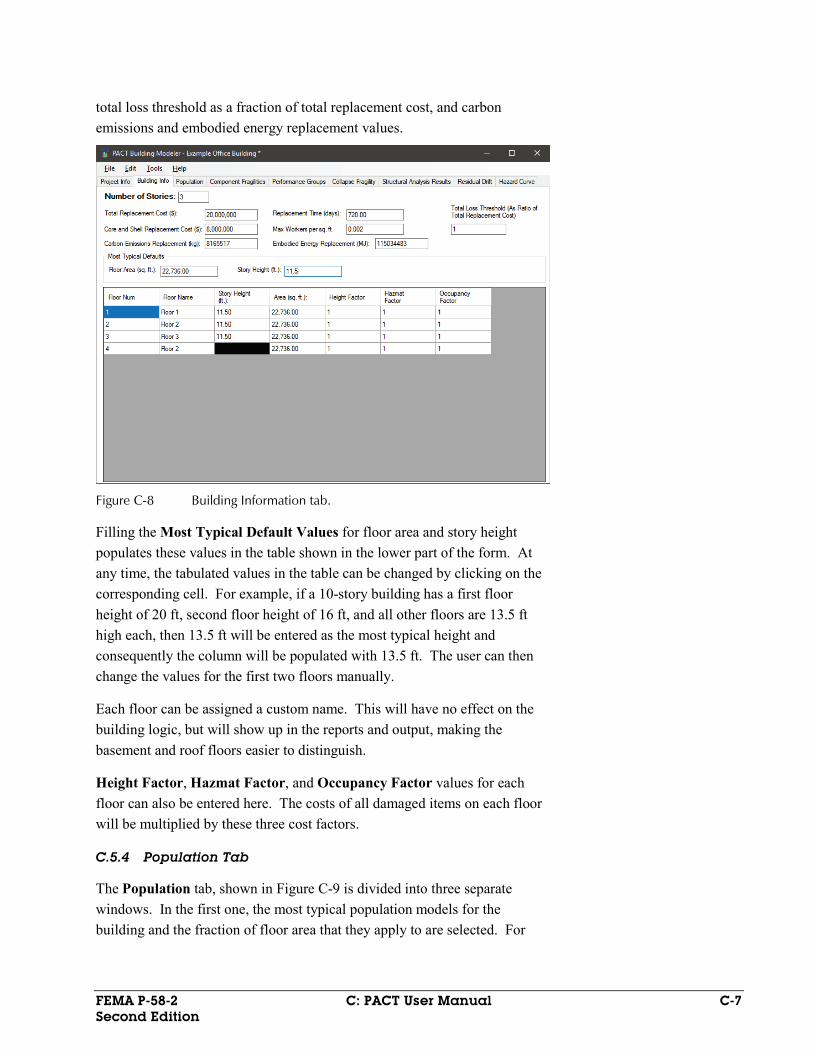
C.5.3 Building Information Tab
This tab, shown in Figure C-8, contains input fields for adding, editing, and reviewing basic building information such as number of stories, total replacement cost and time, core and shell replacement cost, maximum number of workers per unit floor area (needed for estimating repair time),
FEMA P-58-2 C: PACT User Manual C-7 Second Edition
total loss threshold as a fraction of total replacement cost, and carbon emissions and embodied energy replacement values.
Figure C-8 Building Information tab.
Filling the Most Typical Default Values for floor area and story height populates these values in the table shown in the lower part of the form. At any time, the tabulated values in the table can be changed by clicking on the corresponding cell. For example, if a 10-story building has a first floor height of 20 ft, second floor height of 16 ft, and all other floors are 13.5 ft high each, then 13.5 ft will be entered as the most typical height and consequently the column will be populated with 13.5 ft. The user can then change the values for the first two floors manually.
Each floor can be assigned a custom name. This will have no effect on the building logic, but will show up in the reports and output, making the basement and roof floors easier to distinguish.
Height Factor, Hazmat Factor, and Occupancy Factor values for each floor can also be entered here. The costs of all damaged items on each floor will be multiplied by these three cost factors.
C.5.4 Population Tab
The Population tab, shown in Figure C-9 is divided into three separate windows. In the first one, the most typical population models for the building and the fraction of floor area that they apply to are selected. For

C-8 C: PACT User Manual FEMA P-58-2 Second Edition
example, if the typical floor of the building consists of 80% commercial office space and 20% retail space, on the first row Commercial Office should be selected for Occupancy with 0.8 Fraction on the same row and then the second row will be filled with Retail and 0.2.
Figure C-9 Population tab.
Default population models, presented on the right side of the form for this particular project, can also be easily edited. Note, however, that if changes are made to the population models, these changes will be saved for this project only and will not change the values stored in the Building Population Modeler utility. Eight population models are provided with PACT in the Building Population Modeler utility, additional population models can be added.
The values entered on the upper left of the window as typical values are automatically applied to all floors except the roof. The dropdown list and arrows on the bottom left window can be used to change these values for each floor by moving from one floor to another using the floor arrows.
The information corresponding to the selected population model is shown on the right window. Population distribution per month, day of the week, and hour of the day may be viewed in tabular of graphical form, as shown in Figure C-10.

FEMA P-58-2 C: PACT User Manual C-9 Second Edition
Figure C-10 Population model data screens.
A variety of icons are displayed above PACT graphs and charts and aid in copying, exporting, printing, changing, and customizing how graphs are presented, printed and saved.
C.5.5 Component Fragilities Tab
The Component Fragilities tab is organized in two parts, as shown in Figure C-11. The top half is used to identify the most typical fragility specifications to be included in the model of the building and the horizontal directions they apply to. The population model corresponding to the selected fragility specification need also be input here. If the same fragility specification is present at more than one place in the structure, the fragility function needs to be repeated so that there is one for each of the population models that apply to that fragility specification.
On the bottom half of the window, the list is copied to all floors. The dropdown list and arrows can be used to add, remove, or change the fragility specifications at each floor floors.

C-10 C: PACT User Manual FEMA P-58-2 Second Edition
Figure C-11 Component Fragilities tab.
C.5.6 Performance Groups Tab
Once the fragility specifications are selected on the Component Fragilities tab, the Performance Groups tab, shown in Figure C-12, is used to furnish PACT with the relevant quantities and other needed information. First, the table should be populated with the selected fragility specifications in the previous tab using the button on the righthand side.
Different directions and floors can be navigated to by using the and buttons. If there is
uncertainty about the quantities (for example, number of desktop computers at a floor), an appropriate Quantity Dispersion can be specified. The default Fragility Correlated flag assigned to each fragility specification can be changed by checking or unchecking the corresponding box. Note, however, that making fragilities uncorrelated may substantially increase

FEMA P-58-2 C: PACT User Manual C-11 Second Edition
execution time. The population model applicable to each performance group can be changed if more than one population model is utilized in the building.
Figure C-12 Performance Groups tab.
In addition to the commonly used engineering demand parameters (EDP), such as story drift ratio and floor acceleration, the user can also specify special or custom demand parameters. For example, if the fragility function for door frames is defined by doors jamming if residual drift exceeds a certain value, residual drift ratio can be defined as a new Special EDP, as shown in Figure C-13. This will prompt for residual drift ratio values in addition to other demand parameters.
Figure C-13 Demand parameter selection data block.
If one or more fragility specifications were not entered in the Component Fragilities tab, they may be directly added to selected performance groups using button at the lower left.
C.5.7 Collapse Fragility Tab
The Collapse Fragility tab is used to model structural collapse and its consequences. If potential collapse is not necessary in the building assessment, the corresponding box at the top of Figure C-14 can be

C-12 C: PACT User Manual FEMA P-58-2 Second Edition
unchecked. Collapse fragility is defined in terms of the median spectral acceleration, g, at the fundamental period of structure that can cause structural collapse and the associated dispersion. At least one collapse mode needs to be defined, but there is no upper limit on the number of collapse modes that can be included. In addition, the mutually exclusive probability of collapse in each mode conditioned on collapse occurring, is also entered. The fraction of each floor affected by a collapse is specified in a table. For example, Figure C-14 shows three collapse modes representing total collapse, soft story collapse, and middle floor collapse are selected.
Once the collapse modes are defined, the arrows in the Collapse Consequences data block are used to cycle through modes and define the consequences of occurrence of each mode including the fatality and injury rates per floor and the corresponding dispersions. For example, in Figure C-14, the mean fatality rate of 0.90 means that if this type of collapse occurs, 90% of the floor occupants at the time of the event will be perished.
Figure C-14 Collapse Fragility tab.
C.5.8 Structural Analysis Results Tab
The Structural Analysis Results tab is used to input results of structural analyses. As shown in Figure C-15, the first input is needed to specify the assessment type. Intensity-based assessments should be conducted if there is an intention of conducting a time-based evaluation down the road. Next, the type of analysis results should be selected: Nonlinear or linear (simplified). For nonlinear analysis, the typical number of demand vectors to import, should be defined, although the number can change for each intensity or

FEMA P-58-2 C: PACT User Manual C-13 Second Edition
scenario. For simplified analysis, the number of demand vectors is always one (see Figure C-16). The number of realizations that PACT will perform for each intensity/scenario is provided next. Note, that in order to obtain a realistic realization of casualty figures, a rather large number of realizations is needed because PACT assigns a random date and time to each realization affecting the number of people in the building and enough realizations are needed to cover the population distribution of the building during a whole year in a statistically meaningful way.
PACT will automatically determine the non-directional demand parameters by multiplying the maximum value for the two inputted directions by a conversion factor. The conversion factor can be entered here.
Figure C-15 Structural Analysis Results tab for entry of nonlinear analysis results.

C-14 C: PACT User Manual FEMA P-58-2 Second Edition
Figure C-16 Structural Analysis Results tab for entry of simplified analysis results.
Under the Identify Intensity data block, click to add as many scenarios/intensities as needed.
For each scenario/intensity, a description for each scenario/intensity should be provided in the space provided for this purpose. If a particular scenario/intensity has a different number of demand vectors than the “Typical” value set above, it can be changed. A modeling dispersion can also be set for each scenario/intensity, as well as spectral acceleration that will be used for calculating collapse probabilities.
The table needs to be filled with the results of analyses for each scenario/intensity in each direction and for each demand parameter. The arrows can be used to cycle through various scenarios/intensities. If an Excel spreadsheet containing this information is created, the data could be cut and paste into the PACT table.
C.5.9 Residual Drift Tab
In the Residual Drift tab, a lognormal fragility function for maximum building residual drift ratio, as well as the residual drift ratio results from the nonlinear analysis for each intensity or scenario can be entered. If there is no need to use residual drift calculations, the box at the top of the tab should be unchecked, as shown in Figure C-17.

FEMA P-58-2 C: PACT User Manual C-15 Second Edition
Figure C-17 Residual Drift tab.
C.5.10 Hazard Curve Tab
PACT will transfer the spectral accelerations entered in the previous tab into the hazard curve table contained in the Hazard Curve tab, shown in Figure C-18. These values are grayed out so that they cannot be changed here, they can only be changed in the previous tab. Once the mean annual frequency of exceedance (MAFE) values corresponding to each spectral acceleration are entered, the hazard curve will be drawn.
C.5.11 Saving the PACT Model
Once all of the information has been entered in the tabs, the model should be saved under a desired name.

C-16 C: PACT User Manual FEMA P-58-2 Second Edition
Figure C-18 Hazard Curve tab.
C.6 Evaluate Performance
Once the model has been developed, the Evaluate Performance button is activated in the PACT Control Panel and the window shown in Figure C-19 will appear.
Figure C-19 PACT Engine window.
As illustrated in Figure C-20, from the File menu, selecting Open Building Project will allow the selection of the desired model. If the computer has a dual- or multi-core processor, selecting the Use Threading under the Options

FEMA P-58-2 C: PACT User Manual C-17 Second Edition
menu and clicking Yes will utilize the parallel processing capabilities of the computer to speed up the evaluation process.
Figure C-20 Analysis options menu.
When the Run Evaluation button is clicked, depending on the speed of the computer, the number of realizations selected and whether fragilities are correlated or uncorrelated, the PACT execution time may take anywhere between a few seconds to a number of hours. Progress bars at the bottom of the form indicate the status of operation, as shown in Figure C-21, and upon completion of execution the word “Done” will be displayed.
Figure C-21 PACT Engine progress screen.
C-18 C: PACT User Manual FEMA P-58-2 Second Edition
Upon completion of execution, the results can be evaluated immediately because PACT keeps these results available for viewing as long as the user does not exit from PACT or initiate a new model. The file can also be saved as a .bin file or a .xml file; however, this action may cause out of memory errors.
C.6.1 Command Line Evaluation
There is also a command line version of the PACT Engine. The filename is PactEngine.exe, and is located in the main installation directory. This file can be run from the command line, in a batch file, or from an external program. It uses command line switches to change the default options. It will accept multiple input files at one time. The format of the command line is:
“PactEngine InputFileName(s) -t[+-] -e[cnd] -s -e -d –b”
The available command line switches are:
• -h: Display the help information
• -t+: Turn multi-threading on
• -t-: Turn multi-threading off
• -s #: Override the seed value
• -e: Export internal data
• -d: Add date/time stamp to output filename
• -b: Save results as a binary formatted file (default is XML format)
The output file will be saved in the same directory as the input file, with the default name of “inputFileName_results.xml,” unless the -d option is selected, where it will add the date/time stamp of the analysis to the run, in which case the format will be “InputFileName_results_YYYY-MM-DDTHH.MM.SS.xml” (e.g., InputFileName_results_2011-12-31T14.30.00.xml is Dec 31, 2011, at 2:30 in the afternoon).
If a particular command line switch is not used it will use the default option last selected when using the graphical interface, unless otherwise specified above.
C.7 Examine Results
Once the engine has run, the Examine Results button is activated in the PACT Control Panel and the window shown in Figure C-22 will appear.

FEMA P-58-2 C: PACT User Manual C-19 Second Edition
Figure C-22 Results window.
C.7.1 Scenario/Intensity Results
By default, PACT initially displays the Scenario/Intensity Results window, shown in Figure C-22.
In all of the tabs in this window, by default, the cursor moves along the data bins and not the lognormal curve. This can be changed using the Options menu, as shown in Figure C-23.
Figure C-23 Performance curve display options.
Clicking the legend of a performance group on the bar chart causes the bar chart for that performance group to stand out by darkening the color of other bars. A click on the top of the legend box restores the original colors. The radio buttons provided at the bottom left of the form can be used to either show the entire graph or use scale breaks for viewing details at either end of the horizontal scale, as shown in Figure C-24.

C-20 C: PACT User Manual FEMA P-58-2 Second Edition
Figure C-24 Results displays.
For any of the graphs, fragilities can be grouped by their Uniformat ID, which will simplify the keys on the graphs. Under the Tools/Options menu there is an entry titled PG Grouping Level, as shown in Figure C-25. The categories range from All Fragilities where each fragility will be one entry in the graphs with own key entry and color, all the way to Group by Uniformat Major Group Elements, where all the fragilities will be grouped into top level categories such as “shell,” “interior,” and “equipment and furnishings.” This will be particularly helpful with buildings containing many fragilities. Figure C-26 illustrates the effects of changing the performance grouping levels.
Figure C-25 Changing performance grouping levels.

FEMA P-58-2 C: PACT User Manual C-21 Second Edition
Figure C-26 Effects of changing performance grouping levels.
C.7.1.1 Repair Cost Tab
The Repair Cost tab, shown in Figure C-27, contains two graphs. By placing the cursor at the line separating the two graphs and holding the mouse key down, and the line can be dragged to make either graph smaller or larger. The desired Scenario/Intensity number can be selected using the drop down list at the top left of the form.
The graph at the bottom of the form depicts the loss curve for cost associated with the selected scenario/intensity for all performance groups in all directions and throughout the height of the building. By default the cursor on the graph is placed at the median value. However, clicking anywhere on the curve will allow examining losses at various probabilities.

C-22 C: PACT User Manual FEMA P-58-2 Second Edition
Note that the values corresponding to the selected point on the curve are displayed on the text boxes at the bottom of the form. Instead of clicking the cursor on the curve, a cost or probability can be entered in the text box and the corresponding value will be shown in the other text box and the cursor will move to the corresponding location on the curve.
The bar chart on the top depicts the distribution of losses among various performance groups. Note that when the cost or probability on the loss curves is changed the distribution of costs among performance groups shown on the bar chart changes.
Figure C-27 Repair Cost tab.
C.7.1.2 Casualties Tab
The Casualties tab, shown in Figure C-28, contains four graphs. By placing the cursor at the lines separating the graphs and holding the mouse key down, and the lines can be dragged to resize the graphs. The desired scenario/intensity number can be selected using the drop down list at the top left of the form.
The graphs at the bottom of the form depict casualty probabilities associated with the selected scenario/intensity. By default, the cursor on the graph is placed at the median value. However, clicking anywhere on the curve will allow examining losses at various probabilities.

FEMA P-58-2 C: PACT User Manual C-23 Second Edition
Note that the values corresponding to the selected point on the curve are displayed on the text boxes at the bottom of the form. Instead of clicking the cursor on the curve, a cost or probability can be entered in the text box and the corresponding value will be shown in the other text box and the cursor will move to the corresponding location on the curve.
The bar chart on the top depicts the distribution of casualties caused by various performance groups and collapse (if occurring). Note that when the cursor position is changed, the distribution of casualties per performance groups shown on the corresponding bar chart changes.
Figure C-28 Casualties tab.
C.7.1.3 Repair Time Tab
PACT estimates repair time by considering two repair strategies:
1. Serial time in which repair activities are limited to one floor at a time, and
2. Parallel time in which all floors will be subjected to repair activities at the same time.
Repair strategy can be selected by clicking the desired radio button, as shown in Figure C-29. Also note that PACT identifies and reports items that may require a long lead time just below these radio buttons.

C-24 C: PACT User Manual FEMA P-58-2 Second Edition
Figure C-29 Repair strategy selection menu.
For realizations that result in structural collapse, the program equates the repair time to the user supplied total replacement time for the building.
In Figure C-30 and Figure C-31, the bottom graph shows the repair time probability and the top chart shows the total repair time and contribution of each performance group to the total repair time.
Figure C-30 Repair time output assuming floors are repaired in parallel.

FEMA P-58-2 C: PACT User Manual C-25 Second Edition
Figure C-31 Repair time output assuming floors are repaired sequentially.
C.7.1.4 Environmental Impacts
For each scenario/intensity, the probability of various environmental impacts for the building is displayed, as shown in Figure C-32. The desired scenario/intensity number can be selected using the drop down list at the top left of the form.
Figure C-32 Environmental Impacts tab.
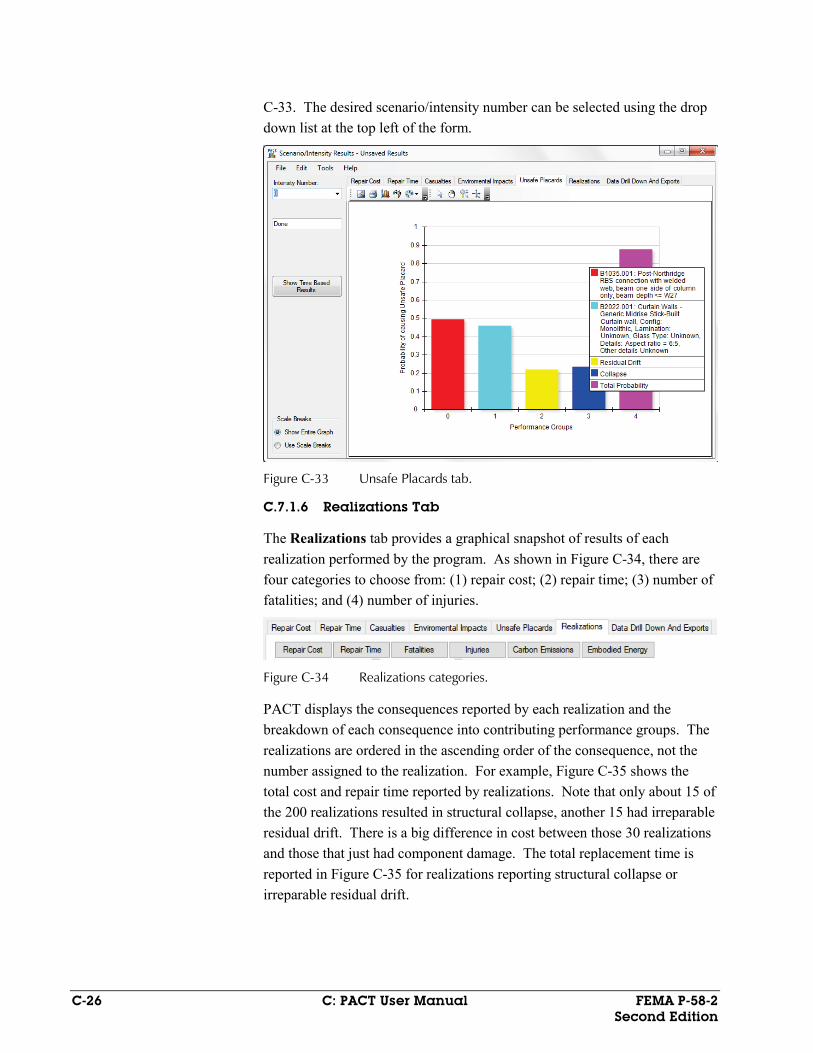
C.7.1.5 Unsafe Placards Tab
For each scenario/intensity, the probability of various performance groups triggering an unsafe placard for the building is displayed, as shown in Figure
C-26 C: PACT User Manual FEMA P-58-2 Second Edition
C-33. The desired scenario/intensity number can be selected using the drop down list at the top left of the form.
Figure C-33 Unsafe Placards tab.
C.7.1.6 Realizations Tab
The Realizations tab provides a graphical snapshot of results of each realization performed by the program. As shown in Figure C-34, there are four categories to choose from: (1) repair cost; (2) repair time; (3) number of fatalities; and (4) number of injuries.
Figure C-34 Realizations categories.
PACT displays the consequences reported by each realization and the breakdown of each consequence into contributing performance groups. The realizations are ordered in the ascending order of the consequence, not the number assigned to the realization. For example, Figure C-35 shows the total cost and repair time reported by realizations. Note that only about 15 of the 200 realizations resulted in structural collapse, another 15 had irreparable residual drift. There is a big difference in cost between those 30 realizations and those that just had component damage. The total replacement time is reported in Figure C-35 for realizations reporting structural collapse or irreparable residual drift.

FEMA P-58-2 C: PACT User Manual C-27 Second Edition
Figure C-35 Individual Realization display of repair cost (top) and repair time
(bottom) contributions by performance group.
C.7.1.7 Data Drill Down and Exports Tab
This Data Drill Down And Export Tab allows for examination or export of results from a single realization or export of results of all realizations in a
Cost
Time

C-28 C: PACT User Manual FEMA P-58-2 Second Edition
comma separated value (CSV) format compatible with Microsoft Excel and most other spreadsheet programs.
To examine results obtained from individual realizations, clicking will display the Results Drill Down window. On this window a particular intensity or scenario, a realization, a particular floor and direction, a performance group, and even a particular item within the performance group can be examined for more information.
The table on the top of the window shown in Figure C-36 provides a summary for Intensity/Scenario #1, Realization #1, Direction 1, and Performance Group B1035.001. Clicking will allow even deeper examination.
Figure C-36 Result Drill Down screen.
There are two choices for exporting the results of realizations. High-level exports produce files containing more significant information while low-level exports contain every bit and piece of the information generated by the program. The available options are shown in Figure C-37.

FEMA P-58-2 C: PACT User Manual C-29 Second Edition
Figure C-37 Screen showing options for exporting results.
C.7.2 Time-Based Results
Selecting the button on the Scenario/Intensity Results window shown in Figure C-22, will initiate the time-based results window, shown in Figure C-38. This window has two tabs that show time based results and loss area charts. The time based results tab is split into 6 sub tabs that show annualized total values for repair cost, repair time, fatalities, injuries, carbon emissions, and embodied energy. The shaded colors in each graph represent the contribution of various intensities to the total annual loss.

C-30 C: PACT User Manual FEMA P-58-2 Second Edition
Figure C-38 Time-based results output screen.
Clicking on the legend of any of the charts causes the chart to highlight the selected data by darkening the color of other data. A click on the top of the legend box restores the original colors.
By default, the annualized total and graphs are the integration of the data bins from each analysis. In order to view annualized totals integrated using the lognormal fitted curves, the option can be selected as shown in Figure C-39.
Figure C-39 Options menu showing base curve mode selection.
When integrating using the data bins, the number of data bins can have an effect on the totals and the graphs. The number of bins used can be adjusted in the Options menu, as shown in Figure C-40. The number of bins actually used will depend on the exact data being evaluated, but it will never be larger than the number specified by the user.
Figure C-40 Options menu showing histogram bins option.
The graph type (either color coded by the contribution of each intensity, or as a single curve showing the total amount) can be changed with the radio buttons on the bottom left of the form.

FEMA P-58-2 C: PACT User Manual C-31 Second Edition
Figure C-41 Average annualized loss output screen.
On the left side of the form the annualized probabilities of structural collapse and unsafe placard are displayed.
Loss Area Charts tab provides a three-dimensional representation of the charts in their unadjusted form or as adjusted by application of mean annual frequency of exceedance values. Figure C-42 shows the different options available for display.
Figure C-42 Loss area charts buttons.
Figure C-43 Loss Area Charts tab.

C-32 C: PACT User Manual FEMA P-58-2 Second Edition
C.8 Fragility Specification Manager
Attention is needed when experimenting with fragility functions definitions, because any changes made here can radically change the outcome of the loss analysis. It is recommended that a backup of the “\ATCCurves” folder originally provided with PACT be made before making any changes to the fragility functions.
The Fragility Specification Manager utility allows editing of fragilities and creation of new fragility specifications.
The File menu provides the option to create a new fragility specification from scratch, save a fragility specification. This menu is shown in Figure C-44. In the Edit menu, an option to duplicate an existing fragility specification is given. The duplicate fragility would be used as the basis for a new fragility. The Tools menu provides the ability to switch default measurement system between imperial and metric units.
Figure C-44 File, Edit, and Tools menus.
C.8.1 Overview Tab
The Overview tab, shown in Figure C-45 provides a list of all the fragility specification categories in a tree structure, along with all the existing fragilities. Any category that has one or more fragilities underneath it will be marked as bold. Any subcategory can be expanded by clicking the small symbol, or hidden by clicking the symbol.

FEMA P-58-2 C: PACT User Manual C-33 Second Edition
Figure C-45 Overview tab.
The search box on the top can be used for searching all the existing fragilities for an ID or description containing that text.
The fragilities are organized with the following:
• Top Level Category:
o A – Substructure
o B – Shell
o C – Interiors
o D – Services
o E – Equipment & Furnishings
o F – Special Construction
• 2nd Level Category:
o Top level followed by 2 numbers from 10 to 99, e.g., A10
• 3rd Level Category:
o 2nd Level followed by one number 1-9, e.g., A101
• 4th Level Category:
o 3rd Level followed by one number 1-9, e.g., A1011
In addition, a specific fragility classification number would include all four levels and an optional letter, e.g., A1011.000 or A1011.555v.
C-34 C: PACT User Manual FEMA P-58-2 Second Edition
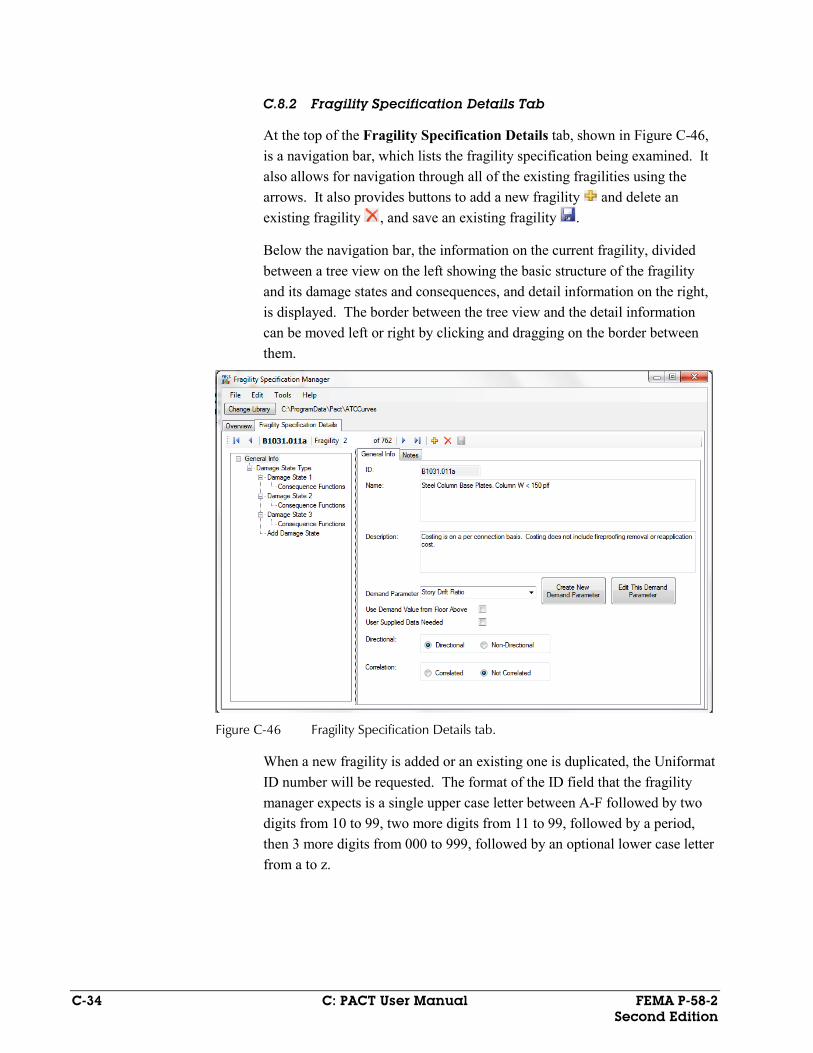
C.8.2 Fragility Specification Details Tab
At the top of the Fragility Specification Details tab, shown in Figure C-46, is a navigation bar, which lists the fragility specification being examined. It also allows for navigation through all of the existing fragilities using the arrows. It also provides buttons to add a new fragility and delete an existing fragility , and save an existing fragility .
Below the navigation bar, the information on the current fragility, divided between a tree view on the left showing the basic structure of the fragility and its damage states and consequences, and detail information on the right, is displayed. The border between the tree view and the detail information can be moved left or right by clicking and dragging on the border between them.
Figure C-46 Fragility Specification Details tab.
When a new fragility is added or an existing one is duplicated, the Uniformat ID number will be requested. The format of the ID field that the fragility manager expects is a single upper case letter between A-F followed by two digits from 10 to 99, two more digits from 11 to 99, followed by a period, then 3 more digits from 000 to 999, followed by an optional lower case letter from a to z.

FEMA P-58-2 C: PACT User Manual C-35 Second Edition
C.8.2.1 Fragility Structure Tree View
The fragility structure consists of general information for the fragility and various damage state groups and sub-damage state groups, individual damage states, and consequences.
The easiest structure is that of a sequential fragility. It consists of general information, a single damage state group (designated with the title of “Damage State Type”), one or more individual damage states, and consequences for each of those damage states.
The structure of a mutually exclusive or simultaneous fragility is more complicated. In either case, a “master” sequential damage state group (designated with the title of “Damage State Type”) with only a single damage state is provided. This damage state is used to determine if the item in question is damaged at all based on the value of the demand parameter of a particular realization. If it is determined that there is some damage, the sub-damage state group is marked as either simultaneous or mutually exclusive, with two or more damage states to determine the exact kind of damage, with consequence functions for each damage state. Both types of fragilities are illustrated in Figure C-47.
(a) (b)
Figure C-47 Tree view showing: (a) sequential; and (b) simultaneous fragilities.
PACT does not limit the user to these options. It is possible to have multiple damage state groups of all different types nested underneath each other, but the utility of these options is limited. Two examples are shown in Figure C-48.
C-36 C: PACT User Manual FEMA P-58-2 Second Edition
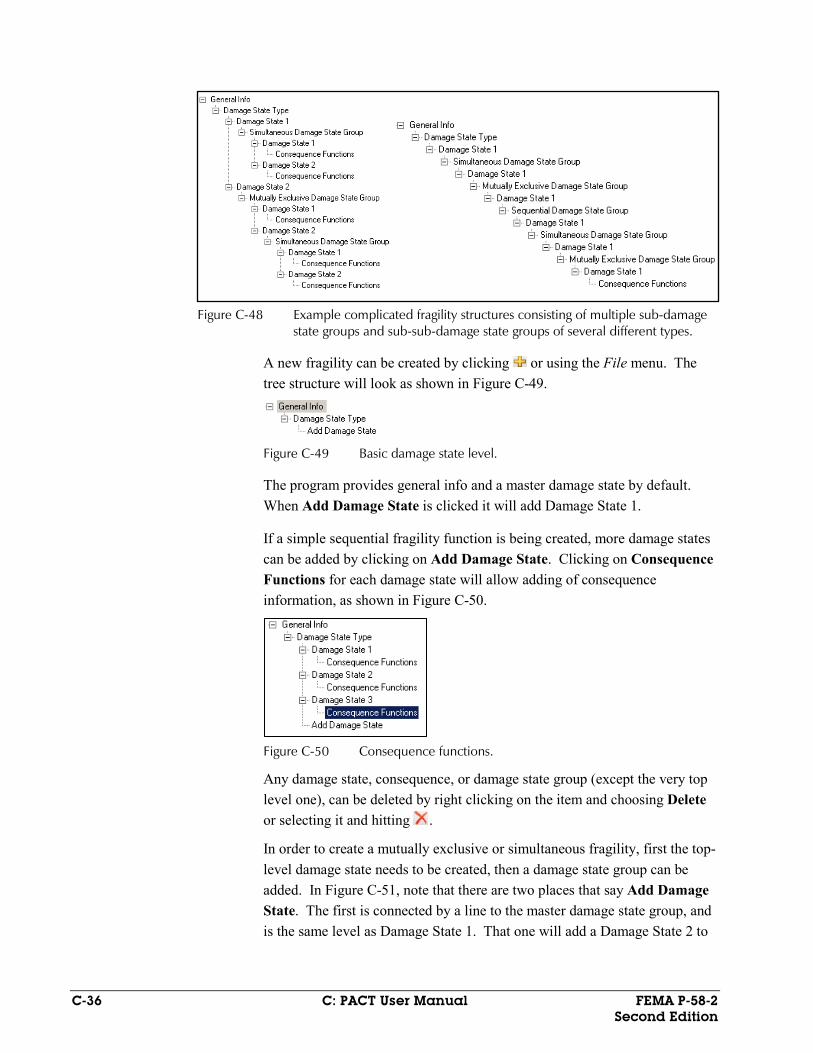
Figure C-48 Example complicated fragility structures consisting of multiple sub-damage
state groups and sub-sub-damage state groups of several different types.
A new fragility can be created by clicking or using the File menu. The tree structure will look as shown in Figure C-49.
Figure C-49 Basic damage state level.
The program provides general info and a master damage state by default. When Add Damage State is clicked it will add Damage State 1.
If a simple sequential fragility function is being created, more damage states can be added by clicking on Add Damage State. Clicking on Consequence Functions for each damage state will allow adding of consequence information, as shown in Figure C-50.
Figure C-50 Consequence functions.
Any damage state, consequence, or damage state group (except the very top level one), can be deleted by right clicking on the item and choosing Delete or selecting it and hitting .
In order to create a mutually exclusive or simultaneous fragility, first the top-level damage state needs to be created, then a damage state group can be added. In Figure C-51, note that there are two places that say Add Damage State. The first is connected by a line to the master damage state group, and is the same level as Damage State 1. That one will add a Damage State 2 to

FEMA P-58-2 C: PACT User Manual C-37 Second Edition
the master group. The second one is under the level of the “Sequential Damage State Group,” and will add a damage state to this subgroup. When this damage state is selected, the selection in the combobox shown in Figure C-52 can be changed to Mutually Exclusive or Simultaneous. Selecting “Add Damage State” that is right under the Sequential Damage State Group text changes the text to say “Mutually Exclusive Damage State Group,” with an option to add the first damage state to it. This is shown in Figure C-53.
Figure C-51 Adding damage state to different groups.
Figure C-52 Combobox for selecting fragility type.
Figure C-53 Creating mutually exclusive damage states.
C.8.2.2 General Info Tab
When General Info is selected on the tree view, the screen shown in Figure C-54, separated into two tabs on the right, is displayed. The General Info tab will show the most important general information about the fragility.
The Fragility ID is shown, but is not editable, along with the short name and a longer description of the fragility. The demand parameter can be selected from a dropdown menu, or created new, as shown in Figure C-55. In addition, the fragility can be specified as directional or non-directional, and correlated or not correlated.
Fragilities can be marked as using the demand values of the floor above, by using the checkbox marked Use Demand Value from Floor Above. This is used for components such ceiling tiles or sprinkler pipes, which affect the casualties of the floor they are on, but use the accelerations of the floor above them to determine their damage state.
Some fragilities will require user-entered values, and are therefore incomplete. These fragilities are marked with the checkbox labeled “User Supplied Data Needed.” The user is expected to edit these fragilities for their

C-38 C: PACT User Manual FEMA P-58-2 Second Edition
specific building, depending on the exact nature of the component. For instance, there are fragilities for computers that have the demand values to determine if the computer is damaged, but not the cost values because that differs based on the specific circumstance. The program will provide a warning if these fragilities are being used without entering in the required values.
Figure C-54 General Info tab on Fragility Specification Details screen.
Figure C-55 Create New Demand Parameter window.
C.8.2.3 Notes Tab
The Notes tab is shown in Figure C-56 and contains miscellaneous information about the fragility. Included here is the date the fragility was created, whether it is an official and approved fragility, the rating of its quality, the author information, and any other notes.

FEMA P-58-2 C: PACT User Manual C-39 Second Edition
Figure C-56 Notes tab on Fragility Specification Details screen.
C.8.2.4 Damage State Group
When any Damage State Group is selected on the tree view, including the top level group named “Damage State Type,” a screen on the right will be displayed. The information consists of a dropdown list showing the damage state group type (Figure C-57), and a graph of all the damage states in that group. If it is the top level group, the fragility type cannot be changed. If the damage group type is sequential, a line graph showing the probability of each damage state against the possible demand parameter values will be shown (see Figure C-58).
Figure C-57 Damage State Group Type dropdown menu.
If the damage state group type is simultaneous, a bar graph with the probabilities of its damage states will be displayed, as shown in Figure C-59a. If the damage state group type is mutually exclusive, a pie chart with the probabilities of its damage states will be displayed, as shown in Figure C-59b.

C-40 C: PACT User Manual FEMA P-58-2 Second Edition
Figure C-58 Damage State Group screen.
(a)
(b)
Figure C-59 Fragility data display showing: (a) simultaneous damage state group; and (b) mutually exclusive damage state group.

FEMA P-58-2 C: PACT User Manual C-41 Second Edition
C.8.2.5 Damage State
When any of the damage states on the tree view are clicked, a screen with information about that damage state will be displayed, as shown in Figure C-60. This screen provides a description, an image if one has been specified, and buttons to allow for deletion or addition of an image. If the selection is sequential (or a master damage state group), the median and dispersion values are displayed. If the selection is simultaneous or mutually exclusive the fraction of the time it is in this damage state is displayed.
Figure C-60 Damage state information screen.
C.8.2.6 Consequence Functions
When any consequence function on the tree view is clicked, a screen with different consequence information, separated into four tabs, is displayed, as shown in Figure C-61.
In the General Consequence Info tab, a description of the repair measures for this damage state is provided.
Figure C-61 Consequence Functions screen.
C-42 C: PACT User Manual FEMA P-58-2 Second Edition
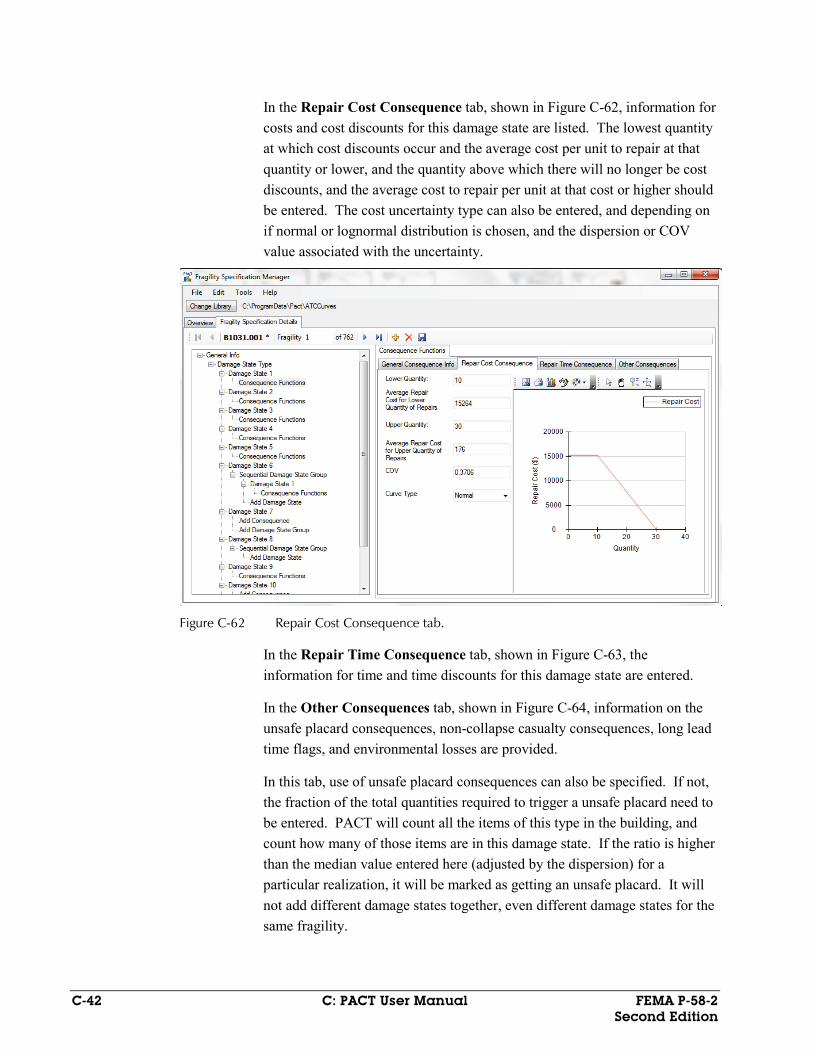
In the Repair Cost Consequence tab, shown in Figure C-62, information for costs and cost discounts for this damage state are listed. The lowest quantity at which cost discounts occur and the average cost per unit to repair at that quantity or lower, and the quantity above which there will no longer be cost discounts, and the average cost to repair per unit at that cost or higher should be entered. The cost uncertainty type can also be entered, and depending on if normal or lognormal distribution is chosen, and the dispersion or COV value associated with the uncertainty.
Figure C-62 Repair Cost Consequence tab.
In the Repair Time Consequence tab, shown in Figure C-63, the information for time and time discounts for this damage state are entered.
In the Other Consequences tab, shown in Figure C-64, information on the unsafe placard consequences, non-collapse casualty consequences, long lead time flags, and environmental losses are provided.
In this tab, use of unsafe placard consequences can also be specified. If not, the fraction of the total quantities required to trigger a unsafe placard need to be entered. PACT will count all the items of this type in the building, and count how many of those items are in this damage state. If the ratio is higher than the median value entered here (adjusted by the dispersion) for a particular realization, it will be marked as getting an unsafe placard. It will not add different damage states together, even different damage states for the same fragility.

FEMA P-58-2 C: PACT User Manual C-43 Second Edition
Figure C-63 Repair Time Consequence tab.
Figure C-64 Other Consequences tab on Fragility Specification Details
screen.

C-44 C: PACT User Manual FEMA P-58-2 Second Edition
Non-collapse casualties can also be defined here by first entering information on how much each floor is affected by an item in this damage state, then what the fatality and serious injury rate are for anyone in that affected area.
Finally, items with a long lead time flags in this damage state can also be indicated here.
C.9 Population Manager
Attention is needed when experimenting with the population library, because any changes made here can change the outcome of the casualty analysis. It is recommended that a backup of the population library originally provided with PACT be made before making any changes to the occupancy functions.
The Population Manager is divided into two separate areas, as shown in Figure C-65. The layout is very similar to the population manager in the building manager, except that changing the values here will change them for all future projects.
Figure C-65 Building Population Manager window.
To create a new population model, New can be selected from the File menu. Fields are provided for entering the name of the population model, the peak number of occupants per 1000 square feet, and the dispersion, population

FEMA P-58-2 C: PACT User Manual C-45 Second Edition
distribution per month, day of the week and hour of the day. These may be viewed graphically by clicking on the graph tab (see Figure C-66).
Figure C-66 Population model data screens.
C.10 Reporting
The reporting screen, shown in Figure C-67, will take project or result files, and a Microsoft word template, and create a Microsoft Word report based on them. Two templates are included, one to be used for a Project file (showing the echo of the inputted information) and one to be used for a results file (showing the inputted information and the results).
Figure C-67 Create Report window.

C-46 C: PACT User Manual FEMA P-58-2 Second Edition
The Tools menu provides two sets of options for image size: (1) “Size of created images (pixels)”; and (2) “Size of images in Word Document (Inches).” The first option is the size that created images (i.e., graphs) will be in the Word document. The default values generally allow for 2 graphs to fit on one page. The second option alters the size of images that are created internally before they are outputted to the Word document, and the size has several effects on the output. As the resolution of the images increases, the graphs get clearer and less blocky, but the fonts do not scale the same way, and so begin to look smaller. It is recommended to use smaller values (200-800) for a report that will most likely be viewed on the computer, and larger values (1000+) when creating reports to print.
Regardless of what values are used for these two options, the aspect ratio (the ratio of width/height) should be the same or very close, or the image will look distorted.
C.11 A Look under the Hood
All data files reside in the Common Application Data folder. For Windows XP, the default location of that folder is “C:\Documents and Settings\All Users\Application Data\Pact,” and for Windows 7 it is “C:\Documents and Settings\All Users\Pact.”
C.11.1 Project Files
All building and project information inputted for a particular project are saved in a single XML file with the project name in the Projects subfolder under the folder where PACT is installed. If the default path was used for installing PACT, the project files may be found in the data folder in “Projects.” Although XML files are text files that can be viewed and changed using any text or word processor, extreme care is necessary if these files are manipulated, as even minor manual changes may render a project file unusable. A copy of the project file can be easily created with no adverse effects.
C.11.2 Results Files
All result information if saved, is saved in a single file with the result name in the Projects subfolder under the folder where PACT is installed. If the default path was used for installing PACT, the project files may be found in data folder at “Projects.” Result files can be saved as binary files, with the file extension .bin or as XML files with the file extension XML. Binary files are smaller, typically half the size of XML files, and much faster to load and save. Results files can be quite large, so this is not a trivial concern.

FEMA P-58-2 C: PACT User Manual C-47 Second Edition
However, binary files can only be read by the PACT Result Viewer. In addition, binary files have been reported to cause out of memory errors when being saved or loaded. XML files, while much larger, can be read by any text editor, and can easily be parsed and manipulated by other programs. Either file format contains the original project file, all the fragilities used by that project, and all the result information, including every single analysis, realization, performance group, damage state, and even every random number used in any calculation.
C.11.3 Fragility Specification Files
Fragility specifications are directories and XML files that bear the same identifier as the fragility specification they represent. For each fragility specification, there is a folder with the same name as the fragility ID, containing an XML file and any representative photos of the damage states associated with the fragility function. These folders are stored in a subfolder under the folder where PACT is installed. If the default path was used for installing PACT, these files may be found in the data directory in “ATCCurves.” PACT will show any proper fragility specification stored in this subfolder.
C.11.4 Population Specification Files
Population specification files are saved in XML files bearing the name of the population specification. They are stored in a subfolder under the folder where PACT is installed. If the default path was used for installing PACT, these files may be found at “Templates\Occupancy.”
C.11.5 Reporting Template Files
A Word 2007/2010 file is used as a template. The file must be in the DOCX format; older Word DOC file types will not work. The default location for the template files is in the data folder at “Reports.” It uses mail merge fields in the template as placeholders for putting information from the actual project. Each merge field in the body and header/footer will be reviewed, and if it is in the proper format, will be replaced by values from the Project or Results file. The fields are too many too list out, but the sample templates have all of the available fields, with one exception: If all the fragilities used want to be shown, the field “Special:AllFragilities” should be selected. If only fragilities that are marked as unofficial want to be shown, the alternate merge field of “Special:UnofficialFragilities” can be used.

C-48 C: PACT User Manual FEMA P-58-2 Second Edition
C.11.6 Programming Notes
PACT is coded using Microsoft Visual Studio 2010 in C#. Besides the functions and utilities contained in the above platform the following third-party controls have been used:
Table C-1 PACT Third Party Controls
Control Name Vendor Link
Chart for .NET v. 9.11.3.12 used under commercial license
Nevron Software http://www.nevron.com/
Math.NET Iridium LPGL open source license
Numeric Foundation
http://www.mathdotnet.com/
Log4Net Apache open source license
Apache Logging Services
http://logging.apache.org/
C.11.6.1 Logfiles
The default location for logfiles is the Project directory, located under the PACT main directory. If for any reason they cannot be written to that location, Local Application Data path, which defaults to C:\Documents and Settings\%username%\Local Settings\Application Data in Windows XP or C:\Users\%username%\AppData\Local in Windows 7 will be used, where %username% is the current username. When reporting bugs, the logfile should be sent to aid with tracking down the bugs.