packaged facts - pilc - 2016 - final · research director, packaged facts ... 18‐34 35‐49...
TRANSCRIPT

1/26/2016
1
David Sprinkle,Research Director, Packaged [email protected]
Pet Product Trends, Part I:Marketing to Today’s Pet Owner
JANUARY 18‐21, 2016 | TUCSON, ARIZONA
Pet Product Trends, Part I:Marketing to Today’s Pet Owner
Pet population and pet owner demographics
Retailing and internet/tech landscape
Spending and new product trends

1/26/2016
2
Hhumanization
premiumization
health &wellness
millennializing
pet population andpet owner demographics
1/26/2016
3
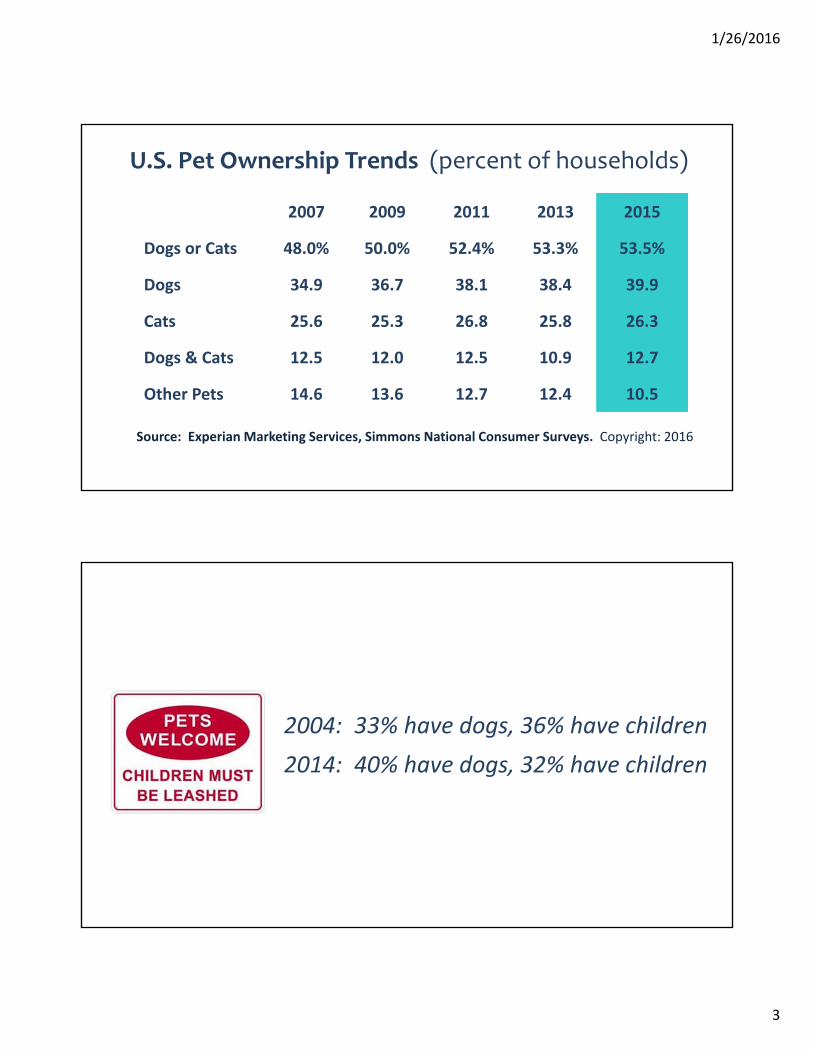
2007 2009 2011 2013 2015
Dogs or Cats 48.0% 50.0% 52.4% 53.3% 53.5%
Dogs 34.9 36.7 38.1 38.4 39.9
Cats 25.6 25.3 26.8 25.8 26.3
Dogs & Cats 12.5 12.0 12.5 10.9 12.7
Other Pets 14.6 13.6 12.7 12.4 10.5
U.S. Pet Ownership Trends (percent of households)
Source: Experian Marketing Services, Simmons National Consumer Surveys. Copyright: 2016
2004: 33% have dogs, 36% have children
2014: 40% have dogs, 32% have children
1/26/2016
4
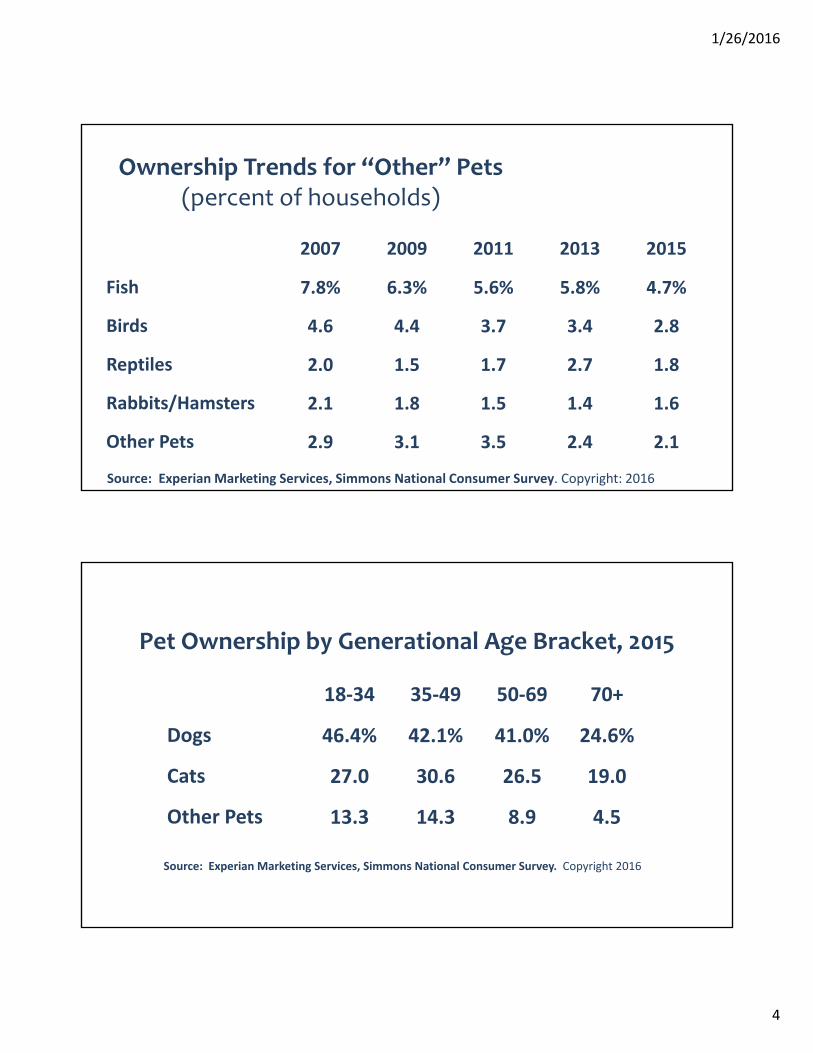
Ownership Trends for “Other” Pets(percent of households)
2007 2009 2011 2013 2015
Fish 7.8% 6.3% 5.6% 5.8% 4.7%
Birds 4.6 4.4 3.7 3.4 2.8
Reptiles 2.0 1.5 1.7 2.7 1.8
Rabbits/Hamsters 2.1 1.8 1.5 1.4 1.6
Other Pets 2.9 3.1 3.5 2.4 2.1
Source: Experian Marketing Services, Simmons National Consumer Survey. Copyright: 2016
Pet Ownership by Generational Age Bracket, 2015
18‐34 35‐49 50‐69 70+
Dogs 46.4% 42.1% 41.0% 24.6%
Cats 27.0 30.6 26.5 19.0
Other Pets 13.3 14.3 8.9 4.5
Source: Experian Marketing Services, Simmons National Consumer Survey. Copyright 2016

1/26/2016
5
Pet Ownership by Age Bracket, 2005 vs. 2015
Source: Experian Marketing Services, Simmons National Consumer Survey. Copyright 2016
18‐34 35‐49 50‐69 70+
2005 2015 2005 2015 2005 2015 2005 2015
Dogs 33.9 46.4 40.8 42.1 34.0 41.0 18.2 24.6
Cats 25.3 27.0 31.3 30.6 24.5 26.5 16.4 19.0
Pet Ownership by Younger Age Bracket, 2005 vs. 2015
Source: Experian Marketing Services, Simmons National Consumer Survey. Copyright 2016
18‐34 18‐24 25‐29 30‐34
2005 2015 2005 2015 2005 2015 2005 2015
Dogs 33.9 46.4 31.8 43.4 35.7 48.7 33.4 46.6
Cats 25.3 27.0 23.2 23.6 25.1 31.4 31.1 26.2
1/26/2016
6
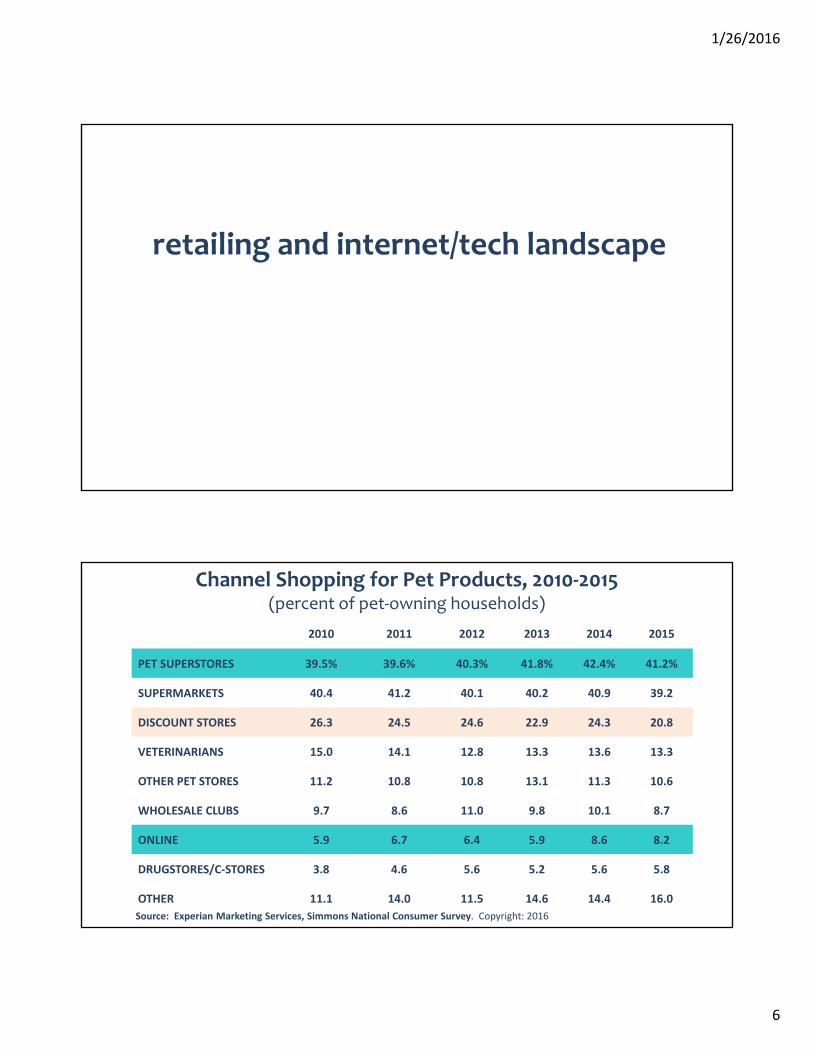
retailing and internet/tech landscape
Channel Shopping for Pet Products, 2010‐2015 (percent of pet‐owning households)
2010 2011 2012 2013 2014 2015
PET SUPERSTORES 39.5% 39.6% 40.3% 41.8% 42.4% 41.2%
SUPERMARKETS 40.4 41.2 40.1 40.2 40.9 39.2
DISCOUNT STORES 26.3 24.5 24.6 22.9 24.3 20.8
VETERINARIANS 15.0 14.1 12.8 13.3 13.6 13.3
OTHER PET STORES 11.2 10.8 10.8 13.1 11.3 10.6
WHOLESALE CLUBS 9.7 8.6 11.0 9.8 10.1 8.7
ONLINE 5.9 6.7 6.4 5.9 8.6 8.2
DRUGSTORES/C‐STORES 3.8 4.6 5.6 5.2 5.6 5.8
OTHER 11.1 14.0 11.5 14.6 14.4 16.0
Source: Experian Marketing Services, Simmons National Consumer Survey. Copyright: 2016
1/26/2016
7
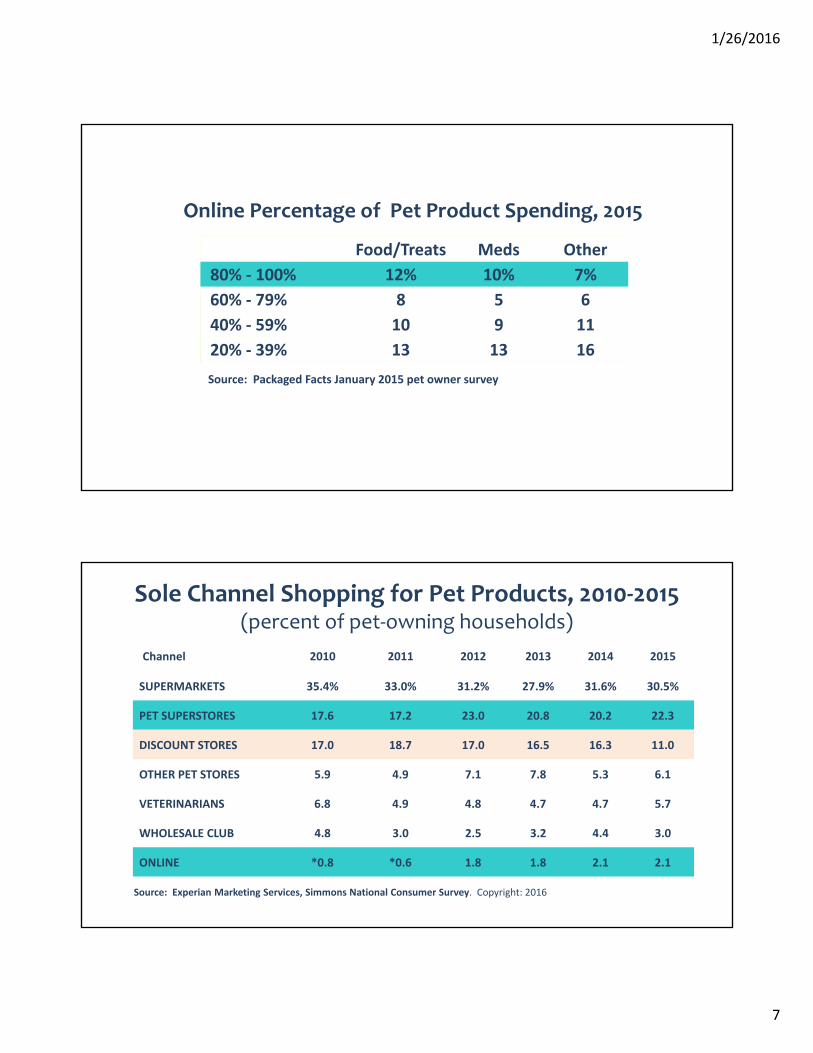
Food/Treats Meds Other
80% ‐ 100% 12% 10% 7%
60% ‐ 79% 8 5 6
40% ‐ 59% 10 9 11
20% ‐ 39% 13 13 16
Online Percentage of Pet Product Spending, 2015
Source: Packaged Facts January 2015 pet owner survey
Sole Channel Shopping for Pet Products, 2010‐2015 (percent of pet‐owning households)
Channel 2010 2011 2012 2013 2014 2015
SUPERMARKETS 35.4% 33.0% 31.2% 27.9% 31.6% 30.5%
PET SUPERSTORES 17.6 17.2 23.0 20.8 20.2 22.3
DISCOUNT STORES 17.0 18.7 17.0 16.5 16.3 11.0
OTHER PET STORES 5.9 4.9 7.1 7.8 5.3 6.1
VETERINARIANS 6.8 4.9 4.8 4.7 4.7 5.7
WHOLESALE CLUB 4.8 3.0 2.5 3.2 4.4 3.0
ONLINE *0.8 *0.6 1.8 1.8 2.1 2.1
Source: Experian Marketing Services, Simmons National Consumer Survey. Copyright: 2016
1/26/2016
8
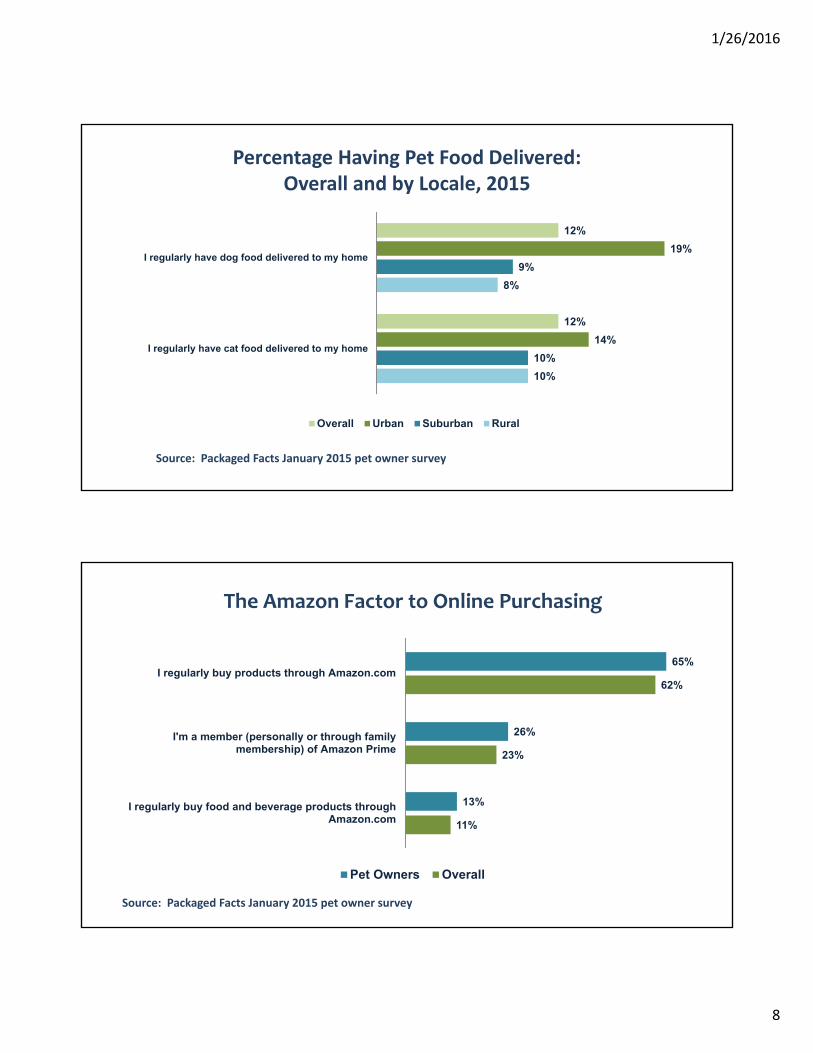
Percentage Having Pet Food Delivered:Overall and by Locale, 2015
10%
8%
10%
9%
14%
19%
12%
12%
I regularly have cat food delivered to my home
I regularly have dog food delivered to my home
Overall Urban Suburban Rural
Source: Packaged Facts January 2015 pet owner survey
The Amazon Factor to Online Purchasing
Source: Packaged Facts January 2015 pet owner survey
11%
23%
62%
13%
26%
65%
I regularly buy food and beverage products throughAmazon.com
I'm a member (personally or through familymembership) of Amazon Prime
I regularly buy products through Amazon.com
Pet Owners Overall

1/26/2016
9
Pet Owning Adults
Non‐Pet‐Owning Adults
Smartphone 74% 64%
Laptop computer 66 60
Desktop computer 59 55
Tablet computer 51 40
Mobile apps 48 36
Cellphone (not
smartphone)23 21
None of the above 1 1
Technologies Used in the Last Seven Days,Pet Owners vs. Non‐Pet Owners, 2015
Source: Packaged Facts Pet Owner Survey, August 2015
Used the Internet
Using PC/laptop
Using Smartphone
UsingTablet
Research products 46% 27% 19% 8%
Compare prices 45 26 18 9
Look for promotions/sales 44 25 18 9
Look for coupons 44 24 18 8
Buy products 43 26 16 8
Compare products 43 23 17 8
Check online sales flyers 40 20 16 8
Use social media for reviews 31 15 15 7
Pet Owners’ Use of Internet for Pet Products, Last 30 Days, 2015
Source: Packaged Facts Pet Owner Survey, August 2015

1/26/2016
10
For Pet Products For Pet Services
Loyalty program features/communications 16% 9%
Mobile app features/communications 12 10
Text message from store or brand 13 9
Influence of Marketing Tactics on Pet Owners’ Pet Purchase Decisions,Last 30 Days, 2015
Source: Packaged Facts Pet Owner Survey, August 2015
Used
General apps (not specifically designed for pet care) 7%Designed for pet‐related purposes 8
Source: Packaged Facts Pet Owner Survey, August 2015
Pet Owners’ Use of Mobile Apps for Pet‐Related Purposes, Last 7 Days, 2015
Have UsedWould Like to Use
in Future
Receive digital coupons 23% 35%
View/redeem rewards/loyalty points 20 32
Refill prescription 15 32
Get personalized deals 17 32
Pay for pet products 17 31
Place order for pickup 18 31
Scan QR code to get promotions/discounts 19 30
Past and Potential Mobile App Use for Pet Product Shopping, 2015

1/26/2016
11
spending and new product trends
Mass‐Market Dollar and Volume Sales (in millions)by Pet Product Category, 2015
Source: IRI MULO
$ Sales % Chg Vol Sales % Chg
DRY DOG FOOD $5,100 (2.3%) 6,985 (3.4%)
DRY CAT FOOD $2,315 (0.4%) 2,270 (1.0%)
DOG TREATS $2,237 3.8% 558 0.8%
DOG/CAT SUPPLIES $2,219 3.9% 330 3.1%
WET CAT FOOD $2,043 3.2% 1,057 1.3%
WET DOG FOOD $1,471 4.8% 1,098 1.3%
NON DOG/CAT PET FOOD $755 (4.4%) 137 (0.4%)
RAWHIDE DOG CHEWS $732 4.0% 159 4.4%
CAT TREATS $503 13.3% 59 13.0%
NON DOG/CAT PET SUPPLIES $290 (4.6%) 47 (2.9%)
FZ/RFG DOG FOOD $141 28.6% 42 23.7%
SEMIMOIST DOG FOOD $123 0.9% 119 1.2%

1/26/2016
12
Overall Pet OwnersPet StoreShoppers
FOOD/GROCERY PRODUCTS 46.9% 51.0% 56.2%
HOUSEHOLD CLEANING PRODUCTS 34.5 38.0 40.9
BEAUTY/GROOMING PRODUCTS 32.5 35.3 41.9
PET FOOD 34.2 38.3
FAST FOOD/RESTAURANTS 31.5 33.1 36.9
BEVERAGES 28.0 31.1 33.1
PAPER GOODS 27.6 30.4 32.1
MEDICATIONS 22.4 24.9 29.9
TOBACCO PRODUCTS 5.5 7.9 5.8
Source: Experian Marketing Services, Simmons National Consumer Survey. Copyright: 2016
Household Usage Rates for Coupons by Type, 2015
Mass‐Market Dry Dog Food Sales Gainers, 2015
Source: IRI MULO
$ Sales $ % Chg Vol % ChgAvg Price/
VolAve PriceRatio
PURINA BEYOND $65.6 225.9% 221.6% $2.06 2.82
PURINA ONE SMARTBLEND TRUE INSTINCT $73.7 104.7% 113.1% $1.38 1.89
RACHAEL RAY NUTRISH ZERO GRAIN $58.4 97.2% 90.0% $1.89 2.59
IAMS NATURALS $14.5 61.5% 59.1% $2.09 2.87
EVOLVE $12.3 55.5% 59.1% $1.43 1.97
KAL KAN $24.6 52.6% 64.4% $0.40 0.54
RACHAEL RAY NUTRISH $152.3 37.3% 38.5% $1.20 1.64
RACHAEL RAY NUTRISH JUST 6 $35.2 37.3% 34.2% $1.42 1.95
IAMS LARGE BREED PROACTIVE HEALTH $20.4 23.7% 26.2% $0.87 1.19
PURINA BENEFUL INCREDIBITES $62.6 15.7% 11.2% $1.14 1.57
IAMS PROACTIVE HEALTH MATURE ADULT $35.1 11.0% 11.8% $1.24 1.69

1/26/2016
13
Topline Cat Food Purchasing Trends by Type,(percent of cat‐owning HHs)
2007 2009 2011 2013 2015
Dry 94.1% 95.6% 96.9% 95.5% 94.4%
Wet/Moist 45.5 44.7 49.9 53.3% 57.1%
Dry & Wet/Moist 42.6 42.3 48.3 51.0 53.0
Treats 41.2 44.1 44.1 52.8 50.5
Source: Experian Marketing Services, Simmons National Consumer Survey. Copyright: 2016
1/26/2016
14
trend to watch: meal delivery
David Sprinkle,Research Director, Packaged [email protected]