pacific northwest pathways to 2050 -...
TRANSCRIPT

Pacific Northwest Pathways to 2050
Achieving an 80% reduction in economy-wide greenhouse gases by 2050
November 2018


© 2018 Copyright. All Rights Reserved.
Energy and Environmental Economics, Inc.
101 Montgomery Street, Suite 1600
San Francisco, CA 94104
415.391.5100
www.ethree.com
Achieving an 80% reduction in economy-wide greenhouse gases by 2050
November 2018
Pacific Northwest Pathways to 2050


P a g e | 1 |
Executive Summary
© 2018 Energy and Environmental Economics, Inc.
Executive Summary
Study Background
To help limit the worst impacts of climate change, Oregon and Washington have both committed to
achieving significant reductions in greenhouse gas (GHG) emissions by 2050. Policymakers and the
public are also contemplating new policies and programs to achieve steep regional GHG reductions.
This study evaluates the technology implications, and potential costs and savings, of different strategies
to achieve long-term, economy-wide GHG reductions in Oregon and Washington. This study considers
GHG emissions reductions of 80 percent below 1990 levels by 2050, a level of reduction often called
“deep decarbonization.” Achieving an 80 percent reduction goal across the two combined states would
bring total regional economy-wide emissions down to 29 million metric tons CO2-equivalent by 2050,
compared to approximately 155 million metric tons CO2e in 2013 (Figure 1).

Pacific Northwest Pathways to 2050
P a g e | 2 |
Figure 1. Pacific Northwest historical greenhouse gas emissions and 2050 greenhouse gas target
This is an ambitious target. Achieving the carbon reductions envisioned in this analysis has implications
for all residents, companies, and economic sectors in the region. NW Natural, as the gas distribution
business serving most of Oregon’s population and the Vancouver, Washington, area, has an abiding
interest in both understanding the role of a natural gas company in achieving this low-carbon vision, and
in helping to achieve the sustainability goals of its customers and the broader region. To address this,
NW Natural contracted Energy and Environmental Economics, Inc. (E3) to perform an independent
analysis of deep decarbonization scenarios for the Pacific Northwest.
This study builds on an existing body of research. Prior studies have evaluated options to achieve deep
decarbonization in the United States as a whole, and in states like Washington and California. Similar
studies have also been done at the sub-state level, including a recent deep decarbonization study of the
Portland General Electric service territory. However, none of these prior studies, to our knowledge, has
P a g e | 3 |
Executive Summary
© 2018 Energy and Environmental Economics, Inc.
investigated the costs and implications of meeting winter peak energy needs during the region’s coldest
periods.
This study focuses on the role of buildings in meeting broad, economy-wide carbon reductions, and pays
special attention to the performance of building space heating technologies under cold temperature
conditions, and the costs of reliably serving those loads. The region’s natural gas and electric systems
are built to serve peak heating loads during cold temperatures that fall well below average winter
conditions. Both the gas distribution system and the electric generation system experience the highest
peak demands concurrently, during the winter. During the coldest days of the year, the natural gas
system provides a large amount of energy to meet the region’s heating needs.
A key question in this study is how the existing gas distribution system could be used to help achieve
economy-wide deep decarbonization goals, while continuing to reliably meet regional peak energy
demands. This low-carbon future is compared to what would be required of the region’s electric system
– already a winter-peaking system – if it were to take on the gas system’s substantial winter peak
heating loads under a future where natural gas space and water heating were electrified.
Approach
The modeling approach applied in this project is based on E3’s deep decarbonization scenario tool,
called PATHWAYS. The economy-wide PATHWAYS framework is supplemented by tools tailored to
specifically analyze the electricity sector, biofuel supply and conversion paths, and building energy
performance. The Northwest version of the PATHWAYS model is tailored to regionally-specific energy
demands, energy supply, and existing building types, vehicles, and other energy-consuming equipment,
using local data whenever possible. The tool is also benchmarked to the Oregon and Washington state
greenhouse gas emissions inventories.

Pacific Northwest Pathways to 2050
P a g e | 4 |
PATHWAYS is an economic energy and greenhouse gas emissions accounting tool. A key feature of the
PATHWAYS model is its detailed treatment of the Northwest’s energy infrastructure. Energy
infrastructure includes equipment that produces, delivers, and consumes energy, such as power plants,
industrial facilities, trucks, cars, buses, and building equipment. While each sector and type of
equipment consumes energy and produces emissions differently, collectively they determine
the region’s GHG emissions trajectory.
Costs, emissions, generation, and peaking capacity needs in the electricity sector are modeled in more
detail using a separate electricity-sector tool called RESOLVE. RESOLVE is a power system operations and
investment model that uses linear programming to identify optimal long-term resource investments in
the electric system, subject to electric reliability and policy constraints. RESOLVE layers capacity
expansion logic on top of a production cost model to determine the least-cost electric sector investment
plan, accounting for both upfront capital costs and variable costs to operate the grid. This project uses a
Northwest-specific version of RESOLVE that was initially developed for the Public Generating Pool in
2017 and described in the “Pacific Northwest Low Carbon Scenario Analysis” report.1
Biofuels are an important component of long-term decarbonization plans because they represent
carbon-neutral fuels that can be transported and used with existing infrastructure and equipment.
Assumptions around biofuel costs and supply receive detailed treatment using the E3 PATHWAYS
Biofuels Module. This tool generates biofuel supply curves that determine the availability and cost of
renewable liquid and gaseous biofuels, and optimizes the selection of combinations of feedstocks,
conversion pathways, and final fuels based on regional fossil fuel demands.
1 E3, “Pacific Northwest Low Carbon Scenario Analysis: Achieving Least-Cost Carbon Emissions Reductions in the Electricity Sector,” December 2017. Available at: http://www.publicgeneratingpool.com/wp-content/uploads/2017/12/E3_PGP_GHGReductionStudy_2017-12-15_FINAL.pdf

P a g e | 5 |
Executive Summary
© 2018 Energy and Environmental Economics, Inc.
Finally, we evaluate the hourly performance of different types of electric heat pump space heating
equipment, using regionally appropriate winter temperature conditions. E3 worked with building
science consultants at Big Ladder Software to simulate the performance of several different types of
buildings and heat pump equipment configurations in two climate zones in the Northwest, using the
building simulation software EnergyPlus. After accounting for load diversity and building shell
improvements, we use hourly load shapes to modify the base, system-wide hourly load profiles in the
RESOLVE model. This creates a more realistic picture of how hourly electricity demands, and winter peak
electricity demands, could change under a high building electrification future.
This suite of modeling and analytical tools allows us to combine a least-cost scenario design approach
for the electricity sector, with a detailed understanding of electric building performance, with an
economy-wide, technology-specific perspective of costs, energy consumption and greenhouse gas
emissions using the PATHWAYS model.
Scenarios and Key Findings
Four scenarios to 2050 are evaluated, which differ in their consideration of technology pathways to
serve space heating needs in buildings. Two of the scenarios maintain the direct use of natural gas2 in
buildings (relying on gas furnaces or natural gas powered heat pumps), while two of the scenarios
assume a large-scale transition and retrofitting of buildings to electric end-uses (relying on electric air
source heat pumps or cold-climate electric air source heat pumps) (Table 1). All scenarios are
constrained to achieve an 80 percent reduction in GHGs by 2050 for the Pacific Northwest regional
economy, while assuming continued economic and population growth.
2 Direct use of natural gas is defined as all gas that is not used to generate electricity.

Pacific Northwest Pathways to 2050
P a g e | 6 |
Table 1. Key 2050 metrics by scenario
2050 metrics Gas Furnace
Scenario Gas Heat Pump
Scenario Electric Heat
Pump Scenario Cold-Climate Heat
Pump Scenario
Share of Natural Gas Space and Water Heating Electrified (fuel switching)
0% 0% 96% 96%
Industry Electrification (fuel switching, % total industry energy demand)
30% 30% 5% 5%
Carbon Free Electricity Generation
97% 97% 95% 95%
Biofuel Development (Share of available resource)
100% 97% 73% 73%
Hydrogen Mix in Gas Pipeline
7% 0% 0% 0%
These scenarios demonstrate that deep decarbonization in the Pacific Northwest will require
transformative change to the energy economy of the region, across every sector of the economy. Four
strategies, or “pillars,” are identified as a common finding across deep decarbonization studies: energy
efficiency and conservation, electrification (i.e., switching from fossil fuels to electricity), low-carbon
energy, and reductions in non-combustion emissions (Figure 2).

P a g e | 7 |
Executive Summary
© 2018 Energy and Environmental Economics, Inc.
Figure 2: Pillars of Deep Decarbonization
While all of the scenarios contain elements of each of these four pillars, not every measure is required in
every scenario. The relative emphasis on each pillar differs by scenario. All of the scenarios evaluated in
this study include high levels of building energy efficiency, including building shell improvements and
deep energy efficiency retrofits, as well as reductions in vehicle miles traveled. All the scenarios
evaluated here include nearly complete electrification of the transportation sector as well as high levels
of renewable and low-carbon electricity. In addition, all scenarios assume the same level of reductions in
non-combustion GHGs. However, the scenarios differ in their levels of biofuels, renewable hydrogen,
and in building and industrial electrification levels.
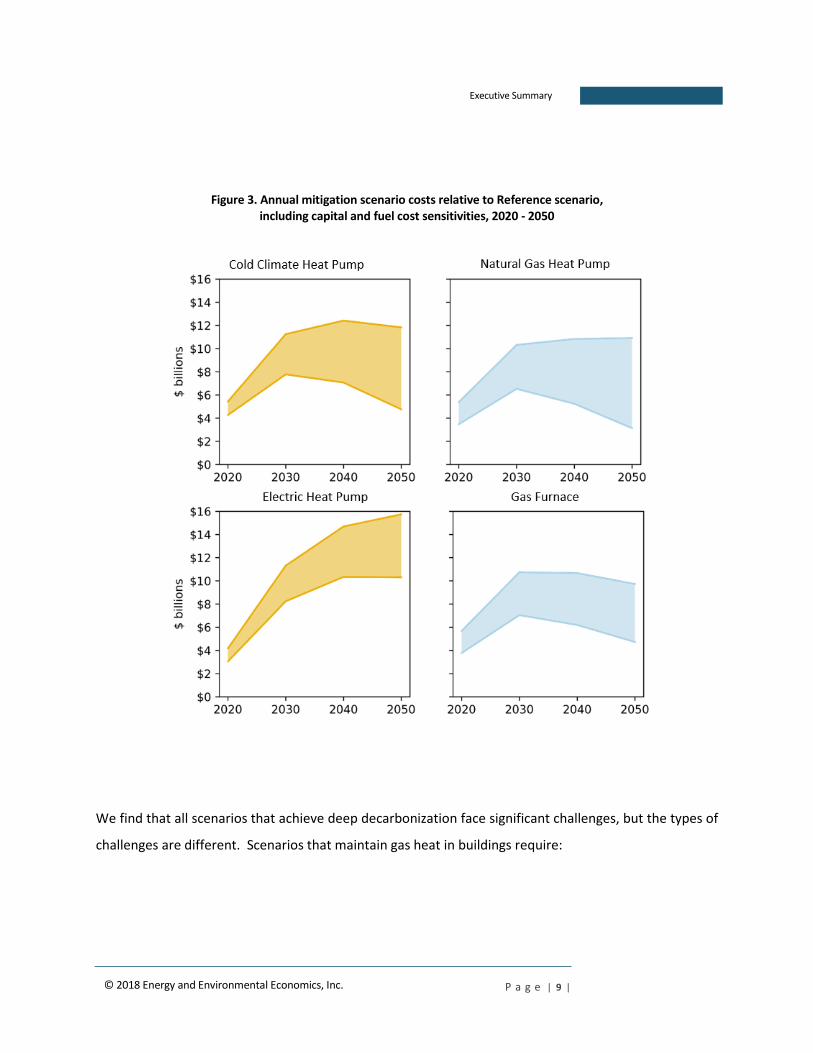
Total economy-wide scenario costs in 2050, relative to a reference or business-as-usual future, are
similar between scenarios with one exception: the conventional (non-cold climate) electric heat pump
scenario is most expensive, due to the high cost of serving winter peak demand (Figure 3). Overall, total

Pacific Northwest Pathways to 2050
P a g e | 8 |
scenario costs represent less than 1 percent of regional projected Gross Domestic Product (GDP). The
average scenario costs range from $40/ton to $190/ton CO2e in 2050 (in real 2017 dollars), relative to
the Reference scenario depending on the future capital costs and fuel prices assumed. The average cost
per ton metric means that some measures are far less expensive than this, while other measures are
more expensive. This range reflects the wide range of uncertainties in projecting future scenario costs.
Overall, these average GHG abatements costs ($40/ton to $190/ton CO2e) are generally lower than the
most recent estimates of the global social cost of carbon, which has a median cost of $417/ton CO2, (and
ranges from $177 to $805/ton CO2). 3 The global social cost of carbon represents the expected economic
damages to be incurred by climate change, per ton of CO2 emitted.
3 Ricke, K., L. Drouet, K. Caldeira, M. Tavoni, “Country-level social cost of carbon,” Nature Climate Change, Vol. 8, October 2018 895-900. Available at: https://www.nature.com/articles/s41558-018-0282-y.pdf
P a g e | 9 |
Executive Summary
© 2018 Energy and Environmental Economics, Inc.
Figure 3. Annual mitigation scenario costs relative to Reference scenario, including capital and fuel cost sensitivities, 2020 - 2050
We find that all scenarios that achieve deep decarbonization face significant challenges, but the types of
challenges are different. Scenarios that maintain gas heat in buildings require:

Pacific Northwest Pathways to 2050
P a g e | 10 |
Reducing the carbon intensity of natural gas use in buildings by blending in low-carbon
alternatives, including up to 30% carbon-neutral renewable natural gas and hydrogen. While
all of the scenarios evaluated here rely on carbon-neutral biofuels to meet the 2050 GHG goal,
the use of renewable natural gas is of higher importance in the scenarios that maintain gas in
buildings. Renewably-produced hydrogen or synthetic methane blended in the gas pipeline are
also options to displace fossil natural gas.
High levels of energy efficiency in buildings, potentially with higher efficiency natural gas-
powered heat pumps.
Additional reductions in other sectors to offset higher emissions in the building sector. In
these scenarios, additional reductions are achieved primarily through 30 percent of industrial
sector energy switching to electricity.
The scenarios that switch to electric heat in buildings require:
Rapid consumer adoption of electric heating technologies, including retrofits of existing
buildings and broader commercialization and market transformation of cold-climate heat
pump technologies. Conventional electric heat pump technologies are designed to maximize
comfort and annual savings for the building occupants. This means that they require
supplemental heat, typically electric resistance heat, during cold temperatures. At high levels of
adoption, these heat pumps will place significant demands on the electric grid. In a high building
electrification future, greater attention to heat pump installation practices and standards would
be needed to mitigate the impact on the electricity system of meeting increased winter peak
heat demands. Cold-climate electric heat pumps perform better during cold snaps than heat
pumps not designed for cold climates, but they are less common today and have higher upfront
costs. Absent other load management strategies, cold climate heat pumps do not eliminate the
need for new winter peak electric generation and delivery capacity in a high building
electrification future in the Pacific Northwest.
Significant new investments to address winter peak demand from electric space heating,
including an expansion of the electricity system in the form of upgraded distribution systems as
well as winter peak capacity resources. In the scenarios that transition to electric heat in

P a g e | 11 |
Executive Summary
© 2018 Energy and Environmental Economics, Inc.
buildings, the widespread deployment of electric heat pumps leads to a five- to 10-fold increase
in the incremental natural gas generation capacity build by 2050, relative to the Direct Use of
Natural Gas Scenarios. This is equivalent to an additional 17,000 to 37,000 megawatts (MW) of
additional peaking capacity need by 2050. Some of this winter peaking, gas-fired electric
generation need could be displaced by energy storage, demand response, or technology
innovation. But the cost of using batteries and other forms of electricity storage to meet winter
peak heating needs is still unclear. For comparison, the entire hydroelectric system in the Pacific
Northwest represents approximately 33,000 MW of installed capacity (Figure 4). Ensuring winter
peak reliability will be a key planning challenge to address if building heating needs are
increasingly electrified.
Figure 4. 2050 new firm natural gas generation capacity build by scenario, compared to existing regional hydroelectric capacity (gigawatts)
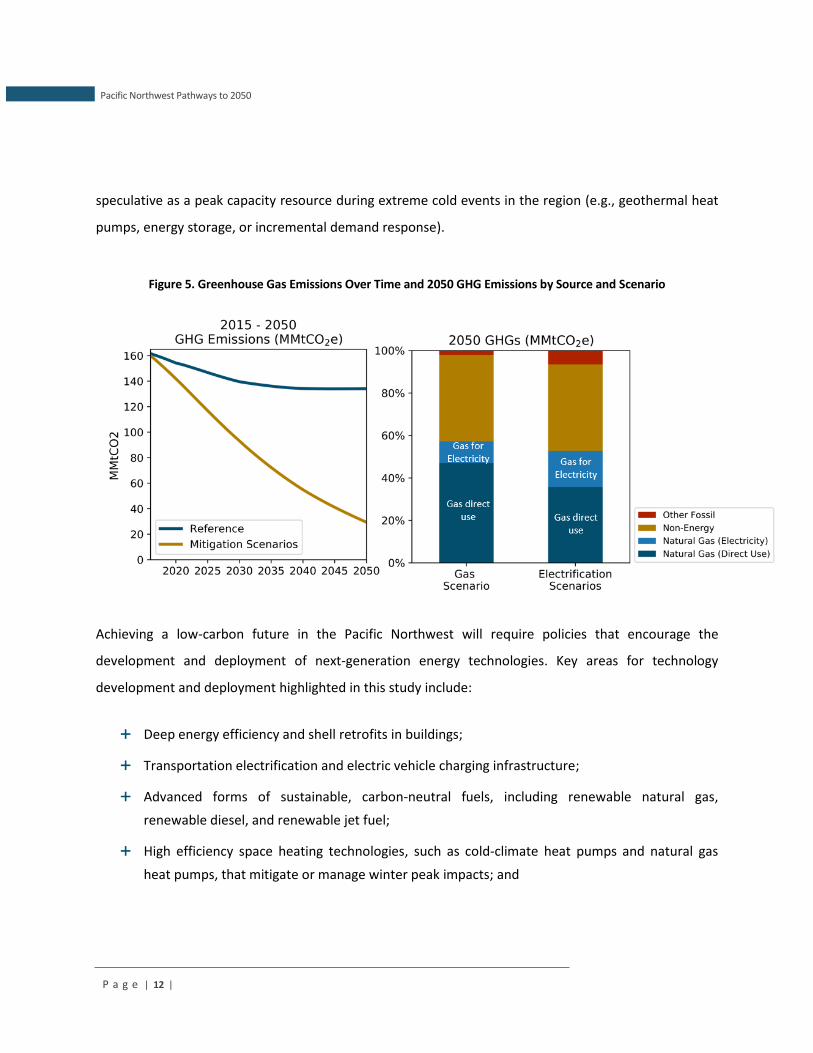
In all of the decarbonization pathways considered here, a combination of fossil and renewable natural
gas, whether used in homes or in power plants, continues to serve winter peak heating needs in the
Pacific Northwest (Figure 5). This study does not include an exhaustive investigation of alternative
options to meeting peak heat demands. Potential alternative options are higher cost or more
Pacific Northwest Pathways to 2050
P a g e | 12 |
speculative as a peak capacity resource during extreme cold events in the region (e.g., geothermal heat
pumps, energy storage, or incremental demand response).
Figure 5. Greenhouse Gas Emissions Over Time and 2050 GHG Emissions by Source and Scenario
Achieving a low-carbon future in the Pacific Northwest will require policies that encourage the
development and deployment of next-generation energy technologies. Key areas for technology
development and deployment highlighted in this study include:
Deep energy efficiency and shell retrofits in buildings;
Transportation electrification and electric vehicle charging infrastructure;
Advanced forms of sustainable, carbon-neutral fuels, including renewable natural gas,
renewable diesel, and renewable jet fuel;
High efficiency space heating technologies, such as cold-climate heat pumps and natural gas
heat pumps, that mitigate or manage winter peak impacts; and

P a g e | 13 |
Executive Summary
© 2018 Energy and Environmental Economics, Inc.
Industrial sector GHG mitigation options, including energy efficiency, electrification, and fuel-
switching, as well as renewably produced hydrogen.
Many pathways exist to achieving decarbonization in the Pacific Northwest. The challenge lies in the
development and sustained deployment of the advanced technologies needed to transform the region’s
energy economy over the next two to three decades.