pacific marine climate change report card pp effects of ... · pacific marine climate change report...
TRANSCRIPT

PACIFIC MARINE CLIMATE CHANGE REPORT CARD Science Review 2018: pp 50-73
Effects of Climate Change on Extreme Events Relevant to the Pacific Islands
Penehuro F. Lafale, Howard J. Diamond, Cheryl L. Anderson: LeA International; Joint Centre for Disaster Research (JCDR), Massey University; Victoria University of Wellington.
EXECUTIVE SUMMARY
Pacific Island Commonwealth Member States (Pacific CMSs) are highly vulnerable to climate change (high confidence; robust evidence, high agreement). Impacts of climate change on extreme events relevant to Pacific CMSs vary, dependent on the magnitude, frequency, and temporal and spatial extent of the event, as well as on the biophysical nature of the island and its social, economic, and political setting (high confidence).
Current and future climate-related drivers of risk for Pacific CMSs include tropical cyclones (TCs), sea level rise (SLR), increasing air and sea surface temperatures, and changing rainfall patterns (high confidence; robust evidence, high agreement). This IPCC finding has been reaffirmed by this analysis.
It is widely accepted that climate change may be perceived most through the impacts of extremes, although these are to a large degree dependent not only on the extremes themselves, but also on the sector or system under consideration, including its exposure and vulnerability (high confidence, robust evidence, high agreement).
In the last 30 years (1988 to 2017), Vanuatu experienced 72 tropical cyclones (TCs) that came within 400km of the main centres of Vanuatu, followed by 55 in Fiji, 54 in Tonga, 50 in Samoa, 43 in the Solomon Islands, 32 in Tuvalu, 24 in Papua New Guinea, three in Kiribati, and one in Nauru. The number of TCs are projected to decline (medium confidence). The average maximum intensity of TCs is likely to increase (low confidence). Sea levels will continue to rise (very high confidence).
El Niño and La Niña events will continue to occur (very high confidence) but there is little consensus on whether these events will change in intensity or frequency.
Annual mean and extremely high daily temperatures will continue to rise (very high confidence). Little or no change for annual rainfall is projected in Fiji, Samoa, Tonga, Tuvalu and Vanuatu, while mean rainfall is projected to increase (high confidence).
Mean rainfall is projected to increase along with more extreme rain events for Kiribati, Nauru, PNG, Solomon Islands and Vanuatu (high-medium-low confidence). The frequency of drought events is projected to decrease slightly, decline or remain the same (low confidence).

51
Context
Pacific CMSs are highly vulnerable to climate change, especially to extreme events. Recent incidence of extreme events such as tropical cyclones in the region has led to increasing concern that extreme events may be changing in frequency and intensity as a result of human influences on climate (Meehl et al., 2007). These extremes, interacting with exposed and vulnerable human and natural systems can lead to disasters (IPCC, 2012). It is widely accepted that climate change may be perceived most through the impacts of extremes, although these are to a large degree dependent, not only on the extremes themselves, but also on the system under consideration, including its exposure and vulnerability.
Climate extremes, exposure, and vulnerability are also influenced by a range of factors, including geophysical characteristics, anthropogenic climate change, natural climate variability and socio-economic development. This paper assesses the impacts of climate change on extreme events on nine Pacific CMSs – Fiji, Kiribati, Nauru, Papua New Guinea, Samoa, Solomon Islands, Tonga, Tuvalu, and Vanuatu. The assessment is based on long-term observation series of the large-scale features that influence the climate and weather of Pacific CMSs, summarized in Table 1.
Extreme events have already impacted water, fisheries, agriculture, energy, health, ecosystems, economy and finance, infrastructure, waste water and solid waste, human settlements and society, and culture of Pacific CMSs. These same sectors are projected to be further impacted by climate change and extremes in the future.
Pacific CMSs do not have uniform climate change risk profiles (high confidence, robust evidence, high agreement). Rather, their high diversity in both physical and human attributes and their response to climate-related drivers means that climate change mitigation, impacts, vulnerability, and adaptation will be variable from one island to another. This diversity must be adequately integrated in climate change and sustainable development planning.
Key priority areas and gaps that are under-represented in monitoring and researching the impacts of extremes and climate change on Pacific CMSs are:
• Restoring and strengthening the deteriorating state of earth observing and monitoring systems (weather, climate, water, ocean, etc.) in the Pacific CMSs region. This is to ensure the observations (data) required to produce climate, weather, hydrological, oceanic information and products (e.g. early warnings (severe weather and non-TCs storms, TCs), marine and aviation forecasts, climate outlooks, climate change scenarios, etc.) are readily available, sustainable and conform to international standards. Regional components of international monitoring programs such as the Global Observing System (GOS), Global Climate Observing System (GCOS), Global Ocean Observing System (GOOS), Global Earth Observing System (GEO) and the World Hydrological Observing System (WHYCOS) should be supported.
• Research on oceans-climate nexus. Examples include expanding knowledge on:
o the role of natural coastal ecosystems (such as coral reefs and mangroves) in providing natural defences against inundation associated with storm surges, high tides, SLR, ocean acidification, and related non-climate factors such as coastal infrastructure development and land-based sources of marine pollution;
o key climate-ocean features (e.g. SPCZ, ENSO, IPO, extreme cyclone wave climate, etc.) driving changes in micro-climates, weather and extremes of Pacific CMSs.;
o Common metrics (e.g. a ratio of climate signal noise (S/N) – a measure of amplitude of change expressed in terms of units of existing variability) for understanding future climate change in the context of past-experience, as proposed by Frame et al., 2017).
• Expanding knowledge on building and enhancing local adaptive and resilient capacity of Pacific CMSs to extremes, climate change and related risks.

52
Changes in extremes are assessed at a range of temporal and spatial scales. To span this entire range, data are required at a daily (or shorter) time scale. However, the availability of observational data restricts the types of extremes that can be analysed. The rarer the event, the more difficult it is to identify long-term changes, simply because there are fewer cases to evaluate (IPCC, 2013). Identification of changes in extremes is also dependent on the analysis technique employed (Meehl et al., 2007). Table 1. Key climate features that influence the weather and climate of Pacific CMS.
Pacific CMS Main Climate features
Fiji South Pacific Convergence Zone (SPCZ), El Niño Southern Oscillation (ENSO), Trade Winds (TWs), Sub-tropical Highs (STH), Madden-Julian Oscillation (MJO), Pacific Decadal Oscillation (PDO), Anthropogenic climate change (ACC)
Kiribati SPCZ, ENSO, TWs, PDO, ACC, Inter-Tropical Convergence Zone (ITCZ)
Nauru SPCZ, ENSO, TWs, PDO, ACC, ITCZ, West Pacific Monsoon (WPM)
PNG ENSO, ITCZ, PDO, ACC, WPM
Samoa SPCZ, SPCZ, TWs, STH, MJO, PDO, ACC
Solomon Islands
SPCZ, ENSO, MJO, PDO, ACC, WPM
Tonga SPCZ, ENSO, TWs, STH, MJO, PDO, ACC
Tuvalu SPCZ, ENSO. TWs, MJO, PDO, ACC, WPM
Vanuatu SPCZ, ENSO, TWs, STH, MJO, PDO, ACC
Sources: Mimura et al., 2007; PASSAP, 2014.
To avoid excessive statistical limitations, trend analyses of extremes have traditionally focused on standard and robust statistics that describe moderate extremes. In percentile terms, these events occur between 1 and 10% of the time at a particular location, in a particular reference period. Observational evidence for changes in extremes is assessed for changes in temperatures, rainfall, ENSO, tropical and extratropical cyclones, sea levels, and wave heights, where most scientific analysis progress has been made since the 1980s (IPCC, 2007; Nurse et al., 2013; Diamond, et al., 2013; PASSAP, 2014; Diamond, 2017). More attention was given to tropical cyclones as they are considered the most significant extreme events in the tropical Southwest Pacific, and associated with heavy rains, fierce winds, high storm surge, and large waves for all the nine Pacific CMSs (Diamond et al., 2012; Nurse et al, 2013; Diamond, 2013; Diamond, 2016; Diamond, 2017). The WMO Tropical Cyclone Operational Plan for the South Pacific and South East Indian Ocean (2006 Edition)
1 http://www.wmo.int/pages/prog/www/tcp/documents/TCP-24-OP-PLN-2006-edition-english.pdf 2 Note, the US National Weather Service uses a maximum 1-minute average
windspeed in their system. Additionally, American Samoa and other U.S.
technical definition of a tropical cyclone (WMO/TD-No.292, Report No. TCP-24, 2006)1 is:
“A non-frontal low-pressure system of synoptic scale developing over warm waters and having a definite organized wind circulation with a maximum 10-minute average wind speed2 of 34 knots (63km per hour, i.e. gale force) or greater near the center.”
In practice, that circulation refers to a closed, clockwise in the Southern Hemisphere (counterclockwise in the Northern Hemisphere) airflow at the earth’s surface. Meteorologists generally recognize three classes of TCs stratified by their highest 10-minute average (1-minute average in the US system) surface wind speed. For simplicity purposes, this paper uses the Australian Tropical Cyclone intensity scale (Maximum Sustained Wind speed) summarized in Table 2. Table 2. Australian Tropical Cyclone Intensity Scale (Maximum Sustained Wind Speed).
Tropical Cyclone Intensity Classification
Wind Speed Range (knots)
Wind Speed Range (km/h)
Tropical Depression/Storm
Less than 34 Less than 63
Category 1 34-47 63-87
Category 2 48-64 88-119
Category 3 65-85 120-158
Category 4 86-106 159-196
Category 5 Greater than 106
Greater than 196
Source: Australian Bureau of Meteorology, http://www.bom.gov.au/cyclone/about/intensity.shtml
Tropical Cyclone Data The formal TCs season in the South West Pacific spans the period from 1-November to 30-April; and a season from November 2016 to April 2017 would be noted as the 2017 (or 2016/17) season. The period of record selected was from 1988 to 2017. This is the most reliable period of record given that the satellite data era began with the 1969/70 season (Holland, 1981). The TCs data used were from the South Pacific Enhanced Archive of Tropical Cyclones (SPEArTC3; Diamond et al., 2012) and are based largely on the International Best Tracks Archive for Climate Stewardship (IBTrACS4; Knapp et al. 2010).
affiliated Pacific Islands and Territories also use the 1-minute average period. The rest of the Pacific Islands, Australia and New Zealand, use the standard WMO 10-minute averaging period.
3 See http://apdrc.soest.hawaii.edu/projects/speartc/
4 See https://www.ncdc.noaa.gov/ibtracs/
53
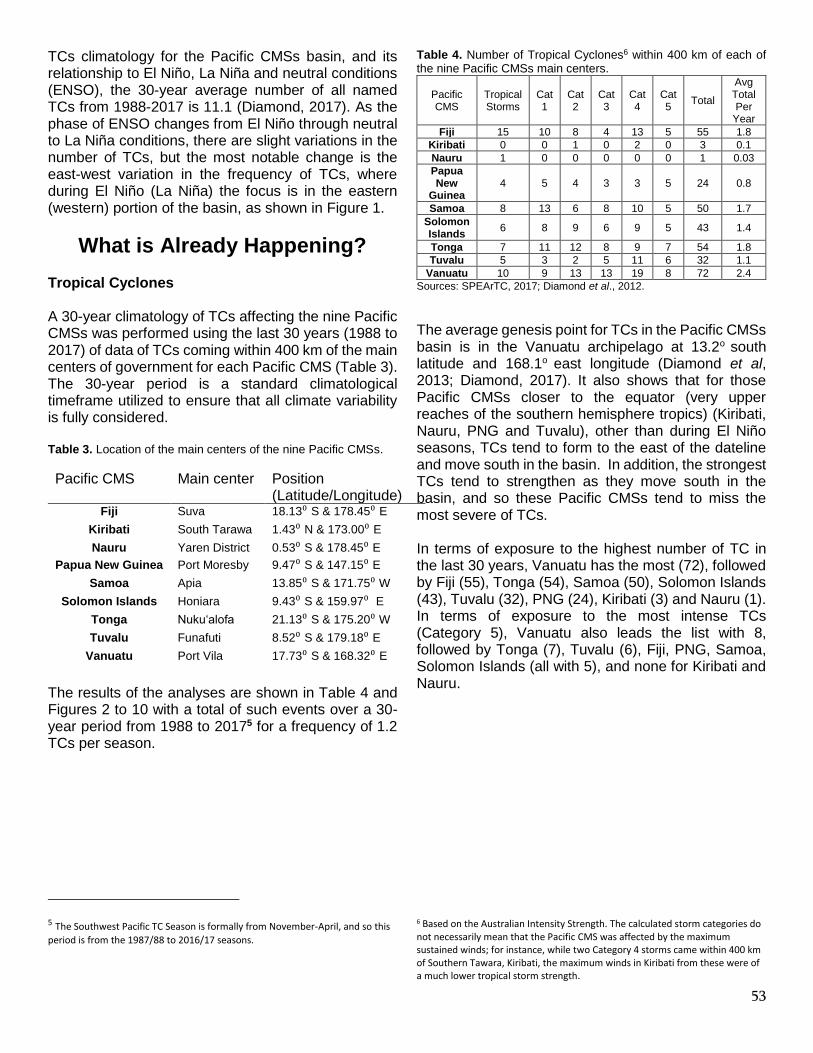
TCs climatology for the Pacific CMSs basin, and its relationship to El Niño, La Niña and neutral conditions (ENSO), the 30-year average number of all named TCs from 1988-2017 is 11.1 (Diamond, 2017). As the phase of ENSO changes from El Niño through neutral to La Niña conditions, there are slight variations in the number of TCs, but the most notable change is the east-west variation in the frequency of TCs, where during El Niño (La Niña) the focus is in the eastern (western) portion of the basin, as shown in Figure 1.
What is Already Happening? Tropical Cyclones A 30-year climatology of TCs affecting the nine Pacific CMSs was performed using the last 30 years (1988 to 2017) of data of TCs coming within 400 km of the main centers of government for each Pacific CMS (Table 3). The 30-year period is a standard climatological timeframe utilized to ensure that all climate variability is fully considered. Table 3. Location of the main centers of the nine Pacific CMSs.
Pacific CMS Main center Position (Latitude/Longitude)
Fiji Suva 18.13⁰ S & 178.45⁰ E
Kiribati South Tarawa 1.43⁰ N & 173.00⁰ E
Nauru Yaren District 0.53⁰ S & 178.45⁰ E
Papua New Guinea Port Moresby 9.47⁰ S & 147.15⁰ E
Samoa Apia 13.85⁰ S & 171.75⁰ W
Solomon Islands Honiara 9.43⁰ S & 159.97⁰ E
Tonga Nukuʻalofa 21.13⁰ S & 175.20⁰ W
Tuvalu Funafuti 8.52⁰ S & 179.18⁰ E
Vanuatu Port Vila 17.73⁰ S & 168.32⁰ E
The results of the analyses are shown in Table 4 and Figures 2 to 10 with a total of such events over a 30-year period from 1988 to 20175 for a frequency of 1.2 TCs per season.
5 The Southwest Pacific TC Season is formally from November-April, and so this
period is from the 1987/88 to 2016/17 seasons.
Table 4. Number of Tropical Cyclones6 within 400 km of each of the nine Pacific CMSs main centers.
Pacific CMS
Tropical Storms
Cat 1
Cat 2
Cat 3
Cat 4
Cat 5
Total
Avg Total Per
Year
Fiji 15 10 8 4 13 5 55 1.8
Kiribati 0 0 1 0 2 0 3 0.1
Nauru 1 0 0 0 0 0 1 0.03
Papua New
Guinea 4 5 4 3 3 5 24 0.8
Samoa 8 13 6 8 10 5 50 1.7
Solomon Islands
6 8 9 6 9 5 43 1.4
Tonga 7 11 12 8 9 7 54 1.8
Tuvalu 5 3 2 5 11 6 32 1.1
Vanuatu 10 9 13 13 19 8 72 2.4
Sources: SPEArTC, 2017; Diamond et al., 2012.
The average genesis point for TCs in the Pacific CMSs basin is in the Vanuatu archipelago at 13.2o south latitude and 168.1o east longitude (Diamond et al, 2013; Diamond, 2017). It also shows that for those Pacific CMSs closer to the equator (very upper reaches of the southern hemisphere tropics) (Kiribati, Nauru, PNG and Tuvalu), other than during El Niño seasons, TCs tend to form to the east of the dateline and move south in the basin. In addition, the strongest TCs tend to strengthen as they move south in the basin, and so these Pacific CMSs tend to miss the most severe of TCs. In terms of exposure to the highest number of TC in the last 30 years, Vanuatu has the most (72), followed by Fiji (55), Tonga (54), Samoa (50), Solomon Islands (43), Tuvalu (32), PNG (24), Kiribati (3) and Nauru (1). In terms of exposure to the most intense TCs (Category 5), Vanuatu also leads the list with 8, followed by Tonga (7), Tuvalu (6), Fiji, PNG, Samoa, Solomon Islands (all with 5), and none for Kiribati and Nauru.
6 Based on the Australian Intensity Strength. The calculated storm categories do not necessarily mean that the Pacific CMS was affected by the maximum sustained winds; for instance, while two Category 4 storms came within 400 km of Southern Tawara, Kiribati, the maximum winds in Kiribati from these were of a much lower tropical storm strength.

54
Figure 1. (a) Frequency of TCs from 1988-2017; (b) Frequency anomalies during El Niño seasons; and (c) Frequency anomalies during
La Niña Seasons.

55
Fig. 2. 1988-2017 TCs Plotted on Australian Intensity Scale within 400km of Fiji (Grey circle).
Fig. 3. 1988-2017 TCs Plotted on Australian Intensity Scale within 400 km of Kiribati.

56
Fig. 4. 1988-2017 TCs Plotted on Australian Intensity Scale within 400 km of Nauru.
Fig. 5. 1988-2017 TCS Plotted on Australian Intensity Scale within 400 km of Papua New Guinea.

57
Fig. 6. 1988-2017 TCS Plotted on Australian Intensity Scale within 400 km of Samoa.
Fig. 7. 1988-2017 TCS Plotted on Australian Intensity Scale within 400 km of Solomon Islands.

58
Fig. 8. 1988-2017 TCS Plotted on Australian Intensity Scale within 400 km of Tonga.
Fig. 9. 1988-2017 TCS Plotted on Australian Intensity Scale within 400 km of Tuvalu.

59
Fig. 10. 1988-2017 TCS Plotted on Australian Intensity Scale within 400 km of Vanuatu. All Extremes Table 5 summarizes the climatology analyses for all extremes from the Pacific-Australia Climate Change Science and Adaptation Planning Program (PASSAP) studies (PASSAP, 2014). Table 5. Climatology analyses for all extremes impacting Pacific CMSs
Pacific CMS Current Climate
Fiji Temperature: Annual and half-year maximum and minimum temperatures have been increasing at both Suva and Nadi Airports (reference stations) since 1942, with trends significant at the 5% level in all cases except for Nadi Airport November–April maximum temperature. Minimum air temperature trends are greater than maximum air temperature trends. Cool Days and Cool Nights: The annual numbers of cool days and cool nights have decreased, and warm nights have increased at both reference stations. Warm days have increased at Suva. These temperature trends are consistent with global warming. Rainfall: Annual, half-year and extreme daily rainfall trends show little change at the reference stations since 1942. Tropical Storms: Tropical cyclones affect Fiji mainly between November and April, and occasionally in October and May during El Niño years. An average of 28 cyclones per decade developed within or crossed Fiji’s Exclusive Economic Zone (EEZ) between the 1969/70 and 2010/11 seasons. Twenty-five out of 78 (32%) tropical cyclones between the 1981/82 and 2010/11 seasons became severe events (Category 3 or stronger) in Fiji’s EEZ. Wind-waves7: Wind-waves around Fiji are typically not large, with wave heights around 1.3m year-round. Seasonally, waves are influenced by the trade winds, location of the South Pacific Convergence Zone (SPCZ), southern storms and cyclones, and display little variability on interannually time scales with the ENSO and Southern Annular Mode (SAM).
7For all nine Pacific CMSs, available data were not suitable for assessing long-term wind-wave trends.

60
Kiribati Temperature: Warming trends are evident in both annual and half-year mean air temperatures at Tarawa from 1950. Rainfall: At Kiritimati, in eastern Kiribati, there has been an increase in November–April rainfall since 1946. This implies either a shift in the mean location of the Intertropical Convergence Zone (ITCZ) towards Kiritimati and/or a change in the intensity of rainfall associated with the ITCZ. The remaining annual and seasonal rainfall trends for Kiritimati and Tarawa and the extreme rainfall trends for Tarawa show slight change. Wind-waves: Wind-waves in Kiribati are strongly influenced by both north-easterly and south-easterly trade winds seasonally, and the location of the SPCZ, with some effect of the ENSO interannually. There is minor variation in wave climate across the country.
Nauru Temperature: Over the past half century it is likely that there has been a warming air temperature trend at Nauru which is partly associated with warming ocean temperatures. Rainfall: Annual and half-year rainfall trends from 1927 show slight change at Nauru. Wind-waves: Variability of wind-waves is characterized by trade winds seasonally, and the ENSO interannually.
PNG Temperature: Annual and half-year air temperatures at Port Moresby and Kavieng (reference stations) have been warming since 1943 and 1962 respectively. Minimum air temperature trends are stronger than maximum air temperature trends. Warm temperature extremes have increased, and cool temperature extremes have decreased at both stations. All temperature trends are consistent with global warming. Rainfall: At Kavieng, there has been a decrease in the number of days with rainfall since 1957. The remaining annual, half-year and extreme rainfall trends show slight change at Kavieng and Port Moresby. Tropical cyclones affect the Southern Hemisphere portion of Papua New Guinea, mainly between November and April. An average of 15 TCs per decade developed within or crossed Papua New Guinea’s EEZ between the 1969/70 and 2010/11 seasons. Eleven of the 43 tropical cyclones (26%) between the 1981/82 and 2010/11 seasons were severe events (Category 3 or stronger) in the Papua New Guinea EEZ. Wind-waves around Papua New Guinea are typically not large, with markedly different behavior on the north and south coasts. Waves are seasonally influenced by the trade winds, the WPM and location of the ITCZ, and display variability on interannual time scales with the ENSO.
Samoa Temperature: Mean air temperature trends show slight change at Mulinuu, Apia (reference station) since 1957 and the annual number of cool days has decreased. Rainfall: Annual and May–October rainfall has increased at Apia since 1890. This is most likely due to a shift in the mean location of the SPCZ towards Samoa and/or there being a change in the intensity of rainfall associated with the SPCZ over the 122-year period. There has been slight change in November–April rainfall since 1890 and extreme daily rainfall since 1961. Tropical cyclones affect Samoa mainly between the months of November and April. An average of six cyclones per decade developed within or crossed Samoa’s EEZ between the 1969/70 to 2010/11 seasons. Five of the 21 TCs (24%) between the 1981/82 and 2010/11 seasons were severe events (Category 3 or stronger) in the Samoa EEZ. Wind-waves: Variability of wind-waves at Samoa is characterized by trade winds and location of the SPCZ seasonally, and the ENSO.
Solomon Islands Temperature: Annual and half-year minimum temperatures have been increasing at Honiara since 1953 and Munda since 1962 (reference stations). Minimum temperature trends are generally stronger than maximum temperature trends. There have been significant increases in warm nights and decreases in cool nights at Honiara and Munda. Cool days have decreased at Munda. These trends are consistent with global warming. Rainfall: Annual and half-year rainfall trends show slight change at Honiara since 1950 and Munda since 1962. At Honiara, there is a decreasing trend in the number of rain days since 1955 and at Munda there is an increasing trend in annual maximum 1-day rainfall since 1962. Tropical cyclones affect Solomon Islands mainly between November and April. An average of 29 cyclones per decade developed within or crossed the Solomon Islands’ EEZ between the 1969/70 to 2010/11 seasons. Tropical cyclones were most frequent in El Niño years (39 cyclones per decade) and least frequent in La Niña and neutral years (21 cyclones per decade). Twenty-two of the 82 TCs (27%) between the 1981/82 and 2010/11 seasons were severe events (Category 3 or stronger) in the Solomon Islands EEZ. Fifteen of the 22 intense events occurred in seasons when an El Niño was present.

61
Wind-waves around the Solomon Islands vary across the country, being small at Honiara, while at the outlying islands such as Santa Cruz waves are much larger. Seasonally, waves are influenced by the trade winds and the WPM, and display variability on interannual time scales with the ENSO.
Tonga Temperature: Annual and November–April mean temperatures have increased at Nuku’alofa (reference station) since 1949. Trends in Nuku’alofa annual maximum temperature and November– April maximum and minimum temperature are also positive. This is consistent with global warming. Rainfall: Annual and half-year rainfall trends show slight change at Nuku’alofa and Lupepau’u except for Lupepau’u May–October rainfall which has increased since 1947. Extreme daily rainfall trends show slight change at Nuku’alofa since 1971 and Lupepau’u since 1947. Tropical cyclones affect Tonga mainly between November and April. An average of 20 TCs per decade developed within or crossed Tonga’s EEZ between the 1969/70 to 2010/11 seasons. Nineteen of the 55 TCs (35%) between the 1981/82 and 2010/11 seasons were severe events (Category 3 or stronger) in the Tonga EEZ. Wind-waves around Tonga do not vary substantially in height throughout the year. Seasonally, waves are influenced by the trade winds and tropical storms, and display variability on interannual time scales with the ENSO.
Tuvalu Temperature: Annual and May–October mean and maximum air temperatures at Funafuti (reference station) have increased since 1933. The frequency of night-time cool temperature extremes has decreased, while and warm temperature day-time extremes have increased. These trends are consistent with climate change projections as noted by the IPCC. Rainfall: Annual and half-year rainfall trends show slight change at Funafuti since 1927. There has also been slight change in extreme daily rainfall since 1961. Tropical cyclones affect Tuvalu mainly between November and April. An average of 8 cyclones per decade developed within or crossed Tuvalu’s EEZ between the 1969/70 to 2010/11 seasons. Tropical cyclones were most frequent in El Niño years (12 cyclones per decade) and least frequent in La Niña years (3 cyclones per decade). Only three of the 24 tropical cyclones (13%) between the 1981/82 and 2010/11 seasons were severe events (Category 3 or stronger) in the Tuvalu EEZ. Wind-waves around Tuvalu do not vary significantly in height during the year. Seasonally, waves are influenced by the trade winds, extra-tropical storms and cyclones, and display variability on interannual time-scales with the El Niño– Southern Oscillation (ENSO) and the strength and location of the South Pacific Convergence Zone (SPCZ).
Vanuatu Temperatures in the warmest months in Vanuatu (January-February) are about 4°C higher than those in the coolest months (July-August). Warming trends are evident in both annual and seasonal mean air temperatures for Bauerfield Airport (Port Vila) (reference station) for the period 1950–2009. Rainfall: Vanuatu has a marked wet season from November to April. Vanuatu’s rainfall is strongly influenced by the position and strength of the SPCZ. During summer, the SPCZ intensifies and moves further south, bringing the higher rainfall of the wet season. Rainfall in Vanuatu varies greatly from year-to-year due mainly to the influence of the ENSO. Annual and seasonal rainfall trends for Port Vila and Aneityum for the period 1950–2009 are not statistically significant. The sea-level rise near Vanuatu measured by satellite altimeters since 1993 is about 6mm per year. Tropical cyclones: On average Port Vila experiences 23 TCs per decade, with most occurring in January and February. The high interannual variability in tropical cyclone numbers makes it difficult to identify any long-term trends in frequency.
It is worth noting that from all the scientific assessments to date, the most dominant climate feature controlling most of the Pacific CMSs micro-climates is the SPCZ which in turn, is strongly controlled by ENSO. Recent modelling by Stephens and Ramsay (2014) found the extreme cyclone wave is sensitive to ENSO but insensitive to changes in TC intensity and occurrence. Observed Impacts Extremes have already impacted water, fisheries, agriculture, energy, health, ecosystems, economy and finance, infrastructure, waste water and solid waste, human settlements and society, and culture sectors of Pacific CMSs, highlighted in Table 6.

62
Table 6. Observed impacts of climate change and extremes on Pacific CMSs’ sectors and systems.
Sector/ System
Impacts
Extreme events Recent events show an increase in weather, such as tropical storms, cyclones, droughts, floods, and heat waves (ADB 2013). Tropical cyclones are reportedly the most damaging peril in terms of economic loss, while earthquakes are close behind. Together, all disasters (cyclones, earthquakes and others) caused at least 7.9 billion US dollars in economic losses (trended to 2009). To put this in perspective, the total GDP for all 15 Pacific Island Countries in 2009 was about 14 billion US dollars. Economic losses from 100-year natural hazard event (e.g. cyclones) for selected Pacific CMSs (2011 data) are as follows; Fiji US$844.8 (28.1 % GDP), Kiribati US$4.0 (2.6% GDP), Nauru 0 (0), PNG US$794.9 (8.4), Samoa US$152.9 (27% GDP), Solomon Islands US$280.6 (41.4%), Tonga US$225.3 (63%), Tuvalu US$4.8 (15.1%GDP), Vanuatu US$370.1 (50.8% GDP) (Source: World Bank, 2017).
Water Freshwater supplies are already limited on small islands, and there are even greater threats with SLR and extreme events that result in freshwater lens shifts (ADB 2013). Drinking water availability diminished with higher salinity in groundwater and less precipitation to fill water catchment tanks (ADB, 2013; Anderson et al., 2015). Costly alternatives, such as desalination units and water delivery to remote areas. Fire suppression efforts weakened in small islands (ADB 2013; Leong et al., 2014).
Fisheries Near-shore areas affected by coral bleaching, degradation; Pelagic fisheries shift with warming waters; Changes in size and composition of catch; and decline of fisheries resources (ADB 2013; Hamnett and Anderson, 2000; Lehodey et al., 2014; Johnson and Welch, 2009).
Agriculture Loss of land and freshwater (ADB 2013). Increased salinity in the soil (Leong et al., 2014; Nurse et al., 2014). Threatened food security from droughts, extreme events, sea level rise, coastal inundation, changing soil salinity, and reliance on imported foods, resulting in the loss of important nutritional sources (Nurse et al., 2014; Anderson et al., 2015; Leong et al., 2014). Cultural impacts related to loss of taro or other key food staples and ceremonial foods (Anderson et al., 2009; Anderson et al., 2015). Greater dependence on imported, processed foods (ADB, 2013; World Bank, 2014; Leong et al., 2014). Divisions of labour (by gender and diversity) related to agriculture are differentially impacted by extreme events (Anderson et al., 2009; Anderson et al., 2015).
Energy Reduced access for fossil fuels to poorer in society (Anderson et al. 2015; World Bank 2017; ADB 2013). Differential energy needs, based on gender, age, socioeconomic status, and diversity, with more impact on marginalized communities (Anderson et al. 2015). Shift to renewable energy (solar) through large investments and need to ensure maintenance and capacity building (ADB 2013; World Bank 2014; Lefale, Faiva, and Anderson 2017b; Nurse et al. 2014). Reliance on imported fuel for aviation and boats necessary for transportation in countries and in regional/international meetings (Anderson 2009; Nurse et al. 2014). Divisions of labour (by gender and diversity) related to energy use and access are differentially impacted by extreme events (Anderson et al., 2009; Anderson et al., 2015).
Health Health impacts include: waterborne diseases; dengue, malaria, and mosquito vector-borne diseases; respiratory illness; leptospirosis; morbidity and mortality from extreme weather events; inadequate nutrition and lack of fresh drinking water; deterioration of hygiene and sanitation, which may be particularly difficult for women of child-bearing age; ciguatera fish poisoning (ADB, 2013; Nurse et al., 2014; Leong et al., 2014; Anderson et al., 2015).
Ecosystems Coral reefs, which provide habitat and sources of subsistence, dissipate wave energy, protect islands from erosion, and underpin island tourism (Nurse et al., 2014), are

63
threatened from bleaching events, acidification, and storms (Nurse et al., 2014). SLR threatens loss of mangroves and seagrass habitat, which impacts resources and livelihoods (Nurse et al., 2014; ADB, 2013; Anderson at al., 2009).
Economy & Finance Development and social assistance funding diverted to disaster response, assistance (Anderson, 2012; ADB, 2013). Recovery hampered by multiple events, especially during ENSO (Nurse et al., 2014; Anderson, 2012). Tourism as a large economic driver may be impacted from damage and loss to ecosystems (corals, beaches) and infrastructure from higher temperatures (Nurse et al., 2014; World Bank, 2017).
Infrastructure SLR (high confidence, robust evidence, high agreement), especially those superimposed on extreme events, and storms threaten damage to coastal infrastructure, including airports, ports, roadways, bridges, and utility systems (ADB, 2013; Nurse et al., 2014; Leong et al., 2014; Anderson, 2012; World Bank, 2017). Impacts to Critical Facilities and Lifelines increase hardship on people, businesses, and governments (Nurse et al., 2014; Anderson, 2012; Leong et al., 2014; ADB, 2013; World Bank, 2017).
Wastewater & Solid Waste Reduced areas for waste streams with SLR, coastal inundation from storms, and erosion (Anderson, 2012; Leong et al., 2014; Nurse et al., 2014). Pollution is an added stressor on terrestrial and marine ecology (Nurse et al., 2014; Leong et al., 2014). Pollutants in groundwater resources further limit freshwater availability for drinking, health, hygiene, and sanitation (Anderson, 2012; Leong et al., 2014; Nurse et al., 2014). Increased risk from toxins and related illness from storm threats, infrastructure impacts, and wasted in freshwater, terrestrial, and marine ecosystem (Anderson, 2012; Leong et al., 2014; Nurse et al., 2014).
Settlements Moves to urban centers and coastal areas increases the risk for communities and infrastructure from storms and SLR (ADB, 2013; World Bank, 2017). Increased need for housing on many islands has resulted in clearing mangroves, and dunes, and land reclamation of swamps and bays (Anderson, 2012; Nurse et al., 2014). Displacement, relocation, and migration to higher islands has begun in Solomon Islands, Papua New Guinea, and low-lying atolls as land becomes uninhabitable (ADB, 2013; Nurse et al., 2014; Anderson et al., 2015).
Society & Culture Erosion and loss of Cultural and Sacred lands (Anderson, 2009). Impacts on graves and burial sites during tropical cyclones (Anderson, 2012). Loss of cultural foods with decline in agriculture (Anderson, 2009; Anderson, 2012; Anderson et al., 2015), especially for ceremony. Gender-differentiated impacts on livelihoods (and in sectors based on divisions of labour as discussed above) observed from tropical cyclones, sea level rise, erosion, and coral bleaching (Anderson et al., 2009; Anderson et al., 2015). Displacement from culture, livelihoods, and knowledge (ADB, 2013; Nurse et al., 2014; Anderson et al., 2015). Increased poverty as development funds are reallocated for disaster recovery efforts (ADB, 2013; Anderson et al., 2015; World Bank, 2017).
What Could Happen? Most recent climate change modelling experiments of future climates for Pacific CMSs were carried out by the Pacific-Australia Climate Change Science and Adaptation Planning Program (PASSAP) completed in 2014 (PASSAP, 2014). The results from the PASSAP experiments for each Pacific CMS are summarized in Table 7.

64
Table 7. Pacific CMS Future climates
Pacific CMS Future Climates8
Fiji El Niño and La Niña events will continue to occur in the future (very high confidence), but there is little consensus on whether these events will change in intensity or frequency. Annual mean temperatures and extremely high daily temperatures will continue to rise (very high confidence). Rainfall: There is a range in model projections in mean rainfall, with the model average indicating slight change in annual rainfall but an increase in the November– April season (low confidence), with more extreme rain events (high confidence). Drought: The proportion of time in drought is projected to decrease slightly (low confidence); Ocean acidification is expected to continue (very high confidence); Coral Bleaching: The risk of coral bleaching will increase in the future (very high confidence); Sea level will continue to rise (very high confidence); Wave height9 is projected to decrease across the Fiji area in the wet season, with a possible slight increase in dry season wave heights (low confidence).
Kiribati El Niño and La Niña events will continue to occur in the future (very high confidence), but there is little consensus on whether these events will change in intensity or frequency; Annual mean temperatures and extremely high daily temperatures will continue to rise (very high confidence); Average rainfall is projected to increase (high confidence), along with more extreme rain events (high confidence); Droughts are projected to decline in frequency (medium confidence); Ocean acidification is expected to continue (very high confidence); The risk of coral bleaching will increase in the future (very high confidence); Sea level will continue to rise (very high confidence); and Wave height is projected to decrease in December–March (low confidence), and waves may be more directed from the south in October (low confidence).
Nauru El Niño and La Niña events will continue to occur in the future (very high confidence), but there is little consensus on whether these events will change in intensity or frequency; Annual mean temperatures and extremely high daily temperatures will continue to rise (very high confidence); Mean rainfall is projected to increase (medium confidence), along with more extreme rain events (high confidence); Droughts are projected to decline in frequency (medium confidence); Ocean acidification is expected to continue (very high confidence); The risk of coral bleaching will increase in the future (very high confidence); Sea level will continue to rise (very high confidence); Wave height and period are projected to decrease in December–March (low confidence). No significant changes are projected in June–September (low confidence).
PNG El Niño and La Niña events will continue to occur in the future (very high confidence), but there is little consensus on whether these events will change in intensity or frequency; Annual mean temperatures and extremely high daily temperatures will continue to rise (very high confidence); Mean rainfall is projected to increase (medium confidence), along with more extreme rain events (high confidence); Droughts are projected to decline in frequency (medium confidence); Ocean acidification is expected to continue (very high confidence); The risk of coral bleaching will increase in the future (very high confidence); Sea level will continue to rise (very high confidence); Wave height and period are projected to decrease in December–March (low confidence). No significant changes are projected in June–September (low confidence).
Samoa El Niño and La Niña events will continue to occur in the future (very high confidence), but there is little consensus on whether these events will change in intensity or frequency;
8For the period to 2100, based on the latest global climate model (GCM) projections and climate science findings (PASSAP, 2014). 9 Future extreme wave climate will be sensitive to changing frequency and intensity of ENSO events (Stephens and Ramsay, 2014).

65
Annual mean temperatures and extremely high daily temperatures will continue to rise (very high confidence); The CMIP5 models project slight change in mean annual rainfall (low confidence), with more extreme rain events (high confidence); Incidence of drought is projected to decline or stay approximately the same (low confidence); Ocean acidification is expected to continue (very high confidence); The risk of coral bleaching will increase in the future (very high confidence); Sea level will continue to rise (very high confidence); Wind-wave: A reduction of wave period in December–March is projected with no change in wave height (low confidence). No change is projected in June–September (low confidence).
Solomon Islands El Niño and La Niña events will continue to occur in the future (very high confidence), but there is little consensus on whether these events will change in intensity or frequency; Temperature: Annual mean temperatures and extremely high daily temperatures will continue to rise (very high confidence); Rainfall: Annual rainfall is projected to increase slightly (low confidence), with more extreme rain events (high confidence); Incidence of drought is projected to decrease slightly (low confidence); Ocean acidification is expected to continue (very high confidence); The risk of coral bleaching will increase in the future (very high confidence); Sea level will continue to rise (very high confidence); December–March wave heights are projected to decrease (low confidence), while there are no significant changes projected in June–September waves (low confidence).
Tonga El Niño and La Niña events will continue to occur in the future (very high confidence), but there is little consensus on whether these events will change in intensity or frequency; It is not clear whether mean annual rainfall will increase or decrease, and the model average indicates slight change (low confidence in this model average), with more extreme rain events (high confidence); Drought frequency is projected to decrease slightly (low confidence); Ocean acidification is expected to continue (very high confidence); The risk of coral bleaching will increase in the future (very high confidence); Sea level will continue to rise (very high confidence); December–March wave heights and periods are projected to decrease slightly (low confidence).
Tuvalu El Niño and La Niña events will continue to occur in the future (very high confidence), but there is little consensus on whether these events will change in intensity or frequency; Annual mean temperatures and extremely high daily temperatures will continue to rise (very high confidence); It is not clear whether mean annual rainfall will increase or decrease, the model average indicating slight change (low confidence), with more extreme rain events (high confidence); Incidence of drought is projected to decrease slightly (low confidence); Ocean acidification is expected to continue (very high confidence); The risk of coral bleaching will increase in the future (very high confidence); Sea level will continue to rise (very high confidence); December–March wave heights and periods are projected to decrease slightly (low confidence).
Vanuatu El Niño and La Niña events will continue to occur in the future (very high confidence), but there is little consensus on whether these events will change in intensity or frequency; Surface air temperature and sea-surface temperature are projected to continue to increase (very high confidence). Wet season rainfall is projected to increase (medium confidence). Dry season rainfall is projected to decrease (medium confidence). Slight change is projected in annual mean rainfall (low confidence). The intensity and frequency of days of extreme heat are projected to increase (very high confidence). The intensity and frequency of days of extreme rainfall are projected to increase (high confidence). Slight change is projected in the incidence of drought (low confidence). Tropical cyclone numbers (frequency) are projected to decline in the south-west Pacific Ocean basin (0–40ºS, 130ºE –170ºE) (medium confidence). Ocean acidification is projected to continue (very high confidence). Mean sea-level rise is projected to continue (very high confidence).

66
Potential Impacts Given the observations of impacts at local levels, especially in island systems, there are many anticipated, potential impacts. For the IPCC AR5 Chapter 29 (Nurse, et al., 2014), which relies on published, peer-reviewed literature, the authors developed a series of scenarios with the sea level rise (SLR) superimposed on extreme events. The IPCC AR5 (Nurse, et al., 2014), the World Bank, and the Asian Development Bank have identified potential impacts from scenarios and economic modeling projections that will occur from climate change without targeted adaptation and risk reduction measures. Table 8 describes the potential impacts, many of which may be reduced with locally appropriate interventions. Table 8. Potential impacts of climate change and extremes on Pacific CMSs sectors/systems.
Sector/System Potential Impacts
Extreme Events The number of tropical cyclones are projected to decline in the Pacific CMSs basin (medium confidence) (PASSAP, 2014). The average maximum intensity of tropical cyclones (i.e. maximum speed) is likely to increase (World Bank, 2017). There have been other studies that have noted a trend in increased intensity for tropical cyclones since 1990 (Diamond, et al., 2013); however, more work is still required to more fully validate this. Sea Level will continue to rise (very high confidence) in all Pacific CMSs (PASSAP, 2014; Nurse, et al., 2014). SLR in the Pacific poses an existential threat to many island countries (World Bank, 2017). In the Western Pacific, it will be larger than the global mean, and will have far-ranging adverse consequences for small island states, especially when combined with the projected possible increased intensity of tropical cyclones, climate change-induced effects on oceanic ecosystems (e.g. loss of protective reefs due to temperature increases and ocean acidification), and other extreme events. The World Bank (2017) argues that forced abandonment seems a possible outcome for small islands, even with relatively minor changes in sea level, due to small populations and challenges adapting. Further, there is the potential that physical impacts might breach a threshold that pushes social systems into complete abandonment, as institutions that could facilitate adaptation collapse. El Niña and La Niña events will continue to occur in the future (very high confidence) but there is little consensus on whether these events will change in intensity or frequency (PASSAP, 2014). Temperature: Annual mean and extremely high daily temperatures will continue to rise (very high confidence) in all Pacific CMSs. (PASSAP, 2014) The intensity and frequency of days of extreme heat are projected to increase in Vanuatu (very high confidence) (PASSAP, 2014). A dramatic increase in the intensity and frequency of high-temperature extremes (World Bank, 2017). Extreme heat waves are likely to be regular and of unprecedented magnitude and duration, essentially becoming the new norm – and shifting local climate to a fundamentally new regime (World Bank 2017). Rainfall: There is a range of model projections in mean rainfall, with the models indicating slight change in annual rainfall for Fiji, Samoa, Tonga, Tuvalu and Vanuatu, while average rainfall is projected to increase (high confidence) (PASSAP, 2014). Average rainfall is projected to increase (high confidence) along with more extreme rain events (high confidence) for Kiribati while Nauru mean rainfall is projected to increase (medium confidence) along with more extreme events (high confidence). PNG mean rainfall is projected to increase (medium confidence) along with more extreme rain events (high confidence) while droughts are projected to decline in frequency (medium confidence). Solomon Islands annual rainfall is projected to increase slightly (low confidence) with more extreme rain events (high confidence, while incidence of drought is projected to decrease slightly (low confidence). The intensity and frequency of extreme rainfall are projected to increase (high confidence) ion Vanuatu (PASSAP, 2014). Drought: The proportion of time in drought (frequency) is projected to decrease slightly, decline or remain the same (low confidence) in all Pacific CMSs (PASSAP, 2014).
Water Water supply will continue to be a challenge for low-lying atolls. “By 2070, PNG and Vanuatu could have annual shortages of 124 millimetres (mm) and 15 mm of water supply, respectively” (ADB, 2013).
Fisheries Near-shore areas will be drastically affected by coral bleaching, degradation, erosion, coastal inundation and harm fisheries habitat (Nurse, et al., 2014; Leong, et al., 2014; ADB, 2013).

67
ADB (2013) cited a World Bank analysis that indicated “the Pacific would experience an increase in thermal stress that would likely result in a significant decline in coral reef cover, from 88% in the base year (1995) to 55% in 2050 and 20% in 2100”, and this will result in fisheries decline. Pelagic fisheries shift with warming waters, and there are changes in size and composition of catch (Hamnett and Anderson, 2000; Lehodey, et al., 2014). “Under a high emissions scenario, catches of skipjack tuna for the western Pacific are estimated to decline by an average of more than 20%, and for PNG by as much as 30%. Across the entire region, total catch is projected to decrease by 7.5% under the same scenario by 2100. For bigeye tuna, small decreases in catch (usually less than 5%) are projected by 2035. Catches are projected to decrease by 10% to 30% for many Pacific DMCs under the high emissions scenario in 2100” (ADB 2013). As global catch declines, fishing effort increases to land catches, which increases costs for fuel, transport, and processing (Hamnett and Anderson, 2000; Lehodey, et al., 2014; Johnson and Welch, 2009; ADB, 2013; Nurse et al., 2014).
Agriculture It is expected that climate change will “negatively impact crop productivity in the Pacific (Barnett and Campbell, 2010). Increases in temperature can alter the timing and rate of physiological development, resulting in early maturity and reduced biomass accumulation and yield (Brown and Rosenberg, 1999; Challinor, et al., 2004; Meza, et al., 2008). In addition to the adverse effects of increases in temperature, tropical cyclones can destroy vegetation, crops, orchards, and livestock; damage infrastructure such as canals, wells and tanks; and cause long-term loss of soil fertility from salinity intrusion (Sivakumar, 2005)” (ADB, 2013). Water-logging, flooding, tropical cyclones, and drought will have further impact on the availability of arable land (ADB, 2013). The occurrence of pests and diseases is also expected to be affected by climate change (Zhao, et al., 2005). Significant long-term declines in yields of selected staple food and commercial crops are expected in the six Pacific DMCs. By 2070, sweet potato cultivation is projected to decline by 62% in PNG and 25% in Solomon Islands, sugarcane yield by 13% in Fiji - “Adverse effects on yields...would accumulate to an estimated economic loss of $1,957 million or 5.4% of the region’s annual GDP equivalent by 2100” (ADB, 2013).
Energy Even with shifts to renewable energy technologies through large investments (Lefale, et al., 2017), the impact on global GHG emission reductions will be negligible. Reliance on imported petroleum fuels for aviation and marine transportation will continue to increase. Even under low emissions scenario globally, in which the global economy is assumed to restructure itself to be service-oriented, the economic loss is projected to reach 4.6% of the region’s annual GDP equivalent by 2100 (ADB, 2013). When considering income and population growth in the urban areas, the cost of cooling is estimated to reach $1,017 million or 2.8% of the region’s annual GDP equivalent by 2100 (ADB, 2013).
Health Health impacts will be exacerbated in every area (waterborne diseases; dengue, malaria, and mosquito vector-borne diseases; respiratory illness; leptospirosis; morbidity and mortality from extreme weather events; inadequate nutrition and lack of fresh drinking water; deterioration of hygiene and sanitation; ciguatera fish poisoning) with potential for an increase in pandemic diseases (WHO, 2012; Nurse, et al., 2014; ADB, 2013). Communicable and non-communicable diseases are projected to rise in the Pacific (Hanna, et al., 2011; ADB, 2013). Further health implications also demonstrate increased risk based on gender and access to resources (Anderson, et al., 2015). Climate-sensitive health impacts, such as under-nutrition and malaria show important gender differences, such that children (particularly girls) and the elderly are the most affected by vulnerability to heat stress and the spread of disease (WHO, 2012). “By 2100, approximately 80% of total mortality cost would be caused by respiratory disorders due to climate change, and 14% by vector-borne diseases, particularly malaria (ADB, 2013). The WHO identifies SIDS as particularly vulnerable to health impacts of climate change because of the salinization of fresh water and arable land, as well as exposure to storm surges and extreme events (World Bank, 2017). Morbidity and mortality together are expected to cost the Pacific region about $296 million or 0.8% of annual GDP equivalent by 2100 (ADB, 2013).
Ecosystems Coral reefs, which provide habitat and sources of subsistence, dissipate wave energy, protect islands from erosion, and underpin island tourism, are threatened from bleaching events, acidification, and storms (Nurse, et al., 2014). Based on projections for a 4°C warmer world,

68
coral reefs may stop growing as early as the 2030s, with total dissolution of reefs by the 2060s (World Bank, 2017). Ocean acidification is expected to continue in all Pacific CMSs (very high confidence) (PASSAP, 2014). Coral bleaching risk will increase in the future (very high confidence) in all Pacific CMSs except Vanuatu (PASSAP, 2014). SLR threatens loss of mangroves and seagrass habitat, which impacts resources and livelihoods. Threats to terrestrial habitat result in (i) ecosystem and species horizontal shifts and decline; (ii) altitudinal species range shifts and decline; and (iii) exotic and pest species range increases and invasions. Impacts on water systems threaten ecosystem services and habitat survival (ADB, 2013; Nurse, et al., 2014).
Economy & Finance Development and social assistance funding will continue to be diverted to disaster response, assistance (ADB, 2013; World Bank, 2017). Recovery will be hampered by multiple extreme events occurring without the opportunity for recovery (ADB, 2013; Anderson, 2012). Tourism, as a large economic driver in many islands, will be impacted from damage and loss to ecosystems (corals, beaches) and infrastructure from higher temperatures (Nurse, et al. 2014; ADB, 2013). “Under the business-as-usual scenario, climate change may cost the Pacific region 2.2%–3.5% of its annual gross domestic product (GDP) by 2050, and as much as 12.7% by 2100” (ADB, 2013).
Infrastructure SLR (high confidence, robust evidence, high agreement), especially those superimposed on extreme events, and storms threaten damage to coastal infrastructure, including airports, ports, roadways, bridges, and utility systems (Nurse, et al., 2014). Impacts to Critical Facilities and Lifelines will continue to increase hardship on people, businesses, and governments. “Airports, seaports, roads, and local communities could be under water up to 2 m by 2100” (ADB, 2013).
Wastewater & Solid Waste
Extreme events where there is heavy rainfall and flooding, or alternatively a lack of water and drought contribute to poor hygiene, poor sanitation, and an increase in health risks from water-borne, food-borne, and vector-borne diseases (ADB, 2013). There will be increased health risks, and the modeled costs have been largely related to the anticipated health sector impacts (ADB, 2013; Anderson, et al., 2015).
Settlements Migration from atolls and inundated islands will increase as the population moves to urban centers, which increases risk for these communities and for infrastructure from storms and SLR (ADB, 2013; World Bank, 2017). Displacement, relocation, and migration to higher islands as lands become inhabitable; and then to other countries. Although costs are not calculable, “land-loss would account for most of the total coastal impact. The cost of forced migration would become significant …with the rising sea level.” (ADB, 2013).
Society & Culture Adaptive capacity and resilience can also be strengthened through traditional knowledge and past experience of environmental changes. IPCC assessments noted that some traditional island assets, including subsistence and traditional technologies, skills and knowledge, community structures and coastal areas containing spiritual, cultural and heritage sites, appeared to be at risk from climate change (particularly sea-level rise). Some values and traditions are compatible with modern conservation and environmental practices, and these areas of customary practice and resource management, often gendered in nature, are being rekindled in the Pacific islands to enhance resilience (Anderson, et al., 2009; Nurse, et al., 2014). Climate change effects in different sectors will have differential gender costs as people become displaced from resources and livelihoods through impacts of storms, sea level rise, and force migration. (Anderson, et al., 2009; Anderson, et al., 2015). Displacement from places where gender roles and responsibilities are strong will have significant socioeconomic implications, because people will be forced into new roles and will not have the same positions/importance as they become disconnected from their heritage (Anderson, et al., 2015).
Confidence Assessment The distinction between observed impacts of climate change and projected impacts is often unclear in the small islands (including Pacific CMSs) literature and
discussions (Nurse, et al., 2014). Publications frequently deal with both aspects of impacts interchangeably, and use observed impacts from, for instance an extreme event, as an analogy to what may happen in the future as a result of climate change (e.g.,

69
Lo-Yat et al., 2011). This is the same finding that comes out of recent assessments (e.g. PASSAP, 201;, World Bank, 2017) in all nine Pacific CMSs (see Tables 8 & 9). Moreover, impacts of climate change on extreme events relevant to Pacific CMSs vary, dependent on the magnitude, frequency, and temporal and spatial extent of the event, as well as on the biophysical nature of the island and its social, economic, and political setting. Confidence assessment is therefore island specific. A “one size fits all” approach towards confidence assessment does not apply to Pacific CMSs. The confidence levels cited in this paper is based on the authors’ expert judgements. It is based on the confidence assessments cited by the peer review literature and reports used in this analysis. What is already happening
H X High
M Medium
L Low
L M H
What could happen in the future
H High
M X Medium
L Low
L M H
Knowledge Gaps This analysis reaffirms previous IPCC assessment findings (FAR 1990, SAR 1996, TAR 2001, AR4 2007, SREX 2012, AR5 2013) that the most severe meteorological and hydrological conditions experienced by Pacific CMSs occur during extreme weather, climate and hydrological events. It also reaffirms Pacific CMSs do not have uniform climate change risk profiles. Rather, their high diversity in both physical and human attributes and their response to
10 Frame et al, (2017) argued while the time of emergence, which characterises
when significant signals of climate change will emerge from existing climate variability is a useful and increasing common metric for understanding future
climate-related drivers means that climate change mitigation, impacts, vulnerability, and adaptation will be variable from one island to another. This diversity must be adequately integrated in climate change and sustainable development planning. As for the current and potential impacts on society and sectors, information was gathered from numerous studies and observations made by different sectors, by government, academia, and research organisations that have aggregated data into reports. In this analysis, the impacts information were extracted from some of the most recent studies of the Pacific Islands, including the IPCC AR5, the World Bank, and the Asian Development Bank. Knowledge gaps exist certainly by sector, and by the indirect and cascading costs that follow from even a single tropical cyclone, let alone a period of either El Niño, La Niña, or neutral conditions in which an island may experience serious changes in tropical cyclone frequency, wave inundation, drought and/or flooding, and erosion. The studies have thus sought to highlight known impacts, although there is still a challenge in quantifying future impacts. New common metrics (e.g. a population-based emergence of unfamiliar climates’ approach (Frame et al., 2017)10 to assess future impacts of climate change in Pacific CMSs are needed to provide more robust, clear and standardised future impacts information. Reinsurance agencies have built global annualized loss models and projected billions in losses by 2020, but these analyses have not been localised to the Pacific Islands, where transportation, remoteness, and geographic differences challenge data gathering and modelling in this region. Integrated studies that involve social scientists and biophysical scientists have tried to identify potential impacts to begin planning to reduce risks. While this paper has provided a brief overview of impacts, there is a considerable amount of work that needs to be done in this area. Following on from this analysis and building on the authors’ previous work on the IPCC (e.g. Mimura, et al., 2007) and related studies and assessments in Pacific Islands (Diamond, et al., 2012, 2017, Anderson, et al., 2015; Anderson, C.L, 2008; Swennenhuis, et al., 2015; Pelton, 2012; Lefale et al., 2017(a) and (b)), the three highest knowledge gap priorities that need to be addressed are:
• Restoring and strengthening the deteriorating state of earth observing and monitoring systems
climate change in the context of past-experience, a more useful metric may be the ratio of climate signal to noise (S/N), a measure of amplitude of change expressed in terms of units of existing variability.
Amount of evidence (theory /
observations / models) modelled)
Level of
agreement
or consensus
(incl. dataset
agreement
and model
confidence)
Amount of evidence (theory /
observations / models) modelled)
Level of
agreement or
consensus
(incl. dataset
agreement and
model
confidence)

70
(weather, climate, water, ocean, etc.) in Pacific CMS region. This is to ensure the observations (data) required to produce climate, weather, hydrological, oceanic information and products (e.g. severe weather and tropical cyclone warnings, marine forecasts, climate and drought outlooks, climate change scenarios, etc.) are readily available, sustainable and meet international standards. Regional components of International monitoring programs such as the Global Observing System (GOS), Global Climate Observing System (GCOS), Global Ocean Observing System (GOOS), Global Earth Observing System (GEO) and the World Hydrological Observing System (WHYCOS) should be supported.
• Research on oceans-climate nexus. Examples include expanding knowledge on:
o the role of natural coastal ecosystems (such as coral reefs and mangroves) in providing natural defences against inundation associated with storm surges, high tides, SLR, ocean acidification, and related non-climate factors such as coastal infrastructure development and land-based sources of marine pollution;
o the key climate-ocean features (e.g. SPCZ, ENSO, MJO, IPO, extreme cyclone wave climate, etc.) driving changes in micro-climates, weather and extremes in Pacific CMSs;
o Common metrics (e.g. a ratio of climate signal noise (S/N) – a measure of amplitude of change expressed in terms of units of existing variability as proposed by Frame et al., 2017) for understanding future climate change in the context of past experience.
• Expanding knowledge on building and enhancing local adaptive and resilient capacity of Pacific CMSs to extremes, climate change and related risks.
Comments
The information in this paper, or on which this paper is based, has been obtained from sources that the authors believe to be reliable and accurate. However, it has not been independently verified and no representation or warranty, express or implied, is made as to the accuracy or completeness of any information obtained from third parties. In addition, the statements in this report may provide current
expectations of future events based on certain assumptions and include any statement that does not directly relate to a historical fact or a current fact. These statements involve known and unknown risks, uncertainties and other factors which are not exhaustive. The individuals contributing to this paper operate in a continually changing environment and new risks emerge continually. Readers are cautioned not to place undue reliance on these statements. The individuals contributing to this paper undertake no obligation to publicly revise or update any statements, whether as a result of new information, future events or otherwise and they shall in no event be liable for any loss or damage arising in connection with the use of the information in this paper. Climate change is defined as: “a change in the state of the climate that can be identified (e.g. by using statistical tests) by changes in the mean and/or the variability of its properties and that persists for an extended period, typically decades or longer. Climate change may be due to natural internal processes or external forcing, or to persistent anthropogenic changes in the composition of the atmosphere or in land use” (IPCC, 2012). This definition differs from that in the United Nations Framework Convention on Climate Change (UNFCCC), where climate change is defined as: “a change of climate which is attributed directly or indirectly to human activity that alters the composition of the global atmosphere and which is in addition to natural climate variability observed over comparable time periods” (UNFCCC, 1992). The UNFCCC thus makes a distinction between climate change attributable to human activities altering the atmospheric composition, and climate variability attributed to natural causes. For simplicity, this paper uses the words “extremes” and/or “climate extremes” to refer to both extreme weather events and extreme climate events. The IPCC Special Report on Managing the Risks of Extreme Events and Disasters to advance climate change adaptation (SREX) defined “Climate Extreme” (extreme weather or climate event) as “the occurrence of a value of a weather or climate variable above (or below) a threshold value near the upper (or lower) ends of the range of observed values of the variable” (IPCC, 2012).
Author affiliations
Penehuro F. Lefale, International Climate Analyst/Director, LeA International, 32 Tirangi Road, Rongotai, Wellington 6022, New Zealand. External Affiliate, Joint Centre for Disaster Research (JCDR), Massey University, Wellington, New Zealand. All

71
correspondence regarding this paper shall be directed to: [email protected]. Howard J. Diamond, External Affiliate, LeA International and Adjunct Researcher, Victoria University of Wellington, Wellington, New Zealand. Cheryl L. Anderson, Director, LeA International; Research Affiliate, Joint Centre for Disaster Research (JCDR), Massey University, Wellington, New Zealand.
Citation
Please cite this document as:
Lafale, P.F., Diamond, H.J., Anderson, C.L. (2018) Impacts of Climate Change on Extreme Events Relevant to the Pacific Islands. Pacific Marine Climate Change Report Card: Science Review 2018, pp 50-73.
The views expressed in this review paper do not represent the Commonwealth Marine Economies Programme, individual partner organisations or the Foreign and Commonwealth Office.
References
Anderson, C., with F. Haddad, A.R. Rizvi, and C. Tirado. (2015) Promoting Resilience Rights, and Resources: Gender-responsive adaptation across sectors. Chapter 3, In: Aguilar, L., Grant, M., and Owen, C., (2015). Roots for the Future: The Landscape and way forward on gender and climate change. Washington DC: IUCN.
Anderson, C.L. (2012) Analysis of Integrating Disaster Risk Reduction and Climate Change Adaptation in the US Pacific Islands and Freely Associated States. Honolulu: University of Hawaii and the Pacific Regional Integrated Science and Assessment: TR201105.
Anderson, C.L. (2008) Climate Risk Assessment for Coastal Policy in the Pacific Islands. Solutions to Coastal Disasters. L. Wallendorf, L. Jones and B. Jaffe (Eds). Reston, VA: American Society of Civil Engineers. 97-106.
Anderson, C.L., R. Lane, S. Zoll, and K. Drucza. (2009) Stories from the Pacific: Gendered Dimensions of Disaster Risk Management and Climate Change Adaptation in the Pacific Islands. AusAID and UNDP Pacific Centre. Access 17 February 2018, http://www.hazards-climate-environment.org/yahoo_site_admin/assets/docs/GenderDisasterClimateChange_Anderson_UNDP-PC_AusAID.131112806.pdf
Asian Development Bank (ADB) (2013) The economics of climate change in the Pacific. Mandaluyong City, Philippines: Asian Development Bank, 2013.
Australian Bureau of Meteorology and CSIRO (2011) Climate Change in the Pacific: Scientific Assessment and New Research. Volume 1: Regional Overview. Volume 2: Country Reports.
https://www.pacificclimatechangescience.org/wp-content/uploads/2013/08/Climate-Change-in-the-Pacific.-Scientific-Assessment-and-New-Research-Volume-1.-Regional-Overview.pdf
Australian Bureau of Meteorology and CSIRO (2014) Climate Variability, Extremes and Change in the Western Tropical Pacific: New Science and Updated Country Reports. Pacific-Australia Climate Change Science and Adaptation Planning Program Technical Report, Australian Bureau of Meteorology and Commonwealth Scientific and Industrial Research Organization, Melbourne, Australia.
https://www.pacificclimatechangescience.org/wp-content/uploads/2014/07/PACCSAP_CountryReports2014_WEB_140710.pdf
Barnett, J., and W. N. Adger. (2003) Climate dangers and atoll countries. Climatic Change, 61:321-337, doi:10.1023/ B:CLIM.0000004559.08755.88.
Barnett, J. and J. Campbell. (2010) Climate Change and Small Island States: Power, Knowledge and the South Pacific. Earthscan LLC. Washington, D.C. US.
CSIRO, Australia Bureau of Meteorology and SPREP (2015) Pacific-Australia Climate Change Science and Adaptation Planning Program Summary Report, Commonwealth Secretariat and Industrial Research Organization, Melbourne, Australia.
https://www.pacificclimatechangescience.org/wp-content/uploads/2013/06/Climate-in-the-Pacific-summary-48pp_WEB.pdf
Diamond H.J. (2017) Tropical Cyclones in the Southwest Pacific, 1987-1988-2016/2017, LeA International, Wellington, New Zealand.
Diamond, H.J. (2016) Tokelau Tropical Cyclone Climatology, A Report, LeA International, Wellington, New Zealand, 06 pp.
Diamond, H.J., A.M. Lorrey, and J.A. Renwick. (2013) A Southwest Pacific Tropical Cyclone
Climatology and Linkages to the El Niño–Southern Oscillation. Journal of Climate, 26 (1), 3-25. doi:10.1175/JCLI-D-12-00077.1.
Diamond, H.J., A.M. Lorrey, K.R. Knapp, and D.H. Levinson. (2012) Development of an enhanced tropical cyclone tracks database for the southwest Pacific from 1840-2011. International Journal of Climatology, 32: 2240–2250. DOI:10.1002/joc.2412.

72
Döll, P. (2002) Impact of climate change and variability on irrigation requirements: A global perspective. Climatic Change, 54:269-293, doi:10.1023/A:1016124032231.
Forum Secretariat (2016) Framework for Resilience Development in the Pacific: An Integrated Approach to Address Climate Change and Disaster Risk Management (FRDP) 2017 – 2030, 40 pp. http://www.forumsec.org/resources/uploads/embeds/file/Annex%201%20-%20Framework%20for%20Resilient%20Development%20in%20the%20Pacific.pdf
Frame, D., M. Joshi, E. Hawkins, L. J. Harrington, and M. d. Roiste (2017) Population-based emergence of unfamiliar climates, Nature Climate Change, doi: 10.1038/NCLIMATE3297.
Hammett, M. P. and. C. L. Anderson. (2000) Impact of ENSO Events on Tuna Fisheries in the U.S.-affiliated Islands. Honolulu: Pacific Islands Fisheries Research Program. JIMAR Contribution 00-330 SOEST 00-03.
Holland, G. J. (1981) On the quality of the Australian tropical cyclone data base. Aust. Meteor. Mag., 29, 169–181.
IPCC (2012) Managing the Risks of Extreme Events and Disasters to Advance Climate Change Adaptation. A Special Report of Working Groups I and II of the Intergovernmental Panel on Climate Change [Field, C.B., V. Barros, T.F. Stocker, D. Qin, D.J. Dokken, K.L. Ebi, M.D. Mastrandrea, K.J. Mach, G.K. Plattner, S.K. Allen., M. Tignon, and P.M. Midgley (eds.)]. Cambridge University Press, Cambridge, UK, and New York, MY, USA, 582 pp.
IPCC (2013) Climate Change 2013: The Physical Science Basis. Contribution of Working Group I to the Fifth Assessment Report of the Intergovernmental Panel on Climate Change [Stocker, T.F., D. Qin, G.-K. Plattner, M. Tignor, S.K. Allen, J. Boschung, A. Nauels, Y. Xia, V. Bex and P.M. Midgley (eds.)]. Cambridge University Press, Cambridge, United Kingdom and New York, NY, USA, 1535 pp, doi:10.1017/CBO9781107415324.
Johnson, Johanna E. & David J. Welch. (2009) Marine Fisheries Management in a Changing Climate: A Review of Vulnerability and Future Options, Reviews in Fisheries Science 18(1): 106-124.
Knapp, K. R., M. C. Kruk, D. H. Levinson, H. J. Diamond, and C. J. Neumann. (2010) The International Best Track Archive for Climate Stewardship (IBTrACS): Unifying tropical cyclone best track data. Bull. Amer. Meteor. Soc., 91, 363–376.
Lefale, P.F., P. Faiva, and C.L. Anderson. (2017a) Living with Change (LivC): An Integrated National Strategy for Enhancing the Resilience of Tokelau to Climate Change and Related Hazards,
2017-2030. Wellington, New Zealand: Government of Tokelau and LeA International Consultants, Ltd.
http://ilea.co.nz/resources/LivCStrategy_web.pdf, 16 pp.
Lefale, P.F., P. Faiva, and C.L. Anderson. (2017b) Living with Change (LivC): An Integrated National Strategy for Enhancing the Resilience of Tokelau to Climate Change and Related Hazards, 2017-2030 - IMPLEMENTATION PLAN, 2017-2022. Wellington, New Zealand: Government of Tokelau and LeA International Consultants, Ltd, 33 pp. http://ilea.co.nz/resources/LivCImplementPlan_web.pdf
Lehodey, P., I. Senina, S. Nicol, and J. Hampton. (2014) “Modelling the Impact of Climate Change on South Pacific Albacore Tuna.” Topical Studies in Oceanography 113. DOI:10.1016/j.dsr2.2014.10.028
Leong, J.-A., J. J. Marra, M. L. Finucane, T. Giambelluca, M. Merrifield, S. E. Miller, J. Polovina, E. Shea, M. Burkett, J. Campbell, P. Lefale, F. Lipschultz, L. Loope, D. Spooner, and B. Wang. (2014) Ch. 23: Hawai‘i and U.S. Affiliated Pacific Islands. Climate Change Impacts in the United States: The Third National Climate Assessment, J. M. Melillo, Terese (T.C.) Richmond, and G. W. Yohe, Eds., U.S. Global Change Research Program, 537-556. doi:10.7930/J0W66HPM
Lo-Yat, A., S.D. Simpson, M. Meekan, D. Lecchini, E. Martinez, and R. Galzin. (2011) Extreme climatic events reduce ocean productivity and larval supply in a tropical reef ecosystem. Global Change Biology, 17(4), 1695-1702.
Meehl, G.A., T.F. Stocker, W.D. Collins, P. Friedlingstein, A.T. Gaye, J.M. Gergory, A. Itoh, R. Knutti, J.M. Murphy, A. Noida, S.C.B. Raper, I.G. Watterson, A.J. Weaver and Z.C. Zhao. (2007) Global Climate Projections. In: Climate Change 2007: The Physical Science of Climate Change [Solomon, S., D. Qin, <. Manning, Z. Chen, M. Marquis, K.B. Averyt, M. Tignor and H.L. Miller (eds.)] Cambridge University Press, Cambridge, United Kingdom and New York, NY, USA. https://www.ipcc.ch/publications_and_data/ar4/wg1/en/ch10.html
Mimura, N., L. Nurse, R.F. McLean, J. Agard, L. Briguglio, P. Lefale, R. Payet and G. Sem. (2007) Small Islands. Climate Change 2007: Impacts, Adaptation and Vulnerability. Contribution of Working Group II to the Fourth Assessment Report of the Intergovernmental Panel on Climate Change, M.L. Parry, O.F. Canziani, J.P. Palutikof, P.J. van der Linden and C.E. Hanson, Eds. Cambridge University Press, Cambridge, UK, 687-716. https://www.ipcc.ch/publications_and_data/ar4/wg2/en/ch16.html

73
Nurse, L.A., R.F . McLean, J. Agard, L.P . Briguglio, V. Duvat-Magnan, N. Pelesikoti, E. Tompkins, and A. Webb. (2014) Small islands. In: Climate Change 2014: Impacts, Adaptation, and Vulnerability. Part B: Regional Aspects. Contribution of Working Group II to the Fifth Assessment Report of the Intergovernmental Panel on Climate Change [Barros, V.R., C.B. Field, D.J. Dokken, M.D. Mastrandrea, K.J. Mach, T.E. Bilir, M. Chatterjee, K.L. Ebi, Y .O. Estrada, R.C. Genova, B. Girma, E.S. Kissel, A.N. Levy, S. MacCracken, P .R. Mastrandrea, and L.L. White (eds.)]. Cambridge University Press, Cambridge, United Kingdom and New York, NY , USA, pp. 1613-1654.
Pelton, J and P.F.Lefale. (2012) Finnish-Pacific Project to Reduced Vulnerability of the Pacific Island Countries’ Livelihoods to the effects of climate change (FINPAC) & Improved Capacity of the Pacific Island Countries National Meteorological Services to deliver weather and climate services (FINPAC-FMI), Project Appraisal Final Report, Finnish Consulting Group Ltd (FCG), Helsinki, Finland, 51 pp. International Ltd. 41 pps + annexes, Finland.
Sivakumar, M.V.K. (2005) Impacts of natural disasters in agriculture, rangeland and forestry: an overview. In M.V. K. Sivakumar et al. (eds) Natural Disasters and Extreme Events in Agriculture: Impacts and Mitigation. Springer-Verlag Berlin Heidelberg.
Sivakumar, M. V. K., and J. Hansen, 2007: Climate Prediction and Agriculture: Advances and Challenges. Springer, 307 pp.
Stephen, S.A. and D.L. Ramsay. (2014) Extreme cyclone wave climate in the Southwest Pacific Ocean: Influence of the El Niño Southern Oscillation and projected climate change, Global and Planetary Change 123 (2014) 13–26, https://doi.org/10.1016/j.gloplacha.2014.10.002
Swennenhuis, J., P. White, P.F.Lefale, O. Silfverherg and J. Pelton. (2015) Report of the Mid-Term Review of the Finnish-Pacific Project (FINPAC) to Reduced Vulnerability of the Pacific Island Country villagers’ Livelihoods to the effects of climate change. FCG International Ltd. 41 pps + annexes, Helsinki, Finland.
The World Bank (2017) Climate and Disaster Resilience, Pacific Possible, http://pubdocs.worldbank.org/en/281541469614058275/PACIFIC-POSSIBLE-Climate-Summary-paper.pdf, downloaded 30/10/[email protected], Wellington local time, NZ.
Tol, R.S.J. (2011) The Economic Impact of Climate Change on Pacific Island Nations. Draft report submitted
to the Asian Development Bank.
World Economic Forum, 2017: The Global Risk Report 2017, http://www3.weforum.org/docs/GRR17_Report_web.pdf downloaded 30/10/[email protected] Wellington local time, N.
Wairiu, M., M. Lal, and V. Iese. (2012) Ch. 5: Climate change implications for crop production in Pacific Islands region. Food Production - Approaches, Challenges and Tasks, A. Aladjadjiyan, Ed.
World Health Organization (WHO) (2012) Atlas of climate and health. Geneva, Switzerland: WHO & WMO.
World Meteorological Organization (WMO) (2006) The WMO Tropical Cyclone Operational Plan for the South Pacific and South East Indian Ocean (2006 Edition) technical definition of a tropical cyclone (WMO/TD-No.292, Report No. TCP-24, http://www.wmo.int/pages/prog/www/tcp/documents/TCP-24-OP-PLN-2006-edition-english.pdf, downloaded 01/02/[email protected], Wellington local time, NZ.
Zhao, Y. et al. (2005) Impacts of present and future climate variability on agriculture and forestry in the humid and sub-humid tropics. In: J. Salinger et al. (eds.) Increasing Climate Variability and Change: Reducing the Vulnerability of Agriculture and Forestry. Springer. The Netherlands.
© Crown Copyright (2018)