pacific islands gis&rs news
TRANSCRIPT
August, 2007 Pacific GIS&RS NEWS
GIS&RS newsPacific Islands The Newsletter of the
GIS&Remote SensingUsers in the Pacific
Issue 2/2007August, 2007
ISSN 1562-4250
Ever wondered what Remote Sensing really is?Despite being familiar with the term Remote Sensing,we tend to limit our idea of how useful it can be to ourwork. Remote sensing is often associated with satelliteimage interpretation of data in the optical range onlybut it’s more than just that. Many know explain it as atool that allows you to gather information and datawhich the need to touch an object or to be physicallypresent. This newsletter explains bathymetry or swathmapping of the seabed and the establishment of digitalterrain models (DTM) through RTK GPS survey. Bothare remote sensing applications, which are not usuallyassociated with the term itself. This newsletter alsointroduces TerraSAT-X, which is a new radar satellitein space for producing pictures. It is where the sensorsends a beam to the object and records the intensity,response time and polarisation of the reflection.However, this doesn’t relate with a recorded image inthe optical range such as the well-known image datafrom Landsat, IKONOS or QuickBird satellites in thePacific. Similarly LiDAR, which stands for LightDetecting And Ranging, works in the same way. Abeam is sent to the object and the sensor records thereflection. The only difference is that the beam is alaser pulse and not a radar wave. In Pacific IslandCountries, there is no application so far becausethe sensor needs a special plane to operate whichwould be expensive. However, discussions to mountthe sensor on a car and scan small atoll islandsfrom fixed points a few 100m apart and mosaic thedata to one DTM are ongoing. But it does not endthere, the term remote sensing also includes theclassical aerial photo analysis, where pairs of stereoimages are utilised to create a three-dimensionalmodel allowing drawing the image features in mapprojection if instruments like stereo plotters areapplied. Here new developments concentrate ondigital cameras together with in flight GPS positionand motion recording. This will reduce the amountof ground control points necessary to establish thethree-dimensional model in map projection. Digitalcameras cut the process of film development, whichhas been an ongoing problem when colour orinfrared film was used under island conditions. Sofar, there is no photo flight utilising such equipment
in the Pacific, but it is expected that the developmentwill reach the region soon.The last issue of this newsletter reflects the discussionat the end of the Pacific Regional GIS&RS UserConference, which highlighted demand for differentremote sensing applications and the need to adaptmethods to Pacific Island conditions althoughapplications run well in Europe and North America.Through the SOPAC-EU Project remote sensing dataand analysis, techniques are introduced in 14 PacificIsland Countries, which gave an enormous boost toGIS and remote sensing development. Nearly all GISestablishments in countries covered by the SOPAC-EU Project utilising GIS backdrops; the GIS of theSamoan power utility is shown as example in thecurrent newsletter and a further article explains thepotential and limitations of image pre-processingrequired for GIS backdrops. Now, methoddevelopment will follow to optimise the utilisation ofremote sensing data and to widen the use of differentdata. Welcome to the newsletter that opens a widespectrum of new applications for your purpose.
Remote Sensing Expands in thePacific
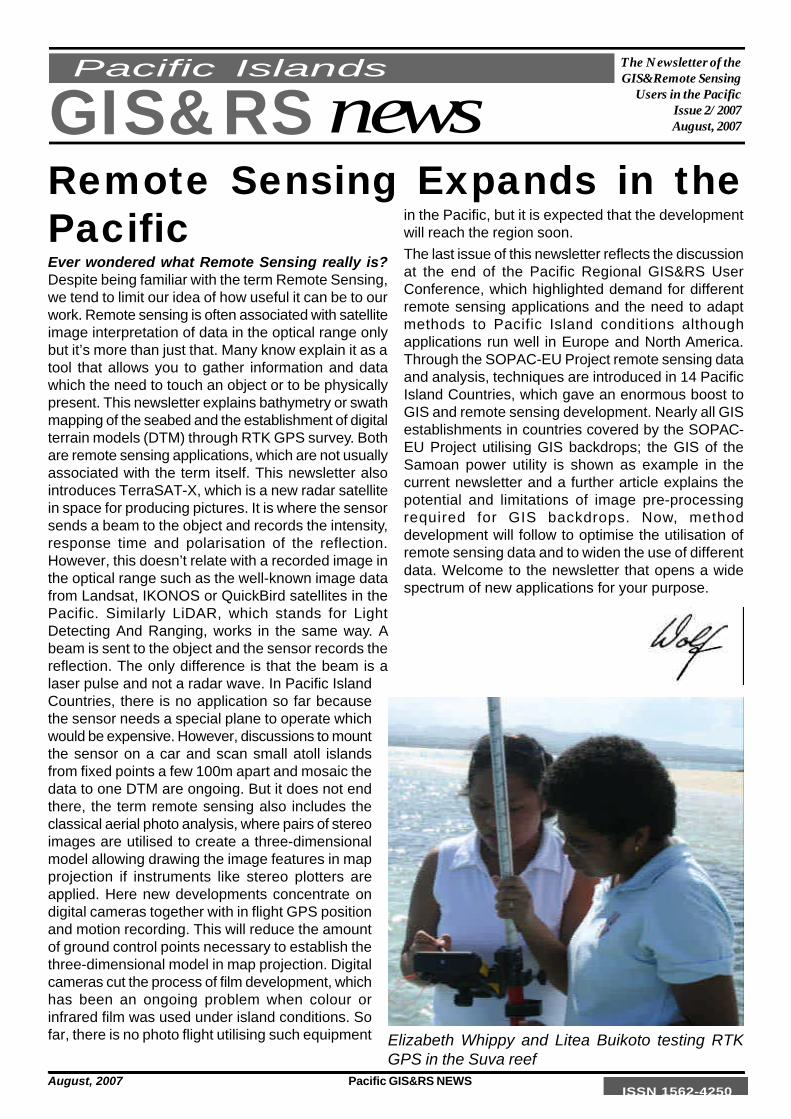
Elizabeth Whippy and Litea Buikoto testing RTKGPS in the Suva reef
2 Pacific GIS&RS NEWS June, 2007
Content
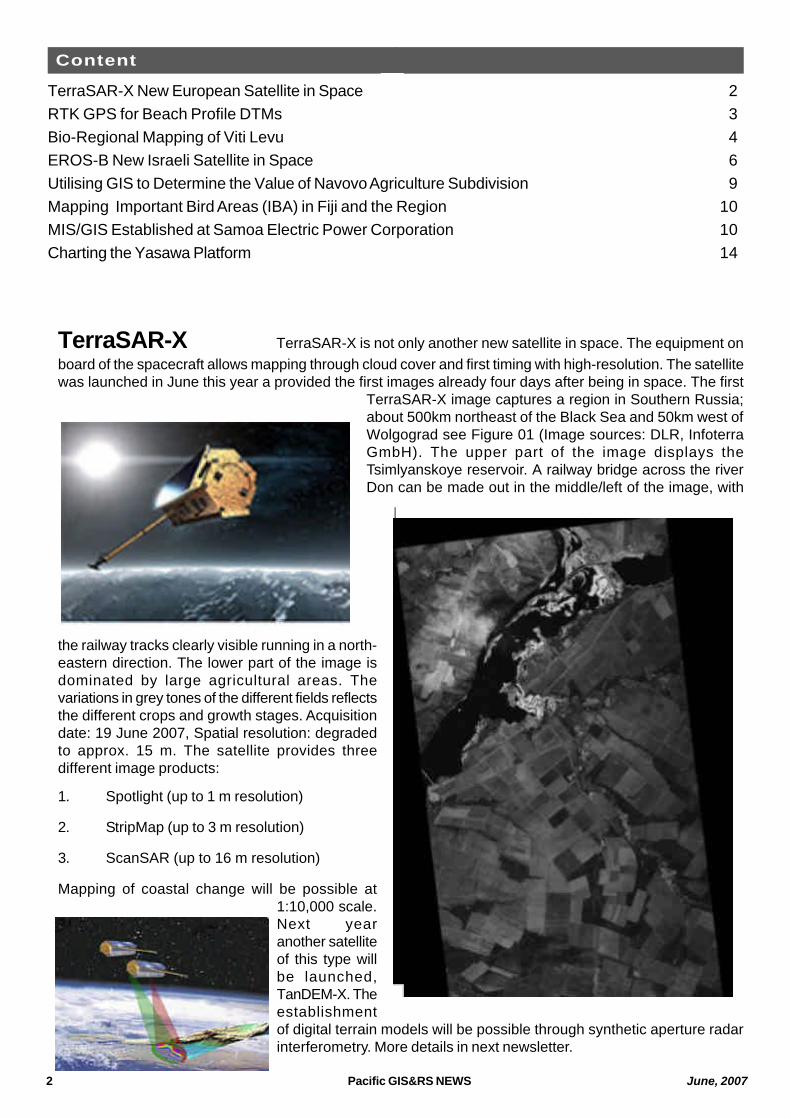
TerraSAR-X TerraSAR-X is not only another new satellite in space. The equipment onboard of the spacecraft allows mapping through cloud cover and first timing with high-resolution. The satellitewas launched in June this year a provided the first images already four days after being in space. The first
TerraSAR-X image captures a region in Southern Russia;about 500km northeast of the Black Sea and 50km west ofWolgograd see Figure 01 (Image sources: DLR, InfoterraGmbH). The upper part of the image displays theTsimlyanskoye reservoir. A railway bridge across the riverDon can be made out in the middle/left of the image, with
the railway tracks clearly visible running in a north-eastern direction. The lower part of the image isdominated by large agricultural areas. Thevariations in grey tones of the different fields reflectsthe different crops and growth stages. Acquisitiondate: 19 June 2007, Spatial resolution: degradedto approx. 15 m. The satellite provides threedifferent image products:
1. Spotlight (up to 1 m resolution)
2. StripMap (up to 3 m resolution)
3. ScanSAR (up to 16 m resolution)
Mapping of coastal change will be possible at1:10,000 scale.Next yearanother satelliteof this type willbe launched,TanDEM-X. Theestablishmentof digital terrain models will be possible through synthetic aperture radarinterferometry. More details in next newsletter.
TerraSAR-X New European Satellite in Space 2RTK GPS for Beach Profile DTMs 3Bio-Regional Mapping of Viti Levu 4EROS-B New Israeli Satellite in Space 6Utilising GIS to Determine the Value of Navovo Agriculture Subdivision 9Mapping Important Bird Areas (IBA) in Fiji and the Region 10MIS/GIS Established at Samoa Electric Power Corporation 10Charting the Yasawa Platform 14
June, 2007 Pacific GIS&RS NEWS 3
RTK GPS for Beach Profile DTMs
RTK GPS for Beach Profile DTMs
Wolf Forstreuter, SOPAC
IntroductionSand or beach movements on atoll islands have thepotential to cause significant problems for housing andinfrastructure. It is important to monitor where the sanddrifts away and where beach is building up. Thereasons for these shoreline movements are still notfully known. More understanding would allow aforecast to reduce negative impact. Contour lines ofsub-metre accuracy are required to map the shape ofthe beach. The technique could also be used to create
detailed DTM’s for windfarms allowing theoptimisation of windmilllocations. Anotherapplication would bethe ortho-correction ofhigh-resolution imagedata, which so far doesnot work in PacificIsland Countries due tothe missing DTMs.
Martin Hewittdirector ofGeoSys temsNew Zealand asTrimble maindealer for theregion promisedduring the lastR e g i o n a lGIS&RS UsersConference tobring equipmentto Suva for atrial survey, as
the beach profile simulation carried out bySOPAC in Kiribati in August 2005 did not showa complete DTM. In May 2007 the sandbank inthe Suva reef was surveyed representing a partof a beach in an atoll island.Equipment and SetupThe survey used a Trimble R8 Global NavigationSatellite System (GNSS), which has a multi-channel,multi-frequency receiver capturing American andRussian navigation satellite signals. The unit combinesthe GPS antenna, the receiver, the battery and theradio transmitter to send the base station signal to therover unit. The rover unit is also a multi-channel, multi-
frequency unit, which combines antenna, GPSreceiver, battery and radio receiver (see figure 02).
The base station was setup on a tripod in the middleof the sandbank (see figure 01) and position wastemporally marked. It will be permanently marked witha stainless steel pinto be available for re-surveys.
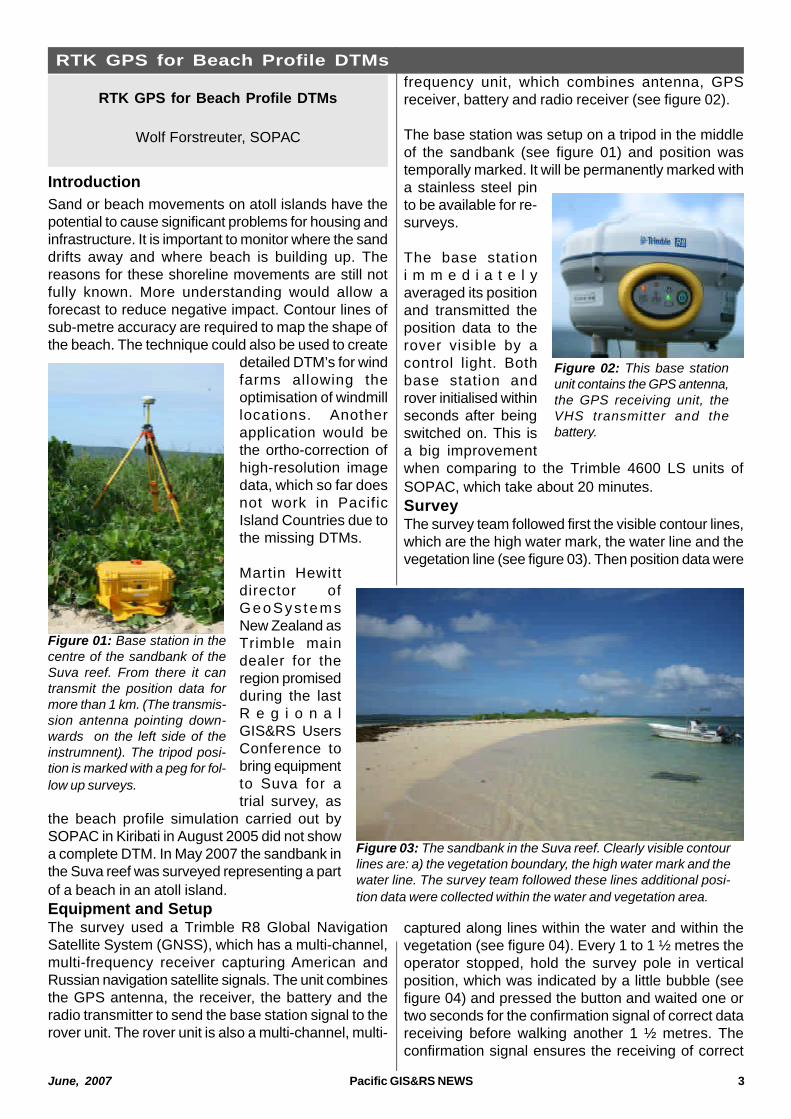
The base stationi m m e d i a t e l yaveraged its positionand transmitted theposition data to therover visible by acontrol light. Bothbase station androver initialised withinseconds after beingswitched on. This isa big improvementwhen comparing to the Trimble 4600 LS units ofSOPAC, which take about 20 minutes.SurveyThe survey team followed first the visible contour lines,which are the high water mark, the water line and thevegetation line (see figure 03). Then position data were
captured along lines within the water and within thevegetation (see figure 04). Every 1 to 1 ½ metres theoperator stopped, hold the survey pole in verticalposition, which was indicated by a little bubble (seefigure 04) and pressed the button and waited one ortwo seconds for the confirmation signal of correct datareceiving before walking another 1 ½ metres. Theconfirmation signal ensures the receiving of correct
Figure 01: Base station in thecentre of the sandbank of theSuva reef. From there it cantransmit the position data formore than 1 km. (The transmis-sion antenna pointing down-wards on the left side of theinstrumnent). The tripod posi-tion is marked with a peg for fol-low up surveys.
Figure 02: This base stationunit contains the GPS antenna,the GPS receiving unit, theVHS transmitter and thebattery.
Figure 03: The sandbank in the Suva reef. Clearly visible contourlines are: a) the vegetation boundary, the high water mark and thewater line. The survey team followed these lines additional posi-tion data were collected within the water and vegetation area.
4 Pacific GIS&RS NEWS June, 2007
RTK GPS for Beach Profile DTMs
satellite signals withthe defined precisionand base stationsignal. Re-surveydue to week signalsor due to problems ofdifferential correctioncan be avoidedthrough this setup.The survey of the 4.4hectares requiredabout two hoursincluding the setup ofthe base station.
Producing the DTMThe data download from the GPS rover unit does notrequire special software, as it can be exported as CSV
files containing position data X, Y, Z, point ID andannotation. The CSV files (ASCII) can be imported intoMapInfo, Access or ERDAS. MapInfo and VerticalMapper were used as first display for checking thedata integrity (see figure 06).The main data analysis was performed within ERDASImagine as this software environment provides morepotential for data analysis and is distributed in mostPacific Island Countries. The import to ERDAS is mosteasy, if the ASCII file just contains X, Y and Z valueseparated by a comma (,). Therefore the CSV file wasfirst imported to Access, reformatted and exported asASCII TXT file. The ERDAS module Create Surfaceproduces a DTM from this ASCII file, where the usercan define the cell size, the background value and thedata type. The cell size of 1 x 1m was chosen
Figure 05: Some lines were surveyed in the water, wherethe operator tried to walk in the same water depth to bestcapture a contour line.
Figure 04: The spirit levelmounted at the side of the surveypole indicates if the pole is incorrect vertical position.
Figure 06: Display of DTMand position data in MapInfo/Vertical Mapper
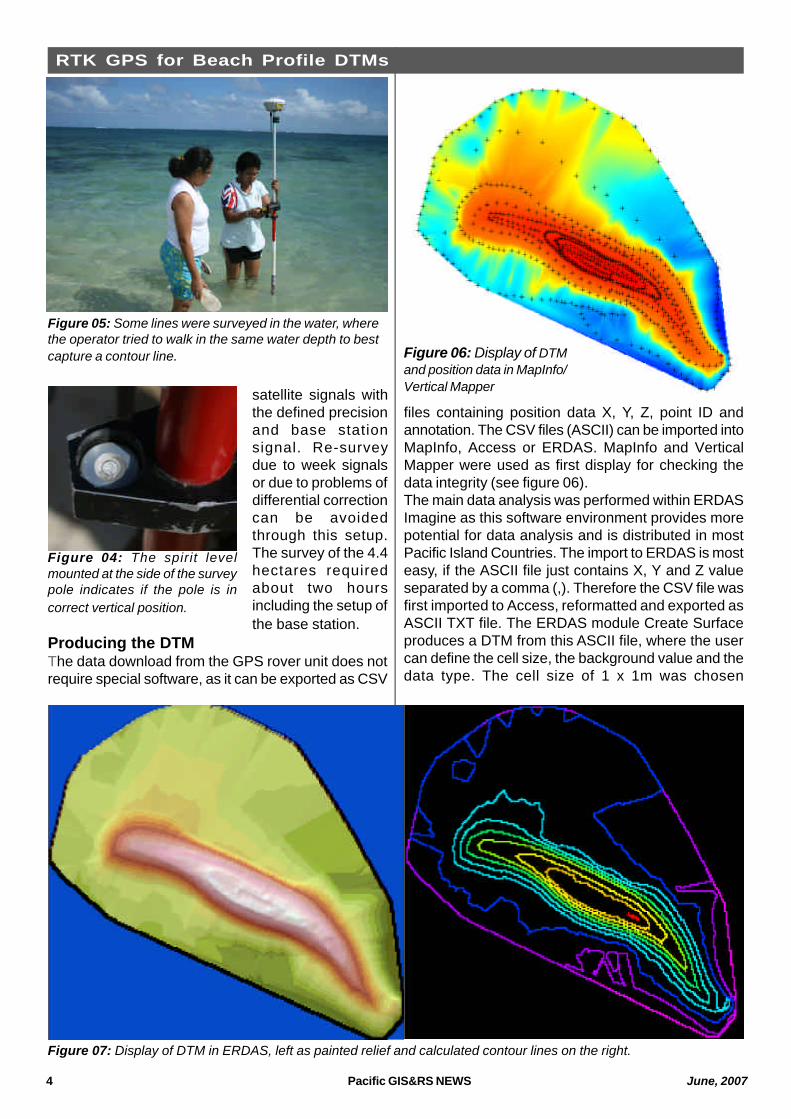
Figure 07: Display of DTM in ERDAS, left as painted relief and calculated contour lines on the right.
August, 2007 Pacific GIS&RS NEWS
RTK GPS for Beach Profile DTMs
correspond with high-resolution satellite image datapurchased nowadays for Pacific Island Countries.Having the DTM the user can produce:
o Shaded relief,o Painted relief,o Contour lines,
to better visualise the DTM (see figures 07 and 08)Calculating the Volume
For Pacific Island Countries it is important to know,how much sand is drifting away or built on the beach.Therefore the best way to quantify this is by calculatingthe volume using the DTM.So far, the elevation values represented height aboveellipsoid (HAE), something the user is not interestedin. In the case of the sandbank survey 55 metres HAEwas the lowest point measured when surveying in thewater. This height value was used as a reference planefrom which the DTM was re-calculated. This wasperformed with the ERDAS module Spatial Modeler,which reduced all height values to elevation above 55metres HAE.Knowing that the pixel size is 1 x 1m (1 x 1 = 1) thevolume of represented by each pixel can bedetermined by the height value (volume = height).Therefore the total volume of the DTM is the sum ofthe height values of all pixels representing the surveyarea. There is no module in ERDAS, which sums pixelvalues, however, the pixel values can be exported fromERDAS to Access where a table can be created toenable the full use of analysis in Access environment
Simulation of Erosion Monitoring
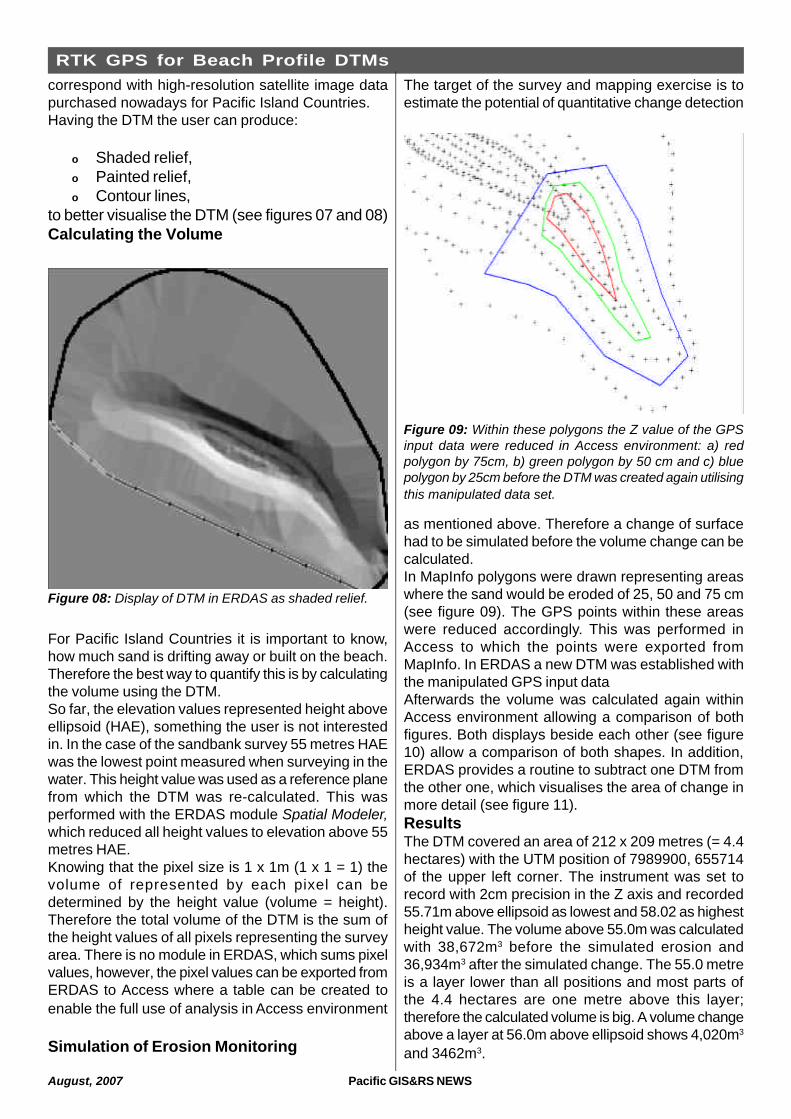
The target of the survey and mapping exercise is toestimate the potential of quantitative change detection
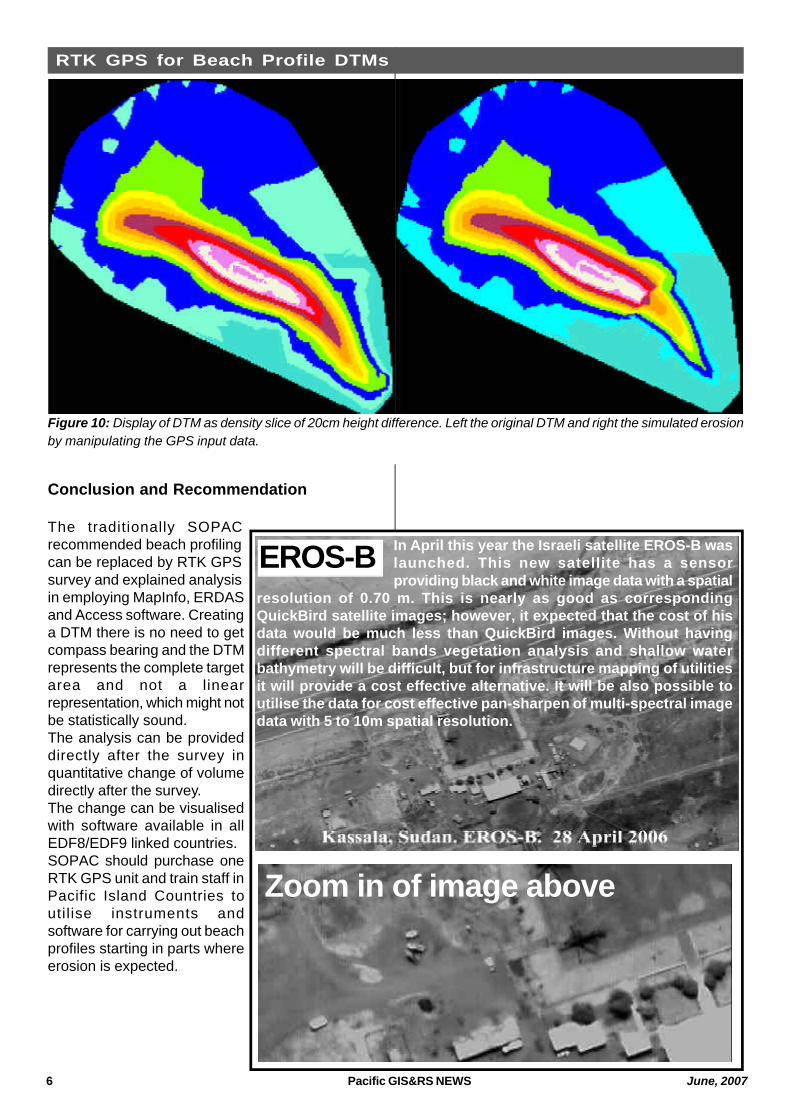
as mentioned above. Therefore a change of surfacehad to be simulated before the volume change can becalculated.In MapInfo polygons were drawn representing areaswhere the sand would be eroded of 25, 50 and 75 cm(see figure 09). The GPS points within these areaswere reduced accordingly. This was performed inAccess to which the points were exported fromMapInfo. In ERDAS a new DTM was established withthe manipulated GPS input dataAfterwards the volume was calculated again withinAccess environment allowing a comparison of bothfigures. Both displays beside each other (see figure10) allow a comparison of both shapes. In addition,ERDAS provides a routine to subtract one DTM fromthe other one, which visualises the area of change inmore detail (see figure 11).ResultsThe DTM covered an area of 212 x 209 metres (= 4.4hectares) with the UTM position of 7989900, 655714of the upper left corner. The instrument was set torecord with 2cm precision in the Z axis and recorded55.71m above ellipsoid as lowest and 58.02 as highestheight value. The volume above 55.0m was calculatedwith 38,672m3 before the simulated erosion and36,934m3 after the simulated change. The 55.0 metreis a layer lower than all positions and most parts ofthe 4.4 hectares are one metre above this layer;therefore the calculated volume is big. A volume changeabove a layer at 56.0m above ellipsoid shows 4,020m3
and 3462m3.
Figure 08: Display of DTM in ERDAS as shaded relief.
Figure 09: Within these polygons the Z value of the GPSinput data were reduced in Access environment: a) redpolygon by 75cm, b) green polygon by 50 cm and c) bluepolygon by 25cm before the DTM was created again utilisingthis manipulated data set.
6 Pacific GIS&RS NEWS June, 2007
Conclusion and Recommendation
The traditionally SOPACrecommended beach profilingcan be replaced by RTK GPSsurvey and explained analysisin employing MapInfo, ERDASand Access software. Creatinga DTM there is no need to getcompass bearing and the DTMrepresents the complete targetarea and not a linearrepresentation, which might notbe statistically sound.The analysis can be provideddirectly after the survey inquantitative change of volumedirectly after the survey.The change can be visualisedwith software available in allEDF8/EDF9 linked countries.SOPAC should purchase oneRTK GPS unit and train staff inPacific Island Countries toutil ise instruments andsoftware for carrying out beachprofiles starting in parts whereerosion is expected.
Figure 10: Display of DTM as density slice of 20cm height difference. Left the original DTM and right the simulated erosionby manipulating the GPS input data.
RTK GPS for Beach Profile DTMs
In April this year the Israeli satellite EROS-B waslaunched. This new satellite has a sensorproviding black and white image data with a spatial
resolution of 0.70 m. This is nearly as good as correspondingQuickBird satellite images; however, it expected that the cost of hisdata would be much less than QuickBird images. Without havingdifferent spectral bands vegetation analysis and shallow waterbathymetry will be difficult, but for infrastructure mapping of utilitiesit will provide a cost effective alternative. It will be also possible toutilise the data for cost effective pan-sharpen of multi-spectral imagedata with 5 to 10m spatial resolution.
Zoom in of image above
EROS-B
June, 2007 Pacific GIS&RS NEWS 7
Bio-Regional Mapping of Viti Levu
Leba Gaunavinaka
Bio-Regional Mapping of Viti Levu
Bioregional Mapping for Viti Levu:Our natural environment is the main life supportingbody and precious of human beings. Over the lastcentury however, human societies have becomeincreasingly industrial and technologically driven;increasingly contributing to pollution, soil erosions, andthe loss of diversity of all kinds. Protecting theenvironment’s quality is crucial as human societyprogresses. In light of this understanding, conservationstrategies of all sorts arebeing implemented, arecurrently proposed or inthe process ofendorsement. Newstrategies thought to bemore effective are beingexplored. Along thisargument is one, suchthat in the past, theplanning ofe n v i r o n m e n t a lconservation weremostly carried out underadministrative geo-political boundaries (likevia provinces etc) butthat in more recentyears, it had becomeincreasingly apparentthat that was no longera satisfactory basis forc o n s e r v a t i o nassessments andplanning (Morgan andTerry: 1992). Thereappeared a need for aconservation resourcesystem so if to be arepresentative of thenatural environment, tocontain viable areas ofthe major ecosystemsof each natural region. From this, came the conceptof bioregionalism (identifying and mapping bioregions)as a possible solution and comparatively moreappropriate approach.In bioregional mapping, the main influencing factorson an environment are integrated. From their
combinations, we group areas that share uniformalcharacteristics into units that we then call bioregions.In elementary projects, this can be done via the manualoverlay of paper maps. In bigger projects, computersystems are used for this task. The application ofGeographical Information Systems (GIS) forbioregional mapping is what this project chose. Theselected site was Viti Levu terrestrial due to theavailability of relevant data. Most information on themain biophysical influences on Fiji’s environmentexists mostly if not only for this mainland.Two Phases:Bioregion Map CreationIntegration with other Maps of Ecological or BiologicalSignificance.The second phase develops to illustrate how thebioregion map is potentially useful for conservation
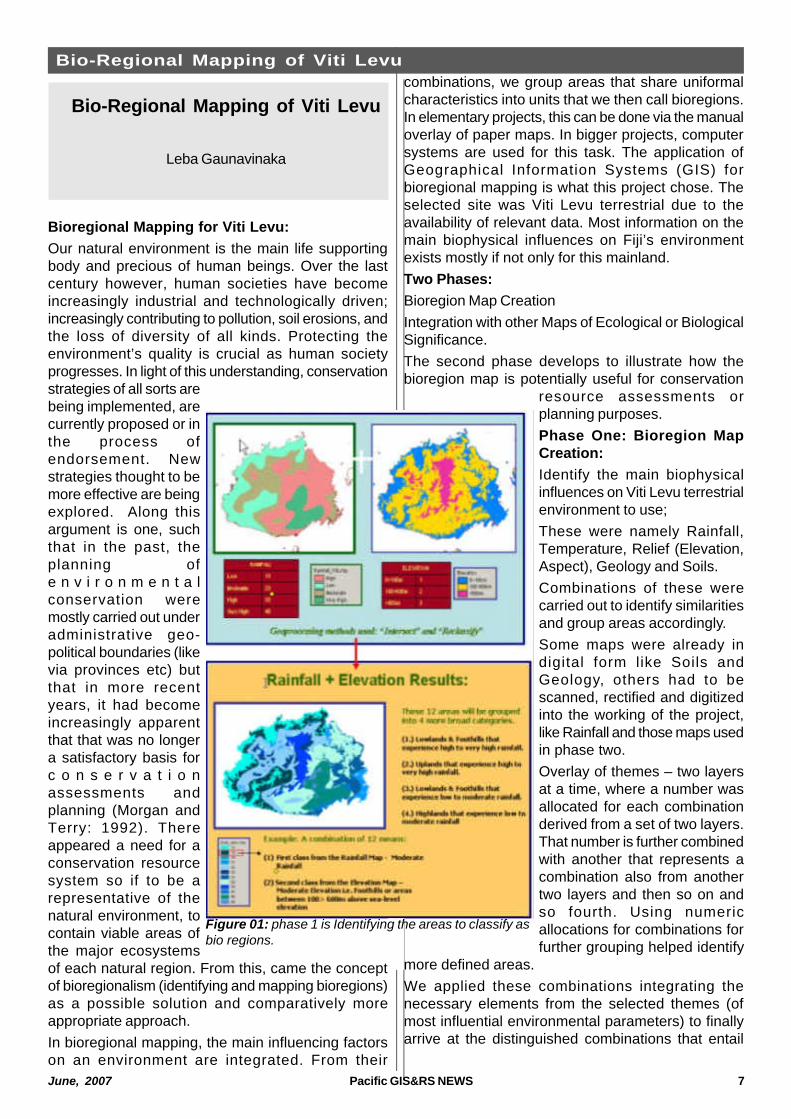
resource assessments orplanning purposes.Phase One: Bioregion MapCreation:Identify the main biophysicalinfluences on Viti Levu terrestrialenvironment to use;These were namely Rainfall,Temperature, Relief (Elevation,Aspect), Geology and Soils.Combinations of these werecarried out to identify similaritiesand group areas accordingly.Some maps were already indigital form like Soils andGeology, others had to bescanned, rectified and digitizedinto the working of the project,like Rainfall and those maps usedin phase two.Overlay of themes – two layersat a time, where a number wasallocated for each combinationderived from a set of two layers.That number is further combinedwith another that represents acombination also from anothertwo layers and then so on andso fourth. Using numericallocations for combinations forfurther grouping helped identify
more defined areas.We applied these combinations integrating thenecessary elements from the selected themes (ofmost influential environmental parameters) to finallyarrive at the distinguished combinations that entail
Figure 01: phase 1 is Identifying the areas to classify asbio regions.
August, 2007 Pacific GIS&RS NEWS
Bio Regional Mapping of Vitilevu
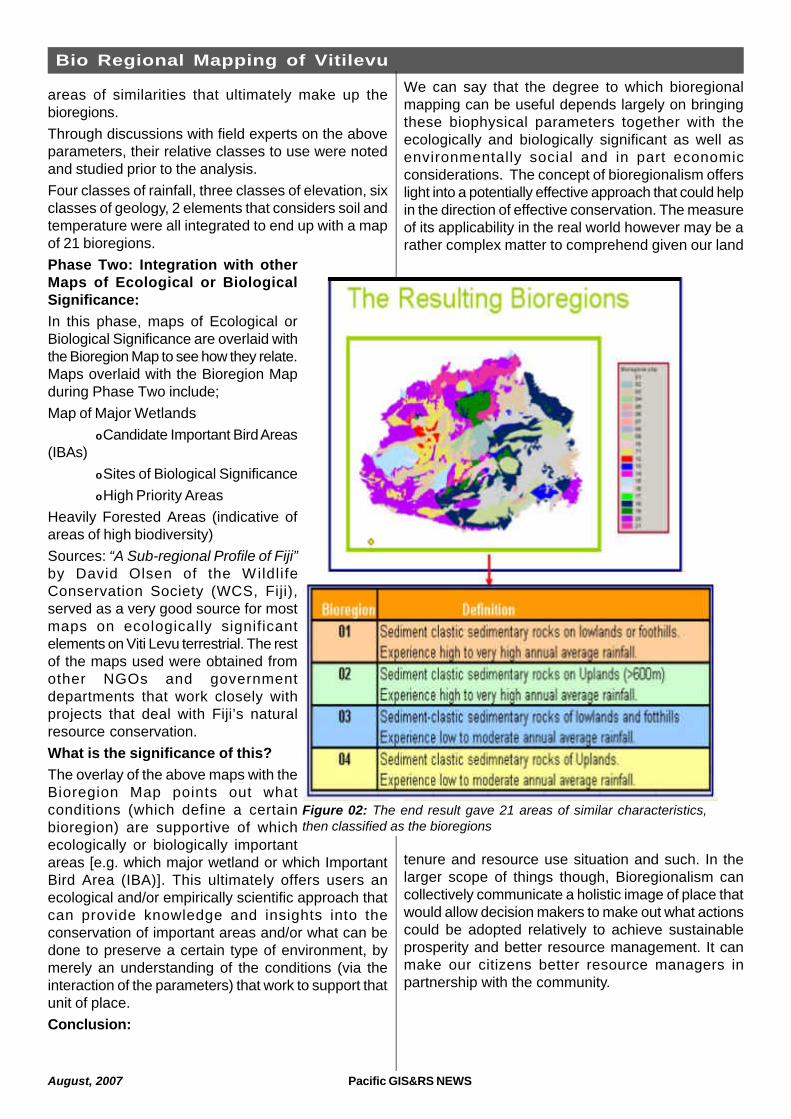
areas of similarities that ultimately make up thebioregions.Through discussions with field experts on the aboveparameters, their relative classes to use were notedand studied prior to the analysis.Four classes of rainfall, three classes of elevation, sixclasses of geology, 2 elements that considers soil andtemperature were all integrated to end up with a mapof 21 bioregions.Phase Two: Integration with otherMaps of Ecological or BiologicalSignificance:In this phase, maps of Ecological orBiological Significance are overlaid withthe Bioregion Map to see how they relate.Maps overlaid with the Bioregion Mapduring Phase Two include;Map of Major Wetlands
oCandidate Important Bird Areas(IBAs)
oSites of Biological SignificanceoHigh Priority Areas
Heavily Forested Areas (indicative ofareas of high biodiversity)Sources: “A Sub-regional Profile of Fiji”by David Olsen of the WildlifeConservation Society (WCS, Fiji),served as a very good source for mostmaps on ecologically significantelements on Viti Levu terrestrial. The restof the maps used were obtained fromother NGOs and governmentdepartments that work closely withprojects that deal with Fiji’s naturalresource conservation.What is the significance of this?The overlay of the above maps with theBioregion Map points out whatconditions (which define a certainbioregion) are supportive of whichecologically or biologically importantareas [e.g. which major wetland or which ImportantBird Area (IBA)]. This ultimately offers users anecological and/or empirically scientific approach thatcan provide knowledge and insights into theconservation of important areas and/or what can bedone to preserve a certain type of environment, bymerely an understanding of the conditions (via theinteraction of the parameters) that work to support thatunit of place.Conclusion:
We can say that the degree to which bioregionalmapping can be useful depends largely on bringingthese biophysical parameters together with theecologically and biologically significant as well asenvironmentally social and in part economicconsiderations. The concept of bioregionalism offerslight into a potentially effective approach that could helpin the direction of effective conservation. The measureof its applicability in the real world however may be arather complex matter to comprehend given our land
tenure and resource use situation and such. In thelarger scope of things though, Bioregionalism cancollectively communicate a holistic image of place thatwould allow decision makers to make out what actionscould be adopted relatively to achieve sustainableprosperity and better resource management. It canmake our citizens better resource managers inpartnership with the community.
Figure 02: The end result gave 21 areas of similar characteristics,then classified as the bioregions
June, 2007 Pacific GIS&RS NEWS 9
GIS to determine the Value of Navovo Argriculture Division
Utilising GIS to Determine the Valueof Navovo Agriculture Subdivision
Buliruarua LesumaGeorge Tami
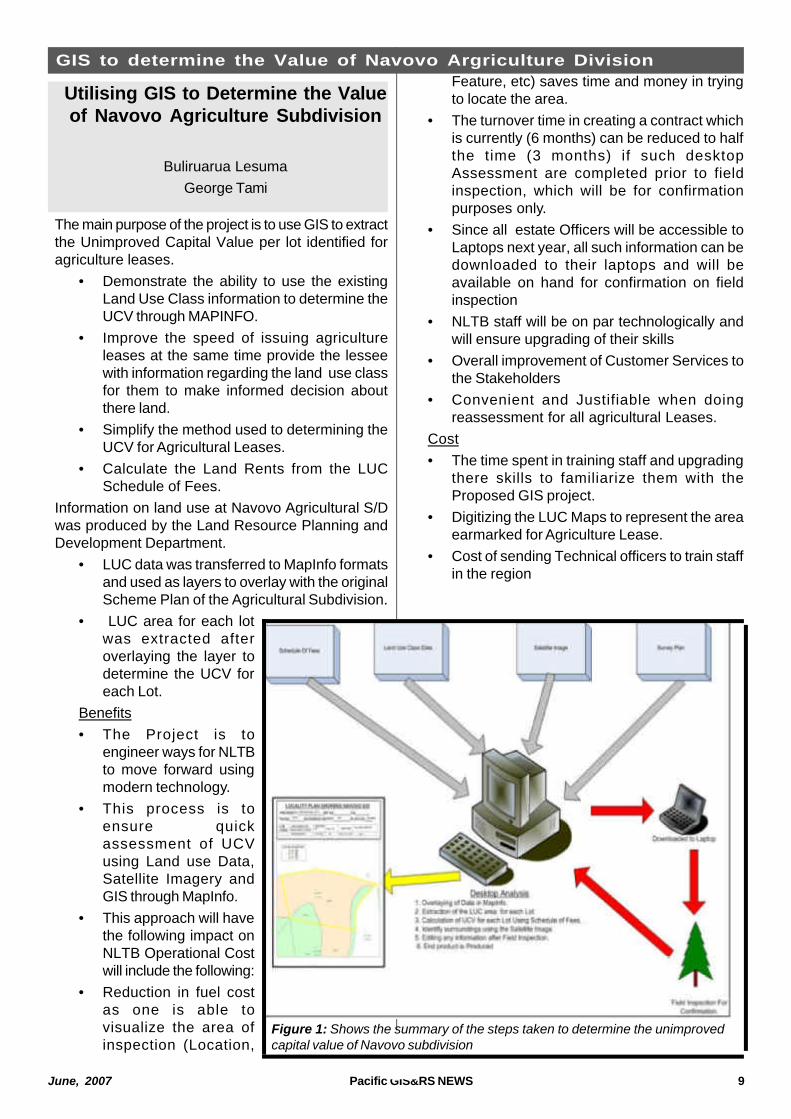
Figure 1: Shows the summary of the steps taken to determine the unimprovedcapital value of Navovo subdivision
The main purpose of the project is to use GIS to extractthe Unimproved Capital Value per lot identified foragriculture leases.
• Demonstrate the ability to use the existingLand Use Class information to determine theUCV through MAPINFO.
• Improve the speed of issuing agricultureleases at the same time provide the lesseewith information regarding the land use classfor them to make informed decision aboutthere land.
• Simplify the method used to determining theUCV for Agricultural Leases.
• Calculate the Land Rents from the LUCSchedule of Fees.
Information on land use at Navovo Agricultural S/Dwas produced by the Land Resource Planning andDevelopment Department.
• LUC data was transferred to MapInfo formatsand used as layers to overlay with the originalScheme Plan of the Agricultural Subdivision.
• LUC area for each lotwas extracted afteroverlaying the layer todetermine the UCV foreach Lot.
Benefits• The Project is to
engineer ways for NLTBto move forward usingmodern technology.
• This process is toensure quickassessment of UCVusing Land use Data,Satellite Imagery andGIS through MapInfo.
• This approach will havethe following impact onNLTB Operational Costwill include the following:
• Reduction in fuel costas one is able tovisualize the area ofinspection (Location,
Feature, etc) saves time and money in tryingto locate the area.
• The turnover time in creating a contract whichis currently (6 months) can be reduced to halfthe time (3 months) if such desktopAssessment are completed prior to fieldinspection, which will be for confirmationpurposes only.
• Since all estate Officers will be accessible toLaptops next year, all such information can bedownloaded to their laptops and will beavailable on hand for confirmation on fieldinspection
• NLTB staff will be on par technologically andwill ensure upgrading of their skills
• Overall improvement of Customer Services tothe Stakeholders
• Convenient and Justifiable when doingreassessment for all agricultural Leases.
Cost• The time spent in training staff and upgrading
there skills to familiarize them with theProposed GIS project.
• Digitizing the LUC Maps to represent the areaearmarked for Agriculture Lease.
• Cost of sending Technical officers to train staffin the region

1 0 Pacific GIS&RS NEWS June, 2007
Mapping Important Bird Areas in Fiji and the Pacific Region
IBAs are internationally recognized sites which are vitalfor the conservation of birds. They are identified usinga standard set of four global selection criteria: 1.Globally threatened species; 2. Restricted-rangespecies; 3. Biome-restricted assemblages; and 4.Congregation. To qualify as an IBA the site must meetor exceed one or more of the criteria and thresholdsindicated. The sites are large enough to support viablepopulations of the species for which they have beenidentified but small enough that site-basedconservation is practicable. IBA designation is not alegal one, nor does itoblige the land-owneror other users toconserve the site orchange their behaviour.IBA designation onlyidentifies the area asglobally important for itsbirds (and otherbiodiversity), andprovides informationupon whichgovernment, NGOsand other people can,and are encouraged toact.The IBA identificationprocess for Fiji hasbeen completed andthe boundaries havebeen mapped.Altogether 14 siteshave been identified asIBAs.Location of Important Bird Areas (IBAs) in FijiThe IBA process has commenced in other countriesaround the region. Palau, New Caledonia, FrenchPolynesia and other Pacific countries have adopted
the IBA process and this data will be mapped verysoon.Another project that has just started in the region isidentifying Seabird IBAs. This project is funded by theDavid & Lucile Packard Foundation. This project willlead to a major improvement in understanding ofseabird breeding colonies in two of the most significantisland groups for seabirds in the Pacific, FrenchPolynesia and Fiji. The project will analyse historicalinformation, gather new ethno-biological informationfrom local people – fisherfolk in particular – andinvestigate the use of remote imagery to identifyexisting and historically important islands for breedingseabirds in both countries. The up-to-date informationwill be made available mapped showing distributionsand numbers of breeding seabirds. An action planwill be produced identifying islands to be restored forbreeding seabirds. The culmination of this work,alongside the ongoing advocacy, education andprovision of information to national and localgovernments and people, will be a significant first stepfor the development of a coherent regional seabirdconservation initiative.Conservation prioritizationbecomes a hassle if data is not ready available. Withlimited resources we have to make every cent count.The IBA process helps identify sites of nationalsignificance and thus allowing stake holders to put
their resources to best use. Having mapped datareadily available will help government, NGOs, peopleand other organization adopt conservation on thesesites.
Mapping Important Bird Areas (IBA) in Fijiand the Region
Amit Sukal
Figure 1: Location of Important Bird Areas (IBAs) in Fiji.

June, 2007 Pacific GIS&RS NEWS 11
MIS/GIS Established at Samoa Electric Power Corporation
MIS/GIS Established at Samoa ElectricPower Corporation
Edwin Liava’a, GIS Specialist Avon Solutions
Leslie Allinson, ICT Specialist Avon Solutions
Introduction“The power of a GIS is limited only by the imaginationof the users” stated Joseph Walter, General Manager,Electric Power Corporation (EPC) at the successfulCommissioning and Demonstration of the MIS/GIS toEPC staff and stakeholders at EPC Headquarters, Apiain March 2007The Commissioning and Demonstration was theconclusion of fourth phase where the previous threephases were Inception, Training and Developmentwhile the fifth was Final Reports and Manuals. Thefive phases where completed under a project titledEstablishment of MIS/GIS at the Electric PowerCorporation of Samoa.This project that had taken some eight years to bringto implementation was made possible by therecognition of the value of a MIS/GIS by the GeneralManager EPC and the Manager of the Pacific IslandsEnergy Policy and Strategic Action Planning(PIEPSAP) Project as well as the generous supportby the Danish Government and the European Unionwho supported the funding of the satellite imagery thatwas selected and processed by the GIS Specialist fromthe Pacific Islands Applied Geoscience Commission.In addition, the United Nations Development ProjectSamoa was a key player in the success of the projectthat was implemented by two technical specialistsfrom Avon Solutions, a Pacific based and staffedcompany that focuses on MIS/GIS solutions.This article outlines the objectives and the activitiesto achieve same as well as an overview of thechallenges and how these were addressed.ObjectivesThe key objectives of the joint EPC PIEPSAP projectwere:
1. Develop and establish a MIS/GIS at EPC in closecollaboration with EPC professional staff
2. Train EPC staff to build, maintain and develop acomprehensive asset database and aGeographical Information System, which bothcan be linked to transfer annotation informationto the GIS and spatial information to the assetdatabase
3. Provide inputs for long term system expansionplanning in the electricity sector
4. Exchange information and experiences with otherGIS using utilities in the Pacific Region.
ActivitiesThe equipment that was purchased by EPC includedtwo Trimble GeoXM GPS Rover Units, one Trimble 5700Reference Station, two Cannon Coolpix digital cameras,one Underground Cable Locator, one high performance,a high capacity Dell Desktop computer with 19" TFTdisplay, an Epson A1 printer and Mustek A3 Scanner.The software purchased included MapInfo Professional8.5 and MapBasic 8.5 together with Microsoft Office 2003.The data included a QuickBird Image with 60cmresolution of Apia Town that covered the target EPCfeeders named Hospital and Beach Road. This invaluableimage purchased through EU funds served as thefoundation backdrop data for the project and was at thespecified datum of WGS84 and obviated the need toconvert any historical imagery or historical vector datafrom Samoa Grid datum. It should be noted that at theCommissioning and Demonstration stakeholdersmeeting the representative from the Government Landsand Survey sector advised that all key vector data hadbeen converted to WGS84 and would be available torelevant stakeholders.All equipment was tested and found to be fully functionaland operational and a survey was carried out on theHospital Feeder as specified in the Project Documents.In spite of the survey being carried out during the wetseason in Apia it was completed within the estimated 30working days (5 weeks where a week was 6 workingdays) where the target was attained though theenthusiasm and dedication of the survey that wereexperienced survey and line specialist EPC staff.The asset items captured on the Hospital Feederincluded some 630 Meters, 480 Poles and 34Transformers. A survey of the Beach Road Feeder wascommenced and both the main Tanugamano dieselgeneration plant and the Samasoni Hydro plant were fullysurveyed to provide a comprehensive data set for fullytesting the overall MIS/GIS and particularly the High andLow Voltage Line drawing and display algorithms overmultiple feeders and generators. The total asset itemscaptured and created (Lines) are shown in the followingtable.There are two separate Corporate Information Systems(CIS) at EPC with one being a fully featured AssetManagement System named DAFFRON that uses theIBM DB2 relational database engine and requires an IBMAS400 server. The other is a PREPAID system usingSUPRIMA that uses Sybase and is currently running ona Dell server with Microsoft Server 2003.
1 2 Pacific GIS&RS NEWS June, 2007
MIS/GIS Established at Samoa Electric Power Corporation
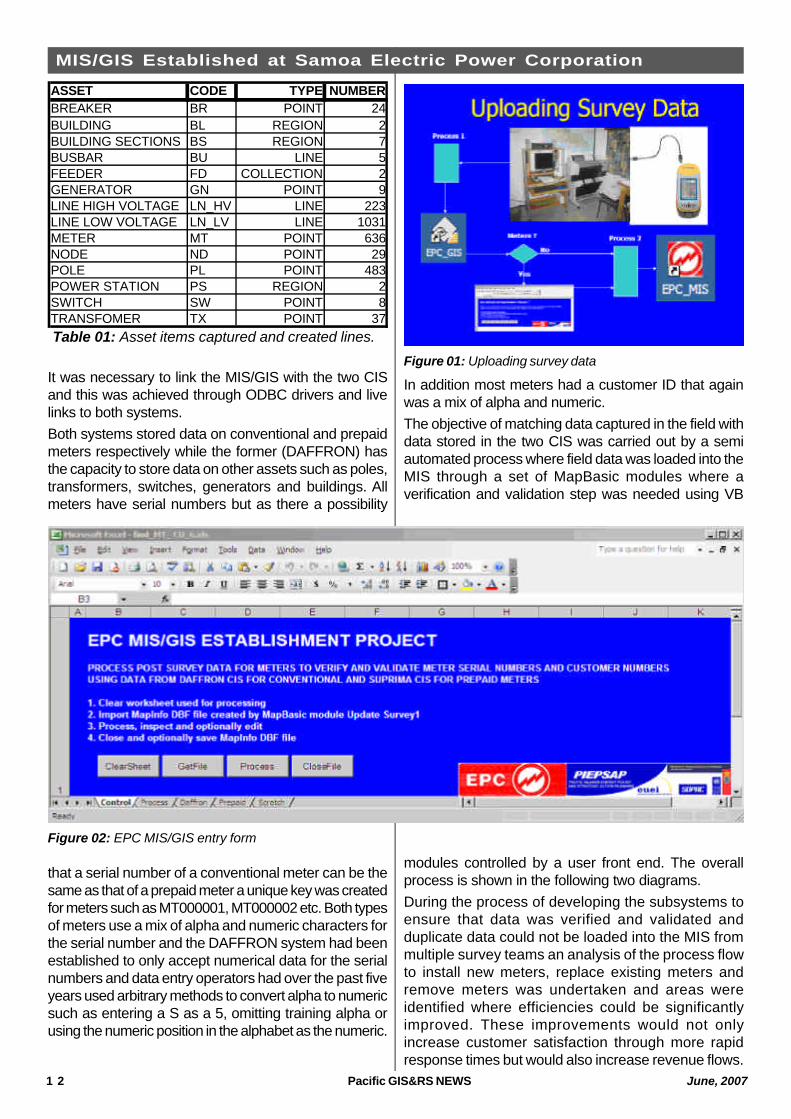
It was necessary to link the MIS/GIS with the two CISand this was achieved through ODBC drivers and livelinks to both systems.Both systems stored data on conventional and prepaidmeters respectively while the former (DAFFRON) hasthe capacity to store data on other assets such as poles,transformers, switches, generators and buildings. Allmeters have serial numbers but as there a possibility
that a serial number of a conventional meter can be thesame as that of a prepaid meter a unique key was createdfor meters such as MT000001, MT000002 etc. Both typesof meters use a mix of alpha and numeric characters forthe serial number and the DAFFRON system had beenestablished to only accept numerical data for the serialnumbers and data entry operators had over the past fiveyears used arbitrary methods to convert alpha to numericsuch as entering a S as a 5, omitting training alpha orusing the numeric position in the alphabet as the numeric.
In addition most meters had a customer ID that againwas a mix of alpha and numeric.The objective of matching data captured in the field withdata stored in the two CIS was carried out by a semiautomated process where field data was loaded into theMIS through a set of MapBasic modules where averification and validation step was needed using VB
modules controlled by a user front end. The overallprocess is shown in the following two diagrams.During the process of developing the subsystems toensure that data was verified and validated andduplicate data could not be loaded into the MIS frommultiple survey teams an analysis of the process flowto install new meters, replace existing meters andremove meters was undertaken and areas wereidentified where efficiencies could be significantlyimproved. These improvements would not onlyincrease customer satisfaction through more rapidresponse times but would also increase revenue flows.
ASSET CODE TYPE NUMBERBREAKER BR POINT 24BUILDING BL REGION 2BUILDING SECTIONS BS REGION 7BUSBAR BU LINE 5FEEDER FD COLLECTION 2GENERATOR GN POINT 9LINE HIGH VOLTAGE LN_HV LINE 223LINE LOW VOLTAGE LN_LV LINE 1031METER MT POINT 636NODE ND POINT 29POLE PL POINT 483POWER STATION PS REGION 2SWITCH SW POINT 8TRANSFOMER TX POINT 37Table 01: Asset items captured and created lines.
Figure 01: Uploading survey data
Figure 02: EPC MIS/GIS entry form

June, 2007 Pacific GIS&RS NEWS 13
MIS/GIS Established at Samoa Electric Power CorporationThe majority of assets had an associated picture andthe following diagram shows clockwise from upperright: buildings, breakers, generators, transformers,poles, meters prepaid and meters conventional.Finally the following Queries were created whereseveral followed requests from demonstrations to theSection Heads, the General Manager and finally to thefull stakeholders.
· Find EPC Asset· Simulate Cutting a Line
· HV Lines by Feeder· HV Lines Underground· LV Lines by Feeder· Lines by Phase· Meters Prepaid and Conventional· Poles by Owner· Poles with Telco Assets· Transformers by Feeder· Transformers by Total Consumption
Three examples follow and show the power of the EPCMIS/GIS for Management Decision making.As displayed in figure 04, the majority of EPC PowerPoles on this Feeder have various types of Telco assetsaffixed that include such items as a ConnectionTerminal (CT) with Heavy Cable (8), CT with Light Cable(42), Heavy Cable only (18), Light Cable only (235)and None (179).As displayed in figure 05 the Red phase (261) is overutilised, Yellow (176) and Blue (103) under utilised.As expected, the majority of customers are stillconnected with Conventional (520) meters againstPrepaid (126).For further information:
[email protected]@gmail.com
Figure 03: Assets captured in the target area.
Figure 04: Poles with Telco Assets
Figure 05: Lines by Phase
Figure 06: Meters Prepaid and Conventional

1 4 Pacific GIS&RS NEWS June, 2007
Mapping Complex Morphology and Marine Habitats from a Classic
"Charting the Yasawa Platform"
Mapping complex Morphology and MarineHabitats from a Classic Hydrographic
Survey
Robert Smith SOPAC
The Yasawa Islands and platform and its plate tectonicsignificance has long been the subject of study in theregion by many to unravel its geological evolution.However, until now, much of this shelf platform markingthe western boundary of the Fiji platform has neverbeen mapped this evident in many of the mappublished. This is illustrated Figure 1 is but one
example from the Fiji 1:250, 000 bathymetric seriespublished by the MineralResources Department of FijiPrevious resource surveyswere limited to geophysicalhydrocarbon surveys in theearly 70s with great difficultyexperienced in navigating theshelf waters due to theinadequate coverage ofexistent charts of the area.Kilometre-long streamerswould find uncharted shoals.The odd reconnaissancesurvey by organizationsinterested in the fisheriespotential of the shelf werealso not very exhaustive.Today a large portion of thevessel traffic in the Yasawaand Mamanuca Islands areoperated by the tourism
industry using modern GPS navigation systemsagainst backdrops based on practically non-existentchart data that has datum incompatibilities andcertainly not to modern-day standards. The “F – 5”,Figure 2 a chart released by the Fiji HydrographicDepartment in 1986, is the only available chart for theYasawa Islands and clearly indicated how much of
Figure 1 “ VIWA” Sheet 4 from the 1:250, 000 FijiBathymetric series
Figure 3: Track plot illustrating line coverage in subject area. Line spacingvariable ranging between 200 and 250 metres determined by water depth
Figure 2: A portion of the “F-5” chart illustrating the lack ofcharting and bathyntric detail of the Yasawa Platform westof Waya. Note Viwa is not on the chart of the platform andoutside the western boundary of the chart.

June, 2007 Pacific GIS&RS NEWS 15
Hydographic Surveythe area remained uncharted. Viwa Island the mostwestern island in the group lies on the western edge
With limited resources to survey an area of 4,000 km2
to modern-day standards the Fiji HydrographicDepartment sought theassistance of SOPAC for theuse of their multibeammapping system, a RESON8101, to jump start theirYasawa mappingprogramme. The principalobjective of the programmewas to produce a new chartfor the Yasawa andMamanuca group of islands.In 2005 four months ofsurvey work wascompleted; and in 2006another month. Thiscollaborative effort resultedin the acquisition of 5500 linekilometres of multibeam,sidescan and backscatterdata covering an area ofapproximately 2000km2,illustrated in figure 3 .Based on the results of themapping a new contour mapfor the platform was
generated. This is shown in figure 4. As such is thedetail in the data set contour interval on the platform
is 5 m from 0-200m waterdepth and 200m from 200m to2000 m.Seabed morphologyThe benefits of this combinedmapping exercise are justbeginning to unfold along withthe almost magical landscapeof the Yasawa platformheretofore hidden even fromprying remote imaging satellitesensors. The very complexseafloor morphology withnumerous patch reefs,drowned barrier reef systems,a network of structurallycontrolled valleys andchannels, fault scarps, fault-controlled basins dramatic forereef slopes with 500 m scarpshave now yielded their secrets.Offshore submarine canyondevelopment is surprisinglylimited. With such a complexmorphology a complexhydrodynamic flow regime islikely to exist across the
platform, hence a considerable diversity in the marinebiodiversity can y of these features are shown in figure
Figure 5 : Interpreted structural features of the Yasawa Shelf from the multibeamdata set
Figure 4: Contour map of the bathymetry of the Yasawa Shelf illustrating a complex.
1 6 Pacific GIS&RS NEWS June, 2007
Mapping Complex Morphology and Marine Habitats
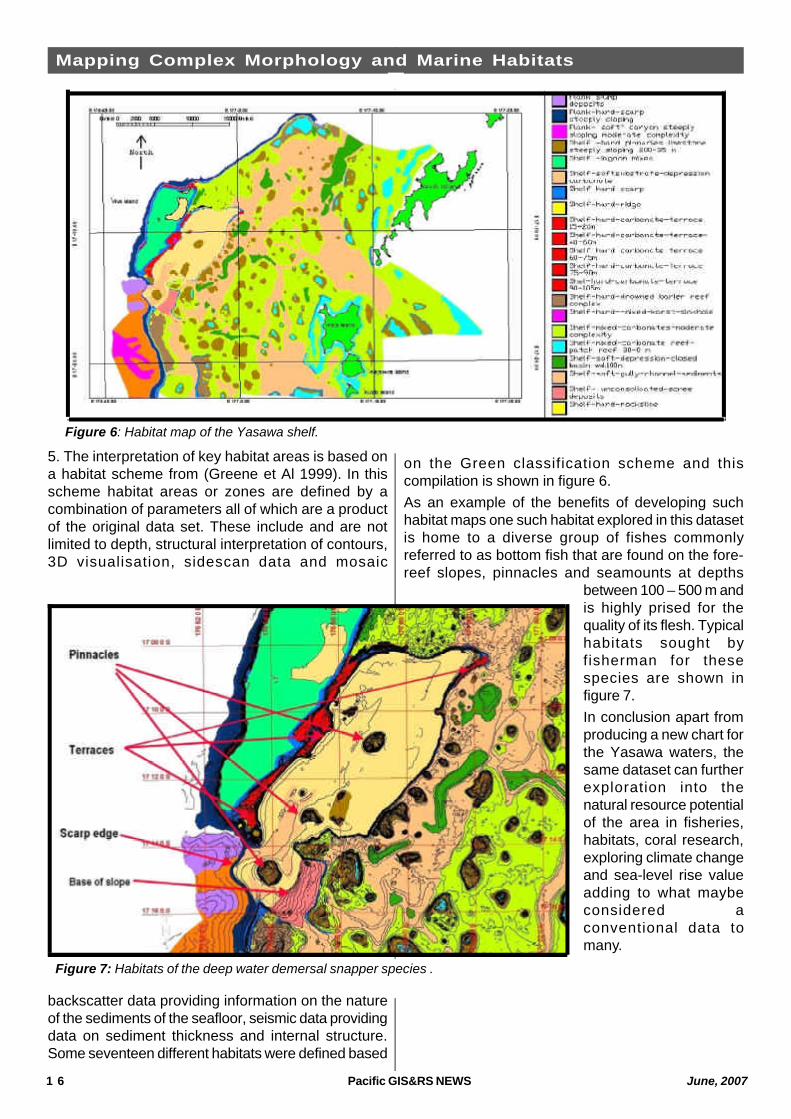
Figure 6: Habitat map of the Yasawa shelf.
5. The interpretation of key habitat areas is based ona habitat scheme from (Greene et Al 1999). In thisscheme habitat areas or zones are defined by acombination of parameters all of which are a productof the original data set. These include and are notlimited to depth, structural interpretation of contours,3D visualisation, sidescan data and mosaic
backscatter data providing information on the natureof the sediments of the seafloor, seismic data providingdata on sediment thickness and internal structure.Some seventeen different habitats were defined based
on the Green classification scheme and thiscompilation is shown in figure 6.As an example of the benefits of developing suchhabitat maps one such habitat explored in this datasetis home to a diverse group of fishes commonlyreferred to as bottom fish that are found on the fore-reef slopes, pinnacles and seamounts at depths
between 100 – 500 m andis highly prised for thequality of its flesh. Typicalhabitats sought byfisherman for thesespecies are shown infigure 7.In conclusion apart fromproducing a new chart forthe Yasawa waters, thesame dataset can furtherexploration into thenatural resource potentialof the area in fisheries,habitats, coral research,exploring climate changeand sea-level rise valueadding to what maybeconsidered aconventional data tomany.
Figure 7: Habitats of the deep water demersal snapper species .