p.415 spectrophotometry: instruments and applications exploring chemical analysis exploring chemical...
Post on 21-Dec-2015
243 views
TRANSCRIPT

P.415
Spectrophotometry: InstrumenSpectrophotometry: Instruments and applicationsts and applications
ExploringExploring ChemicalChemical AnalysisAnalysis
Fourth Edition
1919
歐亞書局

19-1 The Spectrophotometer

P.415
single-beam spectrophotometer

Double-beam spectrophotometer
Double-beam spectrophotometer

Figure 19-1
P.415
Figure 19-1
The double-beam spectrophotometer in Figure 19-1 features a rotating mirror (the beam chopper), which alternately directs light through the sample or reference cell several times per second.

Figure 19-2
P.416
Figure 19-2 shows a double-beam instrument and the layout of its components.

The two lamps in the upper part of Figure 19-2b provide visible or ultraviolet radiation.
P.416
Light SourceLight Source

Figure 19-3 P.417
An ordinary tungsten lamp, whose filament glows at a temperature near 3000 K, produces radiation in the visible and near-infrared regions at wavelengths of 320 to 2500 nm.
For ultraviolet spectroscopy, we normally employ a deuterium arc lamp in which a controlled electric discharge dissociates D2 molecules, which then emit ultraviolet radiation from 200 to 400 nm.

monochromator 單光器 disperses light into its component wavelengths selects a narrow band of wavelengths to pass through the sample.
P.417
A monochromator consists of:
• entrance slit
• exit slit
• grating - to disperse light

Figure 19-4
Figure 19-4 Czerny-Turner grating monochromator.
P.417
In the grating monochromator in Figure 19-4, polychromatic radiation from the entrance slit is collimated ( 對準成直線 ) by a concave mirror.
Figure 19-5 Principle of a reflection grating.

The closely spaced parallel grooves of the grating have a repeat distance d.
When light is reflected from the grating, each groove behaves as a source of radiation.
If adjacent light rays are in phase, they reinforce one another.
If they are out of phase, they cancel one another.
P.418
Principle of a reflection grating
Constructive interference and destructive interferenceConstructive interference and destructive interference

Rotating the reflection grating allows different Rotating the reflection grating allows different wavelengths to pass through the exit slit. wavelengths to pass through the exit slit.
The grating directs a narrow band of wavelengths to the exit slit.

Figure 19-7
P.419
Resolution of closely spaced bands, which requires a narrow slit width, can be achieved at the expense of decreased signal-to-noise ratio
Decreasing the exit slit width in monochromator decreases the selected bandwidth and decreases the energy reaching the detector.
sample
detector

Figure 19-7
P.419
For quantitative analysis, a monochromator bandwidth that is <1/5 of the width of the absorption band is reasonable.
monochromator bandwidth ↗
resolution↘

For a quantitative analysis, use a wavelength of maximum absorbance so that small errors in the wavelength do not change the absorption very much.

Choose a monochromator bandwidth (conChoose a monochromator bandwidth (controlled by exit slit) small enough thtat it dtrolled by exit slit) small enough thtat it does not distoret the band shape, but not so oes not distoret the band shape, but not so small that the spectrum is too noisy.small that the spectrum is too noisy.
Widening the bandwidth distorts the band shape.
In the lowest trace, a monochromator bandwidth that is 1/5 of the sharp absorption bands (measured at half the peak height) prevents distortion.

Types of monochromators:
(a) grating monochromator
(b) prism monochromator.
Figure 25-6, Skoog
diffraction diffraction 繞射繞射 : :
the bending of light rays is donthe bending of light rays is done by a grating (e by a grating ( 繞射光柵繞射光柵 ))
diffraction diffraction 折射折射 ::
the bending of light rays is dthe bending of light rays is done by a prism (one by a prism ( 分光稜鏡分光稜鏡 ))

不同頻率會有不同的波速經過稜鏡之後往不同方向前進
Open the slit to collect a specific range Open the slit to collect a specific range of wavelengths for measurement.of wavelengths for measurement.

DetectorDetector A detector produces an electric signal when it is struck by
photons.
Figure 19-8 shows that detector response depends on the wavelength of the incident photons.
P.419

Figure 19-9
P.420
A photomultiplier tube is a very sensitive detector.
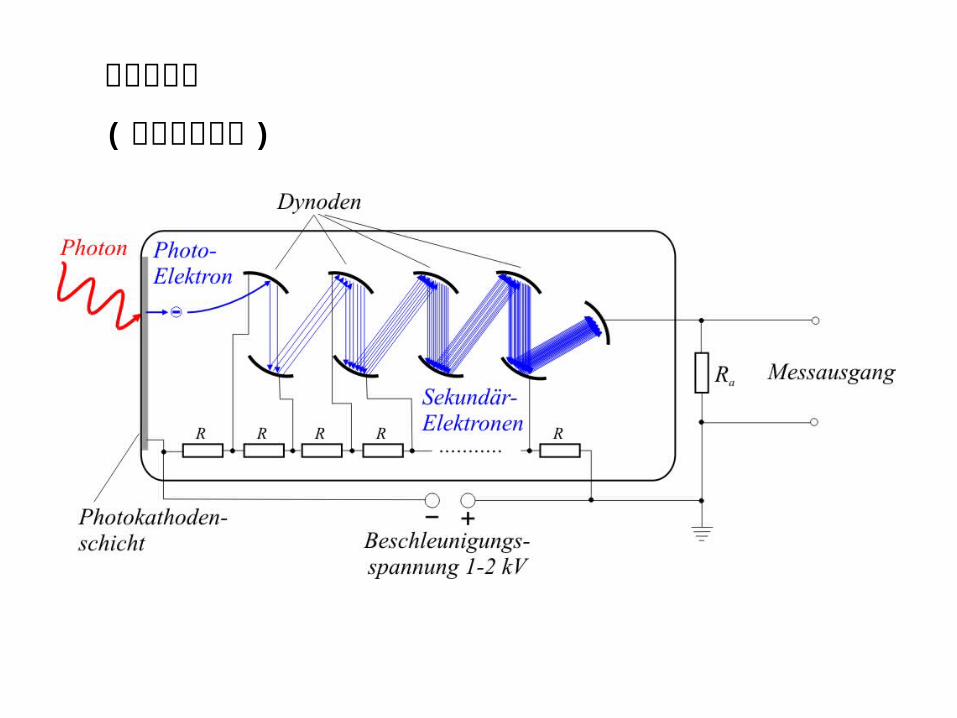
光電倍增管
( 放大偵測訊號 )

19-2 Analysis of a Mixture

When there is more than one absorbing species in a solution, the absorbance at a particular wavelength is the sum of absorbances from all species at that wavelength:
The molar absorptivity of different The molar absorptivity of different species at a particular wavelength.species at a particular wavelength.
How to determine [X], [Y], and [Z]?

For an unknown mixture containing [X] and [Y]For an unknown mixture containing [X] and [Y]
We choose wavelengths of maximum absorption for the individuWe choose wavelengths of maximum absorption for the individual components, X and Y, and measure the absorbances.al components, X and Y, and measure the absorbances.
absorbance at λabsorbance at λ’’ absorbance at λ’’absorbance at λ’’
NOTE: The molar absorptivities for the same species at different NOTE: The molar absorptivities for the same species at different wavelengths are not the same.wavelengths are not the same.
DD = = bb(ε(εXX’ε’εYY’’-ε’’-εYY’ε’εXX’’)’’)

Figure 19-12
Figure 19-12 Visible spectra of hydrogen peroxide complexes of Ti(IV)(1.32 mM), V(V)(1.89 mM), and an unknown mixture containing both.
At λ’ pure Ti complex has a maximal absorbance
At λ’’ pure V complex has a maximal absorbance
Take the absorbance at Take the absorbance at λ’ and λ’’, we can solve the [Ti-complex] and [V-complex] in the mixture in the mixture

ExampleExample : : Analysis of a Mixture with Equations 19-5
The molar absorptivities of X (the Ti complex) and Y (the V complex) in Figure 19-12 were measured with pure samples of each:
A mixture of X and Y in a 1.00-cm cell had an absorbance of A’= 0.722 at 406 nm and A’’=0.641 at 457 nm.
Find the concentrations of X and Y in the mixture.P.422

SOLUTIONSOLUTION ::
P.422

Isosbestic Points Isosbestic Points 等吸收點 We use this reaction to introduce the isosbestic point.We use this reaction to introduce the isosbestic point.
When pH > 5.1, there is more In-.
When pH < 5.1, there is more HIn.

Isosbestic PointsIsosbestic PointsIf species X is converted into species Y in the course of a chemical reaction, a spectrum of the mixture has an obvious, characteristic behavior, shown in Figure 19-13.
In- + H+ ↔ HIn pK2 = 5.1
Figure 19-13 Absorption spectrum of 3.7 ×10⁻⁴ M methyl red as a function of pH between pH 4.5 and 7.1.
Almost pure In- at pH 7.1
Almost pure HIn at pH 4.5

An isosbestic point observed during a chemical reaction is good evidence that only two principal species are present.
If the spectra of pure X and Y cross each other at some waveIf the spectra of pure X and Y cross each other at some wavelength, then every spectrum recorded during the X length, then every spectrum recorded during the X ↔Y reaction crosses the same point, called an isosbestic point.

An isosbestic point occurs when εAn isosbestic point occurs when εXX = ε = εYY and [X]+[Y] is constant. and [X]+[Y] is constant.
pure X
pure Y
At this wavelength, pure X and pure Y have the same absorptivity (εX = εY ).
For the X ↔Y reaction, [X]+[Y] stays constant, so the absorbance stays the same at this wavelength.

Figure 19-13In- + H+ ↔ HIn pK2 = 5.1
constant

An isosbestic point observed during a chemical reaction is good evidence that only two principal species are present.
For X For X ↔Y reaction

19-3 Spectrophotometric Titrations

with a absorbance maximum at 465 nm
Fe3+
apotransferrin

Figure 19-14
P.424
Figure 19-14 Each of the two Fe-binding sites of transferrin is located in a cleft in the protein. Each site has one nitrogen ligand from the amino acid histidine and three oxygen ligands from tyrosine and aspartic acid.

1. When the Fe3+ transferrin complex is formed, the absorbance at 465 nm develops
2. When the protein is saturated with Fe3+, the curve levels off.
3.3. The end point is the extrapolated intersection of the two straight lines.
NOTE: the absorbance rises slowly because NOTE: the absorbance rises slowly because FeFe3+3+ has some absorbance at 465 nm. has some absorbance at 465 nm.

Figure 19-15 shows the titration of 2.000 mL of apotransferrin with 1.79×10⁻³ M ferric nitrilotriacetate.

Figure 19-15
Figure 19-15 Spectrophotometric titration of apotransferrin with ferric nitrilotriacetate. Absorbance is corrected for dilution. The initial absorbance of the solution, before iron is added, is due to a colored impurity.
P.425

Example:
Correcting Absorbance for the Effect of Dilution
The absorbance measured after adding 125 μL(= 0.125 mL) of ferric nitrilotriacetate to 2.000 mL of apotransferrin was 0.260.
Calculate the corrected absorbance that should be plotted in Figure 19-15.
SOLUTION:SOLUTION:

19-4 What Happens When a Molecule
Absorbs Light?

excited state are shown in Figure 19-16.
Electronic States of FormaldehydeElectronic States of Formaldehyde Molecular orbitals describe the distribution of elec
trons in a molecule, just as atomic orbitals describe the distribution of electrons in an atom. In Figure 19-17, four low-lying orbitals of formaldehyde, labeled σ1 through σ4, are each occupied by a pair of electrons with opposite spin (spin quantum numbers= +1/2 and -1/2 represented by ↑and↓).
P.425

Figure 19-16
Figure 19-16 Geometry of formaldehyde in its ground state (S0) and lowest excited singlet state (S1).
P.425

Figure 19-17
P.426
Figure 19-17 Molecular orbital diagram of formaldehyde, showing energy levels and orbital shapes. The coordinate system was shown in Figure 19-16.

In a electronic transition, an electron moves from one orbital to another.
There are actually two possible transitions, depending on the spin quantum numbers in the excited state. The state in which the spins are opposed in Figure 19-18 is called a singlet state.
If spins are parallel, the excited state is a tiplet state.
P.426

Figure 19-18
P.426
Figure 19-18 Two possible electronic states arising from an n→π* transition. The terms singlet and triplet are used because a triplet state splits into three slightly different energy levels in a magnetic field, but a singlet state is not split.

Vibration and Rotational States of FormaldehydeVibration and Rotational States of Formaldehyde The six modes of vibration of formaldehyde are sh
own in Figure 19-19.
Combined Electronic, Vibrational, and Rotational Combined Electronic, Vibrational, and Rotational
TransitionsTransitions Electronic absorption bands are usually very broa
d (~100 nm in Figure 18-5 and 18-9) because many different vibrational and rotational levels are excited at slightly different energies.

Figure 19-19
P.427
Figure 19-19 The six modes of vibration of formaldehyde. The wavenumber of infrared radiation needed to stimulate each kind of motion is given in units of reciprocal centimeters, cm-1.

What Happens to Absorbed Energy?What Happens to Absorbed Energy? Suppose that absorption of a photon promotes a
molecule from the ground electronic state, S0, to a vibrationally and rotationally excited level of the excited electronic state S1 (Figure 19-20).
P.427

Figure 19-20
Figure 19-20 Physical processes that can occur after a molecule absorbs an ultraviolet or visible photon. S0 is the ground electronic state. S1 and T1 are the lowest excited singlet and triplet states, respectively. Straight arrows represent processes involving photons, and wavy arrows are radiationless transitions. R is vibrational relaxation.
P.427

.
.
P.428

.
.
P.428

Figure 19-21 compares absorption and fluorescence spectra of anthracene. Fluorescence comes at lower energy and is roughly the mirror image of absorption. To understand the mirror image relation, consider the energy levels in Figure 19-22.
Photochemistry is a chemical reaction initiated by absorption of light.
Some chemical reactions (not initiated by light) release energy in the form of light, which is called chemiluminescence.
P.429

Figure 19-21
P.429
Figure 19-21 Spectra of anthracene show typical approximate mirror image relationship between absorption and fluorescence. Fluorescence comes at lower energy.

Figure 19-22
Figure 19-22 Energy-level diagram showing why structure is seen in the absorption and emission spectra and why the spectra are roughly mirror images.
P.429

19-5 Luminescence in Analytical Chemistry

Luminescence is any emission of electromagnetic radiation and includes fluorescence, phosphorescence, and other possible processes. In Figure 19-23, luminescence is measured by exciting a sample at a wavelength that it absorbs (λexcitation) and observing at the wavelength of maximum emission (λemission).
P.430

For quantitative analysis, the intensity of luminescence (I) is proportional to the concentration of the emitting species (c) over some limited concentration range:
.
P.431

Color plate20
P.431

Fluorimetric Assay of Selenium in Brazil NutsFluorimetric Assay of Selenium in Brazil Nuts Hydrogen selenate (H2SeO4) in the digest is redu
ced to hydrogen selenite (H2SeO3) with hydroxylamine (NH2OH).
Selenite is then derivatized to form a fluorescent product that is extracted into cyclohexane.
P.431

Maximum response of the fluorescent product was observed with an excitation wavelength of 378 nm and an emission wavelength of 518 nm. The fluorescence calibration curve in Figure 19-25 is linear.
Absorption of excitation energy by neighboring molecules of the same substance is called self-absorption.
P.431

ImmunoassaysImmunoassays Figure 19-26 illustrates the principle of an enzym
e-linked immunosorbent assay, abbreviated ELISA in biochemical literature.
Figure 19-27 Enzyme bound to antibody 2 can catalyze reactions that produce (a) colored or (b) fluorescent products.
P.432

Figure 19-25
P.432
Figure 19-25 Fluorescence calibration curve for the selenium-containing product.

Figure 19-26
Figure 19-26 Enzyme-linked immunosorbent assay.
P.432

Figure 19-27
Figure 19-27 Enzyme bound to antibody 2 can catalyze reactions that produce (a) colored or (b) fluorescent products.
P.432