p-wave velocity structure of the southern ryukyu margin ... · pdf filep-wave velocity...
TRANSCRIPT
Tectonophysics xxx (2011) xxx–xxx
TECTO-125258; No of Pages 13
Contents lists available at SciVerse ScienceDirect
Tectonophysics
j ourna l homepage: www.e lsev ie r .com/ locate / tecto
P-wave velocity structure of the southern Ryukyu margin east of Taiwan: Resultsfrom the ACTS wide-angle seismic experiment
F. Klingelhoefer a,⁎, T. Berthet b, S. Lallemand b, P. Schnurle a, C.-S. Lee c, C.-S. Liu d,K. McIntosh e, T. Theunissen b
a Dep. of Marine Geosciences, IFREMER, Centre de Brest, B.P. 70, 29280 Plouzané, Franceb Geosciences Montpellier, Université Montpellier 2, CNRS, Francec Department of Geophysics, NTOU, Keelung, Taiwand Institute of Oceanography, NTU, Taipei, Taiwane Institute of Geophysics, Univ. of Texas, USA
⁎ Corresponding author.E-mail address: [email protected] (F. Klingelhoefer
0040-1951/$ – see front matter © 2011 Elsevier B.V. Alldoi:10.1016/j.tecto.2011.10.010
Please cite this article as: Klingelhoefer, F.,ACTS wide-angle seismic experiment, Tecto
a b s t r a c t
a r t i c l e i n f oArticle history:Received 25 March 2011Received in revised form 15 September 2011Accepted 3 October 2011Available online xxxx
Keywords:Ryukyu TrenchMarine seismicsWide-angle seismicsSubduction processes
An active seismic experiment has been conducted across the southern Ryukyu margin east of Taiwan over thewhole trench-arc-backarc system in May 2009. Twenty-four ocean bottom seismometers (OBS) weredeployed from the Ryukyu trench to the southern Okinawa trough over the Ryukyu arc and forearc. Wideangle seismic data were recorded by the OBS array while coincident reflection seismic data were acquiredusing a 6 km long streamer and a 6600 cubic inch seismic airgun array. Results from tomographic inversionof 21091 travel time picks along this line allowed us to image crustal structures of the Ryukyu margin downto a depth of 25 km. The transect has been designed to provide a better seismic velocity structure of the sub-duction zone in a highly deformed area that has produced an M8 earthquake in 1920. The line crosses a seis-mic cluster of earthquakes which source mechanisms are still poorly understood. The subducting oceaniccrust of the Huatung Basin is about 5–6 km thick. The underlying mantle exhibits low seismic velocitiesaround 7.8 km/s suggesting some hydrothermal alterations or alteration of the upper mantle through faultsgenerated by the flexure of the subducting plate as it enters the subduction. Low velocities, up to 4.5 km/s,associated with the accretionary wedge are well imaged from the trench back to the Nanao forearc. Amajor result concerns the abrupt termination of the buttress at the rear of the accretionary wedge. Despitethe low resolution of the tomographic inversion near the subduction interface, several lines of evidencesupporting the presence of a low velocity zone beneath the toe of the forearc buttress could be established.The Moho beneath the Ryukyu non-volcanic arc is located at a depth around 25 km depth.
© 2011 Elsevier B.V. All rights reserved.
1. Introduction and previous work
The Philippine Sea Plate (PSP) converges toward the Eurasia plate(EP) near Taiwan at a rate close to 8 cm/yr in a WNW direction (Senoet al., 1993; Yu et al., 1997). East of Taiwan, the PSP subducts north-ward beneath the southern Ryukyu arc (Fig. 1). The north-trendingPSP slab edge, carrying the extinct north Luzon volcanic arc, is sharplytraced by the interruption of its Benioff zone beneath northernTaiwan along 121° 30 min E. The PSP abuts in this region againsteither the east-subducting EP slab in depth or the Taiwan orogen atcrustal levels. The southernmost Ryukyu subduction zone is thushighly deforming in response to the arc-continent collision thatoccurs in Taiwan. As a consequence, the forearc area east of the islandrecords a very high level of seismicity (e.g., Chen et al., 2009), with
).
rights reserved.
et al., P-wave velocity structunophysics (2011), doi:10.10
some clustering along probable active faults (e.g., Font andLallemand, 2009). Hsu and Sibuet (2005) have suggested that thesouthern Ryukyu subduction zones had similar geometrical andtectonic characteristics than the Andaman subduction zone thatunderwent a giant Mw 9.2 event in 2004. One of the main aims ofthis work is thus to better image the crustal structure in this area inorder to better constrain the source of the seismicity.
One of thefirstwide-angle seismic surveys conducted southof Taiwanconstrained the nature of the crust in the South China Sea Basin to beoceanic and bounded to the north and south by continental type crust(Ludwig et al., 1979). From modelling of three wide-angle seismic lines,Murauchi et al. (1968) deduced, that the crust underlying the OkinawaTrough is generally similar to that of continental crust, with a Mohodepth of 12 km in the eastern Okinawa Trough thinning towards thenorthwest. Leyden et al. (1973) correlated offshore refraction velocitieswith onland drilling and refraction data to propose a crustal structure inthe Okinawa Trough. Based on models from wide-angle seismic data,Hagen et al. (1988) propose the nature of the crust east of Taiwan and
re of the southern Ryukyu margin east of Taiwan: Results from the16/j.tecto.2011.10.010
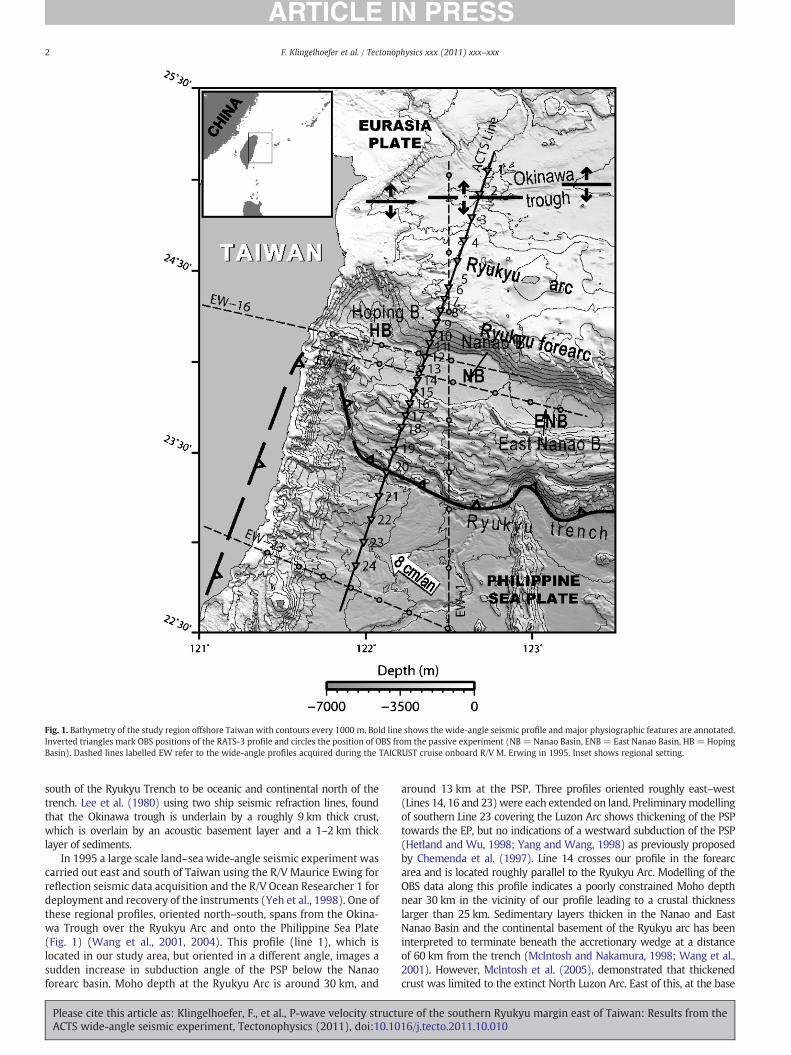
Fig. 1. Bathymetry of the study region offshore Taiwan with contours every 1000 m. Bold line shows the wide-angle seismic profile and major physiographic features are annotated.Inverted triangles mark OBS positions of the RATS-3 profile and circles the position of OBS from the passive experiment (NB = Nanao Basin, ENB = East Nanao Basin, HB = HopingBasin). Dashed lines labelled EW refer to the wide-angle profiles acquired during the TAICRUST cruise onboard R/V M. Erwing in 1995. Inset shows regional setting.
2 F. Klingelhoefer et al. / Tectonophysics xxx (2011) xxx–xxx
south of the Ryukyu Trench to be oceanic and continental north of thetrench. Lee et al. (1980) using two ship seismic refraction lines, foundthat the Okinawa trough is underlain by a roughly 9 km thick crust,which is overlain by an acoustic basement layer and a 1–2 km thicklayer of sediments.
In 1995 a large scale land–sea wide-angle seismic experiment wascarried out east and south of Taiwan using the R/V Maurice Ewing forreflection seismic data acquisition and the R/V Ocean Researcher 1 fordeployment and recovery of the instruments (Yeh et al., 1998). One ofthese regional profiles, oriented north–south, spans from the Okina-wa Trough over the Ryukyu Arc and onto the Philippine Sea Plate(Fig. 1) (Wang et al., 2001, 2004). This profile (line 1), which islocated in our study area, but oriented in a different angle, images asudden increase in subduction angle of the PSP below the Nanaoforearc basin. Moho depth at the Ryukyu Arc is around 30 km, and
Please cite this article as: Klingelhoefer, F., et al., P-wave velocity structuACTS wide-angle seismic experiment, Tectonophysics (2011), doi:10.10
around 13 km at the PSP. Three profiles oriented roughly east–west(Lines 14, 16 and 23)were each extended on land. Preliminarymodellingof southern Line 23 covering the Luzon Arc shows thickening of the PSPtowards the EP, but no indications of a westward subduction of the PSP(Hetland and Wu, 1998; Yang and Wang, 1998) as previously proposedby Chemenda et al. (1997). Line 14 crosses our profile in the forearcarea and is located roughly parallel to the Ryukyu Arc. Modelling of theOBS data along this profile indicates a poorly constrained Moho depthnear 30 km in the vicinity of our profile leading to a crustal thicknesslarger than 25 km. Sedimentary layers thicken in the Nanao and EastNanao Basin and the continental basement of the Ryukyu arc has beeninterpreted to terminate beneath the accretionary wedge at a distanceof 60 km from the trench (McIntosh and Nakamura, 1998; Wang et al.,2001). However, McIntosh et al. (2005), demonstrated that thickenedcrust was limited to the extinct North Luzon Arc. East of this, at the base
re of the southern Ryukyu margin east of Taiwan: Results from the16/j.tecto.2011.10.010

3F. Klingelhoefer et al. / Tectonophysics xxx (2011) xxx–xxx
of the slope, the OBS data require normal to slightly thin oceanic crust.They found no evidence of significant deformation east of the arc. Line16, sub-parallel to Line 14 in the forearc (see Fig. 1) images the top ofthe subducting PSP at depths between 20 and 25 km (McIntosh et al.,2005; Wang and Chiang, 1998).
An active seismic cluster has been imaged in the forearc area usingrelocations of 1139 events recorded on both Taiwanese and Japaneseland stations from 1992 and 1997 in a 3D velocity model (Font andLallemand, 2009; Font et al., 2003). These clustered events mainlyalign with geomorphological features such as the Hoping canyon atthe surface or the Hoping basement rise in depth. Even if a few ofthem locate onto the subduction interface, most of them occur withinthe upper plate, often at shallow depths. Focal mechanisms withinthe shallow group indicate either a high-angle backthrust dippingsouth or a north dipping low-angle thrust (Font and Lallemand,2009; Font et al., 2003). Together with additional data the authorspropose the existence of an active splay fault, probably resultingfrom the subduction of an oceanic relief and causing the abnormalseismic activity (Font and Lallemand, 2009). Such splay faults,connected onto the subduction plate interface, are able to generatea mega-thrust earthquake such as those known in Nankai or Sumatra.At the same time, the authors were puzzled by both the shallownessof most events and the fact that no surface evidence of splay faultemergence was observed. They thus questioned the accuracy ofearthquake location with a large azimuthal gap in land stations withrespect to the offshore events. In order to better constrain the seismicactivity in this highly deformed region, two seismic experimentswere conducted: one active during which a combined wide-angleand reflection seismic profile was acquired across the Ryukyu arceast of Taiwan, and a passive one consisting of 3-month passiverecording of the natural seismicity in the study area (see Theunissenet al., this volume).
2. OBS data acquisition and preprocessing
During theRATS-3 (RyukyuActive Tectonics) cruise in 2009, one com-binedwide-angle and reflection seismic profile of 300 km lengthwas shotspanning from the Okinawa basin and crossing the Ryukyu subductionsystem(Fig. 1). This cruisewas part of themulti-disciplinaryACTS (ACtiveTectonics and Seismicity in Taiwan) research proposal. 24 ocean-bottomseismometers (OBS) were deployed along the profile, at an interval of14–15 km but it was denser (7–8 km) in the seismically active area inthe central part of the profile. These instruments included 19 OBS fromthe Ifremer (French Research Institute for Exploration of the Sea) pooland 5 instruments from NTOU (National Taiwan Ocean University)(Auffret et al., 2004). All instruments recorded usable data on all fourchannels. The RATS experiment was combined with the larger TAIGER(TAiwan Integrated GEodynamics Research) onshore–offshore experi-ment (Kuo-Chen et al., 2008; Langston et al., 2009; Lester et al., 2010).
Pre-processing of the OBS data included calculation of the clock-drift corrections to adjust the clock in each instrument to the GPSbase time. Instrument locations were corrected for drift from thedeployment position during their descent to the seafloor using thedirect water wave arrival. The first arrival water wave was picked inthe unfiltered data and the discrepancy between the predicted arrivaltime and the observed arrival time was calculated for 100 evenlyspaced positions around the deployment position of the instrument(Fig. 2). The best fitting position was subsequentially selected as inputfor a second iteration using a smaller space increment. Deploymentand relocated positions and the distance between these are given inTable 1. Although the complete distance was as big as 560 m for someinstruments, the inline drift, more important for the 2D modellingpresented in this paper, did generally not exceed 200–300 m. Pickingof the onset of first and secondary arrivals was performed withoutfiltering where possible (mostly between offsets of 0–40 km). Furtherprocessing of the data to facilitate picking at further offsets included
Please cite this article as: Klingelhoefer, F., et al., P-wave velocity structuACTS wide-angle seismic experiment, Tectonophysics (2011), doi:10.10
deconvolution, application of a 5 to 15 Hz Butterworth filter andequalisation. Data quality along the profile was generally very goodwith clear arrivals to offsets over 100 km between the ship and thesea-floor instrument (Fig. 3 A). Clear PmP reflections can be identifiedon most instruments located on the Philippine Sea Plate, in the RyukyuArc area and in the Okinawa Trough (Fig. 3 B). Mantle velocities couldbe constrained from turning wave arrivals from the upper mantle onsome instruments located in the Okinawa Trough and on the PhilippineSea Plate (Fig. 3 C).
3. Multichannel seismic data processing
A coincident reflection seismic line MGL0906-12 was shot by theR/V Marcus Langseth (Fig. 4). A total of 3057 shots were fired onthe profile by a 6600 in3 tuned airgun array of the R/V MarcusLangseth. These shots were recorded by a 6.0 km 468 channelssolid-state seismic streamer with 468 channels and a length of6 km. The multi-channel seismic reflection data of MGL0906-12were processed at the Institute of Oceanography, National TaiwanUniversity, with the ProMAX (Landmark) seismic processing soft-ware. The data are of high quality, with an excellent signal-to-noiseratio, relatively flat spectral content, and a well shaped source signa-ture. As a result, no significant improvement was achieved duringsource designature and spiking predictive deconvolution, and theprofiles presented in this study were processed with no deconvolu-tion. The processing sequence is composed of geometry (includingstreamer feathering), cdp binning at 12.5 m interval and sorting,band-pass filter (2–16–64–96 Hz), re-sampling from 2 to 4 ms. Aftervelocity analysis, true amplitude recovery was applied, normal move-out, multiple attenuation, time variant band-pass filter (from 2–16–48–64 at sea bottom to 2–16–32–48 Hz 3 s below), inside and out-sidemute, stack, and post-stack time variant band-pass filter and Kirchhofftime migration. Two passes of semblance velocity analysis (at 500 then250 cdp) were performed on 8 cdp super-gathers (full fold of 468 chan-nels), using the velocities of the tomographic inversion of theOBS recordsas guide function in order to constrain stacking velocities at depthwheresemblance is poor. Multiple attenuation was achieved with an FK-filterapplied to super-gathers of 4 cdps (half fold at 25 m trace interval).More-over, an additional radon velocity filter (from 25% below to 50% above)was applied to the south-western portion of the profile in order to furtherattenuate multiples that compromise seismic imaging of the subductingPSP underneath8 the accretionary prism. However in this area, structuresare poorly imaged: rough topography, little continuity in the reflectors,and steep dips result in high noise and short lived features on the seismicprofile.
4. Tomographic inversion
The tomographic inversion code FAST (Zelt and Barton, 1998) wasfurther used to construct a first velocity model. This model alsoserved as an initial guideline to the forward modelling, describedhereafter. This non-linear tomographic approach consists in a regu-larised inversion in which user specified parameters weight thefinal solution in terms of travel time misfit and model roughness.The method is linearised in that a starting model and iterativeconvergence scheme are employed. Non linearity is accounted forby calculating new ray paths at each iteration. The method generatessmooth models which do not resolve sharp boundaries but steepervelocity gradients instead. The most important structural features arethus resolved in an objective manner, i.e., not user-oriented. Additionalinformation from secondary arrivals and gravity modelling were notincorporated into the inversion in order to keep the approach objective.In order to perform this tomographic inversion of the first arrivals,16,807 travel-times have been picked in the complete dataset. Eachpick has been associated to a picking error between 20ms and 150 msdepending on the data quality. The tomographic model used a grid of
re of the southern Ryukyu margin east of Taiwan: Results from the16/j.tecto.2011.10.010
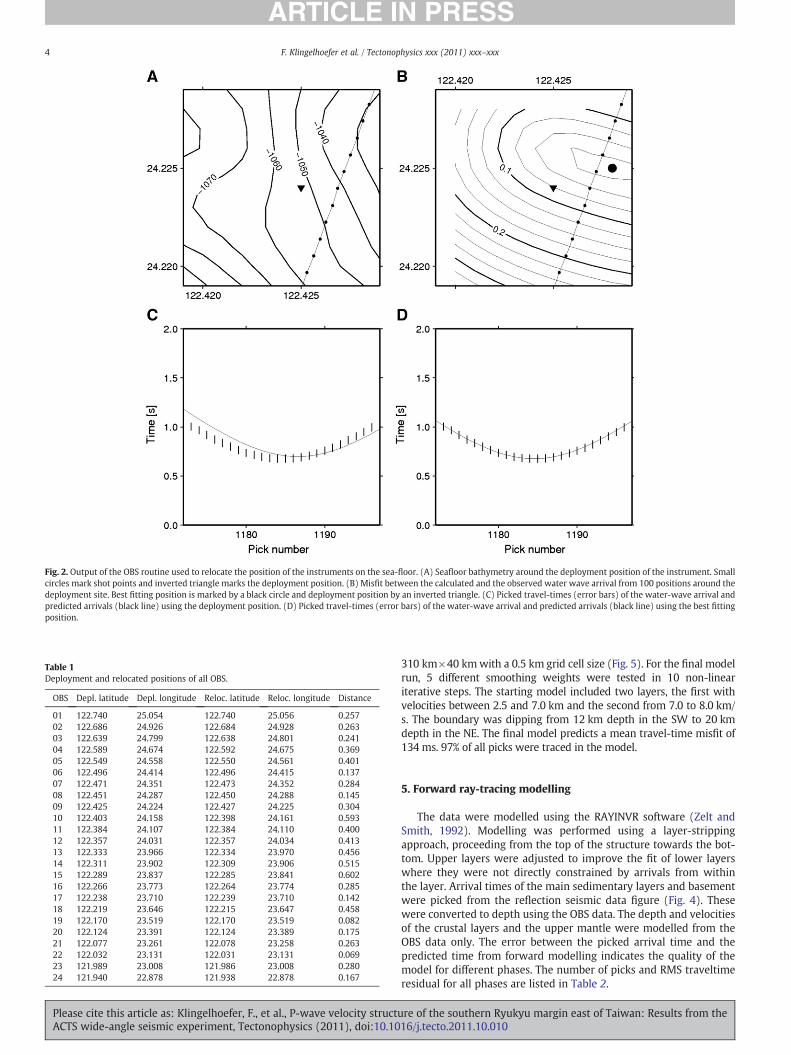
Fig. 2. Output of the OBS routine used to relocate the position of the instruments on the sea-floor. (A) Seafloor bathymetry around the deployment position of the instrument. Smallcircles mark shot points and inverted triangle marks the deployment position. (B) Misfit between the calculated and the observed water wave arrival from 100 positions around thedeployment site. Best fitting position is marked by a black circle and deployment position by an inverted triangle. (C) Picked travel-times (error bars) of the water-wave arrival andpredicted arrivals (black line) using the deployment position. (D) Picked travel-times (error bars) of the water-wave arrival and predicted arrivals (black line) using the best fittingposition.
Table 1Deployment and relocated positions of all OBS.
OBS Depl. latitude Depl. longitude Reloc. latitude Reloc. longitude Distance
01 122.740 25.054 122.740 25.056 0.25702 122.686 24.926 122.684 24.928 0.26303 122.639 24.799 122.638 24.801 0.24104 122.589 24.674 122.592 24.675 0.36905 122.549 24.558 122.550 24.561 0.40106 122.496 24.414 122.496 24.415 0.13707 122.471 24.351 122.473 24.352 0.28408 122.451 24.287 122.450 24.288 0.14509 122.425 24.224 122.427 24.225 0.30410 122.403 24.158 122.398 24.161 0.59311 122.384 24.107 122.384 24.110 0.40012 122.357 24.031 122.357 24.034 0.41313 122.333 23.966 122.334 23.970 0.45614 122.311 23.902 122.309 23.906 0.51515 122.289 23.837 122.285 23.841 0.60216 122.266 23.773 122.264 23.774 0.28517 122.238 23.710 122.239 23.710 0.14218 122.219 23.646 122.215 23.647 0.45819 122.170 23.519 122.170 23.519 0.08220 122.124 23.391 122.124 23.389 0.17521 122.077 23.261 122.078 23.258 0.26322 122.032 23.131 122.031 23.131 0.06923 121.989 23.008 121.986 23.008 0.28024 121.940 22.878 121.938 22.878 0.167
4 F. Klingelhoefer et al. / Tectonophysics xxx (2011) xxx–xxx
Please cite this article as: Klingelhoefer, F., et al., P-wave velocity structuACTS wide-angle seismic experiment, Tectonophysics (2011), doi:10.10
310 km×40 kmwith a 0.5 km grid cell size (Fig. 5). For the final modelrun, 5 different smoothing weights were tested in 10 non-lineariterative steps. The starting model included two layers, the first withvelocities between 2.5 and 7.0 km and the second from 7.0 to 8.0 km/s. The boundary was dipping from 12 km depth in the SW to 20 kmdepth in the NE. The final model predicts a mean travel-time misfit of134 ms. 97% of all picks were traced in the model.
5. Forward ray-tracing modelling
The data were modelled using the RAYINVR software (Zelt andSmith, 1992). Modelling was performed using a layer-strippingapproach, proceeding from the top of the structure towards the bot-tom. Upper layers were adjusted to improve the fit of lower layerswhere they were not directly constrained by arrivals from withinthe layer. Arrival times of the main sedimentary layers and basementwere picked from the reflection seismic data figure (Fig. 4). Thesewere converted to depth using the OBS data. The depth and velocitiesof the crustal layers and the upper mantle were modelled from theOBS data only. The error between the picked arrival time and thepredicted time from forward modelling indicates the quality of themodel for different phases. The number of picks and RMS traveltimeresidual for all phases are listed in Table 2.
re of the southern Ryukyu margin east of Taiwan: Results from the16/j.tecto.2011.10.010
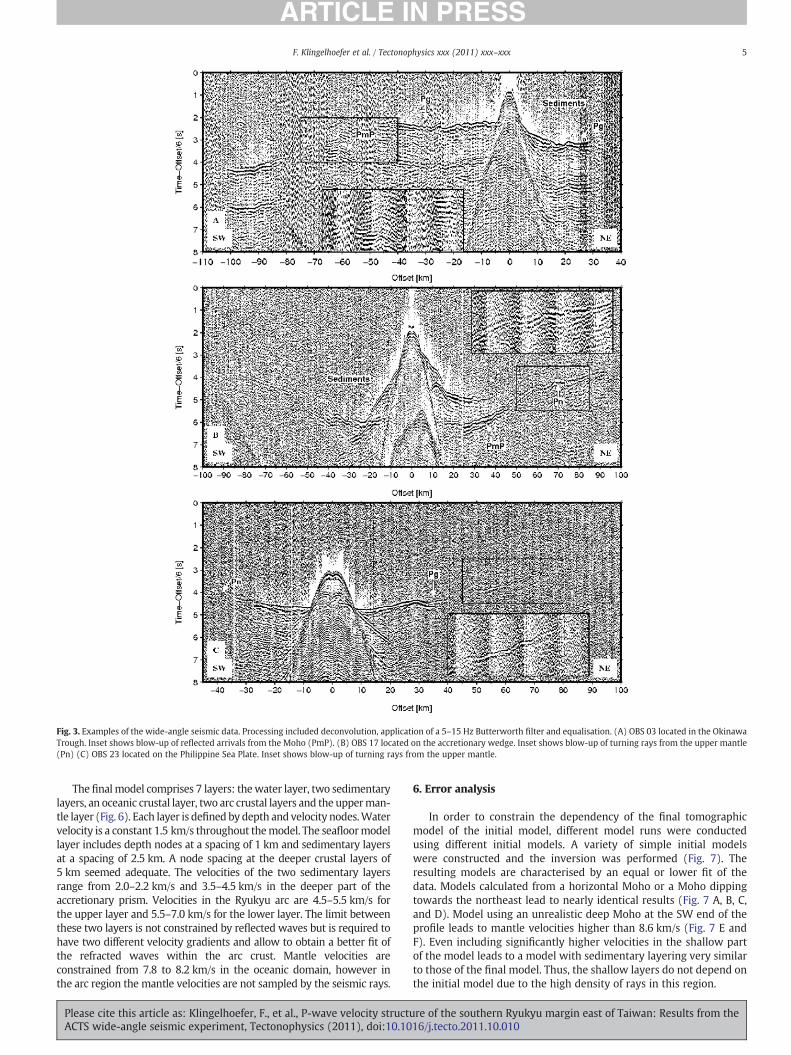
Fig. 3. Examples of the wide-angle seismic data. Processing included deconvolution, application of a 5–15 Hz Butterworth filter and equalisation. (A) OBS 03 located in the OkinawaTrough. Inset shows blow-up of reflected arrivals from the Moho (PmP). (B) OBS 17 located on the accretionary wedge. Inset shows blow-up of turning rays from the upper mantle(Pn) (C) OBS 23 located on the Philippine Sea Plate. Inset shows blow-up of turning rays from the upper mantle.
5F. Klingelhoefer et al. / Tectonophysics xxx (2011) xxx–xxx
The finalmodel comprises 7 layers: thewater layer, two sedimentarylayers, an oceanic crustal layer, two arc crustal layers and the upperman-tle layer (Fig. 6). Each layer is defined by depth and velocity nodes.Watervelocity is a constant 1.5 km/s throughout themodel. The seafloormodellayer includes depth nodes at a spacing of 1 km and sedimentary layersat a spacing of 2.5 km. A node spacing at the deeper crustal layers of5 km seemed adequate. The velocities of the two sedimentary layersrange from 2.0–2.2 km/s and 3.5–4.5 km/s in the deeper part of theaccretionary prism. Velocities in the Ryukyu arc are 4.5–5.5 km/s forthe upper layer and 5.5–7.0 km/s for the lower layer. The limit betweenthese two layers is not constrained by reflected waves but is required tohave two different velocity gradients and allow to obtain a better fit ofthe refracted waves within the arc crust. Mantle velocities areconstrained from 7.8 to 8.2 km/s in the oceanic domain, however inthe arc region the mantle velocities are not sampled by the seismic rays.
Please cite this article as: Klingelhoefer, F., et al., P-wave velocity structuACTS wide-angle seismic experiment, Tectonophysics (2011), doi:10.10
6. Error analysis
In order to constrain the dependency of the final tomographicmodel of the initial model, different model runs were conductedusing different initial models. A variety of simple initial modelswere constructed and the inversion was performed (Fig. 7). Theresulting models are characterised by an equal or lower fit of thedata. Models calculated from a horizontal Moho or a Moho dippingtowards the northeast lead to nearly identical results (Fig. 7 A, B, C,and D). Model using an unrealistic deep Moho at the SW end of theprofile leads to mantle velocities higher than 8.6 km/s (Fig. 7 E andF). Even including significantly higher velocities in the shallow partof the model leads to a model with sedimentary layering very similarto those of the final model. Thus, the shallow layers do not depend onthe initial model due to the high density of rays in this region.
re of the southern Ryukyu margin east of Taiwan: Results from the16/j.tecto.2011.10.010
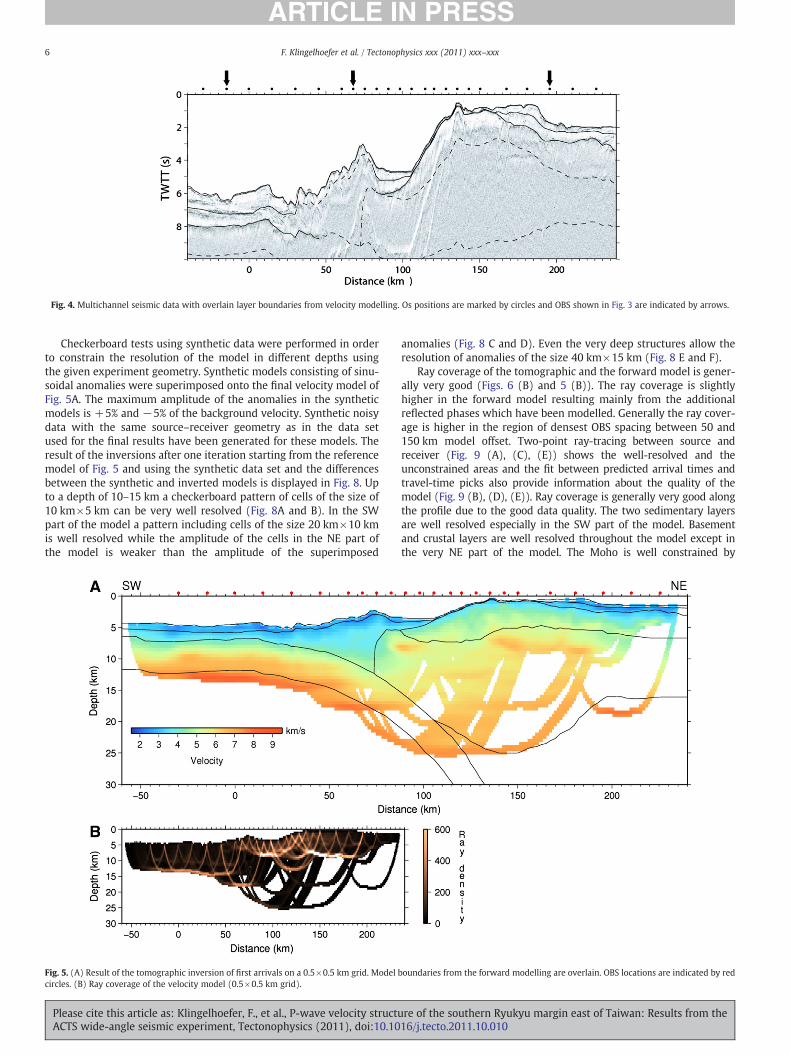
Fig. 4. Multichannel seismic data with overlain layer boundaries from velocity modelling. Os positions are marked by circles and OBS shown in Fig. 3 are indicated by arrows.
6 F. Klingelhoefer et al. / Tectonophysics xxx (2011) xxx–xxx
Checkerboard tests using synthetic data were performed in orderto constrain the resolution of the model in different depths usingthe given experiment geometry. Synthetic models consisting of sinu-soidal anomalies were superimposed onto the final velocity model ofFig. 5A. The maximum amplitude of the anomalies in the syntheticmodels is +5% and −5% of the background velocity. Synthetic noisydata with the same source–receiver geometry as in the data setused for the final results have been generated for these models. Theresult of the inversions after one iteration starting from the referencemodel of Fig. 5 and using the synthetic data set and the differencesbetween the synthetic and inverted models is displayed in Fig. 8. Upto a depth of 10–15 km a checkerboard pattern of cells of the size of10 km×5 km can be very well resolved (Fig. 8A and B). In the SWpart of the model a pattern including cells of the size 20 km×10 kmis well resolved while the amplitude of the cells in the NE part ofthe model is weaker than the amplitude of the superimposed
Fig. 5. (A) Result of the tomographic inversion of first arrivals on a 0.5×0.5 km grid. Modelcircles. (B) Ray coverage of the velocity model (0.5×0.5 km grid).
Please cite this article as: Klingelhoefer, F., et al., P-wave velocity structuACTS wide-angle seismic experiment, Tectonophysics (2011), doi:10.10
anomalies (Fig. 8 C and D). Even the very deep structures allow theresolution of anomalies of the size 40 km×15 km (Fig. 8 E and F).
Ray coverage of the tomographic and the forward model is gener-ally very good (Figs. 6 (B) and 5 (B)). The ray coverage is slightlyhigher in the forward model resulting mainly from the additionalreflected phases which have been modelled. Generally the ray cover-age is higher in the region of densest OBS spacing between 50 and150 km model offset. Two-point ray-tracing between source andreceiver (Fig. 9 (A), (C), (E)) shows the well-resolved and theunconstrained areas and the fit between predicted arrival times andtravel-time picks also provide information about the quality of themodel (Fig. 9 (B), (D), (E)). Ray coverage is generally very good alongthe profile due to the good data quality. The two sedimentary layersare well resolved especially in the SW part of the model. Basementand crustal layers are well resolved throughout the model except inthe very NE part of the model. The Moho is well constrained by
boundaries from the forward modelling are overlain. OBS locations are indicated by red
re of the southern Ryukyu margin east of Taiwan: Results from the16/j.tecto.2011.10.010
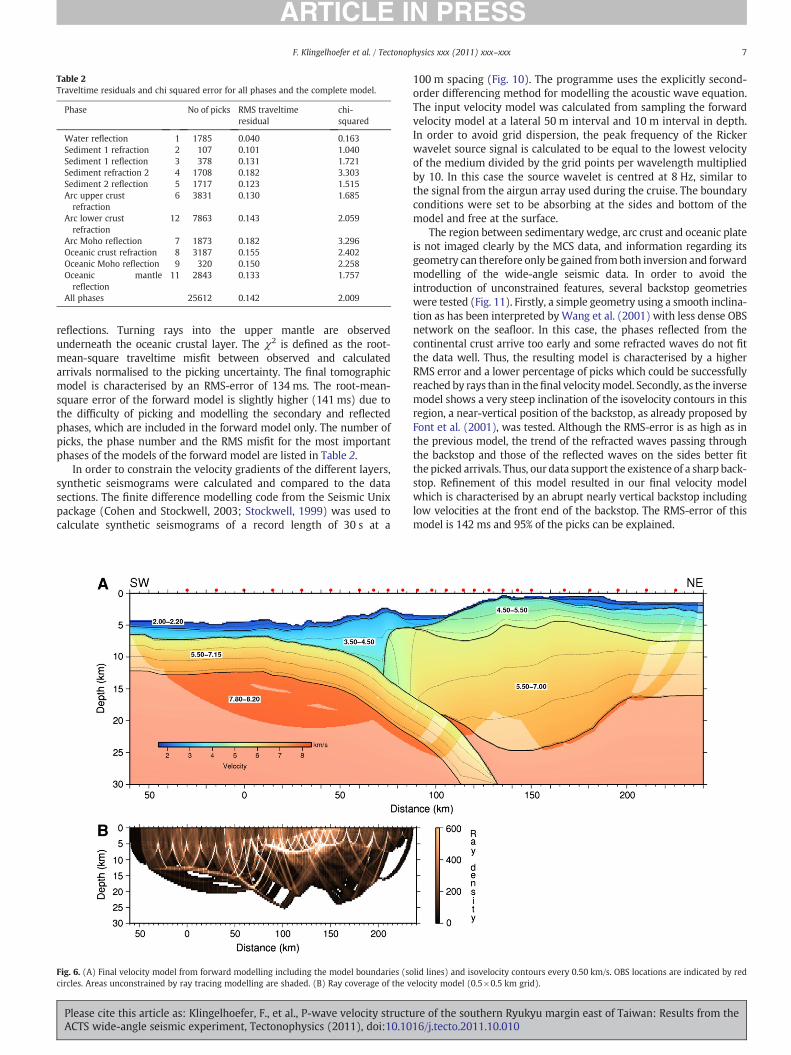
Table 2Traveltime residuals and chi squared error for all phases and the complete model.
Phase No of picks RMS traveltimeresidual
chi-squared
Water reflection 1 1785 0.040 0.163Sediment 1 refraction 2 107 0.101 1.040Sediment 1 reflection 3 378 0.131 1.721Sediment refraction 2 4 1708 0.182 3.303Sediment 2 reflection 5 1717 0.123 1.515Arc upper crustrefraction
6 3831 0.130 1.685
Arc lower crustrefraction
12 7863 0.143 2.059
Arc Moho reflection 7 1873 0.182 3.296Oceanic crust refraction 8 3187 0.155 2.402Oceanic Moho reflection 9 320 0.150 2.258Oceanic mantlereflection
11 2843 0.133 1.757
All phases 25612 0.142 2.009
7F. Klingelhoefer et al. / Tectonophysics xxx (2011) xxx–xxx
reflections. Turning rays into the upper mantle are observedunderneath the oceanic crustal layer. The χ2 is defined as the root-mean-square traveltime misfit between observed and calculatedarrivals normalised to the picking uncertainty. The final tomographicmodel is characterised by an RMS-error of 134 ms. The root-mean-square error of the forward model is slightly higher (141 ms) due tothe difficulty of picking and modelling the secondary and reflectedphases, which are included in the forward model only. The number ofpicks, the phase number and the RMS misfit for the most importantphases of the models of the forward model are listed in Table 2.
In order to constrain the velocity gradients of the different layers,synthetic seismograms were calculated and compared to the datasections. The finite difference modelling code from the Seismic Unixpackage (Cohen and Stockwell, 2003; Stockwell, 1999) was used tocalculate synthetic seismograms of a record length of 30 s at a
Fig. 6. (A) Final velocity model from forward modelling including the model boundaries (socircles. Areas unconstrained by ray tracing modelling are shaded. (B) Ray coverage of the v
Please cite this article as: Klingelhoefer, F., et al., P-wave velocity structuACTS wide-angle seismic experiment, Tectonophysics (2011), doi:10.10
100 m spacing (Fig. 10). The programme uses the explicitly second-order differencing method for modelling the acoustic wave equation.The input velocity model was calculated from sampling the forwardvelocity model at a lateral 50 m interval and 10 m interval in depth.In order to avoid grid dispersion, the peak frequency of the Rickerwavelet source signal is calculated to be equal to the lowest velocityof the medium divided by the grid points per wavelength multipliedby 10. In this case the source wavelet is centred at 8 Hz, similar tothe signal from the airgun array used during the cruise. The boundaryconditions were set to be absorbing at the sides and bottom of themodel and free at the surface.
The region between sedimentary wedge, arc crust and oceanic plateis not imaged clearly by the MCS data, and information regarding itsgeometry can therefore only be gained fromboth inversion and forwardmodelling of the wide-angle seismic data. In order to avoid theintroduction of unconstrained features, several backstop geometrieswere tested (Fig. 11). Firstly, a simple geometry using a smooth inclina-tion as has been interpreted byWang et al. (2001) with less dense OBSnetwork on the seafloor. In this case, the phases reflected from thecontinental crust arrive too early and some refracted waves do not fitthe data well. Thus, the resulting model is characterised by a higherRMS error and a lower percentage of picks which could be successfullyreached by rays than in thefinal velocitymodel. Secondly, as the inversemodel shows a very steep inclination of the isovelocity contours in thisregion, a near-vertical position of the backstop, as already proposed byFont et al. (2001), was tested. Although the RMS-error is as high as inthe previous model, the trend of the refracted waves passing throughthe backstop and those of the reflected waves on the sides better fitthe picked arrivals. Thus, our data support the existence of a sharp back-stop. Refinement of this model resulted in our final velocity modelwhich is characterised by an abrupt nearly vertical backstop includinglow velocities at the front end of the backstop. The RMS-error of thismodel is 142 ms and 95% of the picks can be explained.
lid lines) and isovelocity contours every 0.50 km/s. OBS locations are indicated by redelocity model (0.5×0.5 km grid).
re of the southern Ryukyu margin east of Taiwan: Results from the16/j.tecto.2011.10.010
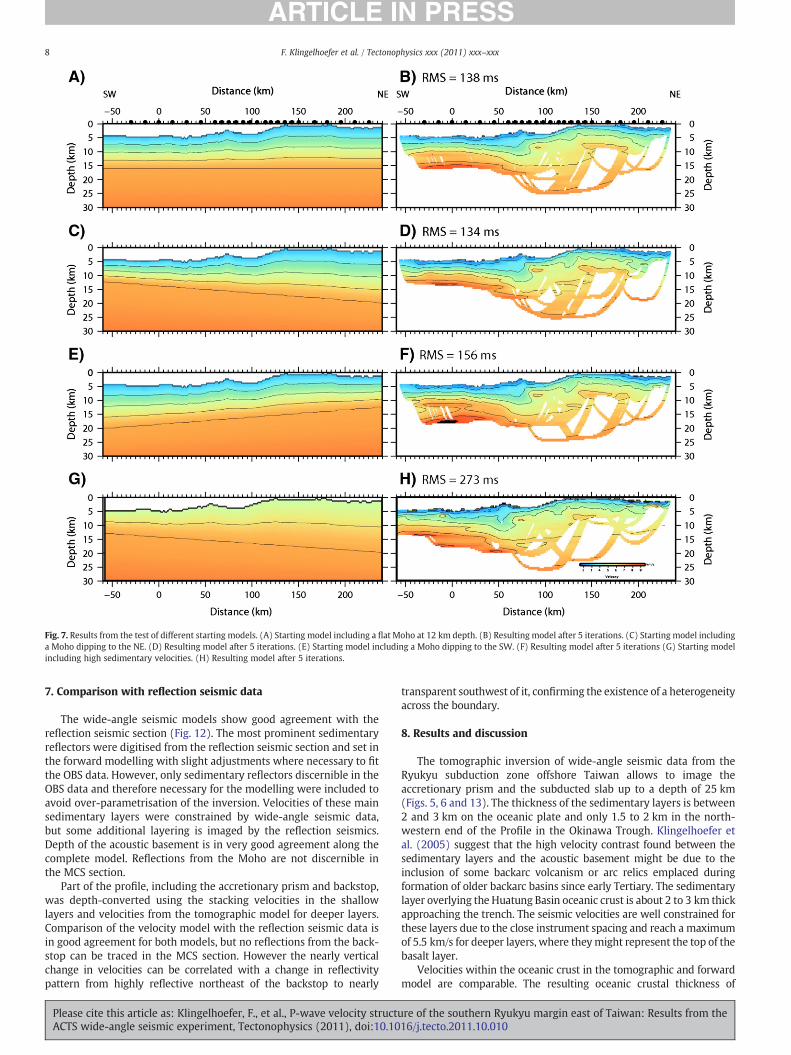
Fig. 7. Results from the test of different starting models. (A) Starting model including a flat Moho at 12 km depth. (B) Resulting model after 5 iterations. (C) Starting model includinga Moho dipping to the NE. (D) Resulting model after 5 iterations. (E) Starting model including a Moho dipping to the SW. (F) Resulting model after 5 iterations (G) Starting modelincluding high sedimentary velocities. (H) Resulting model after 5 iterations.
8 F. Klingelhoefer et al. / Tectonophysics xxx (2011) xxx–xxx
7. Comparison with reflection seismic data
The wide-angle seismic models show good agreement with thereflection seismic section (Fig. 12). The most prominent sedimentaryreflectors were digitised from the reflection seismic section and set inthe forward modelling with slight adjustments where necessary to fitthe OBS data. However, only sedimentary reflectors discernible in theOBS data and therefore necessary for the modelling were included toavoid over-parametrisation of the inversion. Velocities of these mainsedimentary layers were constrained by wide-angle seismic data,but some additional layering is imaged by the reflection seismics.Depth of the acoustic basement is in very good agreement along thecomplete model. Reflections from the Moho are not discernible inthe MCS section.
Part of the profile, including the accretionary prism and backstop,was depth-converted using the stacking velocities in the shallowlayers and velocities from the tomographic model for deeper layers.Comparison of the velocity model with the reflection seismic data isin good agreement for both models, but no reflections from the back-stop can be traced in the MCS section. However the nearly verticalchange in velocities can be correlated with a change in reflectivitypattern from highly reflective northeast of the backstop to nearly
Please cite this article as: Klingelhoefer, F., et al., P-wave velocity structuACTS wide-angle seismic experiment, Tectonophysics (2011), doi:10.10
transparent southwest of it, confirming the existence of a heterogeneityacross the boundary.
8. Results and discussion
The tomographic inversion of wide-angle seismic data from theRyukyu subduction zone offshore Taiwan allows to image theaccretionary prism and the subducted slab up to a depth of 25 km(Figs. 5, 6 and 13). The thickness of the sedimentary layers is between2 and 3 km on the oceanic plate and only 1.5 to 2 km in the north-western end of the Profile in the Okinawa Trough. Klingelhoefer etal. (2005) suggest that the high velocity contrast found between thesedimentary layers and the acoustic basement might be due to theinclusion of some backarc volcanism or arc relics emplaced duringformation of older backarc basins since early Tertiary. The sedimentarylayer overlying the Huatung Basin oceanic crust is about 2 to 3 km thickapproaching the trench. The seismic velocities are well constrained forthese layers due to the close instrument spacing and reach a maximumof 5.5 km/s for deeper layers, where theymight represent the top of thebasalt layer.
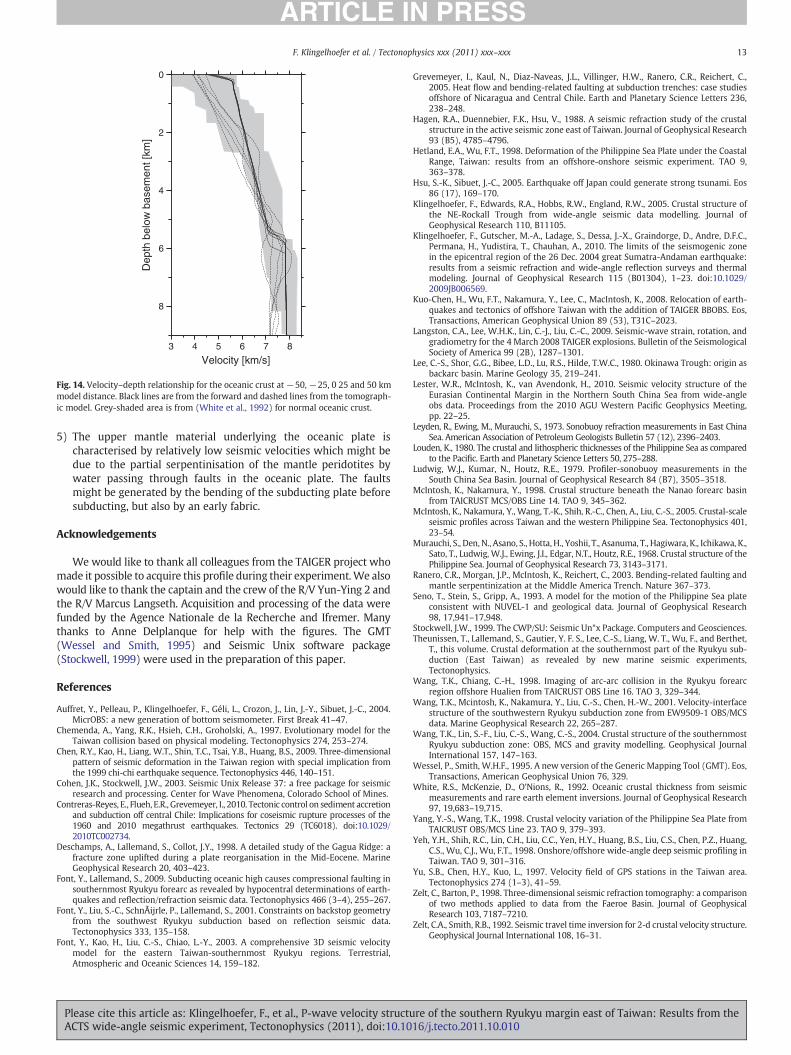
Velocities within the oceanic crust in the tomographic and forwardmodel are comparable. The resulting oceanic crustal thickness of
re of the southern Ryukyu margin east of Taiwan: Results from the16/j.tecto.2011.10.010
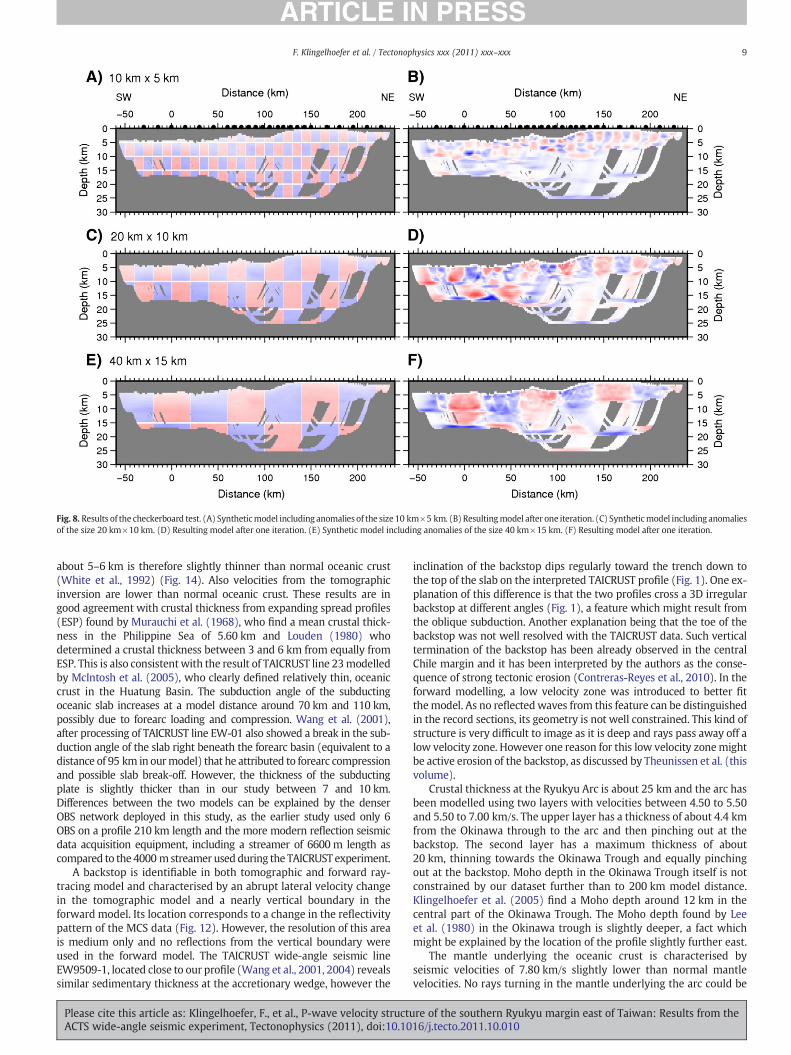
Fig. 8. Results of the checkerboard test. (A) Syntheticmodel including anomalies of the size 10 km×5 km. (B) Resultingmodel after one iteration. (C) Syntheticmodel including anomaliesof the size 20 km×10 km. (D) Resulting model after one iteration. (E) Synthetic model including anomalies of the size 40 km×15 km. (F) Resulting model after one iteration.
9F. Klingelhoefer et al. / Tectonophysics xxx (2011) xxx–xxx
about 5–6 km is therefore slightly thinner than normal oceanic crust(White et al., 1992) (Fig. 14). Also velocities from the tomographicinversion are lower than normal oceanic crust. These results are ingood agreement with crustal thickness from expanding spread profiles(ESP) found by Murauchi et al. (1968), who find a mean crustal thick-ness in the Philippine Sea of 5.60 km and Louden (1980) whodetermined a crustal thickness between 3 and 6 km from equally fromESP. This is also consistentwith the result of TAICRUST line 23modelledby McIntosh et al. (2005), who clearly defined relatively thin, oceaniccrust in the Huatung Basin. The subduction angle of the subductingoceanic slab increases at a model distance around 70 km and 110 km,possibly due to forearc loading and compression. Wang et al. (2001),after processing of TAICRUST line EW-01 also showed a break in the sub-duction angle of the slab right beneath the forearc basin (equivalent to adistance of 95 km in ourmodel) that he attributed to forearc compressionand possible slab break-off. However, the thickness of the subductingplate is slightly thicker than in our study between 7 and 10 km.Differences between the two models can be explained by the denserOBS network deployed in this study, as the earlier study used only 6OBS on a profile 210 km length and the more modern reflection seismicdata acquisition equipment, including a streamer of 6600 m length ascompared to the 4000mstreamer used during the TAICRUST experiment.
A backstop is identifiable in both tomographic and forward ray-tracing model and characterised by an abrupt lateral velocity changein the tomographic model and a nearly vertical boundary in theforward model. Its location corresponds to a change in the reflectivitypattern of the MCS data (Fig. 12). However, the resolution of this areais medium only and no reflections from the vertical boundary wereused in the forward model. The TAICRUST wide-angle seismic lineEW9509-1, located close to our profile (Wang et al., 2001, 2004) revealssimilar sedimentary thickness at the accretionary wedge, however the
Please cite this article as: Klingelhoefer, F., et al., P-wave velocity structuACTS wide-angle seismic experiment, Tectonophysics (2011), doi:10.10
inclination of the backstop dips regularly toward the trench down tothe top of the slab on the interpreted TAICRUST profile (Fig. 1). One ex-planation of this difference is that the two profiles cross a 3D irregularbackstop at different angles (Fig. 1), a feature which might result fromthe oblique subduction. Another explanation being that the toe of thebackstop was not well resolved with the TAICRUST data. Such verticaltermination of the backstop has been already observed in the centralChile margin and it has been interpreted by the authors as the conse-quence of strong tectonic erosion (Contreras-Reyes et al., 2010). In theforward modelling, a low velocity zone was introduced to better fitthemodel. As no reflectedwaves from this feature can be distinguishedin the record sections, its geometry is not well constrained. This kind ofstructure is very difficult to image as it is deep and rays pass away off alow velocity zone. However one reason for this low velocity zonemightbe active erosion of the backstop, as discussed by Theunissen et al. (thisvolume).
Crustal thickness at the Ryukyu Arc is about 25 km and the arc hasbeen modelled using two layers with velocities between 4.50 to 5.50and 5.50 to 7.00 km/s. The upper layer has a thickness of about 4.4 kmfrom the Okinawa through to the arc and then pinching out at thebackstop. The second layer has a maximum thickness of about20 km, thinning towards the Okinawa Trough and equally pinchingout at the backstop. Moho depth in the Okinawa Trough itself is notconstrained by our dataset further than to 200 km model distance.Klingelhoefer et al. (2005) find a Moho depth around 12 km in thecentral part of the Okinawa Trough. The Moho depth found by Leeet al. (1980) in the Okinawa trough is slightly deeper, a fact whichmight be explained by the location of the profile slightly further east.
The mantle underlying the oceanic crust is characterised byseismic velocities of 7.80 km/s slightly lower than normal mantlevelocities. No rays turning in the mantle underlying the arc could be
re of the southern Ryukyu margin east of Taiwan: Results from the16/j.tecto.2011.10.010

Fig. 9. (A) Upper panel: Ray coverage of the sedimentary layers of the profile with every tenth ray from two-point ray-tracing plotted. Lower panel: Observed traveltime picks andcalculated travel times (line) of the sedimentary layers for all receivers along the model. (B) Same as (A) but for the crustal layers (C) Same as (A) but for the Moho and uppermantle layers.
10 F. Klingelhoefer et al. / Tectonophysics xxx (2011) xxx–xxx
identified in the data sections. Here, the Moho depth was modelledusing PmP reflections. A similar reduction in upper oceanic mantlevelocities was observed offshore Costa Rica over the flexurally faultedportion of the oceanic Cocos plate before it enters the Middle Americatrench and interpreted as being due to serpentinisation of the upper-most mantle (Grevemeyer et al., 2005) through faults generated bythe flexure and imaged on seismic reflection data (Ranero et al.,2003). Similar low velocities are found underneath the subductingoceanic plate in the Sumatra subduction zone (Klingelhoefer et al.,2010). In all three environments, the oceanic crust is thinner thanusual and might thus be fractured more readily and therefore maypermit a higher degree of serpentinisation in the upper mantle thanthick oceanic crust. Furthermore, the basement of the Huatungbasin is characterised by N–S trending ridges and troughs that paral-lel the Gagua Ridge and were interpreted as satellite transform faults,creating additional fractures (Deschamps et al., 1998).
Please cite this article as: Klingelhoefer, F., et al., P-wave velocity structuACTS wide-angle seismic experiment, Tectonophysics (2011), doi:10.10
9. Conclusions
Velocity modelling of wide-angle seismic data of a profile locatedover the whole trench-arc–backarc system, from the Ryukyu trenchto the Okinawa back-arc trough allows to image the subducting slabdown to a depth of up to 25 km. Based on this velocity model we pro-pose that:
1) The sedimentary thickness on the oceanic plate is about 2–3 km,2) The thickness of the oceanic crust is about 5–6 km, slightly thinner
than normal oceanic crust,3) Both the tomographic inversion of first arrivals and the forward
model reveal a backstop characterised by a very steep inclination.Although this region of the model is not highly constrained and noreflections from the backstop can be identified in multi-channelseismic data, it produces the lowest error of several geometries
re of the southern Ryukyu margin east of Taiwan: Results from the16/j.tecto.2011.10.010
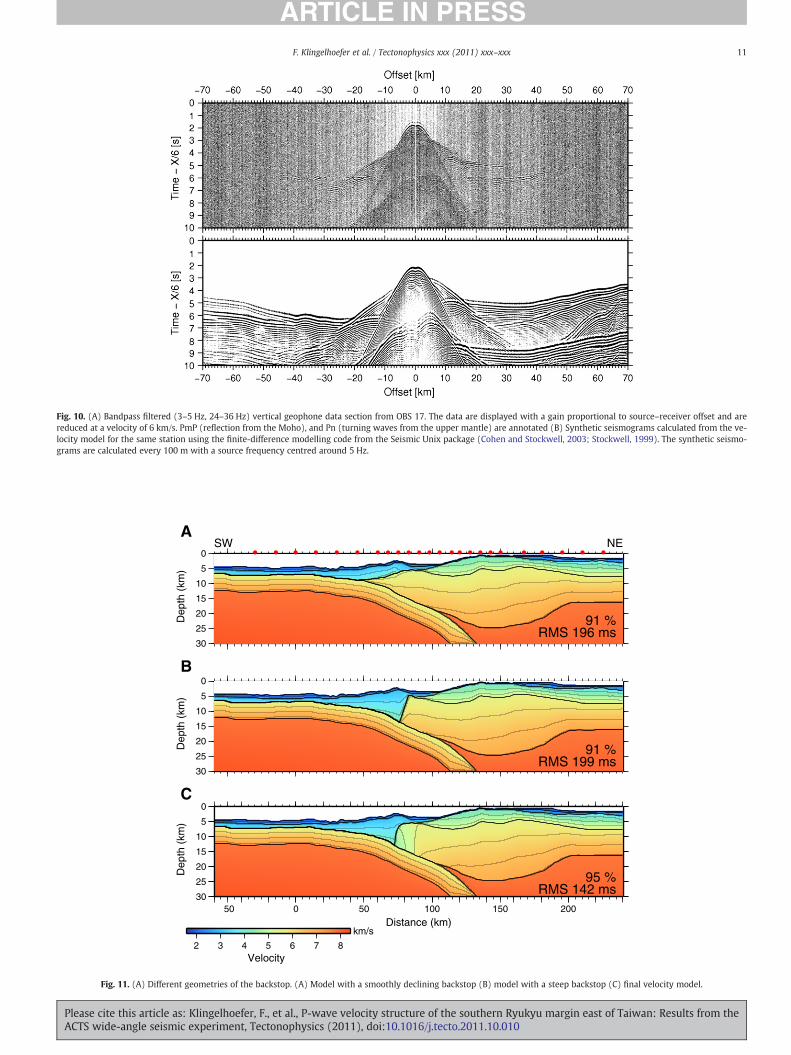
Fig. 10. (A) Bandpass filtered (3–5 Hz, 24–36 Hz) vertical geophone data section from OBS 17. The data are displayed with a gain proportional to source–receiver offset and arereduced at a velocity of 6 km/s. PmP (reflection from the Moho), and Pn (turning waves from the upper mantle) are annotated (B) Synthetic seismograms calculated from the ve-locity model for the same station using the finite-difference modelling code from the Seismic Unix package (Cohen and Stockwell, 2003; Stockwell, 1999). The synthetic seismo-grams are calculated every 100 m with a source frequency centred around 5 Hz.
30
25
20
15
10
5
0
Dep
th (
km)
30
25
20
15
10
5
0
Dep
th (
km)
30
25
20
15
10
5
0
Dep
th (
km)
50 0 50 100 150 200
Distance (km)
C
B
ASW NE
91 %RMS 196 ms
91 %RMS 199 ms
95 %RMS 142 ms
2 3 4 5 6 7 8Velocity
km/s
Fig. 11. (A) Different geometries of the backstop. (A) Model with a smoothly declining backstop (B) model with a steep backstop (C) final velocity model.
11F. Klingelhoefer et al. / Tectonophysics xxx (2011) xxx–xxx
Please cite this article as: Klingelhoefer, F., et al., P-wave velocity structure of the southern Ryukyu margin east of Taiwan: Results from theACTS wide-angle seismic experiment, Tectonophysics (2011), doi:10.1016/j.tecto.2011.10.010
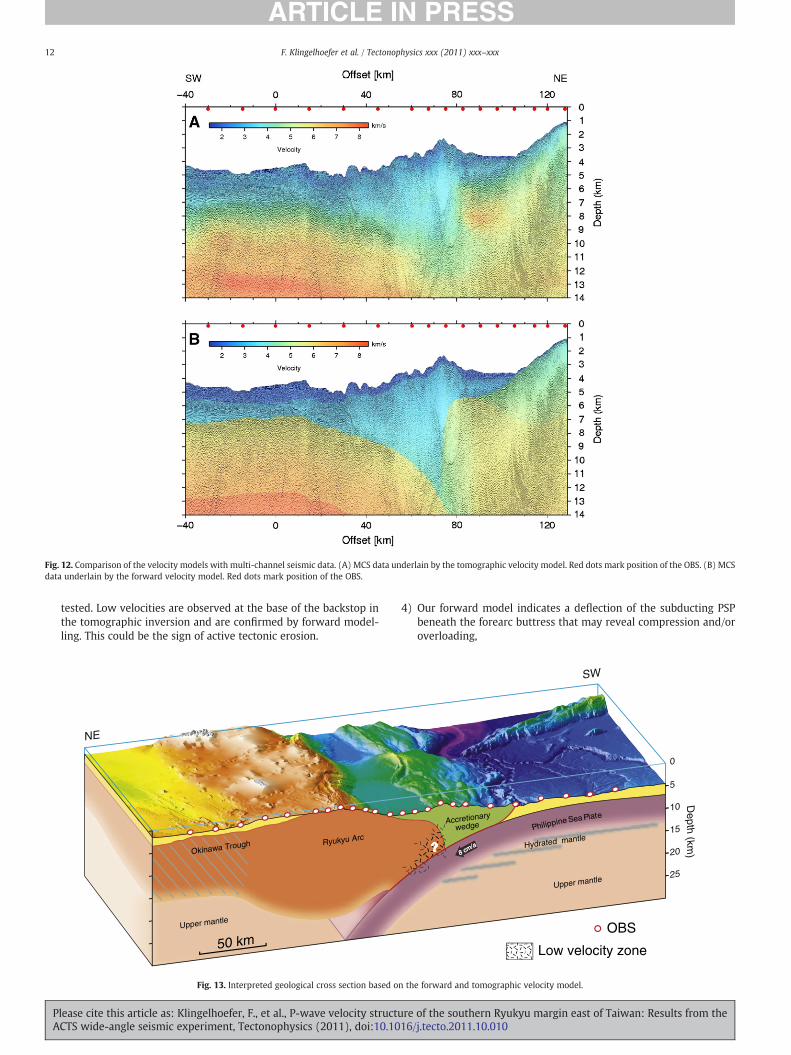
Fig. 12. Comparison of the velocity models with multi-channel seismic data. (A) MCS data underlain by the tomographic velocity model. Red dots mark position of the OBS. (B) MCSdata underlain by the forward velocity model. Red dots mark position of the OBS.
12 F. Klingelhoefer et al. / Tectonophysics xxx (2011) xxx–xxx
tested. Low velocities are observed at the base of the backstop inthe tomographic inversion and are confirmed by forward model-ling. This could be the sign of active tectonic erosion.
Okinawa Trough Ryukyu Arc
Upper mantle
NE
50 km
Fig. 13. Interpreted geological cross section based o
Please cite this article as: Klingelhoefer, F., et al., P-wave velocity structuACTS wide-angle seismic experiment, Tectonophysics (2011), doi:10.10
4) Our forward model indicates a deflection of the subducting PSPbeneath the forearc buttress that may reveal compression and/oroverloading,
8 cm/a?
Low velocity zone
???????8 cm/a
Philippine Sea Plate
Upper mantle
Accretionary
wedge
Hydrated mantle
OBS
SW
0
5
10
15
20
25
Depth (km
)
n the forward and tomographic velocity model.
re of the southern Ryukyu margin east of Taiwan: Results from the16/j.tecto.2011.10.010
0
2
4
6
8
Dep
th b
elow
bas
emen
t [km
]
3 4 5 6 7 8
Velocity [km/s]
Fig. 14. Velocity–depth relationship for the oceanic crust at−50,−25, 0 25 and 50 kmmodel distance. Black lines are from the forward and dashed lines from the tomograph-ic model. Grey-shaded area is from (White et al., 1992) for normal oceanic crust.
13F. Klingelhoefer et al. / Tectonophysics xxx (2011) xxx–xxx
5) The upper mantle material underlying the oceanic plate ischaracterised by relatively low seismic velocities which might bedue to the partial serpentinisation of the mantle peridotites bywater passing through faults in the oceanic plate. The faultsmight be generated by the bending of the subducting plate beforesubducting, but also by an early fabric.
Acknowledgements
We would like to thank all colleagues from the TAIGER project whomade it possible to acquire this profile during their experiment.We alsowould like to thank the captain and the crew of the R/V Yun-Ying 2 andthe R/V Marcus Langseth. Acquisition and processing of the data werefunded by the Agence Nationale de la Recherche and Ifremer. Manythanks to Anne Delplanque for help with the figures. The GMT(Wessel and Smith, 1995) and Seismic Unix software package(Stockwell, 1999) were used in the preparation of this paper.
References
Auffret, Y., Pelleau, P., Klingelhoefer, F., Géli, L., Crozon, J., Lin, J.-Y., Sibuet, J.-C., 2004.MicrOBS: a new generation of bottom seismometer. First Break 41–47.
Chemenda, A., Yang, R.K., Hsieh, C.H., Groholski, A., 1997. Evolutionary model for theTaiwan collision based on physical modeling. Tectonophysics 274, 253–274.
Chen, R.Y., Kao, H., Liang, W.T., Shin, T.C., Tsai, Y.B., Huang, B.S., 2009. Three-dimensionalpattern of seismic deformation in the Taiwan region with special implication fromthe 1999 chi-chi earthquake sequence. Tectonophysics 446, 140–151.
Cohen, J.K., Stockwell, J.W., 2003. Seismic Unix Release 37: a free package for seismicresearch and processing. Center for Wave Phenomena, Colorado School of Mines.
Contreras-Reyes, E., Flueh, E.R., Grevemeyer, I., 2010. Tectonic control on sediment accretionand subduction off central Chile: Implications for coseismic rupture processes of the1960 and 2010 megathrust earthquakes. Tectonics 29 (TC6018). doi:10.1029/2010TC002734.
Deschamps, A., Lallemand, S., Collot, J.Y., 1998. A detailed study of the Gagua Ridge: afracture zone uplifted during a plate reorganisation in the Mid-Eocene. MarineGeophysical Research 20, 403–423.
Font, Y., Lallemand, S., 2009. Subducting oceanic high causes compressional faulting insouthernmost Ryukyu forearc as revealed by hypocentral determinations of earth-quakes and reflection/refraction seismic data. Tectonophysics 466 (3–4), 255–267.
Font, Y., Liu, S.-C., SchnÃijrle, P., Lallemand, S., 2001. Constraints on backstop geometryfrom the southwest Ryukyu subduction based on reflection seismic data.Tectonophysics 333, 135–158.
Font, Y., Kao, H., Liu, C.-S., Chiao, L.-Y., 2003. A comprehensive 3D seismic velocitymodel for the eastern Taiwan-southernmost Ryukyu regions. Terrestrial,Atmospheric and Oceanic Sciences 14, 159–182.
Please cite this article as: Klingelhoefer, F., et al., P-wave velocity structuACTS wide-angle seismic experiment, Tectonophysics (2011), doi:10.10
Grevemeyer, I., Kaul, N., Diaz-Naveas, J.L., Villinger, H.W., Ranero, C.R., Reichert, C.,2005. Heat flow and bending-related faulting at subduction trenches: case studiesoffshore of Nicaragua and Central Chile. Earth and Planetary Science Letters 236,238–248.
Hagen, R.A., Duennebier, F.K., Hsu, V., 1988. A seismic refraction study of the crustalstructure in the active seismic zone east of Taiwan. Journal of Geophysical Research93 (B5), 4785–4796.
Hetland, E.A., Wu, F.T., 1998. Deformation of the Philippine Sea Plate under the CoastalRange, Taiwan: results from an offshore-onshore seismic experiment. TAO 9,363–378.
Hsu, S.-K., Sibuet, J.-C., 2005. Earthquake off Japan could generate strong tsunami. Eos86 (17), 169–170.
Klingelhoefer, F., Edwards, R.A., Hobbs, R.W., England, R.W., 2005. Crustal structure ofthe NE-Rockall Trough from wide-angle seismic data modelling. Journal ofGeophysical Research 110, B11105.
Klingelhoefer, F., Gutscher, M.-A., Ladage, S., Dessa, J.-X., Graindorge, D., Andre, D.F.C.,Permana, H., Yudistira, T., Chauhan, A., 2010. The limits of the seismogenic zonein the epicentral region of the 26 Dec. 2004 great Sumatra-Andaman earthquake:results from a seismic refraction and wide-angle reflection surveys and thermalmodeling. Journal of Geophysical Research 115 (B01304), 1–23. doi:10.1029/2009JB006569.
Kuo-Chen, H., Wu, F.T., Nakamura, Y., Lee, C., MacIntosh, K., 2008. Relocation of earth-quakes and tectonics of offshore Taiwan with the addition of TAIGER BBOBS. Eos,Transactions, American Geophysical Union 89 (53), T31C–2023.
Langston, C.A., Lee, W.H.K., Lin, C.-J., Liu, C.-C., 2009. Seismic-wave strain, rotation, andgradiometry for the 4 March 2008 TAIGER explosions. Bulletin of the SeismologicalSociety of America 99 (2B), 1287–1301.
Lee, C.-S., Shor, G.G., Bibee, L.D., Lu, R.S., Hilde, T.W.C., 1980. Okinawa Trough: origin asbackarc basin. Marine Geology 35, 219–241.
Lester, W.R., McIntosh, K., van Avendonk, H., 2010. Seismic velocity structure of theEurasian Continental Margin in the Northern South China Sea from wide-angleobs data. Proceedings from the 2010 AGU Western Pacific Geophysics Meeting,pp. 22–25.
Leyden, R., Ewing, M., Murauchi, S., 1973. Sonobuoy refraction measurements in East ChinaSea. American Association of Petroleum Geologists Bulletin 57 (12), 2396–2403.
Louden, K., 1980. The crustal and lithospheric thicknesses of the Philippine Sea as comparedto the Pacific. Earth and Planetary Science Letters 50, 275–288.
Ludwig, W.J., Kumar, N., Houtz, R.E., 1979. Profiler-sonobuoy measurements in theSouth China Sea Basin. Journal of Geophysical Research 84 (B7), 3505–3518.
McIntosh, K., Nakamura, Y., 1998. Crustal structure beneath the Nanao forearc basinfrom TAICRUST MCS/OBS Line 14. TAO 9, 345–362.
McIntosh, K., Nakamura, Y., Wang, T.-K., Shih, R.-C., Chen, A., Liu, C.-S., 2005. Crustal-scaleseismic profiles across Taiwan and the western Philippine Sea. Tectonophysics 401,23–54.
Murauchi, S., Den, N., Asano, S., Hotta, H., Yoshii, T., Asanuma, T., Hagiwara, K., Ichikawa, K.,Sato, T., Ludwig, W.J., Ewing, J.I., Edgar, N.T., Houtz, R.E., 1968. Crustal structure of thePhilippine Sea. Journal of Geophysical Research 73, 3143–3171.
Ranero, C.R., Morgan, J.P., McIntosh, K., Reichert, C., 2003. Bending-related faulting andmantle serpentinization at the Middle America Trench. Nature 367–373.
Seno, T., Stein, S., Gripp, A., 1993. A model for the motion of the Philippine Sea plateconsistent with NUVEL-1 and geological data. Journal of Geophysical Research98, 17,941–17,948.
Stockwell, J.W., 1999. The CWP/SU: Seismic Un*x Package. Computers and Geosciences.Theunissen, T., Lallemand, S., Gautier, Y. F. S., Lee, C.-S., Liang, W. T., Wu, F., and Berthet,
T., this volume. Crustal deformation at the southernmost part of the Ryukyu sub-duction (East Taiwan) as revealed by new marine seismic experiments,Tectonophysics.
Wang, T.K., Chiang, C.-H., 1998. Imaging of arc-arc collision in the Ryukyu forearcregion offshore Hualien from TAICRUST OBS Line 16. TAO 3, 329–344.
Wang, T.K., Mcintosh, K., Nakamura, Y., Liu, C.-S., Chen, H.-W., 2001. Velocity-interfacestructure of the southwestern Ryukyu subduction zone from EW9509-1 OBS/MCSdata. Marine Geophysical Research 22, 265–287.
Wang, T.K., Lin, S.-F., Liu, C.-S., Wang, C.-S., 2004. Crustal structure of the southernmostRyukyu subduction zone: OBS, MCS and gravity modelling. Geophysical JournalInternational 157, 147–163.
Wessel, P., Smith, W.H.F., 1995. A new version of the Generic Mapping Tool (GMT). Eos,Transactions, American Geophysical Union 76, 329.
White, R.S., McKenzie, D., O'Nions, R., 1992. Oceanic crustal thickness from seismicmeasurements and rare earth element inversions. Journal of Geophysical Research97, 19,683–19,715.
Yang, Y.-S., Wang, T.K., 1998. Crustal velocity variation of the Philippine Sea Plate fromTAICRUST OBS/MCS Line 23. TAO 9, 379–393.
Yeh, Y.H., Shih, R.C., Lin, C.H., Liu, C.C., Yen, H.Y., Huang, B.S., Liu, C.S., Chen, P.Z., Huang,C.S., Wu, C.J., Wu, F.T., 1998. Onshore/offshore wide-angle deep seismic profiling inTaiwan. TAO 9, 301–316.
Yu, S.B., Chen, H.Y., Kuo, L., 1997. Velocity field of GPS stations in the Taiwan area.Tectonophysics 274 (1–3), 41–59.
Zelt, C., Barton, P., 1998. Three-dimensional seismic refraction tomography: a comparisonof two methods applied to data from the Faeroe Basin. Journal of GeophysicalResearch 103, 7187–7210.
Zelt, C.A., Smith, R.B., 1992. Seismic travel time inversion for 2-d crustal velocity structure.Geophysical Journal International 108, 16–31.
re of the southern Ryukyu margin east of Taiwan: Results from the16/j.tecto.2011.10.010