p l at i n u m 2 01 2 -1 3 s h e e t - statfox...
TRANSCRIPT

Every Week:
s t a t f o x . c o m b e s t b e t s
t o p w e e k l y p i c k s
e x c l u s i v e p o w e r r a t i n g s
H a n d i c a p p i n g s y s t e m s
s u p e r s i t u a t i o n s
H e a d - t o - H e a d t r e n d s
no
.1 r
at e d b e t t i n g g u i de
!
2 0 1 2 - 1 3
p l at i n u ms H e e t
i s s u e 4
sept. 19 - 25, 2012
n f l
c o l l e g e
n b a
2 www.StatFox.com
T h e P l aT i n u m S h e e T
I s s u e # 4 • s e p t e m b e r 1 9 – 2 5 , 2 01 2
StatFox NFL Power Rating Lines 2
NFL Best Bets / StatFox Staff Selections 3
StatFox NFL Outplay Factor Rating Lines 3
NFL Week 1 Game-by-Game Breakdowns 4
NFL Top Statistical Edges 10
College Best Bets / StatFox Staff Selections 11
StatFox College Football Power Rating Lines 12
College Football Top Statistical Edges 13
StatFox College Outplay Factor Rating Lines 14
College Football Game-by-Game Breakdowns 16
Managing Editor Scott Gramling
Contributing Editors Dave Bartman Gary Bennett Brian Graham
ExECutivE Editor Jeff Makinen
CrEativE dirECtor Ian Knowles
Editorial dirECtion 10Ten Media
daily raCing ForM llC Jim Kostas, President Duke Dosik, VP Custom Publishing Todd Unger, President of SIG Digital Jacob Luft, Programming Manager
The Platinum Sheet is pub-lished by Daily Racing Form LLC, 708 Third Avenue, 12th Floor, New York, NY 10017. All rights reserved. Daily Racing Form LLC reserves the right to deny any paid advertisements and is not responsible for any con-tracts entered in with such advertisers. s u b s c r I p t I o n s : www.StatFox.com/store 1-877-514-4220
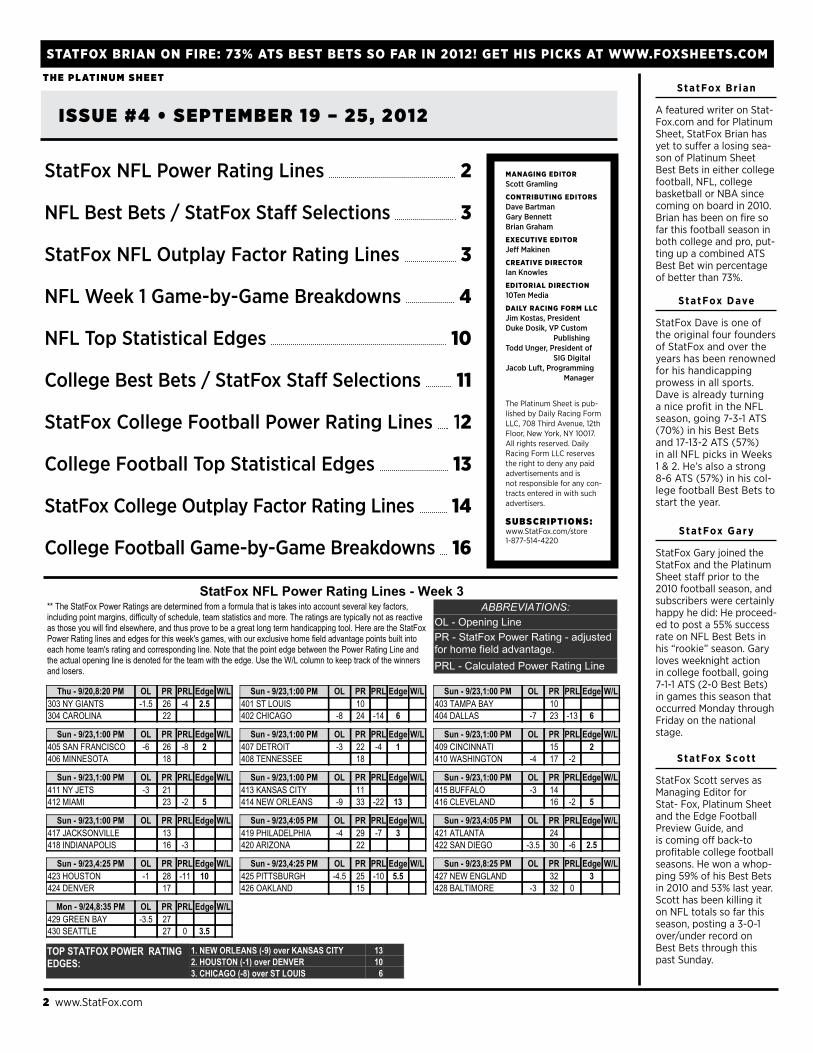
** The StatFox Power Ratings are determined from a formula that is takes into account several key factors, including point margins, difficulty of schedule, team statistics and more. The ratings are typically not as reactive as those you will find elsewhere, and thus prove to be a great long term handicapping tool. Here are the StatFox Power Rating lines and edges for this week's games, with our exclusive home field advantage points built into each home team's rating and corresponding line. Note that the point edge between the Power Rating Line and the actual opening line is denoted for the team with the edge. Use the W/L column to keep track of the winners and losers.
ABBREVIATIONS:OL - Opening LinePR - StatFox Power Rating - adjusted for home field advantage.PRL - Calculated Power Rating Line
StatFox NFL Power Rating Lines - Week 3
304 CAROLINA303 NY GIANTS -1.5
2226 -4 2.5
Thu - 9/20,8:20 PM OL PR PRL Edge W/L
402 CHICAGO401 ST LOUIS
-8 2410
-14 6
Sun - 9/23,1:00 PM OL PR PRL Edge W/L
404 DALLAS403 TAMPA BAY
-7 2310
-13 6
Sun - 9/23,1:00 PM OL PR PRL Edge W/L
406 MINNESOTA405 SAN FRANCISCO -6
1826 -8 2
Sun - 9/23,1:00 PM OL PR PRL Edge W/L
408 TENNESSEE407 DETROIT -3
1822 -4 1
Sun - 9/23,1:00 PM OL PR PRL Edge W/L
410 WASHINGTON409 CINCINNATI
-4 1715
-22
Sun - 9/23,1:00 PM OL PR PRL Edge W/L
412 MIAMI411 NY JETS -3
2321
-2 5
Sun - 9/23,1:00 PM OL PR PRL Edge W/L
414 NEW ORLEANS413 KANSAS CITY
-9 3311
-22 13
Sun - 9/23,1:00 PM OL PR PRL Edge W/L
416 CLEVELAND415 BUFFALO -3
1614
-2 5
Sun - 9/23,1:00 PM OL PR PRL Edge W/L
418 INDIANAPOLIS417 JACKSONVILLE
1613
-3
Sun - 9/23,1:00 PM OL PR PRL Edge W/L
420 ARIZONA419 PHILADELPHIA -4
2229 -7 3
Sun - 9/23,4:05 PM OL PR PRL Edge W/L
422 SAN DIEGO421 ATLANTA
-3.5 3024
-6 2.5
Sun - 9/23,4:05 PM OL PR PRL Edge W/L
424 DENVER423 HOUSTON -1
1728 -11 10
Sun - 9/23,4:25 PM OL PR PRL Edge W/L
426 OAKLAND425 PITTSBURGH -4.5
1525 -10 5.5
Sun - 9/23,4:25 PM OL PR PRL Edge W/L
428 BALTIMORE427 NEW ENGLAND
-3 3232
03
Sun - 9/23,8:25 PM OL PR PRL Edge W/L
430 SEATTLE429 GREEN BAY -3.5
2727
0 3.5
Mon - 9/24,8:35 PM OL PR PRL Edge W/L
TOP STATFOX POWER RATING EDGES:
1. NEW ORLEANS (-9) over KANSAS CITY 132. HOUSTON (-1) over DENVER 103. CHICAGO (-8) over ST LOUIS 6
S t a t Fox D ave
StatFox Dave is one of the original four founders of StatFox and over the years has been renowned for his handicapping prowess in all sports. Dave is already turning a nice profit in the NFL season, going 7-3-1 ATS (70%) in his Best Bets and 17-13-2 ATS (57%) in all NFL picks in Weeks 1 & 2. He’s also a strong 8-6 ATS (57%) in his col-lege football Best Bets to start the year.
S t a t Fox G a r y
StatFox Gary joined the StatFox and the Platinum Sheet staff prior to the 2010 football season, and subscribers were certainlyhappy he did: He proceed-ed to post a 55% success rate on NFL Best Bets in his “rookie” season. Gary loves weeknight actionin college football, going7-1-1 ATS (2-0 Best Bets)in games this season that occurred Monday through Friday on the national stage.
S t a t Fox S co t t
StatFox Scott serves as Managing Editor for Stat- Fox, Platinum Sheet and the Edge Football Preview Guide, and is coming off back-to profitable college football seasons. He won a whop-ping 59% of his Best Bets in 2010 and 53% last year. Scott has been killing it on NFL totals so far this season, posting a 3-0-1 over/under record on Best Bets through this past Sunday.
S t a t Fox B r i a n
A featured writer on Stat-Fox.com and for Platinum Sheet, StatFox Brian has yet to suffer a losing sea-son of Platinum SheetBest Bets in either college football, NFL, college basketball or NBA since coming on board in 2010. Brian has been on fire so far this football season in both college and pro, put-ting up a combined ATS Best Bet win percentage of better than 73%.
statFox brian on FirE: 73% ats bEst bEts so Far in 2012! gEt His PiCKs at WWW.FoxsHEEts.CoM

www.StatFox.com 3
T h e P l aT i n u m S h e e T
Week 3 NFL Matchups: septeMber 20 - 24
• (303) NEW YORK GIANTS at (304) CAROLINA +2½ BEST BET * CAROLINA CAROLINA BEST BET * CAROLINA CAROLINA
• (401) ST. LOUIS at (402) CHICAGO -10½ BEST BET * CHICAGO ST. LOUIS CHICAGO CHICAGO CHICAGO
• (403) TAMPA BAY at (404) DALLAS -7½ BEST BET * TAMPA BAY TAMPA BAY TAMPA BAY DALLAS TAMPA BAY
• (405) SAN FRANCISCO at (406) MINNESOTA +6 SAN FRANCISCO BEST BET * SAN FRANCISCO SAN FRANCISCO MINNESOTA SAN FRANCISCO
• (407) DETROIT at (408) TENNESSEE +2½ DETROIT DETROIT DETROIT DETROIT TENNESSEE DETROIT
• (409) CINCINNATI at (410) WASHINGTON -2 WASHINGTON CINCINNATI BEST BET * BEST BET * CINCINNATI
• (411) NEW YORK JETS at (412) MIAMI +3 NY JETS MIAMI MIAMI MIAMI MIAMI MIAMI
• (413) KANSAS CITY at (414) NEW ORLEANS -10 NEW ORLEANS BEST BET * NEW ORLEANS NEW ORLEANS NEW ORLEANS NEW ORLEANS
• (415) BUFFALO at (416) CLEVELAND +3 BEST BET * BUFFALO BUFFALO BUFFALO CLEVELAND BUFFALO
• (417) JACKSONVILLE at (418) INDIANAPOLIS -2½ BEST BET * INDIANAPOLIS INDIANAPOLIS INDIANAPOLIS INDIANAPOLIS INDIANAPOLIS
• (419) PHILADELPHIA at (420) ARIZONA +5 PHILADELPHIA ARIZONA BEST BET * ARIZONA ARIZONA ARIZONA
• (421) ATLANTA at (422) SAN DIEGO -2½ SAN DIEGO ATLANTA ATLANTA ATLANTA ATLANTA ATLANTA
• (423) HOUSTON at (424) DENVER -1 DENVER HOUSTON HOUSTON DENVER HOUSTON HOUSTON
• (425) PITTSBURGH at (426) OAKLAND +3 PITTSBURGH BEST BET * PITTSBURGH BEST BET * PITTSBURGH PITTSBURGH
• (427) NEW ENGLAND at (428) BALTIMORE -2½ BALTIMORE BALTIMORE BEST BET * BALTIMORE NEW ENGLAND BALTIMORE
• (429) GREEN BAY at (430) SEATTLE +6 BEST BET * SEATTLE SEATTLE GREEN BAY SEATTLE SEATTLE
P r e S e n T S T h e w e e k ’ S STa f f P i c k S
stat
Fox
da
ve
stat
Fox
Ga
rY
stat
Fox
scO
tt
stat
Fox
br
IaN
stat
Fox
FOr
eca
ster
stat
Fox
cO
Nse
Nsu
s
StatFox is renowned for providing the most comprehensive game
information on the Internet. Our popular FoxSheets are packed with proprietary handicapping
tools that benefit everyone from the beginning bettor to the most
advanced self-handicapper.
Providing Unprecedented
Handicapping Content
log on To foxSheeTS.com and STarT winning Today!
** The Outplay Factor Ratings made famous by StatFox are a great Team Strength Indicator as they provide a quantitative measure of how teams are outplaying (+ value) or being outplayed by (- value) their opponents. They are determined by a complicated formula that takes into account a team's points for/against as compared to how their previous opponents have fared. Here are the StatFox Team Outplay Factor Ratings and the corresponding game lines derived from them. Note that the point edge between the Outplay Factor Rating Line and the actual opening line is denoted for the team with the edge. Use the W/L column to keep track of the winners and losers.
ABBREVIATIONS:OL - Opening LineOF - StatFox Outplay Factor Rating - adjusted for home field advantage.OFL - Calculated Outplay Factor Line
Statfox NFL Outplay Factor Rating Lines - Week 3
304 CAROLINA303 NY GIANTS -1.5
2228 -6 4.7
Thu - 9/20,8:20 PM OL OF OFL Edge W/L
402 CHICAGO401 ST LOUIS
-8 2412
-12 4.5
Sun - 9/23,1:00 PM OL OF OFL Edge W/L
404 DALLAS403 TAMPA BAY
-7 238.3
-15 8.2
Sun - 9/23,1:00 PM OL OF OFL Edge W/L
406 MINNESOTA405 SAN FRANCISCO -6
1628 -12 6.1
Sun - 9/23,1:00 PM OL OF OFL Edge W/L
408 TENNESSEE407 DETROIT -3
2222 -1
2.3
Sun - 9/23,1:00 PM OL OF OFL Edge W/L
410 WASHINGTON409 CINCINNATI
-4 1716
-12.9
Sun - 9/23,1:00 PM OL OF OFL Edge W/L
412 MIAMI411 NY JETS -3
2621
-5 8.2
Sun - 9/23,1:00 PM OL OF OFL Edge W/L
414 NEW ORLEANS413 KANSAS CITY
-9 3712
-25 15.8
Sun - 9/23,1:00 PM OL OF OFL Edge W/L
416 CLEVELAND415 BUFFALO -3
1711
-6 8.8
Sun - 9/23,1:00 PM OL OF OFL Edge W/L
418 INDIANAPOLIS417 JACKSONVILLE
1813
-4
Sun - 9/23,1:00 PM OL OF OFL Edge W/L
420 ARIZONA419 PHILADELPHIA -4
2629 -4
0.2
Sun - 9/23,4:05 PM OL OF OFL Edge W/L
422 SAN DIEGO421 ATLANTA
-3.5 2726
-12.4
Sun - 9/23,4:05 PM OL OF OFL Edge W/L
424 DENVER423 HOUSTON -1
1926 -7 5.6
Sun - 9/23,4:25 PM OL OF OFL Edge W/L
426 OAKLAND425 PITTSBURGH -4.5
1527 -11 6.7
Sun - 9/23,4:25 PM OL OF OFL Edge W/L
428 BALTIMORE427 NEW ENGLAND
-3 3136 -5 8.4
Sun - 9/23,8:25 PM OL OF OFL Edge W/L
430 SEATTLE429 GREEN BAY -3.5
2827
-1 4.1
Mon - 9/24,8:35 PM OL OF OFL Edge W/L
TOP STATFOX OUTPLAY FACTOR RATING EDGES:
1. NEW ORLEANS (-9) over KANSAS CITY 162. CLEVELAND (+3) over BUFFALO 8.83. NEW ENGLAND (+3) over BALTIMORE 8.4
NFL staFF pIcks staNdINGs *
All Games W L T Pct Last Week
StatFox Dave 17 13 2 56.7% 8-6-2
StatFox Scott 16 14 2 53.3% 8-6-2
StatFox Forecaster 16 14 2 53.3% 10-4-2
StatFox Gary 15 15 2 50.0% 8-6-2
StatFox Brian 14 16 2 46.7% 6-8-2
StatFox Consensus 14 16 2 46.7% 7-7-2
NFL Best Bets (ATS) W L T Pct Last Week
StatFox Dave 7 3 1 70.0% 3-1-1
StatFox Brian 4 2 0 66.7% 1-2
StatFox Gary 3 4 0 42.9% 2-1
StatFox Scott 1 6 0 16.7% 0-3
TOTAL 15 15 1 50.0% 6-7-1
* [Standings reflect games played through Monday, September 17.]

N F L G A M E B R E A K D OW N S : W E E K 3
4 www.StatFox.com
T h E P L AT i N u M S h E E T
S TAT F O x F O R E c A S T E R :
NY GIANTS 27CAROLINA 27
S TAT F O x F O R E c A S T E R :
ST. LOUIS 15CHICAGO 23
S TAT F O x F O R E c A S T E R :
BUFFALO 20CLEVELAND 22
Key Betting trend: NY GIANTS are 15-4 ATS away after a playing a game where 60 total points or more were scored since 1992.
SerieS hiStory – LaSt 5 SeaSonS: CAROLINA is 1-2 ATS (1-2 SU) vs. NY GIANTS (0-0 ATS, 0-0 SU at home.)
StatFox Six PacK:CAROLINA is 22-5 UNDER at home off a win against a division rival since 1992.CAROLINA is 67-38 UNDER off a division game since 1992.CAROLINA is 35-14 UNDER off a win against a division rival since 1992.NY GIANTS are 26-10 ATS away after gaining 6 or more yards/play in their previous game since 1992.NY GIANTS are 53-34 ATS off a home win since 1992.NY GIANTS are 23-10 ATS away after allowing 30 points or more last game since 1992.
Betting SyStem: Home teams where the total is 42.5-49 points - after a game where they committed 4+ turnovers against opponent after a game with a TO margin of -2 or worse. (60-26 Under) Play = Under the total
SerieS hiStory – LaSt 5 SeaSonS: CHICAGO is 1-1 ATS (2-0 SU) vs. ST LOUIS (0-1 ATS, 1-0 SU at home.)
StatFox Six PacK:CHICAGO is 48-21 UNDER after a game with a turnover margin of -2 or worse since 1992.CHICAGO is 23-9 UNDER at home after a game with a turnover margin of -2 or worse since 1992.CHICAGO is 78-54 OVER as a favorite since 1992.ST LOUIS is 0-7 ATS after playing a game at home over the L2 seasons.ST LOUIS is 10-25 ATS away after a game with a turnover margin of -2 or worse since 1992.ST LOUIS is 120-157 ATS in all lined games since 1992.
Betting SyStem: Home teams where the line is +3 to -3 - off a road loss, in the first month of the season, after closing out last season with 2 or more straight losses. (14-46 ATS) Play = BUFFALO against the spread
SerieS hiStory – LaSt 5 SeaSonS: CLEVELAND is 3-1 ATS (3-1 SU) vs. BUFFALO (1-0 ATS, 1-0 SU at home.)
StatFox Six PacK:CLEVELAND is 2-10 ATS at home when playing with 6 or less days rest over the L3 seasons.CLEVELAND is 12-2 UNDER in games played on a grass field over the L2 seasons.CLEVELAND is 7-0 UNDER after playing their last game on the road over the L2 seasons.BUFFALO is 4-13 ATS after gaining 150 or more rushing yards in 2 straight games since 1992.Chan Gailey is 4-15 ATS away after playing a game at home.BUFFALO is 8-1 OVER in the first half of the season over the L2 seasons.
game BreaKdown: The Giants’ patchwork defense will have their hands full in this one. With their injury-plagued secondary still rounding into form, not to mention their banged up lineback-ing corps, Tampa’s underwhelming offense scored 27 points against them in New York. The Panthers got their offense back on track in a home win over New Orleans last week, rushing 41 times for 219 yards as they steamrolled their way to a 35-27 victory. Eli Manning was strong in the Giants’ comeback against Tampa, finishing the victory with a career-high 510 yards, but also had three first-half interceptions to put them in a hole.
game BreaKdown: The Rams look to build on their momentum after a solid first two games of the Jeff Fisher era. After nearly upsetting the Lions in Detroit, St. Louis got on the board with a come-from-behind home victory over Washington in Week 2. Fisher might be starting to change the culture there. The Bears are coming off a Thursday night stinker in Green Bay, but did have the extra prep time to correct a disastrous offensive performance. They seem likely to be without top RB Matt Forte (ankle) for this one though. St. Louis’s top runner is also questionable, as Steven Jackson suffered a groin injury in Week 2.
game BreaKdown: The Bills bounced back to dominate K.C. at home last week. They had five sacks, forced three turnovers and ran for 201 yards in a 35-17 win. Cleveland’s two rookie corner-stones faltered badly in a season-opening loss, but QB Brandon Weeden (322 yards, no turnovers) and RB Trent Richardson (145 yards, 2 TDs on 23 touches) were much better in last week’s loss at Cincinnati. Buffalo has lost eight in a row SU on the road (1-6-1 ATS). The Browns have lost three in a row at home SU, but the last two have been winnable, a one-point loss to Philly in the opener and a four-point loss to Pittsburgh in last year’s finale.
• (303) NY GIANTS (SU: 1-1, ATS: 0-2) at (304) CAROLINA (SU: 1-1, ATS: 1-1)
team oFFenSe team deFenSe PdiF SS PPg Fd ruShing PaSSing totaL F-i PPg Fd ruShing PaSSing totaL F-i tod
NYGIANTS EVEN 15 29 23 22-88(4.0) 42-26-348(8.4) 64-436(6.8) 0-2 29 16 24-111(4.6) 28-18-259(9.1) 52-370(7.1) 0-2 -1
CAROLINA +1.0 19 22 20 27-114(4.2) 26-18-268(10.1) 53-382(7.2) 0-1 22 22 32-146(4.7) 36-24-226(6.2) 68-372(5.5) 0-1 -1
• (401) ST LOUIS (SU: 1-1, ATS: 2-0) at (402) CHICAGO (SU: 1-1, ATS: 1-1)
team oFFenSe team deFenSe PdiF SS PPg Fd ruShing PaSSing totaL F-i PPg Fd ruShing PaSSing totaL F-i tod
STLOUIS -0.5 21 27 18 27-114(4.2) 30-22-237(7.9) 57-351(6.2) 1-0 28 23 24-130(5.5) 38-26-272(7.1) 62-402(6.5) 0-2 +1
CHICAGO +3.5 20 26 18 28-104(3.7) 31-16-194(6.3) 59-298(5.1) 0-2 22 20 22-84(3.9) 39-23-254(6.5) 61-338(5.5) 2-2 +2
• (415) BUFFALO (SU: 1-1, ATS: 1-1) at (416) CLEVELAND (SU: 0-2, ATS: 1-0)
team oFFenSe team deFenSe PdiF SS PPg Fd ruShing PaSSing totaL F-i PPg Fd ruShing PaSSing totaL F-i tod
BUFFALO -1.0 16 32 18 31-198(6.4) 26-14-186(7.3) 57-384(6.7) 0-2 32 23 30-134(4.5) 34-21-269(7.8) 64-403(6.3) 1-1 E
CLEVELAND -4.0 22 22 16 22-114(5.1) 36-19-210(5.8) 58-324(5.6) 0-2 26 23 28-115(4.2) 44-26-300(6.9) 72-415(5.8) 0-2 +1
new yorK giantS (-2½)
St. LouiS ramS
BuFFaLo BiLLS (-3)
caroLina PantherS
chicago BearS (-10½)
cLeVeLand BrownS
vs
vs
vs
www.StatFox . com
www.StatFox.com 5
T h E P L AT i N u M S h E E T
S TAT F O x F O R E c A S T E R :
TAMPA BAY 19DALLAS 31
S TAT F O x F O R E c A S T E R :
NY JETS 16MIAMI 24
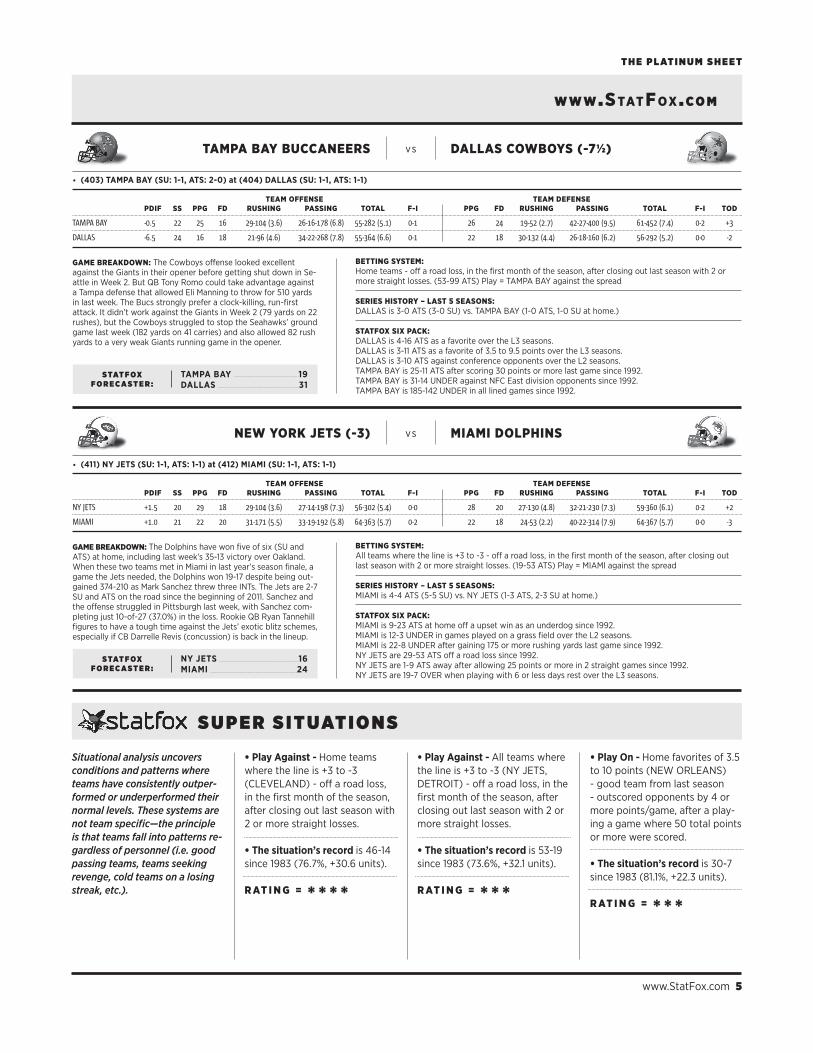
Betting SyStem: Home teams - off a road loss, in the first month of the season, after closing out last season with 2 or more straight losses. (53-99 ATS) Play = TAMPA BAY against the spread
SerieS hiStory – LaSt 5 SeaSonS: DALLAS is 3-0 ATS (3-0 SU) vs. TAMPA BAY (1-0 ATS, 1-0 SU at home.)
StatFox Six PacK:DALLAS is 4-16 ATS as a favorite over the L3 seasons.DALLAS is 3-11 ATS as a favorite of 3.5 to 9.5 points over the L3 seasons.DALLAS is 3-10 ATS against conference opponents over the L2 seasons.TAMPA BAY is 25-11 ATS after scoring 30 points or more last game since 1992.TAMPA BAY is 31-14 UNDER against NFC East division opponents since 1992.TAMPA BAY is 185-142 UNDER in all lined games since 1992.
Betting SyStem: All teams where the line is +3 to -3 - off a road loss, in the first month of the season, after closing out last season with 2 or more straight losses. (19-53 ATS) Play = MIAMI against the spread
SerieS hiStory – LaSt 5 SeaSonS: MIAMI is 4-4 ATS (5-5 SU) vs. NY JETS (1-3 ATS, 2-3 SU at home.)
StatFox Six PacK:MIAMI is 9-23 ATS at home off a upset win as an underdog since 1992.MIAMI is 12-3 UNDER in games played on a grass field over the L2 seasons.MIAMI is 22-8 UNDER after gaining 175 or more rushing yards last game since 1992.NY JETS are 29-53 ATS off a road loss since 1992.NY JETS are 1-9 ATS away after allowing 25 points or more in 2 straight games since 1992.NY JETS are 19-7 OVER when playing with 6 or less days rest over the L3 seasons.
game BreaKdown: The Cowboys offense looked excellent against the Giants in their opener before getting shut down in Se-attle in Week 2. But QB Tony Romo could take advantage against a Tampa defense that allowed Eli Manning to throw for 510 yards in last week. The Bucs strongly prefer a clock-killing, run-first attack. It didn’t work against the Giants in Week 2 (79 yards on 22 rushes), but the Cowboys struggled to stop the Seahawks’ ground game last week (182 yards on 41 carries) and also allowed 82 rush yards to a very weak Giants running game in the opener.
game BreaKdown: The Dolphins have won five of six (SU and ATS) at home, including last week’s 35-13 victory over Oakland. When these two teams met in Miami in last year’s season finale, a game the Jets needed, the Dolphins won 19-17 despite being out-gained 374-210 as Mark Sanchez threw three INTs. The Jets are 2-7 SU and ATS on the road since the beginning of 2011. Sanchez and the offense struggled in Pittsburgh last week, with Sanchez com-pleting just 10-of-27 (37.0%) in the loss. Rookie QB Ryan Tannehill figures to have a tough time against the Jets’ exotic blitz schemes, especially if CB Darrelle Revis (concussion) is back in the lineup.
• (403) TAMPA BAY (SU: 1-1, ATS: 2-0) at (404) DALLAS (SU: 1-1, ATS: 1-1)
team oFFenSe team deFenSe PdiF SS PPg Fd ruShing PaSSing totaL F-i PPg Fd ruShing PaSSing totaL F-i tod
TAMPABAY -0.5 22 25 16 29-104(3.6) 26-16-178(6.8) 55-282(5.1) 0-1 26 24 19-52(2.7) 42-27-400(9.5) 61-452(7.4) 0-2 +3
DALLAS -6.5 24 16 18 21-96(4.6) 34-22-268(7.8) 55-364(6.6) 0-1 22 18 30-132(4.4) 26-18-160(6.2) 56-292(5.2) 0-0 -2
• (411) NY JETS (SU: 1-1, ATS: 1-1) at (412) MIAMI (SU: 1-1, ATS: 1-1)
team oFFenSe team deFenSe PdiF SS PPg Fd ruShing PaSSing totaL F-i PPg Fd ruShing PaSSing totaL F-i tod
NYJETS +1.5 20 29 18 29-104(3.6) 27-14-198(7.3) 56-302(5.4) 0-0 28 20 27-130(4.8) 32-21-230(7.3) 59-360(6.1) 0-2 +2
MIAMI +1.0 21 22 20 31-171(5.5) 33-19-192(5.8) 64-363(5.7) 0-2 22 18 24-53(2.2) 40-22-314(7.9) 64-367(5.7) 0-0 -3
S u P E R S i T u AT i O N S
Situational analysis uncovers conditions and patterns where teams have consistently outper-formed or underperformed their normal levels. These systems are not team specific—the principle is that teams fall into patterns re-gardless of personnel (i.e. good passing teams, teams seeking revenge, cold teams on a losing streak, etc.).
• Play Against - Home teams where the line is +3 to -3 (CLEVELAND) - off a road loss, in the first month of the season, after closing out last season with 2 or more straight losses. • The situation’s record is 46-14 since 1983 (76.7%, +30.6 units). r at i n g = * * * *
• Play Against - All teams where the line is +3 to -3 (NY JETS, DETROIT) - off a road loss, in the first month of the season, after closing out last season with 2 or more straight losses. • The situation’s record is 53-19 since 1983 (73.6%, +32.1 units). r at i n g = * * *
• Play On - Home favorites of 3.5 to 10 points (NEW ORLEANS) - good team from last season - outscored opponents by 4 or more points/game, after a play-ing a game where 50 total points or more were scored. • The situation’s record is 30-7 since 1983 (81.1%, +22.3 units). r at i n g = * * *
tamPa Bay BuccaneerS
new yorK JetS (-3)
daLLaS cowBoyS (-7½)
miami doLPhinS
vs
vs

N F L G A M E B R E A K D OW N S : W E E K 3
6 www.StatFox.com
T h E P L AT i N u M S h E E T
S TAT F O x F O R E c A S T E R :
SAN FRANCISCO 24MINNESOTA 19
S TAT F O x F O R E c A S T E R :
KANSAS CITY 14NEW ORLEANS 31
S TAT F O x F O R E c A S T E R :
CINCINNATI 24WASHINGTON 25
Betting SyStem: Any team where the total is between 42.5 and 49 points - good rushing defense from last season - al-lowed 90 or less rushing yards/game. (44-18 Under) Play = Under the total
SerieS hiStory – LaSt 5 SeaSonS: MINNESOTA is 1-1 ATS (2-0 SU) vs. SAN FRANCISCO (0-1 ATS, 1-0 SU at home.)
StatFox Six Pack:Leslie Frazier is 8-1 OVER at home when playing with 6 or less days rest as coach of MINNESOTA.Leslie Frazier is 9-2 OVER in home lined games as coach of MINNESOTA.Leslie Frazier is 9-2 OVER at home in dome games as coach of MINNESOTA.SAN FRANCISCO is 8-0 ATS in the first half of the season over the L2 seasons.SAN FRANCISCO is 6-0 ATS as a favorite of 3.5 to 9.5 points over the L2 seasons.SAN FRANCISCO is 14-5 ATS in all lined games over the L2 seasons.
Betting SyStem: Home favorites of 3.5 to 10 points - good team from last season - outscored opponents by 4+ PPG, after a playing a game where 50 total points or more were scored. (30-7 ATS) Play = NEW ORLEANS ATS
SerieS hiStory – LaSt 5 SeaSonS: NEW ORLEANS is 1-0 ATS (1-0 SU) vs. KANSAS CITY (0-0 ATS, 0-0 SU at home.)
StatFox Six Pack:NEW ORLEANS is 9-1 ATS as a home favorite over the L2 seasons.NEW ORLEANS is 9-1 ATS in a home game where total is greater than or equal to 45.5 over L2 seasons.NEW ORLEANS is 11-2 ATS in dome games over the L2 seasons.KANSAS CITY is 22-6 ATS after allowing 25 points or more in 2 straight games since 1992.KANSAS CITY is 22-8 ATS away after a loss by 10 or more points since 1992.KANSAS CITY is 3-13 ATS away after gaining 375 or more total yards in 2 consecutive games since 1992.
Betting SyStem: Any team where the total is between 42.5 and 49 points - good offense from last season - averaged 5.4 or more yards/play, in non-conference games. (39-12 Under) Play = Under the total
SerieS hiStory – LaSt 5 SeaSonS: WASHINGTON is 0-1 ATS (0-1 SU) vs. CINCINNATI (0-0 ATS, 0-0 SU at home.)
StatFox Six Pack:WASHINGTON is 47-79 ATS as a favorite since 1992.WASHINGTON is 9-23 ATS at home after gaining 6+ yards/play in their previous game since 1992.WASHINGTON is 27-47 ATS as a favorite of 3.5 to 9.5 points since 1992.CINCINNATI is 10-1 ATS after allowing 400 or more total yards in 2 consecutive games since 1992.CINCINNATI is 63-87 ATS off 1 or more straight overs since 1992.CINCINNATI is 14-4 OVER in all lined games over the L2 seasons.
game Breakdown: The Niners look to continue their early-season dominance. San Fran scored a road win over Green Bay to start the year, and had a convincing win over Detroit at home last week despite an uncharacteristic turnover (fumbled kickoff return) costing them three points. Surprisingly, the Niners had failed to cover in their previous four road games before the Green Bay victory. The Vikings obviously rely heavily on Adrian Peterson and the run game to set up their passing game, but the Niners continue to have the best run defense (and all-around defense) in the NFL (allowing three TDs combined to Detroit and Green Bay).
game Breakdown: These teams are licking their wounds com-ing into this game. The Chiefs are once again a team that lacks any explosiveness offensively (aside from garbage time) and through two weeks hasn’t stopped anyone on defense (they’ve allowed 68 points to opposing offenses). The Saints certainly have the offense to take advantage, but they’ve been unable to stop anyone. Their issues have been against athletic quarterbacks (Robert Griffin III and Cam Newton), something that Matt Cassel is not, but the Chiefs do have the kind of smashmouth running game that could give the Saints fits.
game Breakdown: The Bengals now have two weeks of tape to watch on the Skins’ new, Robert Griffin III-led offense. RG3 nearly pulled off a second road win last week, as a last-second drive in St. Louis was diffused by a personal foul penalty. The ‘Skins have been relying on big plays, and Cincinnati allowed 300-yard pass-ing games in each of their first two games. Cincinnati is just 0-3-2 ATS over their last five road games. After struggling to move the ball in the second half of their opener at Baltimore, they did put up 34 points in their victory over Cleveland, but they continue to struggle in pass protection (10 sacks allowed).
• (405) SAN FRANCISCO (SU: 2-0, ATS: 2-0) at (406) MINNESOTA (SU: 1-1, ATS: 0-1)
team oFFenSe team deFenSe PdiF SS PPg Fd ruShing PaSSing totaL F-i PPg Fd ruShing PaSSing totaL F-i tod
SANFRANCISCO +8.0 25 28 23 30-167(5.7) 28-20-196(6.9) 58-363(6.3) 0-0 20 18 20-64(3.2) 38-24-246(6.5) 58-310(5.3) 0-1 +1
MINNESOTA EVEN 14 23 20 28-109(4.0) 31-24-249(8.0) 59-358(6.1) 1-0 23 20 32-98(3.1) 35-22-218(6.2) 67-316(4.7) 0-0 -1
• (413) KANSAS CITY (SU: 0-2, ATS: 0-2) at (414) NEW ORLEANS (SU: 0-2, ATS: 0-2)
team oFFenSe team deFenSe PdiF SS PPg Fd ruShing PaSSing totaL F-i PPg Fd ruShing PaSSing totaL F-i tod
KANSASCITY -17.0 20 20 24 28-151(5.3) 38-22-256(6.8) 66-407(6.2) 2-2 38 18 30-142(4.8) 25-16-235(9.4) 55-377(6.9) 0-0 -6
NEWORLEANS -8.0 18 30 26 18-98(5.3) 50-28-324(6.4) 68-422(6.2) 0-2 38 22 42-186(4.4) 23-16-278(12.1) 65-464(7.1) 0-0 -4
• (409) CINCINNATI (SU: 1-1, ATS: 0-1) at (410) WASHINGTON (SU: 1-1, ATS: 1-1)
team oFFenSe team deFenSe PdiF SS PPg Fd ruShing PaSSing totaL F-i PPg Fd ruShing PaSSing totaL F-i tod
CINCINNATI -12.0 22 24 20 26-104(3.9) 34-23-244(7.2) 60-348(5.8) 0-1 36 24 23-126(5.5) 34-24-308(8.9) 57-434(7.6) 0-0 -2
WASHINGTON +2.5 20 34 20 36-164(4.5) 28-20-254(9.2) 64-418(6.5) 0-0 32 24 18-92(4.9) 44-25-314(7.2) 62-406(6.5) 2-2 +5
San FranciSco 49erS (-6)
kanSaS city chieFS
cincinnati BengaLS
minneSota VikingS
new orLeanS SaintS (-10)
waShington redSkinS (-2)
vs
vs
vs
www.StatFox . com
www.StatFox.com 7
T h E P L AT i N u M S h E E T
S TAT F O x F O R E c A S T E R :
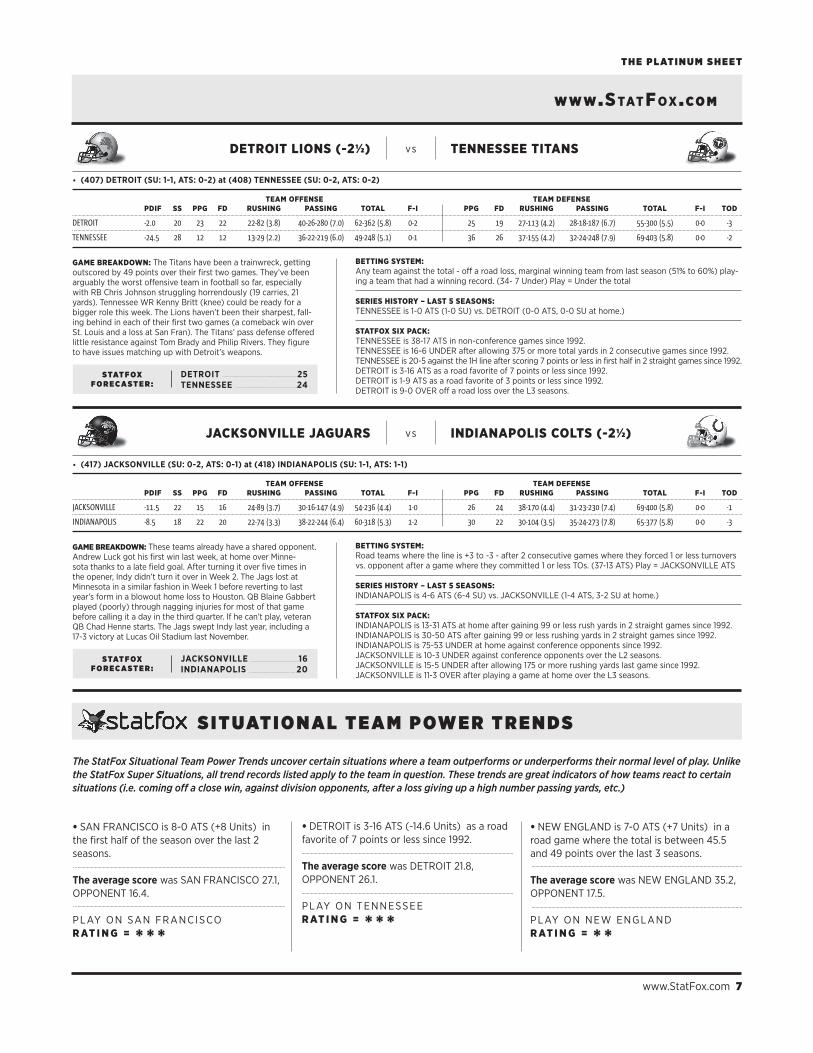
DETROIT 25TENNESSEE 24
S TAT F O x F O R E c A S T E R :
JACKSONVILLE 16INDIANAPOLIS 20
Betting SyStem: Any team against the total - off a road loss, marginal winning team from last season (51% to 60%) play-ing a team that had a winning record. (34- 7 Under) Play = Under the total
SerieS hiStory – LaSt 5 SeaSonS: TENNESSEE is 1-0 ATS (1-0 SU) vs. DETROIT (0-0 ATS, 0-0 SU at home.)
StatFox Six Pack:TENNESSEE is 38-17 ATS in non-conference games since 1992.TENNESSEE is 16-6 UNDER after allowing 375 or more total yards in 2 consecutive games since 1992.TENNESSEE is 20-5 against the 1H line after scoring 7 points or less in first half in 2 straight games since 1992.DETROIT is 3-16 ATS as a road favorite of 7 points or less since 1992.DETROIT is 1-9 ATS as a road favorite of 3 points or less since 1992.DETROIT is 9-0 OVER off a road loss over the L3 seasons.
Betting SyStem: Road teams where the line is +3 to -3 - after 2 consecutive games where they forced 1 or less turnovers vs. opponent after a game where they committed 1 or less TOs. (37-13 ATS) Play = JACKSONVILLE ATS
SerieS hiStory – LaSt 5 SeaSonS: INDIANAPOLIS is 4-6 ATS (6-4 SU) vs. JACKSONVILLE (1-4 ATS, 3-2 SU at home.)
StatFox Six Pack:INDIANAPOLIS is 13-31 ATS at home after gaining 99 or less rush yards in 2 straight games since 1992.INDIANAPOLIS is 30-50 ATS after gaining 99 or less rushing yards in 2 straight games since 1992.INDIANAPOLIS is 75-53 UNDER at home against conference opponents since 1992.JACKSONVILLE is 10-3 UNDER against conference opponents over the L2 seasons.JACKSONVILLE is 15-5 UNDER after allowing 175 or more rushing yards last game since 1992.JACKSONVILLE is 11-3 OVER after playing a game at home over the L3 seasons.
game Breakdown: The Titans have been a trainwreck, getting outscored by 49 points over their first two games. They’ve been arguably the worst offensive team in football so far, especially with RB Chris Johnson struggling horrendously (19 carries, 21 yards). Tennessee WR Kenny Britt (knee) could be ready for a bigger role this week. The Lions haven’t been their sharpest, fall-ing behind in each of their first two games (a comeback win over St. Louis and a loss at San Fran). The Titans’ pass defense offered little resistance against Tom Brady and Philip Rivers. They figure to have issues matching up with Detroit’s weapons.
game Breakdown: These teams already have a shared opponent. Andrew Luck got his first win last week, at home over Minne-sota thanks to a late field goal. After turning it over five times in the opener, Indy didn’t turn it over in Week 2. The Jags lost at Minnesota in a similar fashion in Week 1 before reverting to last year’s form in a blowout home loss to Houston. QB Blaine Gabbert played (poorly) through nagging injuries for most of that game before calling it a day in the third quarter. If he can’t play, veteran QB Chad Henne starts. The Jags swept Indy last year, including a 17-3 victory at Lucas Oil Stadium last November.
• (407) DETROIT (SU: 1-1, ATS: 0-2) at (408) TENNESSEE (SU: 0-2, ATS: 0-2)
team oFFenSe team deFenSe PdiF SS PPg Fd ruShing PaSSing totaL F-i PPg Fd ruShing PaSSing totaL F-i tod
DETROIT -2.0 20 23 22 22-82(3.8) 40-26-280(7.0) 62-362(5.8) 0-2 25 19 27-113(4.2) 28-18-187(6.7) 55-300(5.5) 0-0 -3
TENNESSEE -24.5 28 12 12 13-29(2.2) 36-22-219(6.0) 49-248(5.1) 0-1 36 26 37-155(4.2) 32-24-248(7.9) 69-403(5.8) 0-0 -2
• (417) JACKSONVILLE (SU: 0-2, ATS: 0-1) at (418) INDIANAPOLIS (SU: 1-1, ATS: 1-1)
team oFFenSe team deFenSe PdiF SS PPg Fd ruShing PaSSing totaL F-i PPg Fd ruShing PaSSing totaL F-i tod
JACKSONVILLE -11.5 22 15 16 24-89(3.7) 30-16-147(4.9) 54-236(4.4) 1-0 26 24 38-170(4.4) 31-23-230(7.4) 69-400(5.8) 0-0 -1
INDIANAPOLIS -8.5 18 22 20 22-74(3.3) 38-22-244(6.4) 60-318(5.3) 1-2 30 22 30-104(3.5) 35-24-273(7.8) 65-377(5.8) 0-0 -3
detroit LionS (-2½)
JackSonViLLe JaguarS
tenneSSee titanS
indianaPoLiS coLtS (-2½)
vs
vs
The StatFox Situational Team Power Trends uncover certain situations where a team outperforms or underperforms their normal level of play. Unlike the StatFox Super Situations, all trend records listed apply to the team in question. These trends are great indicators of how teams react to certain situations (i.e. coming off a close win, against division opponents, after a loss giving up a high number passing yards, etc.)
• SAN FRANCISCO is 8-0 ATS (+8 Units) in the first half of the season over the last 2 seasons.
The average score was SAN FRANCISCO 27.1, OPPONENT 16.4.
PLAY ON SAN FRANCISCO r at i n g = * * *
• DETROIT is 3-16 ATS (-14.6 Units) as a road favorite of 7 points or less since 1992.
The average score was DETROIT 21.8, OPPONENT 26.1.
PLAY ON TENNESSEE r at i n g = * * *
• NEW ENGLAND is 7-0 ATS (+7 Units) in a road game where the total is between 45.5 and 49 points over the last 3 seasons.
The average score was NEW ENGLAND 35.2, OPPONENT 17.5.
PLAY ON NEW ENGLAND r at i n g = * *
S i T u AT i O N A L T E A M P OW E R T R E N D S

N F L G A M E B R E A K D OW N S : W E E K 3
8 www.StatFox.com
T h E P L AT i N u M S h E E T
S TAT F O x F O R E c A S T E R :
PHILADELPHIA 21ARIZONA 20
S TAT F O x F O R E c A S T E R :
ATLANTA 23SAN DIEGO 26
S TAT F O x F O R E c A S T E R :
HOUSTON 21DENVER 18
Betting SyStem: Any team where the total is between 42.5 and 49 points - off a home no-cover where the team won as a favorite against opponent off an upset win as a road underdog. (35-9 Under) Play = Under the total
SerieS hiStory – LaSt 5 SeaSonS: ARIZONA is 2-1 ATS (2-1 SU) vs. PHILADELPHIA (1-0 ATS, 1-0 SU at home.)
StatFox Six Pack:ARIZONA is 4-15 ATS at home after 2 or more consecutive wins since 1992.ARIZONA is 26-13 ATS at home off a non-conference game since 1992.ARIZONA is 3-12 ATS after 2 straight wins by 6 or less points since 1992.PHILADELPHIA is 148-107 ATS against conference opponents since 1992.PHILADELPHIA is 29-15 ATS against NFC West division opponents since 1992.Andy Reid is 56-29 ATS away against conference opponents as coach of PHILADELPHIA.
Betting SyStem: Any team where the total is between 42.5 and 49 points - good offense from last season - averaged 5.4 or more yards/play, in non-conference games. (39-12 Under) Play = Under the total
SerieS hiStory – LaSt 5 SeaSonS: SAN DIEGO is 0-1 ATS (0-1 SU) vs. ATLANTA (0-1 ATS, 0-1 SU at home.)
StatFox Six Pack:SAN DIEGO is 8-1 ATS at home off a home blowout win by 21 points or more since 1992.SAN DIEGO is 8-1 ATS at home after a win by 28 or more points since 1992.SAN DIEGO is 95-70 ATS after 1 or more consecutive wins against the spread since 1992.Mike Smith is 40-27 ATS in all lined games as coach of ATLANTA.Mike Smith is 13-4 ATS in non-conference games as coach of ATLANTA.Mike Smith is 8-1 UNDER away in non-conference games as coach of ATLANTA.
key Betting trend: HOUSTON is 11-2 UNDER as a favorite over the L2 seasons.
SerieS hiStory – LaSt 5 SeaSonS: DENVER is 1-1 ATS (1-1 SU) vs. HOUSTON (1-0 ATS, 1-0 SU at home.)
StatFox Six Pack:DENVER is 52-26 OVER in a home game where the total is between 42.5 and 49 points since 1992.DENVER is 189-142 OVER in all lined games since 1992.DENVER is 98-65 OVER in home lined games since 1992.HOUSTON is 13-3 ATS in games played on a grass field over the L2 seasons.HOUSTON is 12-3 ATS against conference opponents over the L2 seasons.HOUSTON is 6-0 ATS in games where the line is +3 to -3 over the L2 seasons.
game Breakdown: The Eagles have turned it over nine times, but are 2-0 thanks to a high-powered offense, a very good defense and some timely playmaking. Arizona is coming off an upset in New England, beating the Pats despite just 245 yards of offense thanks to an improved D (four sacks of Tom Brady) and strong special teams (including a blocked punt). The Cards came to Philly last November and upset the then red-hot Eagles behind some John Skelton heroics. Skelton (ankle) will likely miss this game. Arizona also beat up Michael Vick last year, sacking him twice, intercepting two passes and holding him to 128 passing yards.
game Breakdown: San Diego is 2-0 despite a rash of injuries. They torched the Titans last week despite being without TE Antonio Gates, RB Ryan Mathews and LT Jared Gaither. There’s a good chance Mathews and Gates will be back for this game. The Falcons will present the first major test for San Diego’s suspect secondary though, as WRs Julio Jones and Roddy White will present a far tougher challenge than Oakland’s and Tennessee’s injury-ravaged receiving groups did. The Falcons have fared very well against the AFC in recent years, going 14-4 SU and 13-4-1 ATS against AFC opponents since 2008.
game Breakdown: Houston is staking its claim to be the AFC’s best defense. They’ll be in a chess match with Peyton Manning. While Manning’s arm strength isn’t back (leading to three INTs in Atlanta), he’s still capable of manipulating defenses with the best of them. Denver nearly came back to win in Atlanta Monday night despite four early turnovers. Denver’s run defense will be in for a challenge against Houston’s elite running game. They dominated a good Jacksonville D for 216 rushing yards last week, on the road. Houston is averaging 39 minutes of possession per game, a poten-tial advantage in keeping their defense fresh in Denver’s thin air.
• (419) PHILADELPHIA (SU: 2-0, ATS: 0-2) at (420) ARIZONA (SU: 2-0, ATS: 2-0)
team oFFenSe team deFenSe PdiF SS PPg Fd ruShing PaSSing totaL F-i PPg Fd ruShing PaSSing totaL F-i tod
PHILADELPHIA +1.0 22 20 26 36-140(3.9) 44-26-332(7.5) 80-472(5.9) 2-3 20 14 22-105(4.9) 38-17-162(4.2) 60-267(4.4) 0-2 -3
ARIZONA +3.0 26 20 17 26-74(2.8) 32-18-175(5.6) 58-249(4.3) 2-0 17 22 30-102(3.4) 40-23-218(5.4) 70-320(4.6) 0-1 -1
• (421) ATLANTA (SU: 2-0, ATS: 2-0) at (422) SAN DIEGO (SU: 2-0, ATS: 2-0)
team oFFenSe team deFenSe PdiF SS PPg Fd ruShing PaSSing totaL F-i PPg Fd ruShing PaSSing totaL F-i tod
ATLANTA(WEEK1) +16.0 12 40 21 23-84(3.7) 31-23-292(9.4) 54-376(7.0) 0-0 24 22 33-152(4.6) 33-21-241(7.3) 66-393(6.0) 1-2 +3
SANDIEGO +18.0 15 30 21 30-90(3.1) 32-24-247(7.6) 62-337(5.4) 0-0 12 15 15-42(2.8) 38-24-225(5.9) 53-267(5.0) 0-0 +1
• (423) HOUSTON (SU: 2-0, ATS: 2-0) at (424) DENVER (SU: 1-1, ATS: 1-1)
team oFFenSe team deFenSe PdiF SS PPg Fd ruShing PaSSing totaL F-i PPg Fd ruShing PaSSing totaL F-i tod
HOUSTON +20.0 19 28 24 42-150(3.6) 33-23-224(6.8) 75-374(5.0) 0-0 8 12 16-72(4.4) 28-14-124(4.4) 44-196(4.5) 1-2 +5
DENVER(WEEK1) +12.0 23 31 20 27-94(3.5) 26-19-240(9.2) 53-334(6.3) 1-0 19 19 26-75(2.9) 40-22-209(5.2) 66-284(4.3) 0-1 E
PhiLadeLPhia eagLeS (-5)
atLanta FaLconS
houSton texanS
ariZona cardinaLS
San diego chargerS (-2½)
denVer BroncoS (-1)
vs
vs
vs

www.StatFox . com
www.StatFox.com 9
T h E P L AT i N u M S h E E T
S TAT F O x F O R E c A S T E R :
PITTSBURGH 24OAKLAND 18
S TAT F O x F O R E c A S T E R :
NEW ENGLAND 24BALTIMORE 24
Betting SyStem: Any team against the total - after gaining 50 or less rushing yards last game against opponent after gaining 75 or less rushing yards last game. (60-22 Over) Play = Over the total
SerieS hiStory – LaSt 5 SeaSonS: OAKLAND is 1-1 ATS (1-1 SU) vs. PITTSBURGH (0-0 ATS, 0-0 SU at home.)
StatFox Six Pack:OAKLAND is 5-21 ATS at home after scoring 17 points or less in 2 straight games since 1992.OAKLAND is 13-28 ATS as a home underdog of 7 points or less since 1992.OAKLAND is 6-0 ATS after gaining 300 or more passing yards in last game over the L3 seasons.PITTSBURGH is 0-7 ATS away in games played on a grass field over the L2 seasons.PITTSBURGH is 89-56 ATS as a favorite of 3.5 to 9.5 points since 1992.PITTSBURGH is 1-8 ATS off a home win by 10 points or more over the L3 seasons.
Betting SyStem: Road teams against the total - off an upset loss as a home favorite, in the first half of the season. (35-8 Over) Play = Over the total
SerieS hiStory – LaSt 5 SeaSonS: BALTIMORE is 3-1 ATS (1-4 SU) vs. NEW ENGLAND (1-0 ATS, 0-1 SU at home.)
StatFox Six Pack:BALTIMORE is 11-2 ATS after allowing 350 or more passing yards in their last game since 1992.BALTIMORE is 56-37 ATS as a home favorite since 1992.BALTIMORE is 36-20 ATS as a home favorite of 7 points or less since 1992.NEW ENGLAND is 77-45 ATS as an underdog since 1992.NEW ENGLAND is 7-0 ATS in a road game where the total is 45.5-49 points over the L3 seasons.NEW ENGLAND is 56-37 ATS as a road underdog since 1992.
game Breakdown: Oakland has surprised the Steelers before, upsetting them as heavy underdogs in 2006 (a 20-13 win in Oak-land as nine-point underdogs) and 2009 (27-24 in Pittsburgh as 14.5-point dogs). But they’re coming off disastrous performances in the first two weeks, piling up penalties and mistakes in a Week 1 home loss to San Diego and embarrassment last week in Miami. The Steelers, meanwhile, looked sharp in dominating the Jets in Week 2. Their defense smothered the Jets despite the absence of OLB James Harrison and S Troy Polamalu, their two best players.
game Breakdown: The Pats are coming off their worst game in recent memory, looking completely out of sorts against Arizona after losing TE Aaron Hernandez (ankle). Hernandez won’t play in this one. The Ravens are playing with a chip on their shoulder after they felt they were robbed in Philly last week, and because of their AFC title game loss in New England. The Ravens have lost their last two SU to the Patriots (both in New England), but got an ATS win and a push. They’re 3-1-1 ATS against the Pats since 2007. Baltimore’s no-huddle was a hit in their opener at home against Cincy, but was less effective in Philly last week.
• (425) PITTSBURGH (SU: 1-1, ATS: 1-1) at (426) OAKLAND (SU: 0-2, ATS: 0-2)
team oFFenSe team deFenSe PdiF SS PPg Fd ruShing PaSSing totaL F-i PPg Fd ruShing PaSSing totaL F-i tod
PITTSBURGH +2.5 18 23 20 27-70(2.6) 36-23-237(6.7) 63-307(4.9) 0-0 20 18 24-92(3.8) 26-14-184(7.0) 50-276(5.5) 1-0 +1
OAKLAND -15.0 24 14 20 17-34(2.0) 47-28-324(6.9) 64-358(5.6) 0-0 28 20 32-148(4.7) 32-21-208(6.6) 64-356(5.6) 0-0 -2
• (427) NEW ENGLAND (SU: 1-1, ATS: 1-1) at (428) BALTIMORE (SU: 1-1, ATS: 2-0)
team oFFenSe team deFenSe PdiF SS PPg Fd ruShing PaSSing totaL F-i PPg Fd ruShing PaSSing totaL F-i tod
NEWENGLAND +9.5 17 26 25 32-126(4.0) 38-26-262(6.8) 70-388(5.5) 0-0 16 16 24-62(2.6) 35-22-202(5.8) 59-264(4.5) 2-0 +3
BALTIMORE +15.0 22 34 22 22-116(5.3) 37-22-261(7.1) 59-377(6.4) 0-0 18 23 34-129(3.7) 34-22-275(8.0) 68-404(5.9) 2-2 +4
PittSBurgh SteeLerS (-3)
new engLand PatriotS
oakLand raiderS
BaLtimore raVenS (-2½)
vs
vs
S TAT F O x F O R E c A S T E R :
GREEN BAY 24SEATTLE 25
Betting SyStem: Favorites - off a win against a division rival, when playing on Monday night. (53-20 ATS) Play = GREEN BAY against the spread
SerieS hiStory – LaSt 5 SeaSonS: SEATTLE is 0-3 ATS (0-3 SU) vs. GREEN BAY (0-1 ATS, 0-1 SU at home.)
StatFox Six Pack:SEATTLE is 11-3 ATS at home against conference opponents over the L3 seasons.SEATTLE is 6-16 ATS off an upset win by 10 points or more as an underdog since 1992.SEATTLE is 67-36 OVER as an underdog of 3.5 to 9.5 points since 1992.Mike McCarthy is 9-1 ATS away after a 2 game home stand as coach of GREEN BAY.GREEN BAY is 192-151 OVER in all lined games since 1992.GREEN BAY is 135-99 OVER as a favorite since 1992.
game Breakdown: The Seahawks just dominated the Cowboys at home last week, and now they’ll have a chance to surprise a Packers offense that isn’t quite hitting on all cylinders yet. The Pack did get some extra prep time after playing a Thursday nighter last week, a win over Chicago behind a great defensive performance. They’ve faced two great defenses in San Francisco and Chicago, both at home, and their offense has managed as many turnovers as touchdowns (three). Seattle is playing conser-vatively on offense with rookie QB Russell Wilson under center, but their defense has been excellent through the first two games.
• (429) GREEN BAY (SU: 1-1, ATS: 1-1) at (430) SEATTLE (SU: 1-1, ATS: 1-1)
team oFFenSe team deFenSe PdiF SS PPg Fd ruShing PaSSing totaL F-i PPg Fd ruShing PaSSing totaL F-i tod
GREENBAY +2.5 24 22 20 21-76(3.6) 38-26-247(6.4) 59-323(5.5) 0-1 20 16 28-140(5.1) 26-16-132(5.0) 54-272(5.0) 0-2 +1
SEATTLE +8.0 20 22 19 37-148(4.0) 27-16-136(5.0) 64-284(4.4) 0-0 14 18 18-46(2.6) 38-22-228(6.0) 56-274(4.9) 1-1 +2
green Bay PackerS (-6) SeattLe SeahawkSvs
10 www.StatFox.com
T h e P l aT i n u m S h e e T
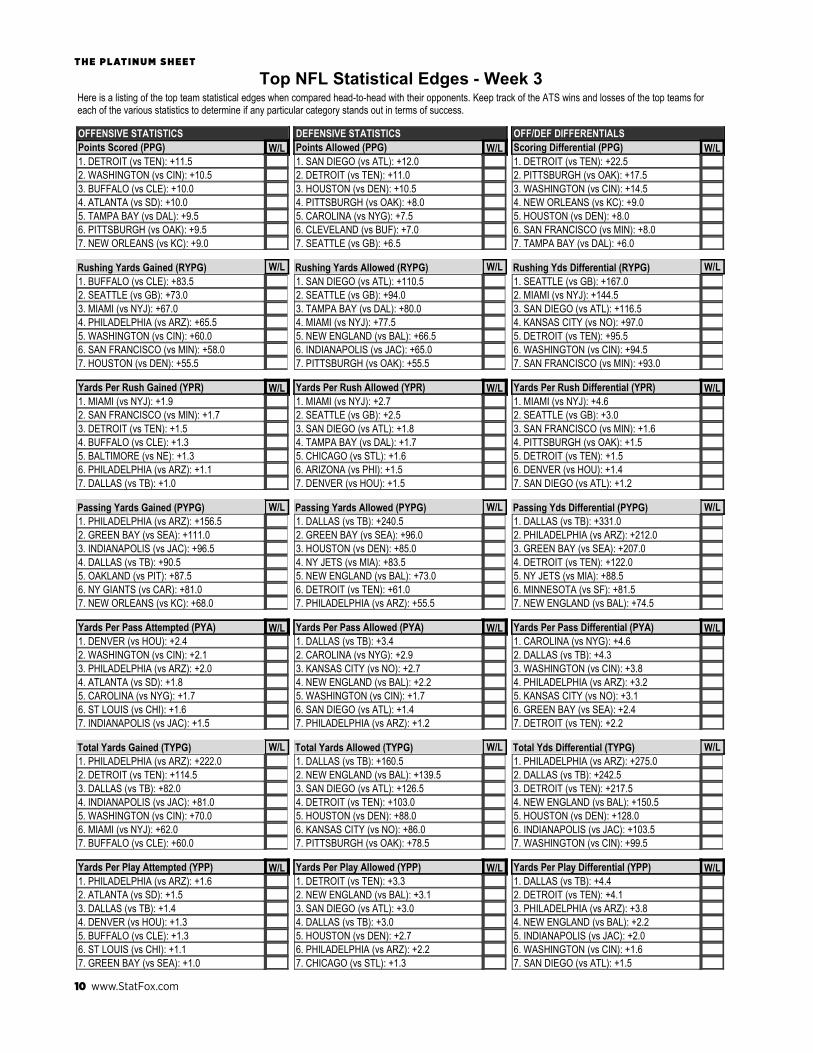
Here is a listing of the top team statistical edges when compared head-to-head with their opponents. Keep track of the ATS wins and losses of the top teams for each of the various statistics to determine if any particular category stands out in terms of success.
Top NFL Statistical Edges - Week 3
W/LPoints Scored (PPG)
W/LRushing Yards Gained (RYPG)
W/LYards Per Rush Gained (YPR)
W/LPassing Yards Gained (PYPG)
W/LYards Per Pass Attempted (PYA)
W/LTotal Yards Gained (TYPG)
W/LYards Per Play Attempted (YPP)
W/LTurnovers Committed Per Game (TOPG)
W/LPoints Allowed (PPG)
W/LRushing Yards Allowed (RYPG)
W/LYards Per Rush Allowed (YPR)
W/LPassing Yards Allowed (PYPG)
W/LYards Per Pass Allowed (PYA)
W/LTotal Yards Allowed (TYPG)
W/LYards Per Play Allowed (YPP)
W/LTurnovers Forced Per Game (TOPG)
W/LScoring Differential (PPG)
W/LRushing Yds Differential (RYPG)
W/LYards Per Rush Differential (YPR)
W/LPassing Yds Differential (PYPG)
W/LYards Per Pass Differential (PYA)
W/LTotal Yds Differential (TYPG)
W/LYards Per Play Differential (YPP)
W/LTurnover Differential (TODiff)
OFFENSIVE STATISTICS DEFENSIVE STATISTICS OFF/DEF DIFFERENTIALS
1. DETROIT (vs TEN): +11.52. WASHINGTON (vs CIN): +10.53. BUFFALO (vs CLE): +10.04. ATLANTA (vs SD): +10.05. TAMPA BAY (vs DAL): +9.56. PITTSBURGH (vs OAK): +9.57. NEW ORLEANS (vs KC): +9.0
1. BUFFALO (vs CLE): +83.52. SEATTLE (vs GB): +73.03. MIAMI (vs NYJ): +67.04. PHILADELPHIA (vs ARZ): +65.55. WASHINGTON (vs CIN): +60.06. SAN FRANCISCO (vs MIN): +58.07. HOUSTON (vs DEN): +55.5
1. MIAMI (vs NYJ): +1.92. SAN FRANCISCO (vs MIN): +1.73. DETROIT (vs TEN): +1.54. BUFFALO (vs CLE): +1.35. BALTIMORE (vs NE): +1.36. PHILADELPHIA (vs ARZ): +1.17. DALLAS (vs TB): +1.0
1. PHILADELPHIA (vs ARZ): +156.52. GREEN BAY (vs SEA): +111.03. INDIANAPOLIS (vs JAC): +96.54. DALLAS (vs TB): +90.55. OAKLAND (vs PIT): +87.56. NY GIANTS (vs CAR): +81.07. NEW ORLEANS (vs KC): +68.0
1. DENVER (vs HOU): +2.42. WASHINGTON (vs CIN): +2.13. PHILADELPHIA (vs ARZ): +2.04. ATLANTA (vs SD): +1.85. CAROLINA (vs NYG): +1.76. ST LOUIS (vs CHI): +1.67. INDIANAPOLIS (vs JAC): +1.5
1. PHILADELPHIA (vs ARZ): +222.02. DETROIT (vs TEN): +114.53. DALLAS (vs TB): +82.04. INDIANAPOLIS (vs JAC): +81.05. WASHINGTON (vs CIN): +70.06. MIAMI (vs NYJ): +62.07. BUFFALO (vs CLE): +60.0
1. PHILADELPHIA (vs ARZ): +1.62. ATLANTA (vs SD): +1.53. DALLAS (vs TB): +1.44. DENVER (vs HOU): +1.35. BUFFALO (vs CLE): +1.36. ST LOUIS (vs CHI): +1.17. GREEN BAY (vs SEA): +1.0
1. ARIZONA (vs PHI): +2.52. JACKSONVILLE (vs IND): +1.53. ST LOUIS (vs CHI): +1.04. HOUSTON (vs DEN): +1.05. NY JETS (vs MIA): +1.06. WASHINGTON (vs CIN): +1.07. CAROLINA (vs NYG): +0.5
1. SAN DIEGO (vs ATL): +12.02. DETROIT (vs TEN): +11.03. HOUSTON (vs DEN): +10.54. PITTSBURGH (vs OAK): +8.05. CAROLINA (vs NYG): +7.56. CLEVELAND (vs BUF): +7.07. SEATTLE (vs GB): +6.5
1. SAN DIEGO (vs ATL): +110.52. SEATTLE (vs GB): +94.03. TAMPA BAY (vs DAL): +80.04. MIAMI (vs NYJ): +77.55. NEW ENGLAND (vs BAL): +66.56. INDIANAPOLIS (vs JAC): +65.07. PITTSBURGH (vs OAK): +55.5
1. MIAMI (vs NYJ): +2.72. SEATTLE (vs GB): +2.53. SAN DIEGO (vs ATL): +1.84. TAMPA BAY (vs DAL): +1.75. CHICAGO (vs STL): +1.66. ARIZONA (vs PHI): +1.57. DENVER (vs HOU): +1.5
1. DALLAS (vs TB): +240.52. GREEN BAY (vs SEA): +96.03. HOUSTON (vs DEN): +85.04. NY JETS (vs MIA): +83.55. NEW ENGLAND (vs BAL): +73.06. DETROIT (vs TEN): +61.07. PHILADELPHIA (vs ARZ): +55.5
1. DALLAS (vs TB): +3.42. CAROLINA (vs NYG): +2.93. KANSAS CITY (vs NO): +2.74. NEW ENGLAND (vs BAL): +2.25. WASHINGTON (vs CIN): +1.76. SAN DIEGO (vs ATL): +1.47. PHILADELPHIA (vs ARZ): +1.2
1. DALLAS (vs TB): +160.52. NEW ENGLAND (vs BAL): +139.53. SAN DIEGO (vs ATL): +126.54. DETROIT (vs TEN): +103.05. HOUSTON (vs DEN): +88.06. KANSAS CITY (vs NO): +86.07. PITTSBURGH (vs OAK): +78.5
1. DETROIT (vs TEN): +3.32. NEW ENGLAND (vs BAL): +3.13. SAN DIEGO (vs ATL): +3.04. DALLAS (vs TB): +3.05. HOUSTON (vs DEN): +2.76. PHILADELPHIA (vs ARZ): +2.27. CHICAGO (vs STL): +1.3
1. WASHINGTON (vs CIN): +2.52. TAMPA BAY (vs DAL): +2.03. ATLANTA (vs SD): +2.04. PHILADELPHIA (vs ARZ): +1.55. CHICAGO (vs STL): +1.56. HOUSTON (vs DEN): +1.57. NY JETS (vs MIA): +1.5
1. DETROIT (vs TEN): +22.52. PITTSBURGH (vs OAK): +17.53. WASHINGTON (vs CIN): +14.54. NEW ORLEANS (vs KC): +9.05. HOUSTON (vs DEN): +8.06. SAN FRANCISCO (vs MIN): +8.07. TAMPA BAY (vs DAL): +6.0
1. SEATTLE (vs GB): +167.02. MIAMI (vs NYJ): +144.53. SAN DIEGO (vs ATL): +116.54. KANSAS CITY (vs NO): +97.05. DETROIT (vs TEN): +95.56. WASHINGTON (vs CIN): +94.57. SAN FRANCISCO (vs MIN): +93.0
1. MIAMI (vs NYJ): +4.62. SEATTLE (vs GB): +3.03. SAN FRANCISCO (vs MIN): +1.64. PITTSBURGH (vs OAK): +1.55. DETROIT (vs TEN): +1.56. DENVER (vs HOU): +1.47. SAN DIEGO (vs ATL): +1.2
1. DALLAS (vs TB): +331.02. PHILADELPHIA (vs ARZ): +212.03. GREEN BAY (vs SEA): +207.04. DETROIT (vs TEN): +122.05. NY JETS (vs MIA): +88.56. MINNESOTA (vs SF): +81.57. NEW ENGLAND (vs BAL): +74.5
1. CAROLINA (vs NYG): +4.62. DALLAS (vs TB): +4.33. WASHINGTON (vs CIN): +3.84. PHILADELPHIA (vs ARZ): +3.25. KANSAS CITY (vs NO): +3.16. GREEN BAY (vs SEA): +2.47. DETROIT (vs TEN): +2.2
1. PHILADELPHIA (vs ARZ): +275.02. DALLAS (vs TB): +242.53. DETROIT (vs TEN): +217.54. NEW ENGLAND (vs BAL): +150.55. HOUSTON (vs DEN): +128.06. INDIANAPOLIS (vs JAC): +103.57. WASHINGTON (vs CIN): +99.5
1. DALLAS (vs TB): +4.42. DETROIT (vs TEN): +4.13. PHILADELPHIA (vs ARZ): +3.84. NEW ENGLAND (vs BAL): +2.25. INDIANAPOLIS (vs JAC): +2.06. WASHINGTON (vs CIN): +1.67. SAN DIEGO (vs ATL): +1.5
1. WASHINGTON (vs CIN): +3.52. TAMPA BAY (vs DAL): +2.53. HOUSTON (vs DEN): +2.54. NY JETS (vs MIA): +2.55. ATLANTA (vs SD): +2.56. PITTSBURGH (vs OAK): +1.57. ARIZONA (vs PHI): +1.0

www.StatFox.com 11
T h e P l aT i n u m S h e e T
Week 4 College Football MatChups: sept. 19 - 22
• (301) KENT STATE at (302) BUFFALO -3 KENT STATE BUFFALO BUFFALO BUFFALO KENT STATE BUFFALO
• (305) BYU at (306) BOISE STATE -8 BYU BOISE STATE BOISE STATE BOISE STATE BYU BOISE STATE
• (307) BAYLOR at (308) UL - MONROE +7 BEST BET * BAYLOR UL - MONROE UL - MONROE BAYLOR
• (311) CLEMSON at (312) FLORIDA STATE -14 CLEMSON FLORIDA STATE FLORIDA STATE CLEMSON FLORIDA STATE FLORIDA STATE
• (327) TEMPLE at (328) PENN STATE -9 BEST BET * PENN STATE BEST BET * TEMPLE TEMPLE
• (329) MARYLAND at (330) WEST VIRGINIA -28 MARYLAND BEST BET * WEST VIRGINIA MARYLAND MARYLAND MARYLAND
• (335) VANDERBILT at (336) GEORGIA -14 GEORGIA VANDERBILT GEORGIA BEST BET * VANDERBILT
• (347) ARIZONA at (348) OREGON -24 OREGON BEST BET * ARIZONA ARIZONA ARIZONA ARIZONA
• (349) OREGON STATE at (350) UCLA -11 BEST BET * UCLA BEST BET * UCLA UCLA UCLA
• (351) VIRGINIA at (352) TCU -17 BEST BET * BEST BET * BEST BET * BEST BET * TCU
• (353) CALIFORNIA at (354) SOUTHERN CAL -16 USC BEST BET * CALIFORNIA USC CALIFORNIA
• (357) LSU at (358) AUBURN +18½ AUBURN AUBURN AUBURN BEST BET * LSU AUBURN
• (359) MIAMI FLORIDA at (360) GEORGIA TECH -13½ GEORGIA TECH GEORGIA TECH MIAMI FLORIDA MIAMI FLORIDA MIAMI FLORIDA MIAMI FLORIDA
• (367) MISSOURI at (368) SOUTH CAROLINA -10 SOUTH CAROLINA SOUTH CAROLINA BEST BET * SOUTH CAROLINA SOUTH CAROLINA SOUTH CAROLINA
• (369) MICHIGAN at (370) NOTRE DAME -6½ NOTRE DAME MICHIGAN MICHIGAN NOTRE DAME NOTRE DAME NOTRE DAME
• (373) KANSAS STATE at (374) OKLAHOMA -13½ KANSAS STATE BEST BET * OKLAHOMA OKLAHOMA OKLAHOMA OKLAHOMA
P r e S e n T S T h e w e e k ’ S STa f f P i c k S
stat
Fox
da
ve
stat
Fox
ga
RY
stat
Fox
sCo
tt
stat
Fox
bR
IaN
stat
Fox
FoR
eCa
steR
stat
Fox
Co
Nse
Nsu
s
S t a t Fox D ave
StatFox Dave is one of the original four founders of StatFox and over the years has been renowned for his handicapping prowess in all sports. Anyone who signed up for our NBA postseason Best Bets certainly knows that to be true, as Dave racked up an astounding 66% success rate on Best Bets during the NBA postseason. Dave is known to step out and pick games that are not on the national radar, and he not only thought Ball State would cover at Indiana last Saturday, but predicted the Cardinals would win outright. Sure enough, Ball State racked up 440 yards of offense in its road win.
S t a t Fox G a r y
StatFox Gary joined the StatFox and Platinum Sheet staff prior to the 2010 football season, and subscribers were certainlyhappy he did: He proceed-ed to post a 55% success rate on NFL Best Bets in his “rookie” season. Gary also has a knack for pick-ing college games, usu-ally focusing on the most prominent matchups each week. He went 2-for-2 in his Best Bets involving ACC teams last week, correctly picking Louisville to cover a small spread against UNC, and Georgia Tech to win handily over Virginia because of a su-perior running game: Tech outrushed UVa 461-98.
S t a t Fox S co t t
StatFox Scott serves as Managing Editor for StatFox and Platinum Sheet and the Edge Football Preview Guide, and is coming off a two-year college football run in which his Best Bets success rate was 56%. Scott’s big play last week was East Carolina at Southerm Missis-sippi, starting that the two teams were “much more evenly matched than the 7.5-point spread would indicate; I certainly wouldn’t be shocked if East Carolina won out-right.” Sure enough, East Carolina scored 24 unan-swered points en route to a double-digit victory.
S t a t Fox B r i a n
A featured writer on StatFox.com and for Platinum Sheet, StatFox Brian has yet to suffer a losing season of Platinum Sheet Best Bets in either college football, NFL, college basketball or NBA since coming on board in 2010. He’s been on fire so far in 2012, going a perfect 3-for-3 in college football ATS Best Bets two weeks ago, and then continuing his hot streak with his third straight winning ATS Best Bets week (2-1). His best pick was Penn State giv-ing a touchdown to Navy and winning, 34-7, which put Brian at 7-2 ATS for the season.
S t a t Fox Fo re c a ste r
By weighing several key factors, including recent statistical averages, schedule strength and home-field advantage, the StatFox Forecaster has proven to be an extremely successful long-term handicapping tool. It’s most accurate once a season is underway, as evident by an ATS success rate of 61% (123-79-6) on all 2011 NFL regular-season games played between September 25 and the end of the calendar year. With three straight winning weeks of college football in 2012, Forecaster has an ATS accuracy mark of better than 65% on the season.
* get best bet pICks oN these gaMes aNd MoRe FRoM ouR staFF pICkeRs at WWW.FoXsheets.CoM
College Football staFF pICks staNdINgs *
All Games W L T Pct Last Week
StatFox Forecaster 30 16 1 65.2% 9-6-1
StatFox Consensus 28 18 1 60.9% 9-6-1
StatFox Dave 26 20 1 56.5% 9-6-1
StatFox Scott 23 23 1 50.0% 6-9-1
StatFox Brian 22 24 1 47.8% 10-5-1
StatFox Gary 21 25 1 45.7% 9-6-1
CFB Best Bets (ATS) W L T Pct Last Week
StatFox Brian 7 2 0 77.8% 2-1
StatFox Dave 8 6 0 57.1% 2-2
StatFox Gary 5 4 0 55.6% 2-1
StatFox Scott 4 8 0 33.3% 1-4
TOTAL 24 20 0 54.5% 7-8
* [Standings reflect games played through Saturday, September 15.]
12 www.StatFox.com
T h e P l aT i n u m S h e e T
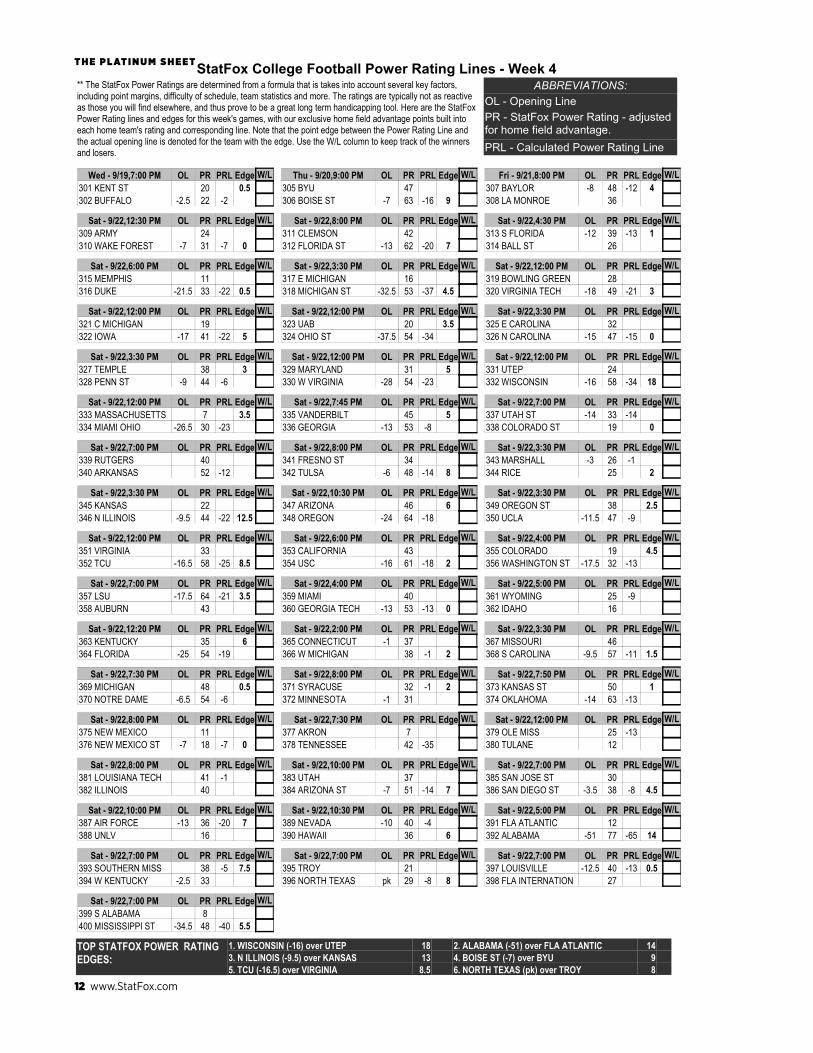
** The StatFox Power Ratings are determined from a formula that is takes into account several key factors, including point margins, difficulty of schedule, team statistics and more. The ratings are typically not as reactive as those you will find elsewhere, and thus prove to be a great long term handicapping tool. Here are the StatFox Power Rating lines and edges for this week's games, with our exclusive home field advantage points built into each home team's rating and corresponding line. Note that the point edge between the Power Rating Line and the actual opening line is denoted for the team with the edge. Use the W/L column to keep track of the winners and losers.
ABBREVIATIONS:OL - Opening LinePR - StatFox Power Rating - adjusted for home field advantage.PRL - Calculated Power Rating Line
StatFox College Football Power Rating Lines - Week 4
302 BUFFALO301 KENT ST
-2.5 2220
-20.5
Wed - 9/19,7:00 PM OL PR PRL Edge W/L
306 BOISE ST305 BYU
-7 6347
-16 9
Thu - 9/20,9:00 PM OL PR PRL Edge W/L
308 LA MONROE307 BAYLOR -8
3648 -12 4
Fri - 9/21,8:00 PM OL PR PRL Edge W/L
310 WAKE FOREST309 ARMY
-7 3124
-7 0
Sat - 9/22,12:30 PM OL PR PRL Edge W/L
312 FLORIDA ST311 CLEMSON
-13 6242
-20 7
Sat - 9/22,8:00 PM OL PR PRL Edge W/L
314 BALL ST313 S FLORIDA -12
2639 -13 1
Sat - 9/22,4:30 PM OL PR PRL Edge W/L
316 DUKE315 MEMPHIS
-21.5 3311
-22 0.5
Sat - 9/22,6:00 PM OL PR PRL Edge W/L
318 MICHIGAN ST317 E MICHIGAN
-32.5 5316
-37 4.5
Sat - 9/22,3:30 PM OL PR PRL Edge W/L
320 VIRGINIA TECH319 BOWLING GREEN
-18 4928
-21 3
Sat - 9/22,12:00 PM OL PR PRL Edge W/L
322 IOWA321 C MICHIGAN
-17 4119
-22 5
Sat - 9/22,12:00 PM OL PR PRL Edge W/L
324 OHIO ST323 UAB
-37.5 5420
-343.5
Sat - 9/22,12:00 PM OL PR PRL Edge W/L
326 N CAROLINA325 E CAROLINA
-15 4732
-15 0
Sat - 9/22,3:30 PM OL PR PRL Edge W/L
328 PENN ST327 TEMPLE
-9 4438
-63
Sat - 9/22,3:30 PM OL PR PRL Edge W/L
330 W VIRGINIA329 MARYLAND
-28 5431
-235
Sat - 9/22,12:00 PM OL PR PRL Edge W/L
332 WISCONSIN331 UTEP
-16 5824
-34 18
Sat - 9/22,12:00 PM OL PR PRL Edge W/L
334 MIAMI OHIO333 MASSACHUSETTS
-26.5 307
-233.5
Sat - 9/22,12:00 PM OL PR PRL Edge W/L
336 GEORGIA335 VANDERBILT
-13 5345
-85
Sat - 9/22,7:45 PM OL PR PRL Edge W/L
338 COLORADO ST337 UTAH ST -14
1933 -14
0
Sat - 9/22,7:00 PM OL PR PRL Edge W/L
340 ARKANSAS339 RUTGERS
5240
-12
Sat - 9/22,7:00 PM OL PR PRL Edge W/L
342 TULSA341 FRESNO ST
-6 4834
-14 8
Sat - 9/22,8:00 PM OL PR PRL Edge W/L
344 RICE343 MARSHALL -3
2526 -1
2
Sat - 9/22,3:30 PM OL PR PRL Edge W/L
346 N ILLINOIS345 KANSAS
-9.5 4422
-22 12.5
Sat - 9/22,3:30 PM OL PR PRL Edge W/L
348 OREGON347 ARIZONA
-24 6446
-186
Sat - 9/22,10:30 PM OL PR PRL Edge W/L
350 UCLA349 OREGON ST
-11.5 4738
-92.5
Sat - 9/22,3:30 PM OL PR PRL Edge W/L
352 TCU351 VIRGINIA
-16.5 5833
-25 8.5
Sat - 9/22,12:00 PM OL PR PRL Edge W/L
354 USC353 CALIFORNIA
-16 6143
-18 2
Sat - 9/22,6:00 PM OL PR PRL Edge W/L
356 WASHINGTON ST355 COLORADO
-17.5 3219
-134.5
Sat - 9/22,4:00 PM OL PR PRL Edge W/L
358 AUBURN357 LSU -17.5
4364 -21 3.5
Sat - 9/22,7:00 PM OL PR PRL Edge W/L
360 GEORGIA TECH359 MIAMI
-13 5340
-13 0
Sat - 9/22,4:00 PM OL PR PRL Edge W/L
362 IDAHO361 WYOMING
1625 -9
Sat - 9/22,5:00 PM OL PR PRL Edge W/L
364 FLORIDA363 KENTUCKY
-25 5435
-196
Sat - 9/22,12:20 PM OL PR PRL Edge W/L
366 W MICHIGAN365 CONNECTICUT -1
3837
-1 2
Sat - 9/22,2:00 PM OL PR PRL Edge W/L
368 S CAROLINA367 MISSOURI
-9.5 5746
-11 1.5
Sat - 9/22,3:30 PM OL PR PRL Edge W/L
370 NOTRE DAME369 MICHIGAN
-6.5 5448
-60.5
Sat - 9/22,7:30 PM OL PR PRL Edge W/L
372 MINNESOTA371 SYRACUSE
-1 3132 -1 2
Sat - 9/22,8:00 PM OL PR PRL Edge W/L
374 OKLAHOMA373 KANSAS ST
-14 6350
-131
Sat - 9/22,7:50 PM OL PR PRL Edge W/L
376 NEW MEXICO ST375 NEW MEXICO
-7 1811
-7 0
Sat - 9/22,8:00 PM OL PR PRL Edge W/L
378 TENNESSEE377 AKRON
427
-35
Sat - 9/22,7:30 PM OL PR PRL Edge W/L
380 TULANE379 OLE MISS
1225 -13
Sat - 9/22,12:00 PM OL PR PRL Edge W/L
382 ILLINOIS381 LOUISIANA TECH
4041 -1
Sat - 9/22,8:00 PM OL PR PRL Edge W/L
384 ARIZONA ST383 UTAH
-7 5137
-14 7
Sat - 9/22,10:00 PM OL PR PRL Edge W/L
386 SAN DIEGO ST385 SAN JOSE ST
-3.5 3830
-8 4.5
Sat - 9/22,7:00 PM OL PR PRL Edge W/L
388 UNLV387 AIR FORCE -13
1636 -20 7
Sat - 9/22,10:00 PM OL PR PRL Edge W/L
390 HAWAII389 NEVADA -10
3640 -4
6
Sat - 9/22,10:30 PM OL PR PRL Edge W/L
392 ALABAMA391 FLA ATLANTIC
-51 7712
-65 14
Sat - 9/22,5:00 PM OL PR PRL Edge W/L
394 W KENTUCKY393 SOUTHERN MISS
-2.5 3338 -5 7.5
Sat - 9/22,7:00 PM OL PR PRL Edge W/L
396 NORTH TEXAS395 TROY
pk 2921
-8 8
Sat - 9/22,7:00 PM OL PR PRL Edge W/L
398 FLA INTERNATION397 LOUISVILLE -12.5
2740 -13 0.5
Sat - 9/22,7:00 PM OL PR PRL Edge W/L
400 MISSISSIPPI ST399 S ALABAMA
-34.5 488
-40 5.5
Sat - 9/22,7:00 PM OL PR PRL Edge W/L
TOP STATFOX POWER RATING EDGES:
1. WISCONSIN (-16) over UTEP 18 2. ALABAMA (-51) over FLA ATLANTIC 143. N ILLINOIS (-9.5) over KANSAS 13 4. BOISE ST (-7) over BYU 95. TCU (-16.5) over VIRGINIA 8.5 6. NORTH TEXAS (pk) over TROY 8

www.StatFox.com 13
T h e P l aT i n u m S h e e T
Here is a listing of the top team statistical edges when compared head-to-head with their opponents. Keep track of the ATS wins and losses of the top teams for each of the various statistics to determine if any particular category stands out in terms of success.
Top College Football Statistical Edges - Week 4
W/LPoints Scored (PPG)
W/LRushing Yards Gained (RYPG)
W/LYards Per Rush Gained (YPR)
W/LPassing Yards Gained (PYPG)
W/LYards Per Pass Attempted (PYA)
W/LTotal Yards Gained (TYPG)
W/LYards Per Play Attempted (YPP)
W/LTurnovers Committed Per Game (TOPG)
W/LPoints Allowed (PPG)
W/LRushing Yards Allowed (RYPG)
W/LYards Per Rush Allowed (YPR)
W/LPassing Yards Allowed (PYPG)
W/LYards Per Pass Allowed (PYA)
W/LTotal Yards Allowed (TYPG)
W/LYards Per Play Allowed (YPP)
W/LTurnovers Forced Per Game (TOPG)
W/LScoring Differential (PPG)
W/LRushing Yds Differential (RYPG)
W/LYards Per Rush Differential (YPR)
W/LPassing Yds Differential (PYPG)
W/LYards Per Pass Differential (PYA)
W/LTotal Yds Differential (TYPG)
W/LYards Per Play Differential (YPP)
W/LTurnover Differential (TODiff)
OFFENSIVE STATISTICS DEFENSIVE STATISTICS OFF/DEF DIFFERENTIALS
1. W VIRGINIA (vs MD): +34.22. UCLA (vs ORS): +30.73. LOUISIANA TECH (vs ILL): +28.74. LSU (vs AUB): +28.35. ALABAMA (vs FAU): +28.06. OLE MISS (vs TUL): +25.07. OHIO ST (vs UAB): +23.2
1. ARMY (vs WF): +315.72. OLE MISS (vs TUL): +238.23. AIR FORCE (vs NLV): +234.74. UCLA (vs ORS): +233.35. GEORGIA TECH (vs MIA): +219.76. NEVADA (vs HAW): +167.87. OHIO ST (vs UAB): +157.2
1. OLE MISS (vs TUL): +5.52. W VIRGINIA (vs MD): +4.73. UCLA (vs ORS): +3.74. OHIO ST (vs UAB): +3.35. ARMY (vs WF): +3.36. BUFFALO (vs KS): +2.87. LOUISIANA TECH (vs ILL): +2.6
1. W VIRGINIA (vs MD): +238.02. MARSHALL (vs RIC): +216.73. NEW MEXICO ST (vs NM): +214.74. TROY (vs NTX): +190.75. WAKE FOREST (vs ARM): +184.36. SYRACUSE (vs MIN): +156.37. KENTUCKY (vs FLA): +145.7
1. TCU (vs VIR): +5.72. GEORGIA TECH (vs MIA): +5.33. NEW MEXICO ST (vs NM): +4.44. BAYLOR (vs LAM): +3.65. S CAROLINA (vs MIZ): +3.66. OLE MISS (vs TUL): +3.67. ALABAMA (vs FAU): +3.6
1. W VIRGINIA (vs MD): +353.72. OLE MISS (vs TUL): +281.23. UCLA (vs ORS): +268.04. LOUISIANA TECH (vs ILL): +250.55. NEVADA (vs HAW): +234.86. TROY (vs NTX): +181.37. GEORGIA TECH (vs MIA): +163.7
1. W VIRGINIA (vs MD): +4.22. OLE MISS (vs TUL): +3.53. BAYLOR (vs LAM): +2.94. TCU (vs VIR): +2.75. UCLA (vs ORS): +2.66. BUFFALO (vs KS): +2.57. GEORGIA TECH (vs MIA): +2.3
1. W VIRGINIA (vs MD): +2.82. MISSISSIPPI ST (vs SAL): +2.73. OREGON ST (vs UCL): +2.74. ALABAMA (vs FAU): +2.35. RUTGERS (vs ARK): +2.36. IOWA (vs CM): +2.37. LSU (vs AUB): +2.0
1. RUTGERS (vs ARK): +28.32. MICHIGAN ST (vs EMU): +27.33. TCU (vs VIR): +27.34. OHIO ST (vs UAB): +26.05. ILLINOIS (vs LAT): +25.76. ALABAMA (vs FAU): +25.37. LOUISVILLE (vs FIU): +20.7
1. MICHIGAN ST (vs EMU): +235.32. ALABAMA (vs FAU): +193.73. LSU (vs AUB): +170.04. OREGON ST (vs UCL): +156.05. FLORIDA ST (vs CLM): +147.06. TCU (vs VIR): +142.87. WISCONSIN (vs UTP): +134.3
1. OREGON ST (vs UCL): +4.02. ALABAMA (vs FAU): +3.93. FLORIDA ST (vs CLM): +3.64. LSU (vs AUB): +3.45. MICHIGAN ST (vs EMU): +3.46. TCU (vs VIR): +3.37. HAWAII (vs NEV): +3.0
1. ILLINOIS (vs LAT): +188.52. OKLAHOMA (vs KSU): +140.03. MARYLAND (vs WV): +138.24. VIRGINIA TECH (vs BG): +126.05. N ILLINOIS (vs KAN): +119.36. FLORIDA ST (vs CLM): +118.37. UTAH ST (vs CSU): +111.3
1. ALABAMA (vs FAU): +6.42. WAKE FOREST (vs ARM): +4.53. OHIO ST (vs UAB): +4.14. GEORGIA TECH (vs MIA): +3.85. FLORIDA ST (vs CLM): +3.86. OKLAHOMA (vs KSU): +2.97. WASHINGTON ST (vs COL): +2.6
1. ILLINOIS (vs LAT): +287.02. FLORIDA ST (vs CLM): +265.33. MICHIGAN ST (vs EMU): +264.04. ALABAMA (vs FAU): +259.35. LSU (vs AUB): +237.06. HAWAII (vs NEV): +206.37. MARYLAND (vs WV): +195.2
1. MICHIGAN ST (vs EMU): +4.92. LSU (vs AUB): +4.13. ALABAMA (vs FAU): +3.74. FLORIDA ST (vs CLM): +3.05. UTAH ST (vs CSU): +3.06. RUTGERS (vs ARK): +2.97. GEORGIA TECH (vs MIA): +2.8
1. KENT ST (vs BUF): +3.02. KANSAS (vs NIL): +3.03. MISSISSIPPI ST (vs SAL): +2.74. W KENTUCKY (vs SM): +2.05. ALABAMA (vs FAU): +1.76. LSU (vs AUB): +1.77. NOTRE DAME (vs MIC): +1.7
1. ALABAMA (vs FAU): +53.32. OHIO ST (vs UAB): +49.23. LSU (vs AUB): +45.34. TCU (vs VIR): +38.75. FLORIDA ST (vs CLM): +35.76. GEORGIA TECH (vs MIA): +30.37. MISSISSIPPI ST (vs SAL): +30.3
1. OLE MISS (vs TUL): +333.32. ARMY (vs WF): +326.23. GEORGIA TECH (vs MIA): +314.04. OHIO ST (vs UAB): +269.05. LSU (vs AUB): +264.06. ALABAMA (vs FAU): +248.77. TCU (vs VIR): +241.7
1. OLE MISS (vs TUL): +7.12. FLORIDA ST (vs CLM): +6.03. TCU (vs VIR): +5.34. OHIO ST (vs UAB): +5.35. ALABAMA (vs FAU): +4.96. LSU (vs AUB): +4.87. W VIRGINIA (vs MD): +3.8
1. MARSHALL (vs RIC): +219.32. NEW MEXICO ST (vs NM): +213.03. WAKE FOREST (vs ARM): +206.24. OKLAHOMA (vs KSU): +204.55. S FLORIDA (vs BLS): +197.06. KENTUCKY (vs FLA): +162.07. SYRACUSE (vs MIN): +154.3
1. ALABAMA (vs FAU): +9.92. GEORGIA TECH (vs MIA): +9.13. WAKE FOREST (vs ARM): +7.04. TCU (vs VIR): +5.45. W KENTUCKY (vs SM): +5.46. FLORIDA ST (vs CLM): +5.37. WYOMING (vs IDA): +4.8
1. LSU (vs AUB): +373.32. MICHIGAN ST (vs EMU): +352.73. GEORGIA TECH (vs MIA): +340.04. ALABAMA (vs FAU): +324.75. OLE MISS (vs TUL): +316.56. TCU (vs VIR): +301.77. FLORIDA ST (vs CLM): +291.7
1. LSU (vs AUB): +5.62. ALABAMA (vs FAU): +5.33. MICHIGAN ST (vs EMU): +5.14. OLE MISS (vs TUL): +5.15. GEORGIA TECH (vs MIA): +5.06. FLORIDA ST (vs CLM): +4.97. TCU (vs VIR): +4.8
1. MISSISSIPPI ST (vs SAL): +5.32. ALABAMA (vs FAU): +4.03. IOWA (vs CM): +3.84. RUTGERS (vs ARK): +3.75. LSU (vs AUB): +3.76. KENT ST (vs BUF): +3.07. KANSAS (vs NIL): +2.7

14 www.StatFox.com
T h e P l aT i n u m S h e e T
** The Outplay Factor Ratings made famous by StatFox are a great Team Strength Indicator as they provide a quantitative measure of how teams are outplaying (+ value) or being outplayed by (- value) their opponents. They are determined by a complicated formula that takes into account a team's points for/against as compared to how their previous opponents have fared. Here are the StatFox Team Outplay Factor Ratings and the corresponding game lines derived from them. Note that the point edge between the Outplay Factor Rating Line and the actual opening line is denoted for the team with the edge. Use the W/L column to keep track of the winners and losers.
ABBREVIATIONS:OL - Opening LineOF - StatFox Outplay Factor Rating - adjusted for home field advantage.OFL - Calculated Outplay Factor Line
Statfox College Football Outplay Factor Rating Lines - Week 4
302 BUFFALO301 KENT ST
-2.5 1910
-9 6.5
Wed - 9/19,7:00 PM OL OF OFL Edge W/L
306 BOISE ST305 BYU
-7 3738 -1 8.0
Thu - 9/20,9:00 PM OL OF OFL Edge W/L
308 LA MONROE307 BAYLOR -8
2037 -17 9.0
Fri - 9/21,8:00 PM OL OF OFL Edge W/L
310 WAKE FOREST309 ARMY
-7 3716
-21 14.0
Sat - 9/22,12:30 PM OL OF OFL Edge W/L
312 FLORIDA ST311 CLEMSON
-13 3632
-49.0
Sat - 9/22,8:00 PM OL OF OFL Edge W/L
314 BALL ST313 S FLORIDA -12
2730 -3
9.0
Sat - 9/22,4:30 PM OL OF OFL Edge W/L
316 DUKE315 MEMPHIS
-21.5 239
-147.5
Sat - 9/22,6:00 PM OL OF OFL Edge W/L
318 MICHIGAN ST317 E MICHIGAN
-32.5 4318
-257.5
Sat - 9/22,3:30 PM OL OF OFL Edge W/L
320 VIRGINIA TECH319 BOWLING GREEN
-18 3219
-135.0
Sat - 9/22,12:00 PM OL OF OFL Edge W/L
322 IOWA321 C MICHIGAN
-17 3911
-28 11.0
Sat - 9/22,12:00 PM OL OF OFL Edge W/L
324 OHIO ST323 UAB
-37.5 5314
-39 1.5
Sat - 9/22,12:00 PM OL OF OFL Edge W/L
326 N CAROLINA325 E CAROLINA
-15 2819
-96.0
Sat - 9/22,3:30 PM OL OF OFL Edge W/L
328 PENN ST327 TEMPLE
-9 2623
-36.0
Sat - 9/22,3:30 PM OL OF OFL Edge W/L
330 W VIRGINIA329 MARYLAND
-28 4736
-1117.0
Sat - 9/22,12:00 PM OL OF OFL Edge W/L
332 WISCONSIN331 UTEP
-16 3428
-610.0
Sat - 9/22,12:00 PM OL OF OFL Edge W/L
334 MIAMI OHIO333 MASSACHUSETTS
-26.5 14-5
-197.5
Sat - 9/22,12:00 PM OL OF OFL Edge W/L
336 GEORGIA335 VANDERBILT
-13 5234
-18 5.0
Sat - 9/22,7:45 PM OL OF OFL Edge W/L
338 COLORADO ST337 UTAH ST -14
2032 -12
2.0
Sat - 9/22,7:00 PM OL OF OFL Edge W/L
340 ARKANSAS339 RUTGERS
2625
-1
Sat - 9/22,7:00 PM OL OF OFL Edge W/L
342 TULSA341 FRESNO ST
-6 4240
-24.0
Sat - 9/22,8:00 PM OL OF OFL Edge W/L
344 RICE343 MARSHALL -3
2626
0 3.0
Sat - 9/22,3:30 PM OL OF OFL Edge W/L
346 N ILLINOIS345 KANSAS
-9.5 3126
-54.5
Sat - 9/22,3:30 PM OL OF OFL Edge W/L
348 OREGON347 ARIZONA
-24 4748 -1 25.0
Sat - 9/22,10:30 PM OL OF OFL Edge W/L
350 UCLA349 OREGON ST
-11.5 4527
-18 6.5
Sat - 9/22,3:30 PM OL OF OFL Edge W/L
352 TCU351 VIRGINIA
-16.5 3928
-115.5
Sat - 9/22,12:00 PM OL OF OFL Edge W/L
354 USC353 CALIFORNIA
-16 5229
-23 7.0
Sat - 9/22,6:00 PM OL OF OFL Edge W/L
356 WASHINGTON ST355 COLORADO
-17.5 302
-28 10.5
Sat - 9/22,4:00 PM OL OF OFL Edge W/L
358 AUBURN357 LSU -17.5
3853 -15
2.5
Sat - 9/22,7:00 PM OL OF OFL Edge W/L
360 GEORGIA TECH359 MIAMI
-13 4227
-15 2.0
Sat - 9/22,4:00 PM OL OF OFL Edge W/L
362 IDAHO361 WYOMING
1428 -14
Sat - 9/22,5:00 PM OL OF OFL Edge W/L
364 FLORIDA363 KENTUCKY
-25 5036
-1411.0
Sat - 9/22,12:20 PM OL OF OFL Edge W/L
366 W MICHIGAN365 CONNECTICUT -1
3125
-6 7.0
Sat - 9/22,2:00 PM OL OF OFL Edge W/L
368 S CAROLINA367 MISSOURI
-9.5 5536
-19 9.5
Sat - 9/22,3:30 PM OL OF OFL Edge W/L
370 NOTRE DAME369 MICHIGAN
-6.5 4738
-9 2.5
Sat - 9/22,7:30 PM OL OF OFL Edge W/L
372 MINNESOTA371 SYRACUSE
-1 2929
01.0
Sat - 9/22,8:00 PM OL OF OFL Edge W/L
374 OKLAHOMA373 KANSAS ST
-14 3645 -9 23.0
Sat - 9/22,7:50 PM OL OF OFL Edge W/L
376 NEW MEXICO ST375 NEW MEXICO
-7 2022 -2 9.0
Sat - 9/22,8:00 PM OL OF OFL Edge W/L
378 TENNESSEE377 AKRON
3516
-19
Sat - 9/22,7:30 PM OL OF OFL Edge W/L
380 TULANE379 OLE MISS
2227 -5
Sat - 9/22,12:00 PM OL OF OFL Edge W/L
382 ILLINOIS381 LOUISIANA TECH
3321
-12
Sat - 9/22,8:00 PM OL OF OFL Edge W/L
384 ARIZONA ST383 UTAH
-7 5631
-25 18.0
Sat - 9/22,10:00 PM OL OF OFL Edge W/L
386 SAN DIEGO ST385 SAN JOSE ST
-3.5 3232
03.5
Sat - 9/22,7:00 PM OL OF OFL Edge W/L
388 UNLV387 AIR FORCE -13
1823 -5
8.0
Sat - 9/22,10:00 PM OL OF OFL Edge W/L
390 HAWAII389 NEVADA -10
1925 -6
4.0
Sat - 9/22,10:30 PM OL OF OFL Edge W/L
392 ALABAMA391 FLA ATLANTIC
-51 7023
-474.0
Sat - 9/22,5:00 PM OL OF OFL Edge W/L
394 W KENTUCKY393 SOUTHERN MISS
-2.5 3114
-17 14.5
Sat - 9/22,7:00 PM OL OF OFL Edge W/L
396 NORTH TEXAS395 TROY
pk 3522
-13 13.0
Sat - 9/22,7:00 PM OL OF OFL Edge W/L
398 FLA INTERNATION397 LOUISVILLE -12.5
2639 -13 0.5
Sat - 9/22,7:00 PM OL OF OFL Edge W/L
400 MISSISSIPPI ST399 S ALABAMA
-34.5 3315
-1816.5
Sat - 9/22,7:00 PM OL OF OFL Edge W/L
TOP STATFOX OUTPLAY FACTOR RATING EDGES:
1. ARIZONA (+24) over OREGON 25 2. KANSAS ST (+14) over OKLAHOMA 233. ARIZONA ST (-7) over UTAH 18 4. MARYLAND (+28) over W VIRGINIA 175. S ALABAMA (+34.5) over MISSISSIPPI ST 17 6. W KENTUCKY (-2.5) over SOUTHERN MISS 15

FIND THE RIGHT SHOPS...FROM THE RIGHT SOURCE!
www.osga.com
Co l l eg e F o ot b a l l W e e k 4 : S e P t e M b e R 2 0 - 2 2
16 www.StatFox.com
t h e P l at i n u M S h e e t
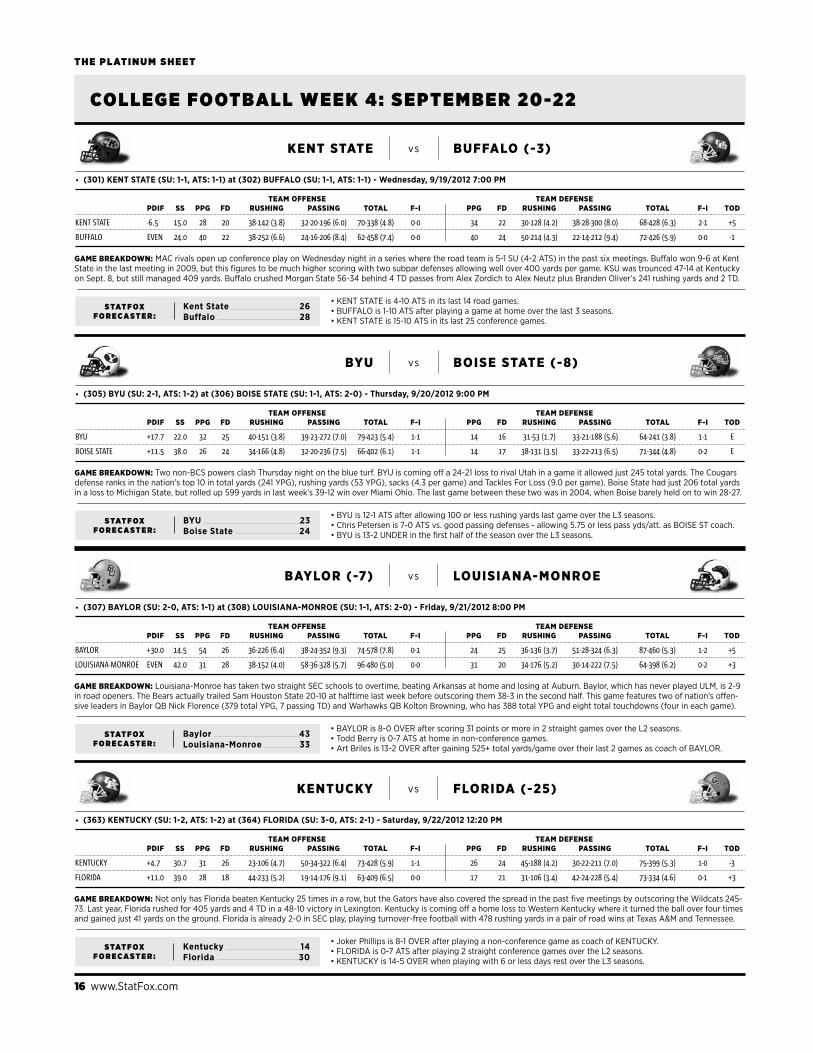
• KENT STATE is 4-10 ATS in its last 14 road games.• BUFFALO is 1-10 ATS after playing a game at home over the last 3 seasons.• KENT STATE is 15-10 ATS in its last 25 conference games.
Game Breakdown: MAC rivals open up conference play on Wednesday night in a series where the road team is 5-1 SU (4-2 ATS) in the past six meetings. Buffalo won 9-6 at Kent State in the last meeting in 2009, but this figures to be much higher scoring with two subpar defenses allowing well over 400 yards per game. KSU was trounced 47-14 at Kentucky on Sept. 8, but still managed 409 yards. Buffalo crushed Morgan State 56-34 behind 4 TD passes from Alex Zordich to Alex Neutz plus Branden Oliver’s 241 rushing yards and 2 TD.
• (301) KENT STATE (SU: 1-1, ATS: 1-1) at (302) BUFFALO (SU: 1-1, ATS: 1-1) - Wednesday, 9/19/2012 7:00 PM
Team offense Team defense Pdif ss PPG fd rushinG PassinG ToTal f-i PPG fd rushinG PassinG ToTal f-i Tod
KENT STATE -6.5 15.0 28 20 38-142 (3.8) 32-20-196 (6.0) 70-338 (4.8) 0-0 34 22 30-128 (4.2) 38-28-300 (8.0) 68-428 (6.3) 2-1 +5
BUFFALO EVEN 24.0 40 22 38-252 (6.6) 24-16-206 (8.4) 62-458 (7.4) 0-0 40 24 50-214 (4.3) 22-14-212 (9.4) 72-426 (5.9) 0-0 -1
kenT sTaTe Buffalo (-3)vs
S tat F o x F o R e C a S t e R :
Kent State 26Buffalo 28
• Joker Phillips is 8-1 OVER after playing a non-conference game as coach of KENTUCKY.• FLORIDA is 0-7 ATS after playing 2 straight conference games over the L2 seasons.• KENTUCKY is 14-5 OVER when playing with 6 or less days rest over the L3 seasons.
Game Breakdown: Not only has Florida beaten Kentucky 25 times in a row, but the Gators have also covered the spread in the past five meetings by outscoring the Wildcats 245-73. Last year, Florida rushed for 405 yards and 4 TD in a 48-10 victory in Lexington. Kentucky is coming off a home loss to Western Kentucky where it turned the ball over four times and gained just 41 yards on the ground. Florida is already 2-0 in SEC play, playing turnover-free football with 478 rushing yards in a pair of road wins at Texas A&M and Tennessee.
• (363) KENTUCKY (SU: 1-2, ATS: 1-2) at (364) FLORIDA (SU: 3-0, ATS: 2-1) - Saturday, 9/22/2012 12:20 PM
Team offense Team defense Pdif ss PPG fd rushinG PassinG ToTal f-i PPG fd rushinG PassinG ToTal f-i Tod
KENTUCKY +4.7 30.7 31 26 23-106 (4.7) 50-34-322 (6.4) 73-428 (5.9) 1-1 26 24 45-188 (4.2) 30-22-211 (7.0) 75-399 (5.3) 1-0 -3
FLORIDA +11.0 39.0 28 18 44-233 (5.2) 19-14-176 (9.1) 63-409 (6.5) 0-0 17 21 31-106 (3.4) 42-24-228 (5.4) 73-334 (4.6) 0-1 +3
kenTucky florida (-25)vs
S tat F o x F o R e C a S t e R :
Kentucky 14Florida 30
• BYU is 12-1 ATS after allowing 100 or less rushing yards last game over the L3 seasons.• Chris Petersen is 7-0 ATS vs. good passing defenses - allowing 5.75 or less pass yds/att. as BOISE ST coach.• BYU is 13-2 UNDER in the first half of the season over the L3 seasons.
Game Breakdown: Two non-BCS powers clash Thursday night on the blue turf. BYU is coming off a 24-21 loss to rival Utah in a game it allowed just 245 total yards. The Cougars defense ranks in the nation’s top 10 in total yards (241 YPG), rushing yards (53 YPG), sacks (4.3 per game) and Tackles For Loss (9.0 per game). Boise State had just 206 total yards in a loss to Michigan State, but rolled up 599 yards in last week’s 39-12 win over Miami Ohio. The last game between these two was in 2004, when Boise barely held on to win 28-27.
• (305) BYU (SU: 2-1, ATS: 1-2) at (306) BOISE STATE (SU: 1-1, ATS: 2-0) - Thursday, 9/20/2012 9:00 PM
Team offense Team defense Pdif ss PPG fd rushinG PassinG ToTal f-i PPG fd rushinG PassinG ToTal f-i Tod
BYU +17.7 22.0 32 25 40-151 (3.8) 39-23-272 (7.0) 79-423 (5.4) 1-1 14 16 31-53 (1.7) 33-21-188 (5.6) 64-241 (3.8) 1-1 E
BOISE STATE +11.5 38.0 26 24 34-166 (4.8) 32-20-236 (7.5) 66-402 (6.1) 1-1 14 17 38-131 (3.5) 33-22-213 (6.5) 71-344 (4.8) 0-2 E
Byu Boise sTaTe (-8)vs
S tat F o x F o R e C a S t e R :
BYU 23Boise State 24
• BAYLOR is 8-0 OVER after scoring 31 points or more in 2 straight games over the L2 seasons.• Todd Berry is 0-7 ATS at home in non-conference games.• Art Briles is 13-2 OVER after gaining 525+ total yards/game over their last 2 games as coach of BAYLOR.
Game Breakdown: Louisiana-Monroe has taken two straight SEC schools to overtime, beating Arkansas at home and losing at Auburn. Baylor, which has never played ULM, is 2-9 in road openers. The Bears actually trailed Sam Houston State 20-10 at halftime last week before outscoring them 38-3 in the second half. This game features two of nation’s offen-sive leaders in Baylor QB Nick Florence (379 total YPG, 7 passing TD) and Warhawks QB Kolton Browning, who has 388 total YPG and eight total touchdowns (four in each game).
• (307) BAYLOR (SU: 2-0, ATS: 1-1) at (308) LOUISIANA-MONROE (SU: 1-1, ATS: 2-0) - Friday, 9/21/2012 8:00 PM
Team offense Team defense Pdif ss PPG fd rushinG PassinG ToTal f-i PPG fd rushinG PassinG ToTal f-i Tod
BAYLOR +30.0 14.5 54 26 36-226 (6.4) 38-24-352 (9.3) 74-578 (7.8) 0-1 24 25 36-136 (3.7) 51-28-324 (6.3) 87-460 (5.3) 1-2 +5
LOUISIANA-MONROE EVEN 42.0 31 28 38-152 (4.0) 58-36-328 (5.7) 96-480 (5.0) 0-0 31 20 34-176 (5.2) 30-14-222 (7.5) 64-398 (6.2) 0-2 +3
Baylor (-7) louisiana-monroevs
S tat F o x F o R e C a S t e R :
Baylor 43Louisiana-Monroe 33
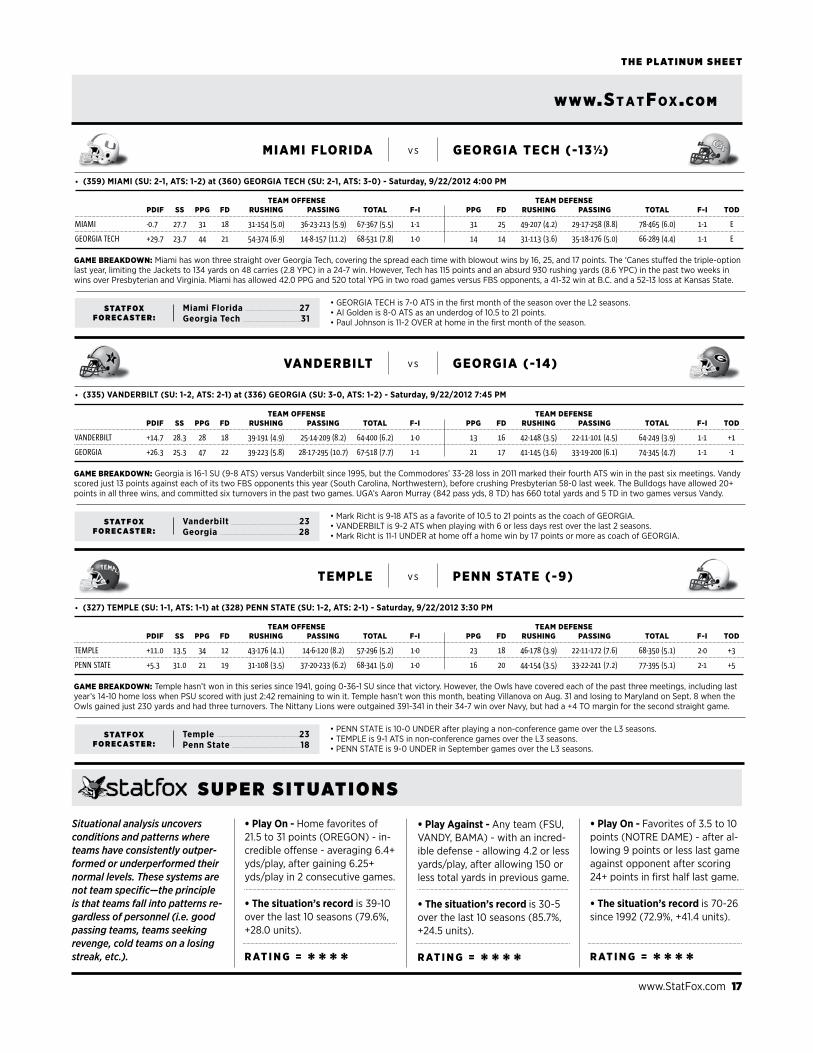
www.StatFox.com 17
S u P e R S i t u at i o n S
Situational analysis uncovers conditions and patterns where teams have consistently outper-formed or underperformed their normal levels. These systems are not team specific—the principle is that teams fall into patterns re-gardless of personnel (i.e. good passing teams, teams seeking revenge, cold teams on a losing streak, etc.).
• Play On - Home favorites of 21.5 to 31 points (OREGON) - in-credible offense - averaging 6.4+ yds/play, after gaining 6.25+ yds/play in 2 consecutive games. • The situation’s record is 39-10 over the last 10 seasons (79.6%, +28.0 units). r aT i n G = * * * *
• Play On - Favorites of 3.5 to 10 points (NOTRE DAME) - after al-lowing 9 points or less last game against opponent after scoring 24+ points in first half last game. • The situation’s record is 70-26 since 1992 (72.9%, +41.4 units). r aT i n G = * * * *
• Play Against - Any team (FSU, VANDY, BAMA) - with an incred-ible defense - allowing 4.2 or less yards/play, after allowing 150 or less total yards in previous game. • The situation’s record is 30-5 over the last 10 seasons (85.7%, +24.5 units). r aT i n G = * * * *
• GEORGIA TECH is 7-0 ATS in the first month of the season over the L2 seasons.• Al Golden is 8-0 ATS as an underdog of 10.5 to 21 points.• Paul Johnson is 11-2 OVER at home in the first month of the season.
Game Breakdown: Miami has won three straight over Georgia Tech, covering the spread each time with blowout wins by 16, 25, and 17 points. The ‘Canes stuffed the triple-option last year, limiting the Jackets to 134 yards on 48 carries (2.8 YPC) in a 24-7 win. However, Tech has 115 points and an absurd 930 rushing yards (8.6 YPC) in the past two weeks in wins over Presbyterian and Virginia. Miami has allowed 42.0 PPG and 520 total YPG in two road games versus FBS opponents, a 41-32 win at B.C. and a 52-13 loss at Kansas State.
• (359) MIAMI (SU: 2-1, ATS: 1-2) at (360) GEORGIA TECH (SU: 2-1, ATS: 3-0) - Saturday, 9/22/2012 4:00 PM
Team offense Team defense Pdif ss PPG fd rushinG PassinG ToTal f-i PPG fd rushinG PassinG ToTal f-i Tod
MIAMI -0.7 27.7 31 18 31-154 (5.0) 36-23-213 (5.9) 67-367 (5.5) 1-1 31 25 49-207 (4.2) 29-17-258 (8.8) 78-465 (6.0) 1-1 E
GEORGIA TECH +29.7 23.7 44 21 54-374 (6.9) 14-8-157 (11.2) 68-531 (7.8) 1-0 14 14 31-113 (3.6) 35-18-176 (5.0) 66-289 (4.4) 1-1 E
miami florida GeorGia Tech (-13½)vs
www.StatFox .com
t h e P l at i n u M S h e e t
S tat F o x F o R e C a S t e R :
Miami Florida 27Georgia Tech 31
• Mark Richt is 9-18 ATS as a favorite of 10.5 to 21 points as the coach of GEORGIA. • VANDERBILT is 9-2 ATS when playing with 6 or less days rest over the last 2 seasons.• Mark Richt is 11-1 UNDER at home off a home win by 17 points or more as coach of GEORGIA.
Game Breakdown: Georgia is 16-1 SU (9-8 ATS) versus Vanderbilt since 1995, but the Commodores’ 33-28 loss in 2011 marked their fourth ATS win in the past six meetings. Vandy scored just 13 points against each of its two FBS opponents this year (South Carolina, Northwestern), before crushing Presbyterian 58-0 last week. The Bulldogs have allowed 20+ points in all three wins, and committed six turnovers in the past two games. UGA’s Aaron Murray (842 pass yds, 8 TD) has 660 total yards and 5 TD in two games versus Vandy.
• (335) VANDERBILT (SU: 1-2, ATS: 2-1) at (336) GEORGIA (SU: 3-0, ATS: 1-2) - Saturday, 9/22/2012 7:45 PM
Team offense Team defense Pdif ss PPG fd rushinG PassinG ToTal f-i PPG fd rushinG PassinG ToTal f-i Tod
VANDERBILT +14.7 28.3 28 18 39-191 (4.9) 25-14-209 (8.2) 64-400 (6.2) 1-0 13 16 42-148 (3.5) 22-11-101 (4.5) 64-249 (3.9) 1-1 +1
GEORGIA +26.3 25.3 47 22 39-223 (5.8) 28-17-295 (10.7) 67-518 (7.7) 1-1 21 17 41-145 (3.6) 33-19-200 (6.1) 74-345 (4.7) 1-1 -1
VanderBilT GeorGia (-14)vs
S tat F o x F o R e C a S t e R :
Vanderbilt 23Georgia 28
• PENN STATE is 10-0 UNDER after playing a non-conference game over the L3 seasons.• TEMPLE is 9-1 ATS in non-conference games over the L3 seasons. • PENN STATE is 9-0 UNDER in September games over the L3 seasons.
Game Breakdown: Temple hasn’t won in this series since 1941, going 0-36-1 SU since that victory. However, the Owls have covered each of the past three meetings, including last year’s 14-10 home loss when PSU scored with just 2:42 remaining to win it. Temple hasn’t won this month, beating Villanova on Aug. 31 and losing to Maryland on Sept. 8 when the Owls gained just 230 yards and had three turnovers. The Nittany Lions were outgained 391-341 in their 34-7 win over Navy, but had a +4 TO margin for the second straight game.
• (327) TEMPLE (SU: 1-1, ATS: 1-1) at (328) PENN STATE (SU: 1-2, ATS: 2-1) - Saturday, 9/22/2012 3:30 PM
Team offense Team defense Pdif ss PPG fd rushinG PassinG ToTal f-i PPG fd rushinG PassinG ToTal f-i Tod
TEMPLE +11.0 13.5 34 12 43-176 (4.1) 14-6-120 (8.2) 57-296 (5.2) 1-0 23 18 46-178 (3.9) 22-11-172 (7.6) 68-350 (5.1) 2-0 +3
PENN STATE +5.3 31.0 21 19 31-108 (3.5) 37-20-233 (6.2) 68-341 (5.0) 1-0 16 20 44-154 (3.5) 33-22-241 (7.2) 77-395 (5.1) 2-1 +5
TemPle Penn sTaTe (-9)vs
S tat F o x F o R e C a S t e R :
Temple 23Penn State 18

Co l l eg e F o ot b a l l W e e k 4 : S e P t e M b e R 2 2
18 www.StatFox.com
t h e P l at i n u M S h e e t
• MARYLAND is 0-9 ATS after 1 or more consecutive straight up losses over the L2 seasons.• WEST VIRGINIA is 8-1 OVER when playing on a Saturday over the L2 seasons.• Randy Edsall is 22-8 ATS away after playing 2 straight non-conference games.
Game Breakdown: West Virginia has won six straight against Maryland, scoring 31+ points each time during a five-game ATS win streak. Last year, Maryland nearly overcame a 34-10 deficit before losing to WVU 37-31 in College Park. The Terps have the second-fewest yards in FBS (258 YPG), but the defense is allowing just 227 YPG (8th in FBS). Mountaineers WR Stedman Bailey leads the nation with 139 receiving YPG and Geno Smith is 2nd in total offense (409 total YPG). Smith has 656 pass yards and 5 TD in two games vs. Maryland.
• (329) MARYLAND (SU: 2-1, ATS: 1-1) at (330) WEST VIRGINIA (SU: 2-0, ATS: 1-1) - Saturday, 9/22/2012 12:00 PM
Team offense Team defense Pdif ss PPG fd rushinG PassinG ToTal f-i PPG fd rushinG PassinG ToTal f-i Tod
MARYLAND +2.3 24.0 21 16 40-110 (2.7) 23-12-148 (6.4) 63-258 (4.1) 2-1 19 11 40-103 (2.6) 19-9-124 (6.4) 59-227 (3.8) 1-1 -4
WEST VIRGINIA +32.5 12.5 56 30 30-226 (7.4) 44-36-386 (8.9) 74-612 (8.3) 0-0 23 22 47-160 (3.4) 40-24-262 (6.6) 87-422 (4.9) 0-1 +2
maryland wesT VirGinia (-28)vs
S tat F o x F o R e C a S t e R :
Maryland 22West Virginia 48
• Steve Spurrier is 17-3 ATS after gaining 6.25+ yards/play in the previous game as coach of SOUTH CAROLINA.• MISSOURI is 2-10 ATS in road games after 2 straight games with 40 or more pass attempts since 1992. • Steve Spurrier is 7-0 ATS versus excellent rushing defenses -allowing <=2.75 rush yds/carry as S.C. coach.
Game Breakdown: South Carolina plays Missouri for the first time ever in the regular season. The Tigers have won both bowl matchups in series history, most recently winning the 2005 Independence Bowl, 38-31. Missouri QB James Franklin (shoulder) is set to return after missing last week’s 24-20 win over Arizona State when his Tigers forced four turnovers, giving them 10 already this year. South Carolina slapped around ECU and UAB in the past two weeks by a combined score of 97 to 16 behind five TD passes from Dylan Thompson.
• (367) MISSOURI (SU: 2-1, ATS: 1-1) at (368) SOUTH CAROLINA (SU: 3-0, ATS: 2-1) - Saturday, 9/22/2012 3:30 PM
Team offense Team defense Pdif ss PPG fd rushinG PassinG ToTal f-i PPG fd rushinG PassinG ToTal f-i Tod
MISSOURI +11.7 31.7 35 18 40-163 (4.0) 36-22-217 (6.0) 76-380 (5.0) 1-1 24 17 35-95 (2.7) 32-20-197 (6.1) 67-292 (4.4) 2-1 +6
SOUTH CAROLINA +28.3 31.3 38 21 37-172 (4.6) 27-15-262 (9.6) 64-434 (6.8) 1-1 10 16 34-53 (1.6) 36-21-262 (7.4) 70-315 (4.5) 1-2 +2
missouri souTh Carolina (-10)vs
S tat F o x F o R e C a S t e R :
Missouri 17South Carolina 29
• FLORIDA STATE is 12-3 ATS in home games after gaining 525+ total yards/game over the L3 games since 1992.• CLEMSON is 11-1 UNDER away when playing on a Saturday over the L3 seasons.• Jimbo Fisher is 7-0 UNDER after a game where they forced no turnovers as coach of FLORIDA STATE.
Game Breakdown: The home team has come out on top nine times out of 10 in this series, but Clemson is 6-1 ATS in the past seven meetings with FSU. Last year the Tigers won 35-30 as Tajh Boyd threw for 344 yards and scored four times, including 2 TD passes to Sammy Watkins who had 141 receiving yards. Boyd has 822 total yards and 6 TD so far this season. ‘Noles QB EJ Manuel did not play against the Tigers last year, but he has seven total TD this year as FSU has outscored its opponents 176 to 3. Bjoern Werner has 6.5 sacks.
• (311) CLEMSON (SU: 3-0, ATS: 1-2) at (312) FLORIDA STATE (SU: 3-0, ATS: 2-1) - Saturday, 9/22/2012 8:00 PM
Team offense Team defense Pdif ss PPG fd rushinG PassinG ToTal f-i PPG fd rushinG PassinG ToTal f-i Tod
CLEMSON +22.0 19.7 40 26 42-219 (5.2) 38-27-298 (7.9) 80-517 (6.5) 0-1 18 17 38-181 (4.8) 29-16-188 (6.5) 67-369 (5.5) 0-2 +4
FLORIDA STATE +57.7 7.3 59 25 37-279 (7.6) 28-20-265 (9.5) 65-544 (8.4) 1-0 1 6 28-34 (1.2) 26-10-70 (2.7) 54-104 (1.9) 1-0 +1
Clemson florida sTaTe (-14)vs
S tat F o x F o R e C a S t e R :
Clemson 13Florida State 38
• ARKANSAS is 8-0 ATS at home after playing a conference game over the L3 seasons.• RUTGERS is 16-9 ATS in non-home games over the L5 seasons.• ARKANSAS is 10-2 OVER when playing with 6 or less days rest over the L2 seasons.
Game Breakdown: Rutgers seeks its third road win of the season against a reeling Arkansas team that has dropped two straight at home. The Scarlet Knights have allowed just 25 points all season, forcing four turnovers in last Thursday’s 23-13 win at USF. The Razorbacks might still be without starting QB Tyler Wilson who suffered concussion-like symptoms in the OT loss to ULM and didn’t play in the 52-0 thumping versus Alabama, when Brandon Allen and Brandon Mitchell guided the Hogs to a pathetic 137 total yards and five turnovers.
• (339) RUTGERS (SU: 3-0, ATS: 1-2) at (340) ARKANSAS (SU: 1-2, ATS: 0-3) - Saturday, 9/22/2012 7:00 PM
Team offense Team defense Pdif ss PPG fd rushinG PassinG ToTal f-i PPG fd rushinG PassinG ToTal f-i Tod
RUTGERS +16.0 15.3 24 18 37-163 (4.4) 30-16-188 (6.3) 67-351 (5.2) 0-1 8 16 28-59 (2.1) 34-20-190 (5.5) 62-249 (4.0) 1-1 +3
ARKANSAS -10.0 33.3 27 20 33-106 (3.2) 33-17-253 (7.7) 66-359 (5.4) 2-1 37 24 41-153 (3.7) 42-25-284 (6.8) 83-437 (5.3) 0-0 -8
ruTGers arkansasvs
S tat F o x F o R e C a S t e R :
Rutgers 22Arkansas 30

www.StatFox .com
www.StatFox.com 19
t h e P l at i n u M S h e e t
• LSU is 11-0 ATS after outgaining opp by 125 or more total yards in their previous game over the L2 seasons.• Gene Chizik is 10-2 ATS in home games against conference opponents as the coach of AUBURN. • LSU is 8-0 ATS after playing a game at home over the L2 seasons.
Game Breakdown: LSU has won four of the past five meetings in this series, but the past four matchups in Jordan-Hare Stadium have been decided by seven points or less. Last year, top-ranked LSU destroyed Auburn in Baton Rouge, 45-10, as Kenny Hilliard scored two rushing touchdowns. Hilliard has 2 TD in all three games this year and Zach Mettenberg-er has completed 72 percent of his passes for 609 yards. Auburn, which has been outgained by 318 yards this year, needed overtime to beat ULM last week and avoid an 0-3 start.
• (357) LSU (SU: 3-0, ATS: 2-1) at (358) AUBURN (SU: 1-2, ATS: 0-3) - Saturday, 9/22/2012 7:00 PM
Team offense Team defense Pdif ss PPG fd rushinG PassinG ToTal f-i PPG fd rushinG PassinG ToTal f-i Tod
LSU +38.0 27.7 48 24 46-269 (5.9) 23-16-203 (9.0) 69-472 (6.8) 0-1 10 12 28-47 (1.7) 31-16-158 (5.1) 59-205 (3.5) 0-2 +4
AUBURN -7.3 39.7 20 17 39-175 (4.5) 23-12-161 (7.1) 62-336 (5.4) 1-2 27 26 43-217 (5.0) 37-24-225 (6.0) 80-442 (5.5) 0-0 -7
lsu (-18½) auBurnvs
S tat F o x F o R e C a S t e R :
LSU 37Auburn 16
• Bill Snyder is 11-2 ATS away against conference opponents as coach of KANSAS STATE.• Bob Stoops is 13-3 ATS as a home favorite of 7.5 to 14 points as coach of OKLAHOMA.• KANSAS STATE is 9-1 OVER in road games over the L3 seasons.
Game Breakdown: The Sooners are 8-1 SU (5-4 ATS) in this series since 2000, scoring a hefty 46.4 PPG during a five-game series win streak. Last year Landry Jones threw for 505 yards in a 58-17 blowout for Oklahoma, giving him 799 passing yards and 9 TD in two meetings with the Wildcats. KSU’s Collin Klein was held to 58 passing yards in last year’s loss to the Sooners, but he has thrown for 609 yards and run for 210 more with 9 total TD this season. OU rushed for 8 TD (4 by Damien Williams) in last week’s 69-13 win over Florida A&M.
• (373) KANSAS STATE (SU: 3-0, ATS: 2-1) at (374) OKLAHOMA (SU: 2-0, ATS: 1-1) - Saturday, 9/22/2012 7:50 PM
Team offense Team defense Pdif ss PPG fd rushinG PassinG ToTal f-i PPG fd rushinG PassinG ToTal f-i Tod
KANSAS STATE +31.7 21.7 46 23 43-252 (5.9) 20-14-203 (10.3) 63-455 (7.2) 0-1 14 18 32-93 (2.9) 36-24-251 (7.0) 68-344 (5.1) 2-0 +3
OKLAHOMA +36.5 11.0 46 26 39-277 (7.1) 34-22-268 (7.8) 73-545 (7.5) 0-0 10 11 32-134 (4.2) 27-12-111 (4.1) 59-245 (4.2) 0-0 -1
kansas sTaTe oklahoma (-13½)vs
S tat F o x F o R e C a S t e R :
Kansas State 24Oklahoma 38
The StatFox Situational Team Power Trends uncover situations where a team outperforms or underperforms their normal level of play. These trends are great indicators of how teams react to situations (i.e. coming off a close win, against division opponents, etc.)
• LSU is 11-0 ATS (+11 Units) after outgaining opp by 125 or more total yards in their previ-ous game over the last 2 seasons.
The average score was LSU 39.8, OPPONENT 9.8.
PLAY ON LSU r aT i n G = * * * * *
• BYU is 12-1 ATS (+10.9 Units) after allowing 100 or less rushing yards last game over the last 3 seasons.
The average score was BYU 34.2, OPPONENT 19.0.
PLAY ON BYU r aT i n G = * * * *
• ARKANSAS is 8-0 ATS (+8 Units) in home games after playing a conference game over the last 3 seasons.
The average score was ARKANSAS 41.6, OPPONENT 19.8.
PLAY ON ARKANSAS r aT i n G = * * *
S i t u at i o n a l t e a M P oW e R t R e n d S
• Mike Riley is 0-8 ATS away after allowing 9 points or less last game as coach of OREGON STATE.• UCLA is 9-1 ATS in home games after a win by 28 or more points since 1992. • Mike Riley is 13-2 UNDER after scoring 14 points or less last game as coach of OREGON STATE.
Game Breakdown: UCLA is 7-2 SU (8-1 ATS) in the past nine meetings in this series, outrushing Oregon State 211 to 88 in a 27-19 win. The Beavers have played just one game in 2012, displaying an impressive defense in a 10-7 win over Wisconsin, holding the Badgers to 35 yards on 23 carries. However, the Bruins have run over three straight opponents, liter-ally, with 311 rushing YPG (5th in FBS), led by the nation’s leading rusher Johnathan Franklin (180 YPG). Although UCLA’s offense has eight turnovers, the defense has forced 10 TO.
• (349) OREGON STATE (SU: 1-0, ATS: 1-0) at (350) UCLA (SU: 3-0, ATS: 3-0) - Saturday, 9/22/2012 3:30 PM
Team offense Team defense Pdif ss PPG fd rushinG PassinG ToTal f-i PPG fd rushinG PassinG ToTal f-i Tod
OREGON STATE +3.0 52.0 10 18 30-78 (2.6) 47-29-276 (5.9) 77-354 (4.6) 0-0 7 13 23-35 (1.5) 38-20-172 (4.5) 61-207 (3.4) 1-1 +2
UCLA +20.7 36.7 41 27 50-311 (6.3) 37-24-311 (8.3) 87-622 (7.1) 2-1 20 18 34-191 (5.6) 40-21-204 (5.1) 74-395 (5.3) 1-2 +2
oreGon sTaTe uCla (-11)vs
S tat F o x F o R e C a S t e R :
Oregon State 17UCLA 30

Co l l eg e F o ot b a l l W e e k 4 : S e P t e M b e R 2 0 - 2 2
20 www.StatFox.com
t h e P l at i n u M S h e e t
• Gary Patterson is 38-22 ATS in home games as coach of TCU.• TCU is 32-17 ATS off 1 or more consecutive unders since 1992. • Gary Patterson is 13-4 ATS at home off a no-cover where the team won as a favorite as coach of TCU.
Game Breakdown: Virginia hopes to provide TCU its first real test this year. The Cavaliers are 0-3 ATS, getting outrushed 582 to 130 in two FBS games, a lucky 17-16 win over Penn State and a 56-20 blowout loss at Georgia Tech. The Horned Frogs had 487 yards last week, but only beat Kansas 20-6 because of four turnovers. TCU’s Casey Pachall leads the na-tion in passing efficiency (33-of-39, 536 yards, 5 TD, 0 INT). These two teams have played just twice all-time with the last matchup being a 30-14 road victory for TCU in 2009.
• (351) VIRGINIA (SU: 2-1, ATS: 0-3) at (352) TCU (SU: 2-0, ATS: 1-1) - Saturday, 9/22/2012 12:00 PM
Team offense Team defense Pdif ss PPG fd rushinG PassinG ToTal f-i PPG fd rushinG PassinG ToTal f-i Tod
VIRGINIA -3.7 28.3 27 19 32-105 (3.3) 37-25-274 (7.3) 69-379 (5.5) 1-1 30 19 38-203 (5.4) 33-17-193 (5.9) 71-396 (5.6) 0-0 -5
TCU +35.0 9.5 38 24 39-204 (5.2) 24-20-306 (13.0) 63-510 (8.1) 2-0 3 12 30-60 (2.1) 26-12-164 (6.2) 56-224 (4.0) 0-1 -2
VirGinia TCu (-17)vs
S tat F o x F o R e C a S t e R :
Virginia 18TCU 37
• Jeff Tedford is 10-24 ATS away after a game where they committed 1 or less turnovers as CALIFORNIA coach.• CALIFORNIA is 23-10 ATS as an underdog of 10.5 to 21 points since 1992.• Jeff Tedford is 19-8 UNDER away off 1 or more straight overs as coach of CALIFORNIA.
Game Breakdown: USC has dominated Cal, winning the last eight meetings (6-2 ATS) and holding the Bears to 17 points or less in all eight defeats. The Trojans have covered three straight matchups by outscoring California 108-26. The Bears have allowed 31+ points in all three games this year, but nearly beat Ohio State last week behind 160 yards (on four car-ries) for Brendan Bigelow. USC’s Matt Barkley had 0 TD and 2 INT in last week’s loss at Stanford, but he has thrown for 830 yards, 7 TD and 1 INT in three career games versus Cal.
• (353) CALIFORNIA (SU: 1-2, ATS: 1-2) at (354) USC (SU: 2-1, ATS: 0-3) - Saturday, 9/22/2012 6:00 PM
Team offense Team defense Pdif ss PPG fd rushinG PassinG ToTal f-i PPG fd rushinG PassinG ToTal f-i Tod
CALIFORNIA +1.7 28.3 34 21 36-208 (5.8) 33-21-257 (7.8) 69-465 (6.7) 1-1 32 20 41-154 (3.7) 36-24-257 (7.2) 77-411 (5.3) 1-1 -1
USC +15.0 40.0 35 17 28-122 (4.3) 37-23-278 (7.5) 65-400 (6.2) 1-1 20 23 37-130 (3.6) 39-23-248 (6.4) 76-378 (5.0) 1-2 +3
California usC (-16)vs
S tat F o x F o R e C a S t e R :
California 24USC 37
• Chip Kelly is 17-3 OVER as a home favorite as coach of OREGON.• ARIZONA is 1-9 ATS in road games after a win by 28 or more points since 1992. • OREGON is 17-4 ATS after leading their last 2 games by 14+ points at the half since 1992.
Game Breakdown: Since 1994, Oregon is 15-3 SU in this series, averaging an insane 50.8 PPG during a four-game series win streak, but Arizona is 5-2 ATS in the past seven match-ups. The Wildcats have lost their past 10 road openers, but have scored 115 points in the past two weeks thanks to QB Matt Scott’s 724 total yards and 9 TD. The Ducks are putting up 54.0 PPG and 596 total YPG this year behind 8 TD passes from Marcus Mariota and De’Anthony Thomas’ 158 all-purpose YPG and 7 TD. Oregon won last year’s meeting, 56-31.
• (347) ARIZONA (SU: 3-0, ATS: 2-1) at (348) OREGON (SU: 3-0, ATS: 0-3) - Saturday, 9/22/2012 10:30 PM
Team offense Team defense Pdif ss PPG fd rushinG PassinG ToTal f-i PPG fd rushinG PassinG ToTal f-i Tod
ARIZONA +28.0 32.7 46 36 49-247 (5.1) 45-31-358 (8.0) 94-605 (6.4) 1-0 18 21 36-142 (3.9) 44-23-241 (5.5) 80-383 (4.8) 1-1 +2
OREGON +29.7 20.7 54 30 53-329 (6.2) 33-23-267 (8.1) 86-596 (6.9) 1-1 24 21 39-157 (4.0) 37-23-200 (5.4) 76-357 (4.7) 1-1 -2
arizona oreGon (-24)vs
S tat F o x F o R e C a S t e R :
Arizona 28Oregon 48
• NOTRE DAME is 6-0 ATS after allowing 17 points or less in 2 straight games over the last 3 seasons. • MICHIGAN is 1-10 ATS off 1 or more straight overs over the L3 seasons.• Brian Kelly is 11-2 UNDER at home in non-conference games as coach of NOTRE DAME.
Game Breakdown: Although Michigan is 5-1 (SU and ATS) in the past six meetings of this series, the past three matchups have each been decided by exactly four points. Denard Robinson had 446 total yards and 5 TD in leading the Wolverines to 28 fourth-quarter points in a crazy 35-31 comeback win over Notre Dame last year. But this season’s Irish de-fense is much improved, limiting two straight Big Ten opponents (Purdue and Michigan State) to a combined 20 points and 140 rushing yards on 55 carries (2.5 YPC).
• (369) MICHIGAN (SU: 2-1, ATS: 1-2) at (370) NOTRE DAME (SU: 3-0, ATS: 2-1) - Saturday, 9/22/2012 7:30 PM
Team offense Team defense Pdif ss PPG fd rushinG PassinG ToTal f-i PPG fd rushinG PassinG ToTal f-i Tod
MICHIGAN +9.7 39.3 36 19 34-192 (5.6) 26-14-233 (9.1) 60-425 (7.1) 0-2 26 20 50-211 (4.3) 23-12-158 (6.8) 73-369 (5.1) 1-0 -3
NOTRE DAME +20.0 38.3 30 21 39-156 (4.0) 31-18-233 (7.4) 70-389 (5.6) 0-0 10 16 32-96 (3.0) 34-19-192 (5.7) 66-288 (4.4) 1-1 +5
miChiGan noTre dame (-6½)vs
S tat F o x F o R e C a S t e R :
Michigan 23Notre Dame 30
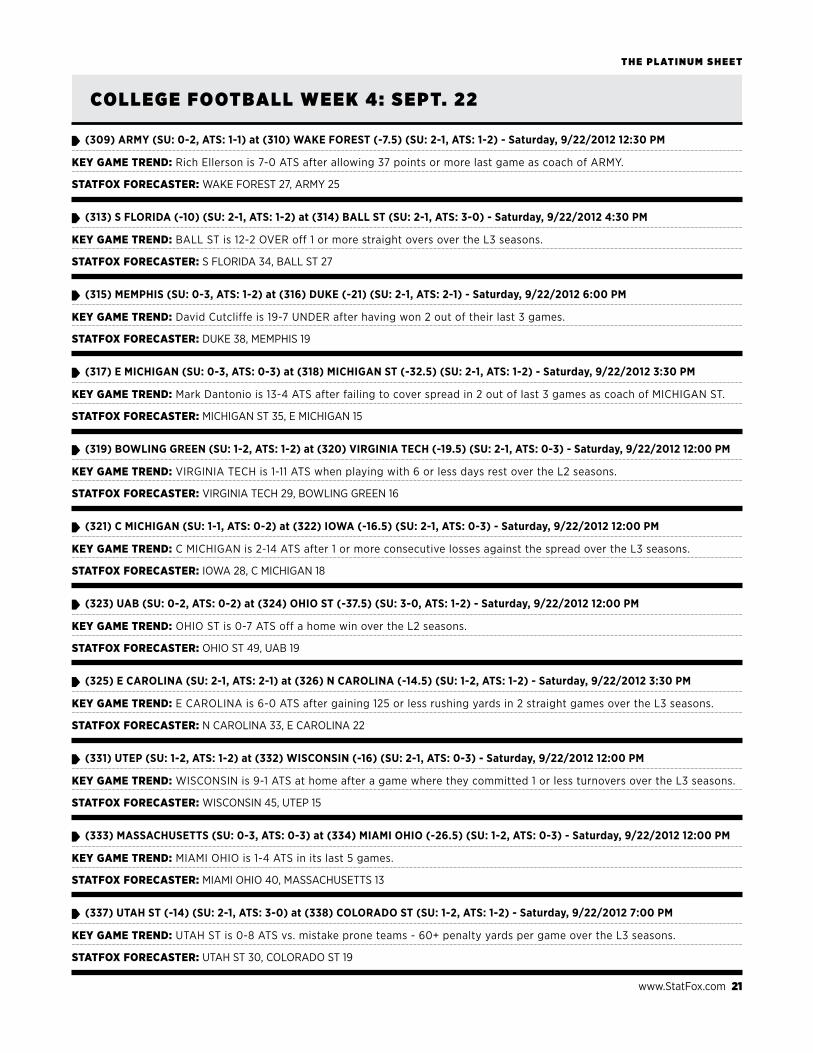
www.StatFox.com 21
T h e P l aT i n u m S h e e T
Co l l eg e F o oT b a l l W e e k 4 : S e P T. 2 2
(313) S FLORIDA (-10) (SU: 2-1, ATS: 1-2) at (314) BALL ST (SU: 2-1, ATS: 3-0) - Saturday, 9/22/2012 4:30 PM
KEY GAME TREND: BALL ST is 12-2 OVER off 1 or more straight overs over the L3 seasons.
STATFox FoREcASTER: S FLORIDA 34, BALL ST 27
(321) C MICHIGAN (SU: 1-1, ATS: 0-2) at (322) IOWA (-16.5) (SU: 2-1, ATS: 0-3) - Saturday, 9/22/2012 12:00 PM
KEY GAME TREND: C MICHIGAN is 2-14 ATS after 1 or more consecutive losses against the spread over the L3 seasons.
STATFox FoREcASTER: IOWA 28, C MICHIGAN 18
(317) E MICHIGAN (SU: 0-3, ATS: 0-3) at (318) MICHIGAN ST (-32.5) (SU: 2-1, ATS: 1-2) - Saturday, 9/22/2012 3:30 PM
KEY GAME TREND: Mark Dantonio is 13-4 ATS after failing to cover spread in 2 out of last 3 games as coach of MICHIGAN ST.
STATFox FoREcASTER: MICHIGAN ST 35, E MICHIGAN 15
(325) E CAROLINA (SU: 2-1, ATS: 2-1) at (326) N CAROLINA (-14.5) (SU: 1-2, ATS: 1-2) - Saturday, 9/22/2012 3:30 PM
KEY GAME TREND: E CAROLINA is 6-0 ATS after gaining 125 or less rushing yards in 2 straight games over the L3 seasons.
STATFox FoREcASTER: N CAROLINA 33, E CAROLINA 22
(333) MASSACHUSETTS (SU: 0-3, ATS: 0-3) at (334) MIAMI OHIO (-26.5) (SU: 1-2, ATS: 0-3) - Saturday, 9/22/2012 12:00 PM
KEY GAME TREND: MIAMI OHIO is 1-4 ATS in its last 5 games.
STATFox FoREcASTER: MIAMI OHIO 40, MASSACHUSETTS 13
(337) UTAH ST (-14) (SU: 2-1, ATS: 3-0) at (338) COLORADO ST (SU: 1-2, ATS: 1-2) - Saturday, 9/22/2012 7:00 PM
KEY GAME TREND: UTAH ST is 0-8 ATS vs. mistake prone teams - 60+ penalty yards per game over the L3 seasons.
STATFox FoREcASTER: UTAH ST 30, COLORADO ST 19
(309) ARMY (SU: 0-2, ATS: 1-1) at (310) WAKE FOREST (-7.5) (SU: 2-1, ATS: 1-2) - Saturday, 9/22/2012 12:30 PM
KEY GAME TREND: Rich Ellerson is 7-0 ATS after allowing 37 points or more last game as coach of ARMY.
STATFox FoREcASTER: WAKE FOREST 27, ARMY 25
(319) BOWLING GREEN (SU: 1-2, ATS: 1-2) at (320) VIRGINIA TECH (-19.5) (SU: 2-1, ATS: 0-3) - Saturday, 9/22/2012 12:00 PM
KEY GAME TREND: VIRGINIA TECH is 1-11 ATS when playing with 6 or less days rest over the L2 seasons.
STATFox FoREcASTER: VIRGINIA TECH 29, BOWLING GREEN 16
(315) MEMPHIS (SU: 0-3, ATS: 1-2) at (316) DUKE (-21) (SU: 2-1, ATS: 2-1) - Saturday, 9/22/2012 6:00 PM
KEY GAME TREND: David Cutcliffe is 19-7 UNDER after having won 2 out of their last 3 games.
STATFox FoREcASTER: DUKE 38, MEMPHIS 19
(323) UAB (SU: 0-2, ATS: 0-2) at (324) OHIO ST (-37.5) (SU: 3-0, ATS: 1-2) - Saturday, 9/22/2012 12:00 PM
KEY GAME TREND: OHIO ST is 0-7 ATS off a home win over the L2 seasons.
STATFox FoREcASTER: OHIO ST 49, UAB 19
(331) UTEP (SU: 1-2, ATS: 1-2) at (332) WISCONSIN (-16) (SU: 2-1, ATS: 0-3) - Saturday, 9/22/2012 12:00 PM
KEY GAME TREND: WISCONSIN is 9-1 ATS at home after a game where they committed 1 or less turnovers over the L3 seasons.
STATFox FoREcASTER: WISCONSIN 45, UTEP 15

T h e P l aT i n u m S h e e T
22 www.StatFox.com
Co l l eg e F o oT b a l l W e e k 4 : S e P T. 2 2
(343) MARSHALL (-2.5) (SU: 1-2, ATS: 1-2) at (344) RICE (SU: 1-2, ATS: 2-1) - Saturday, 9/22/2012 3:30 PM
KEY GAME TREND: David Bailiff is 9-0 ATS at home vs. poor rush defenses - allowing >=4.75 rush yards/carry as coach of RICE.
STATFox FoREcASTER: MARSHALL 34, RICE 25
(365) CONNECTICUT (-1) (SU: 2-1, ATS: 1-0) at (366) W MICHIGAN (SU: 1-2, ATS: 1-2) - Saturday, 9/22/2012 2:00 PM
KEY GAME TREND: Paul Pasqualoni is 9-1 ATS against MAC opponents.
STATFox FoREcASTER: W MICHIGAN 32, CONNECTICUT 23
(355) COLORADO (SU: 0-3, ATS: 0-3) at (356) WASHINGTON ST (-18.5) (SU: 2-1, ATS: 0-3) - Saturday, 9/22/2012 4:00 PM
KEY GAME TREND: COLORADO is 0-8 ATS as an underdog of 10.5 to 21 points over the L3 seasons.
STATFox FoREcASTER: WASHINGTON ST 33, COLORADO 21
(375) NEW MEXICO (SU: 1-2, ATS: 1-2) at (376) NEW MEXICO ST (-7) (SU: 1-2, ATS: 2-1) - Saturday, 9/22/2012 8:00 PM
KEY GAME TREND: DeWayne Walker is 11-3 ATS when playing against a team with a losing record as coach of NEW MEXICO ST.
STATFox FoREcASTER: NEW MEXICO ST 33, NEW MEXICO 19
(379) OLE MISS (SU: 2-1, ATS: 2-1) at (380) TULANE (nl) (SU: 0-2, ATS: 1-1) - Saturday, 9/22/2012 12:00 PM
KEY GAME TREND: OLE MISS is 6-16 ATS when playing with 6 or less days rest over the L3 seasons.
STATFox FoREcASTER: OLE MISS 28, TULANE 21
(341) FRESNO ST (SU: 2-1, ATS: 3-0) at (342) TULSA (-5.5) (SU: 2-1, ATS: 2-1) - Saturday, 9/22/2012 8:00 PM
KEY GAME TREND: TULSA is 9-1 ATS vs. good passing teams with a completion pct. of 58% or better. over the L3 seasons.
STATFox FoREcASTER: TULSA 39, FRESNO ST 26
(361) WYOMING (SU: 0-3, ATS: 1-2) at (362) IDAHO (nl) (SU: 0-3, ATS: 1-2) - Saturday, 9/22/2012 5:00 PM
KEY GAME TREND: Robb Akey is 1-9 ATS at home when playing against a team with a losing record as coach of IDAHO.
STATFox FoREcASTER: WYOMING 29, IDAHO 22
(345) KANSAS (SU: 1-2, ATS: 1-2) at (346) N ILLINOIS (-10) (SU: 2-1, ATS: 2-1) - Saturday, 9/22/2012 3:30 PM
KEY GAME TREND: KANSAS is 2-12 ATS in its last 14 games on the road.
STATFox FoREcASTER: N ILLINOIS 40, KANSAS 10
(371) SYRACUSE (SU: 1-2, ATS: 1-2) at (372) MINNESOTA (-2) (SU: 3-0, ATS: 2-1) - Saturday, 9/22/2012 8:00 PM
KEY GAME TREND: Jerry Kill is 8-0 ATS when playing against a bad team (Win Pct. 25% to 40%).
STATFox FoREcASTER: MINNESOTA 33, SYRACUSE 21
(377) AKRON (SU: 1-2, ATS: 2-1) at (378) TENNESSEE (nl) (SU: 2-1, ATS: 1-2) - Saturday, 9/22/2012 7:30 PM
KEY GAME TREND: Derek Dooley is 7-0 OVER in the first month of the season as coach of TENNESSEE.
STATFox FoREcASTER: TENNESSEE 34, AKRON 12
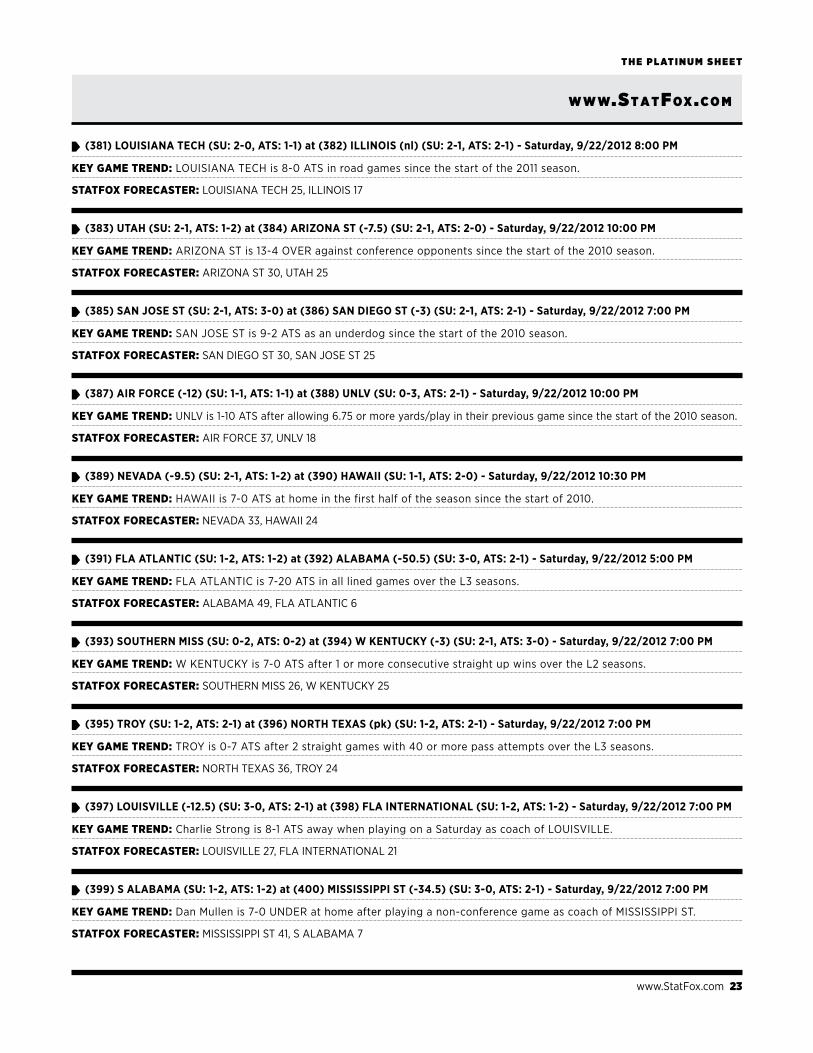
www.StatFox.com 23
T h e P l aT i n u m S h e e T
www.StatFox .com
(383) UTAH (SU: 2-1, ATS: 1-2) at (384) ARIZONA ST (-7.5) (SU: 2-1, ATS: 2-0) - Saturday, 9/22/2012 10:00 PM
KEY GAME TREND: ARIZONA ST is 13-4 OVER against conference opponents since the start of the 2010 season.
STATFox FoREcASTER: ARIZONA ST 30, UTAH 25
(391) FLA ATLANTIC (SU: 1-2, ATS: 1-2) at (392) ALABAMA (-50.5) (SU: 3-0, ATS: 2-1) - Saturday, 9/22/2012 5:00 PM
KEY GAME TREND: FLA ATLANTIC is 7-20 ATS in all lined games over the L3 seasons.
STATFox FoREcASTER: ALABAMA 49, FLA ATLANTIC 6
(387) AIR FORCE (-12) (SU: 1-1, ATS: 1-1) at (388) UNLV (SU: 0-3, ATS: 2-1) - Saturday, 9/22/2012 10:00 PM
KEY GAME TREND: UNLV is 1-10 ATS after allowing 6.75 or more yards/play in their previous game since the start of the 2010 season.
STATFox FoREcASTER: AIR FORCE 37, UNLV 18
(395) TROY (SU: 1-2, ATS: 2-1) at (396) NORTH TEXAS (pk) (SU: 1-2, ATS: 2-1) - Saturday, 9/22/2012 7:00 PM
KEY GAME TREND: TROY is 0-7 ATS after 2 straight games with 40 or more pass attempts over the L3 seasons.
STATFox FoREcASTER: NORTH TEXAS 36, TROY 24
(399) S ALABAMA (SU: 1-2, ATS: 1-2) at (400) MISSISSIPPI ST (-34.5) (SU: 3-0, ATS: 2-1) - Saturday, 9/22/2012 7:00 PM
KEY GAME TREND: Dan Mullen is 7-0 UNDER at home after playing a non-conference game as coach of MISSISSIPPI ST.
STATFox FoREcASTER: MISSISSIPPI ST 41, S ALABAMA 7
(381) LOUISIANA TECH (SU: 2-0, ATS: 1-1) at (382) ILLINOIS (nl) (SU: 2-1, ATS: 2-1) - Saturday, 9/22/2012 8:00 PM
KEY GAME TREND: LOUISIANA TECH is 8-0 ATS in road games since the start of the 2011 season.
STATFox FoREcASTER: LOUISIANA TECH 25, ILLINOIS 17
(389) NEVADA (-9.5) (SU: 2-1, ATS: 1-2) at (390) HAWAII (SU: 1-1, ATS: 2-0) - Saturday, 9/22/2012 10:30 PM
KEY GAME TREND: HAWAII is 7-0 ATS at home in the first half of the season since the start of 2010.
STATFox FoREcASTER: NEVADA 33, HAWAII 24
(385) SAN JOSE ST (SU: 2-1, ATS: 3-0) at (386) SAN DIEGO ST (-3) (SU: 2-1, ATS: 2-1) - Saturday, 9/22/2012 7:00 PM
KEY GAME TREND: SAN JOSE ST is 9-2 ATS as an underdog since the start of the 2010 season.
STATFox FoREcASTER: SAN DIEGO ST 30, SAN JOSE ST 25
(393) SOUTHERN MISS (SU: 0-2, ATS: 0-2) at (394) W KENTUCKY (-3) (SU: 2-1, ATS: 3-0) - Saturday, 9/22/2012 7:00 PM
KEY GAME TREND: W KENTUCKY is 7-0 ATS after 1 or more consecutive straight up wins over the L2 seasons.
STATFox FoREcASTER: SOUTHERN MISS 26, W KENTUCKY 25
(397) LOUISVILLE (-12.5) (SU: 3-0, ATS: 2-1) at (398) FLA INTERNATIONAL (SU: 1-2, ATS: 1-2) - Saturday, 9/22/2012 7:00 PM
KEY GAME TREND: Charlie Strong is 8-1 ATS away when playing on a Saturday as coach of LOUISVILLE.
STATFox FoREcASTER: LOUISVILLE 27, FLA INTERNATIONAL 21