p erceived u nmet n eeds among c aregivers o f c hildren with d isabilities at c ommunity -b ased r...
TRANSCRIPT
PERCEIVED UNMET NEEDS AMONG CAREGIVERS OF
CHILDREN WITH DISABILITIES AT COMMUNITY-BASED
REHABILITATION CENTRE IN SELANGOR
By:
Suriati Bt Sidek
Sharifah Zainiyah Syed Yahya
Lye Munn Sann
&
Norlijah Othman
National Health Promotion Conference 2011
10-11 October 2011Cititel Mid Valley

INTRODUCTION
Disability is covering impairments, activity limitations and participation restrictions (World Health Organization, 2009a).
There are seven categories of disabilities; which include hearing, visual, physical, speech, learning, mental and multiple disabilities (Community Portal for Disabled People, 2009).
Statistic Report (2009) shows that there are 261 154 disabled people had registered with the Social Welfare Department of Malaysia.

PROBLEM STATEMENT
Improvement on healthcare system increases life expectancy of children with disabilities (Martin and Colbert, 1997).
Caregivers may experience the need for: InformationSocial supportA range of servicesFinancial support (Bailey and Simeonsson, 1988; Graves and
Hayes, 1996; Farmer et al., 2004;).
OBJECTIVES
General: To determine the perceived unmet needs among
caregivers of children with disabilities at Community-based Rehabilitation centre (CBR) in Selangor.
Specific:1. To determine the caregivers’ socio-demographic
characteristics and children’s demographic characteristics.
2. To determine the type and frequency of unmet needs of caregivers of children with disabilities according to the six subscales using the Family Need Survey (FNS) instrument.
METHODOLOGY
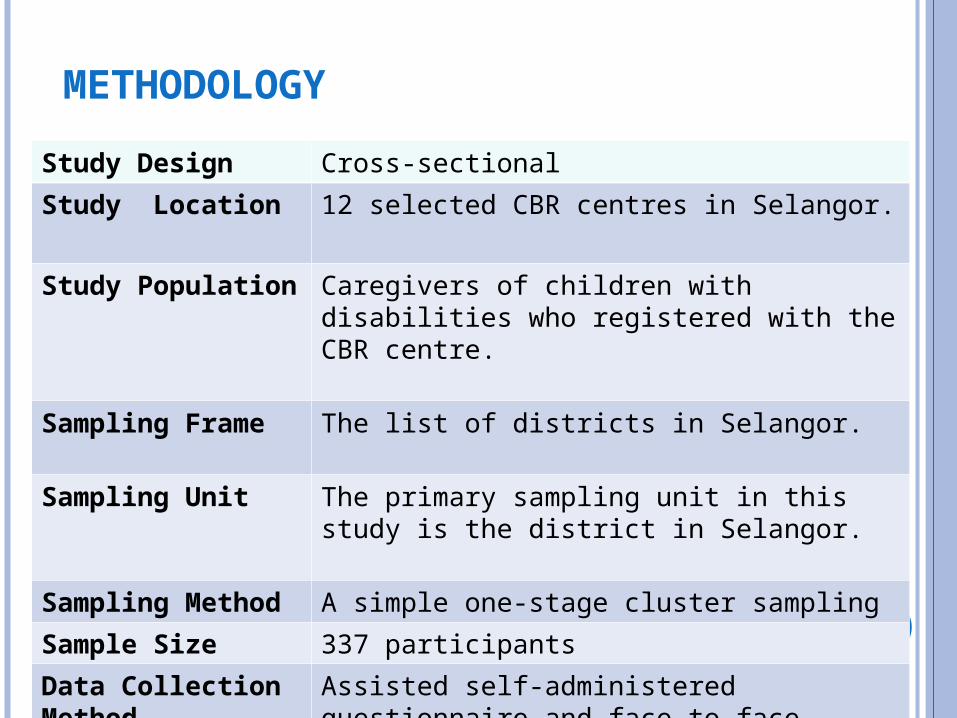
Study Design Cross-sectional
Study Location 12 selected CBR centres in Selangor.
Study Population Caregivers of children with disabilities who registered with the CBR centre.
Sampling Frame The list of districts in Selangor.
Sampling Unit The primary sampling unit in this study is the district in Selangor.
Sampling Method
A simple one-stage cluster sampling
Sample Size 337 participants
Data Collection Method
Assisted self-administered questionnaire and face to face interview.

MATERIAL
Scale Authors Item Reliability Validity
Family Needs Survey (FNS)
Bailey and Simeonsson (1988)
6 subscales with 35 items
Kuder-Richardson 20 = 0.88.
A good content and construct validity

DATA ANALYSIS
Statistical Test
Purpose
Descriptive To determine the frequency distribution and percentage.


RESPONSE RATE
District Name of CBR centre
Number of eligible caregivers
Number of
recruited caregiver
s
% of response rate
KUALA LANGAT
Telok Datok 52 49 94.2Rumah SayangKu
33 29 87.9
Tanjung Sepat 22 18 81.8Bukit Changgang
16 15 93.8
Suboverall 123 111 90.2HULU LANGAT
Semenyih 28 25 89.3Taman Seri Jerlok
50 44 88.0
Suboverall 78 69 88.5
KLANGKlang Utara 30 25 83.3Klang Selatan 31 28 90.3
Suboverall 61 53 86.9KUALA SELANGOR
Sri Cahaya 25 21 84.0Kuala Selangor 15 9 60.0Tanjung Karang
20 15 75.0
Suboverall 60 45 75.0SEPANG Rumah
Impianku15 10 66.7
GRAND OVERALL
337 288 85.5
Table 1 Distribution of response rate according to the districts
288 of caregivers participated in the study (85.5%).
The response rate in each of the district ranged from 66.7% to 90.2%.

CAREGIVERS’ SOCIO-DEMOGRAPHIC
CHARACTERISTICS
Majority of respondents were: Mothers (97.2%) Malay (79.2%) Married (99.3%) Housewives (72.6%) Resided in rural area (62.8%)
Majority of respondents had: Some form of education
(99.3%) Monthly income of below RM
2000 (72.2%). Less than four children
(67.7%)
Characteristics Frequency (n) Percentage (%)Relationship Mother OthersGender Male FemaleRace Chinese Indian MalayMarital Status Married DivorcedOccupation Government servant Private sector Self-employed HousewifeFamily Monthly Income ≤ RM1000 RM 1001-2000 RM 2001-3000 >RM 3000No. of Children 1-4 5-9 ≥10Education Level No education Primary Secondary TertiaryPlace of Residence Rural Urban
2808
0288
3228
228
2862
432412
209
1061023743
195894
239
19651
181107
97.22.8
0100
11.19.7
79.2
99.30.7
14.98.34.2
72.6
36.835.412.814.9
67.730.91.4
0.713.568.117.7
62.837.2
Table 2 Caregivers’ socio-demographic characteristics (n=288)
CHILDREN’S DEMOGRAPHIC CHARACTERISTICS
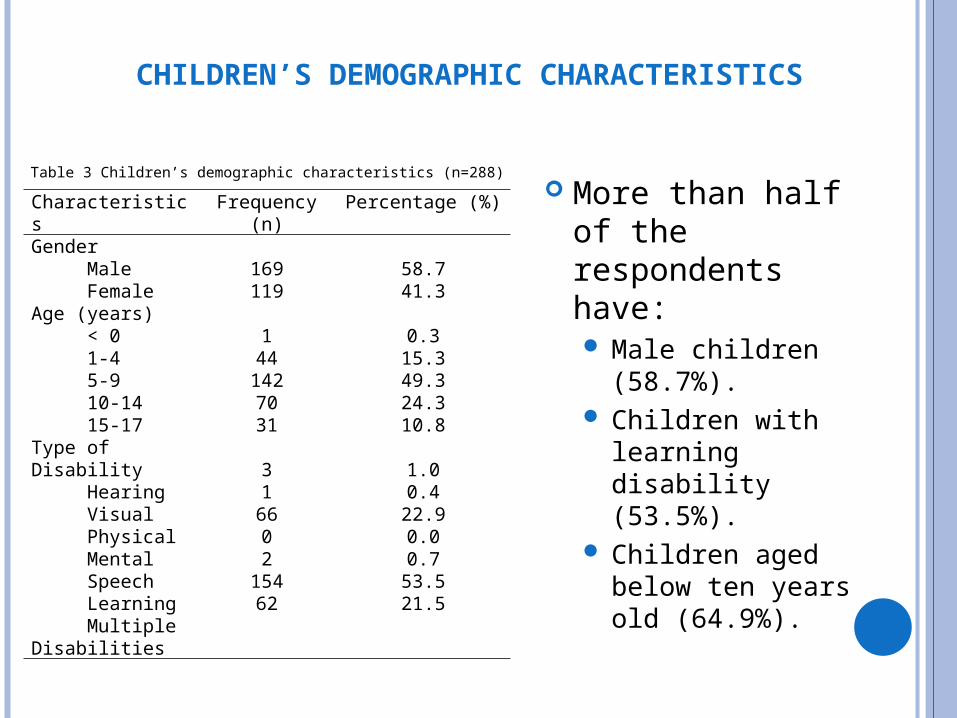
More than half of the respondents have: Male children
(58.7%). Children with
learning disability (53.5%).
Children aged below ten years old (64.9%).
Characteristics Frequency (n) Percentage (%)Gender Male FemaleAge (years) < 0 1-4 5-9 10-14 15-17Type of Disability Hearing Visual Physical Mental Speech Learning Multiple Disabilities
169119
144
1427031
31
6602
15462
58.741.3
0.315.349.324.310.8
1.00.4
22.90.00.7
53.521.5
Table 3 Children’s demographic characteristics (n=288)
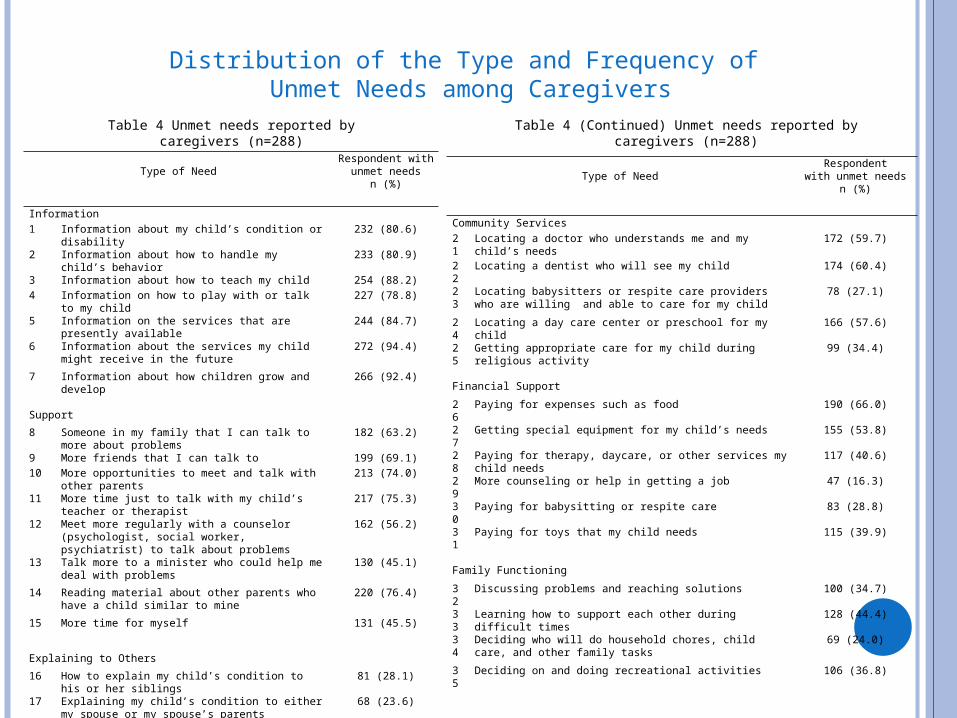
Type of NeedRespondent with
unmet needsn (%)
Information
1 Information about my child’s condition or disability 232 (80.6)
2 Information about how to handle my child’s behavior 233 (80.9)
3 Information about how to teach my child 254 (88.2)
4 Information on how to play with or talk to my child 227 (78.8)
5 Information on the services that are presently available 244 (84.7)
6 Information about the services my child might receive in the future
272 (94.4)
7 Information about how children grow and develop 266 (92.4)
Support
8 Someone in my family that I can talk to more about problems 182 (63.2)
9 More friends that I can talk to 199 (69.1)
10 More opportunities to meet and talk with other parents 213 (74.0)
11 More time just to talk with my child’s teacher or therapist 217 (75.3)
12 Meet more regularly with a counselor (psychologist, social worker, psychiatrist) to talk about problems
162 (56.2)
13 Talk more to a minister who could help me deal with problems
130 (45.1)
14 Reading material about other parents who have a child similar to mine
220 (76.4)
15 More time for myself 131 (45.5)
Explaining to Others
16 How to explain my child’s condition to his or her siblings 81 (28.1)
17 Explaining my child’s condition to either my spouse or my spouse’s parents
68 (23.6)
18 My spouse needs help in understanding and accepting our child’s condition
69 (24.0)
19 How to respond when friends, neighbors, or strangers ask questions about my child’s condition
80 (27.8)
20 Explaining my child’s condition to other children 94 (32.6)
Type of NeedRespondent
with unmet needsn (%)
Community Services
21 Locating a doctor who understands me and my child’s needs 172 (59.7)
22 Locating a dentist who will see my child 174 (60.4)
23 Locating babysitters or respite care providers who are willing and able to care for my child
78 (27.1)
24 Locating a day care center or preschool for my child 166 (57.6)
25 Getting appropriate care for my child during religious activity 99 (34.4)
Financial Support
26 Paying for expenses such as food 190 (66.0)
27 Getting special equipment for my child’s needs 155 (53.8)
28 Paying for therapy, daycare, or other services my child needs 117 (40.6)
29 More counseling or help in getting a job 47 (16.3)
30 Paying for babysitting or respite care 83 (28.8)
31 Paying for toys that my child needs 115 (39.9)
Family Functioning
32 Discussing problems and reaching solutions 100 (34.7)
33 Learning how to support each other during difficult times 128 (44.4)
34 Deciding who will do household chores, child care, and other family tasks
69 (24.0)
35 Deciding on and doing recreational activities 106 (36.8)
Table 4 (Continued) Unmet needs reported by caregivers (n=288)Table 4 Unmet needs reported by caregivers (n=288)
Distribution of the Type and Frequency of Unmet Needs among Caregivers

PERCEIVED UNMET NEEDS
Subscale % of Caregivers with Unmet Needs
Information 98.3Support 93.4Community Services 84.0Financial 79.9Family Functioning 61.8Explaining to Others 46.2
Highest -> Need for information of services that the child might receive in the future (94.4%) and ways to promote child growth and development (92.4%).
Supported by other studies: Bailey and Simeonsson (1988) and Farmer et al., (2004).
The mean score of the overall unmet needs was 18.67 (±SD 7.623).
According to subscale:
Table 5 Descriptive analysis of unmet needs in each subscale

These findings show that:Issues related to information about services
becomes more important as the child gets older.Explanation: caregivers concern and worry about the ongoing care for the child in the future, especially if the caregivers pass away (Lam and Mackenzie, 2002).
Need for information remains largely unmetExplanation: caregivers failed to get help and have no idea where to acquire the information needed (Sloper and Turner, 1992).
PERCEIVED UNMET NEEDS
CONCLUSION
The unmet needs among caregivers were varied.
More effective intervention programs are needed in CBR centre to match or reduce those varied unmet needs.
RECOMMENDATION
The provision of information should be optimized.
Information should be delivered in several ways.

REFERENCES Bailey, D. B. & Simeonsson, R. J. (1988). Assessing needs of families with handicapped infants. The
Journal of Special Education. 22(1), 117-127. Community Portal for Disabled People (2009). Categories of diabilities. Retrieved on August 20, 2009
from http//www.pakarunding.ukm.my/komunitikita/OKU/details.asp?ID=36. Farmer, J.E., Marien, W.E., Clark, M.J., Sherman, A. & Selva, T.J. (2004). Primary care supports for
children with chronic health conditions: Identifying and predicting unmet family needs. Journal of Pediatric Psychology. 29(5), 355-367.
Graves, C. & Hayes, V.E. (1996). Do nurses and parents of children with chronic conditions agree on parental needs? Journal of Pediatric Nursing. 11(5), 288-299.
Lam, L.W. & Mackenzie, A.E. (2002). Coping with a child with Down syndrome: The experiences of mothers in Hong Kong. Qualitative Health Research. 12(2), 223-237.
Martin, C.A. & Colbert, K.K. (1997). Parenting : A life span perspective. Parenting children with special needs (pp. 257-281). United States of America: The McGraw-Hill Companies, Inc.
Sloper, P. & Tuner, S. (1992). Service needs of families of children with severe physical disability. Child: Care, Health and Development. 18, 259-282.
Statistic Report (2009). Disabled People. Statistic of Social Welfare Department of Malaysia. Social Welfare Department of Malaysia, Ministry of Women, Family and Community Development.
Warfield, M.E. & Gulley, S. (2006). Unmet needs and problems accessing specialty medical and related services among children with special health care needs. Maternal and Child Health Journal, 10(2), 201-216.
World Health Organization (2009a). Disabilities. Retrieved on 3 July, 2009 from http://www.who.int/topics/disabilities/en/