p-0767--analysis on inventory management.doc
TRANSCRIPT
AN ANALYSIS ON INVENTORY MANAGEMENT AT
WHIRLPOOL OF INDIA LIMITED, PUDUCHERRY
SUMMER PROJECT REPORT
Submitted by
R.GOPAL
REGISTER NO: 27348312
Under the Guidance of
Mrs. R. HEMALATHA, MBA.,
Faculty, Department of Management Studies in partial fullfilment for the award of the degree
of
MASTER OF BUSINESS ADMINISTRATION
DEPARTMENT OF MANAGEMENT STUDIES
SRI MANAKULA VINAYAGAR ENGINEERING COLLEGE
PONDICHERRY UNIVERSITY
PUDUCHERRY
SEPTEMBER- 2007
SRI MANAKULA VINAYAGAR ENGINEERING COLLEGE
MADAGADIPET, PUDUCHERRY
DEPARTMENT OF MANAGEMENT STUDIES
BONAFIDE CERTIFICATE
This to certify that the project work entitled “AN ANALYSIS ON INVENTORY
MANAGEMENT AT WHIRLPOOL OF INDIA LIMITED, PUDUCHERRY” is a bonafide
work done by R.GOPAL [REGISTER NO: 27348312] in partial fulfilment of the requirement
for the award of Master of Business Administration by Pondicherry University during the
academic year 2007 – 2008.
GUIDE HEAD OF DEPARTMENT
Submitted for Viva-Voce Examination held on
EXTERNAL EXAMINER
ACKNOWLEDGEMENT
First and foremost, I thank the God for his substantial blessing and mercy at all stages in
the completion of the project.
I take this opportunity to express my deep sense of gratitude to SHRI N.KESAVAN,
Founder Chairman, SHRI M.DHANASEKARAN, Managing Director and SHRI
S.V.SUGUMARAN, Vice-Chairman of our college for their good wishes for this project.
I express my immense gratitude to our Principal
DR. V.S.K.VENKATACHALAPATHY for his support and encouragement for the completion
of my project.
I extend the immense gratitude to the Head of the Department MR. S.JAYAKUMAR for
his motivation, inspiration, and encouragement for the completion for my project.
The valuable and unflinching requital support in this Endeavor
MRS. R.HEMALATHA my internal guide, Department of Management Studies whose
assistance was immeasurable to the completion of this project.
I am sincerely thankful to MR. N.RAMESH, Finance Manager, Whirlpool of India
Limited (WOIL) for his help and support throughout the project. I extend my thanks to MR.
K.VIJAY GANESH, Manager of Materials Planning for his help. I extend my sincere thanks
and my deep sense of gratitude to MR. L.GANESH KUMAR, Deputy Manager-Material
Planning for his kind assistance and MR. R.VISHNU PRATAP, Executive-Finance, who were
also my External Guides.
I would also like to thank all the staff of the organization for helping me directly and
indirectly to conclude this work. Last, but not the least, my heart felt gratitude to my parents,
relatives and my friends for their constant encouragement, support, help and valuable advice to
make this project a success.
ABSTRACT
Every organization needs inventory for smooth running of its activities. It serves
as a link between production and distribution processes. The investment in inventories constitutes
the most significant part of current assets/working capital in most of the undertakings. Thus, it is
very essential to have proper control and management of inventories. The purpose of inventory
management is to ensure availability of materials in sufficient quantity as and when required and
also to minimise investment in inventories. Raw materials, goods in process and finished goods
all represent various forms of inventory. Each type represents money tied up until the inventory
leaves the company as purchased products. Because of the large size of the inventories
maintained by firms, a considerable amount of funds is required to be committed to them. It is
therefore absolutely imperative to manage inventories efficiently and effectively in order to avoid
unnecessary investments. A firm neglecting the management of inventories will be jeopardizing
its long run profitability and may fail ultimately. The reduction in excessive inventories carries a
favorable impact on the company’s profitability.
The study starts with an introduction to inventory management, Company’s
profile, its Vision & Mission, Achievements and also the need for study, review of literature and
objectives are set out for the study. Research methodology, Data analysis & Interpretation,
Findings and Suggestions of the study follow.
One of the main areas of the project is the analysis part, where the data are
analysed & interpreted, to find out how the inventories were managed. Some of the tools used in
inventory are regarding to:
Economic Order Quantity
Safety Stock
ABC Analysis
FSN Analysis
Trend Analysis and
Inventory Turnover Ratio.
And then conclusions, limitations & scope for further study were discussed.
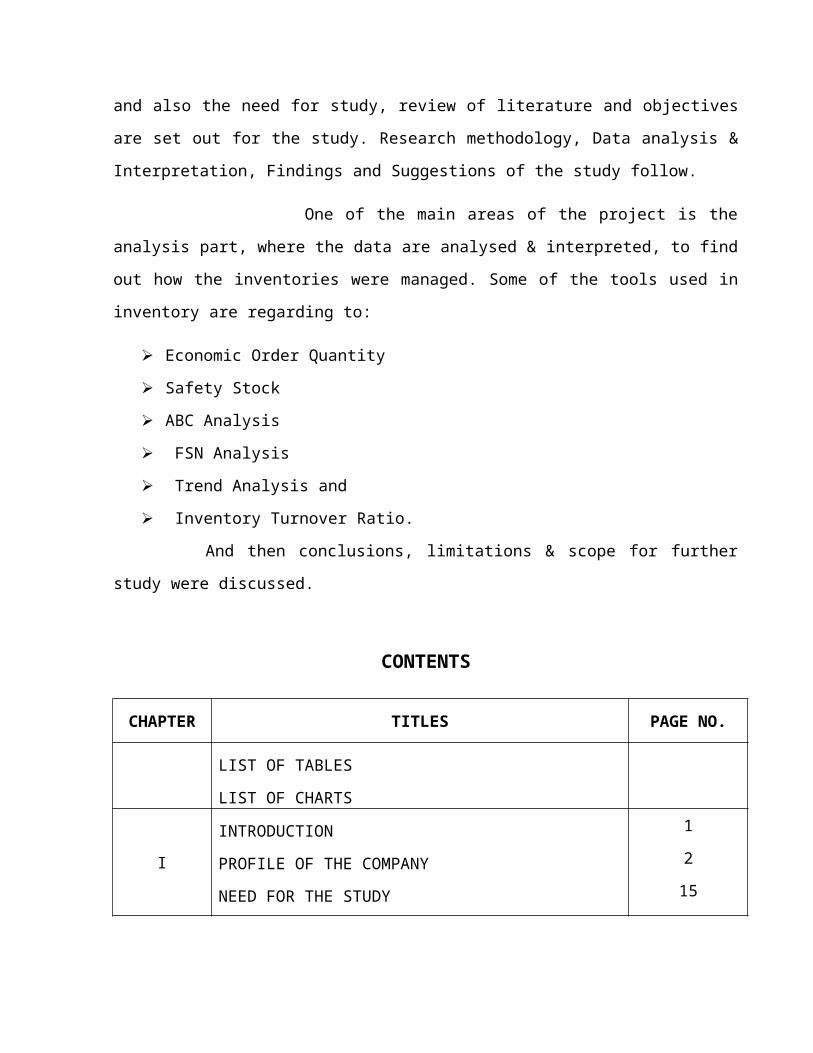
CONTENTS
CHAPTER TITLES PAGE NO.
LIST OF TABLES
LIST OF CHARTS
I
INTRODUCTION
PROFILE OF THE COMPANY
NEED FOR THE STUDY
1
2
15
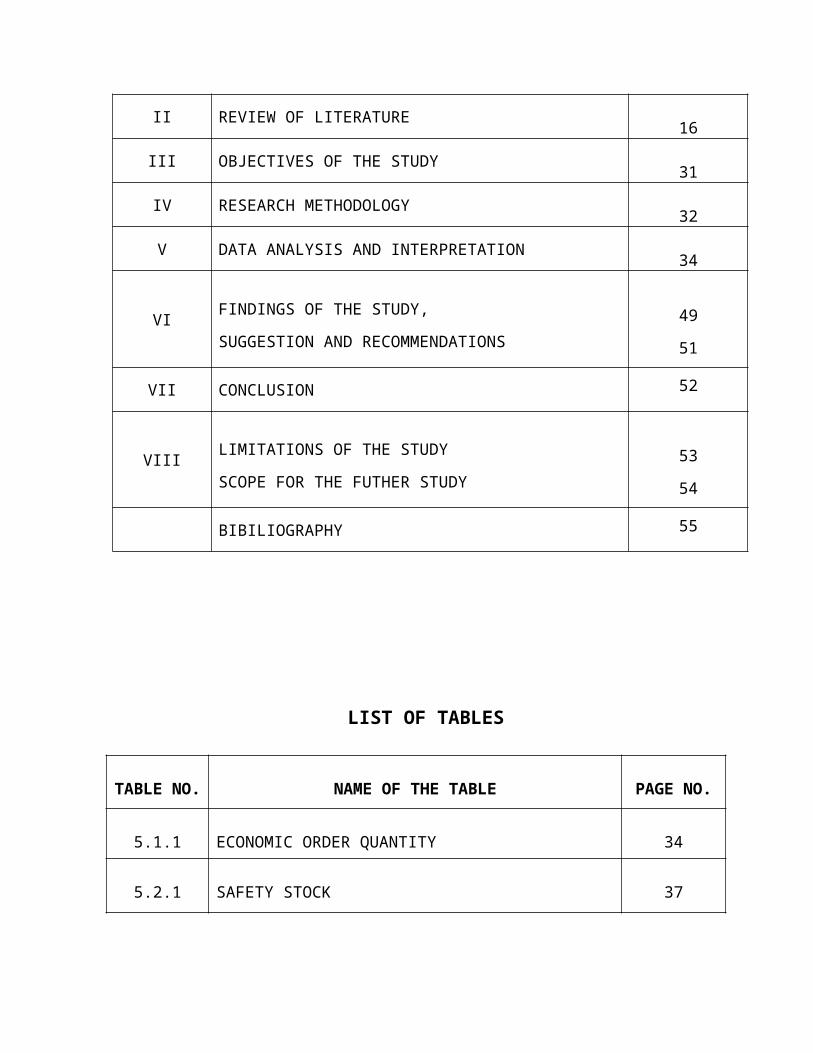
II REVIEW OF LITERATURE 16
III OBJECTIVES OF THE STUDY 31
IV RESEARCH METHODOLOGY 32
V DATA ANALYSIS AND INTERPRETATION 34
VIFINDINGS OF THE STUDY,
SUGGESTION AND RECOMMENDATIONS
49
51
VII CONCLUSION 52
VIIILIMITATIONS OF THE STUDY
SCOPE FOR THE FUTHER STUDY
53
54
BIBILIOGRAPHY 55
LIST OF TABLES
TABLE NO. NAME OF THE TABLE PAGE NO.
5.1.1 ECONOMIC ORDER QUANTITY 34
5.2.1 SAFETY STOCK 37
5.3.1 ABC ANALYSIS 41
5.4.1 FSN ANALYSIS 44
5.5.1 CALCULATION OF INVENTORY TREND 45
5.5.2 INVENTORIES PERCENTAGE 46
5.6.1 INVENTORIES TURNOVER RATIO & VELOCITY 48
LIST OF CHARTS
CHART NO. NAME OF THE CHART PAGE NO.
5.3.1 ABC ANALYSIS 41
5.4.1 FSN ANALYSIS 44
5.5.2 TREND OF INVENTORY 47
CHAPTER-I
1.1 INTRODUCTION
Inventory control is vitally important to almost every type of business, whether product or
service oriented. Inventory control touches almost every facets if operations. A proper balance
must be struck to maintain proper inventory with the minimum financial impact on the customer.
Inventory control is the activities that maintain stock keeping items at desired levels. In
manufacturing since the focus is on physical product, inventory control focus on material control.
“Inventory” means physical stock of goods, which is kept in hands for smooth and
efficient running of future affairs of an organization at the minimum cost of funds blocked in
inventories. The fundamental reason for carrying inventory is that it is physically impossible and
economically impractical for each stock item to arrive exactly where it is needed, exactly when it
is needed.
Inventory management is the integrated functioning of an organization dealing with
supply of materials and allied activities in order to achieve the maximum co-ordination and
optimum expenditure on materials. Inventory control is the most important function of
inventory management and it forms the nerve center in any inventory management organization.
An Inventory Management System is an essential element in an organization. It is comprised of a
series of processes, which provide an assessment of the organization’s inventory.

1.2 PROFILE OF THE COMPANY
1.2.1 WHIRLPOOL CORPORATION
Whirlpool Corporation is the world’s leading manufacturer and marketer of major
home appliances. The company manufactures in 13 countries on 4 continents namely :-- Canada,
United States, Mexico, Argentina, Brazil, Slovakia, Germany, Sweden, France, Italy, South
Africa, China and India and markets products in more than 170 countries under major Brands (26
including Affiliates) names such as Whirlpool, Kitchen Aid, Roper, Estate, Bauknects, Ignis,
Laden, Inglis, Braotemp, Crolls, Acros and Consul. Whirlpool is also the principal supplier to
Searo, Roebuck and company of many major home appliances marketed under the Kenmore
brand names. Head quartered at Benton Harbour, Michigan, U.S.A, Whirlpool Corporation is the
world’s leading manufacturer and marketer of major home appliances. Washing Machines,
Dryer, Dish-washers, Refrigerators, Freezers, Cookers, Micro-wave Ovens, Room air-
conditioners, Small Kitchen Appliances, etc.,
Whirlpool of India Limited, a fully owned by Whirlpool Inc, US, ($12 billion), a leading
global consumer durable player. Whirlpool of India limited manufactures and markets
refrigerators and washing machines. The company has diversified its product range into Air
Conditioners and Microwave Ovens. The growth in the consumer durable industry has slowed
down due to lack of demand. The year 2000 has been a bad year for the industry as the overall
growth was flat. The refrigerators registered a flat growth; washing machines saw a negative
growth while the air conditioner segment performed well exhibiting a growth rate of 20%.
Whirlpool Corporation has a management system called WES (Worldwide Excellence System)
and a value to aged performance system called HPC (High Performance Culture), which drives,
are the actions and initiatives of unit.
1.2.2 WHIRLPOOL CORPORATION TODAY 1.2.2 WHIRLPOOL CORPORATION TODAY
BUILDING CUSTOMER LOYALTY WORLDWIDE
Whirlpool Corporation arrived in the new century and millennium as the world’s leading
manufacturer and marketer of major home appliances. Today, Whirlpool’s global platform
provides our operations with resources and capabilities no other manufacturer can match and with
brands that consumers trust.
To sustain the productivity savings that is being achieved by our operations, they have
embedded their Operational Excellence Process - based on Six-Sigma and lean manufacturing
skills and capabilities - within each of their worldwide manufacturing facilities. The company’s
global information technology organization provides Internet tools that cut the complexity and
costs of doing business for Whirlpool and its trade partners. Whirlpool’s unique global platform
allows the company to transfer key innovations and processes across regions and brands. Based
on the continuing success of the company’s global innovation process, which began in 1999,
Whirlpool has introduced unique product innovations to consumers worldwide.
Inspired by their bold innovations and designs, increasing numbers of customers around
the globe are trusting Whirlpool to make their lives easier. More than ever before, Whirlpool
Corporation employees and brands are connecting with customers in ways that will last a
lifetime.
IMPROVING FUNCTION AND PERFORMANCEIMPROVING FUNCTION AND PERFORMANCE
At Whirlpool Corporation, They take pride in the quality of appliances to market and
manufacture. They are committed to building products that consumers around the world can
depend on to meet their daily needs. Their commitment to quality begins in the concept stages
and continues throughout the lifetime of the appliance. They are constantly seeking out new and
unique ways to improve the function, performance and sustainability of our products. They want
our brands to be the brands customers trust in every home … everywhere.
1.2.3 (a) HISTORY OF WASHING MACHINE
Ancient peoples cleaned their clothes by pounding them on rocks or rubbing them with
abrasive sands and washing the dirt away in local streams. Evidence of ancient washing soap was
found at Sapo Hill in Rome, where the ashes containing the fat of sacrificial animals was used as
soap.
The earliest washing "machine" was the scrub board invented in 1797. American, James
King patented the first washing machine to use a drum in 1851, the drum made King's machine
resemble a modern machine, however it was still hand powered. In 1858, Hamilton Smith
patented the rotary washing machine. In 1874, William Blackstone of Indiana built a birthday
present for his wife. It was a machine, which removed and washed away dirt from clothes. The
first washing machines designed for use in the home. The Hurley Machine Company of Chicago,
Illinois introduced the first electric-powered washing machine (the Thor) in 1908. Alva J. Fisher
was the inventor. The machine was a drum type with a galvanized tub and an electric motor, for
which a patent was issued on Aug. 9, 1910.
The Whirlpool Corporation started in 1911 as the Upton Machine Co., founded in St.
Joseph, Michigan, to produce electric motor-driven wringer washers. US electric washing
machine sales increased after World War I, reaching 913,000 units in 1928. The main reason why
so many people bought the washing machine was because it saved people lots of time in domestic
tasks, and the result was that society's expectations for cleanliness went up.
In 1951, production of Europe's first automatic washing machines started. In 1978, the
first microchip-controlled automatic washing machines were produced. Washer design improved
markedly during the 1930s; the mechanism was now enclosed within a cabinet; more attention
was paid to electrical safety; spin dryers were introduced, to replace the dangerous power
wringers of the day.
Bendix introduced the first automatic washing machine in 1937, having applied for a
patent in the same year. General Electric introduced the first top loading automatic also in 1947.
This machine had many of the features that are incorporated into modern machines. A large
number of US manufacturers introduced competing automatic machines (mainly of the top
loading type in the late 1940’s early 1950s. Several manufacturers even produced semi-automatic
machines, where the user had to intervene at one or two points in the wash cycle.
In the UK, electric washing machines did not become popular until the 1950s. The early
electric washers were single tub, wringer-type machines, automatic washing machines being
extremely expensive. During the 1960s, twin tub machines briefly became very popular, helped
by the low price of the Rolls Razor washers. In the late 1990s, the British inventor James Dyson
launched a type of washing machine with two cylinders rotating in opposite directions; which, it
is claimed, reduces the wash time and produces cleaner results; however, this machine is not
currently in production.
1.2.3 (b) HISTORY OF WHIRLPOOL
1911 Louis Upton founded the Upton Machine in this year to produce motor-driven
wringer washers.
1916 First order of washers was sold to Sears, Roebuck & Co.
1929 Upton Machine Company merged with Nineteen Hundred Washer Company of New
York.
1948: First 'Whirlpool' brand automatic washer with dual distribution was introduced. It
included two product lines one each was distributed through Sears and Nineteen Hundred.
1957: The Company was rechristened as ' The Whirlpool Corporation.'
1958: the Company moved out of country for the first time and invested in Brazilian
appliance market through purchase of equity in Multibras S.A.
1968: The Elisha Gray II Research & Engineering Center was completed in Benton
Harbor. In the same year the company's revenues crossed the legendary $1 Billion mark
for the first time.
1978: Within a decade company doubled its feat of $1 Billion mark and reached the $2
billion revenue level.
1986: The 'Kitchen Aid' division of Hobart Corporation was purchased.
1987: Whirlpool tied-up with Sundaram Clayton Ltd. of India to form TVS Whirlpool
Ltd.
1989: This was a historic year since the revenues catapulted to heights of over $6 Billion
mark. Also, the joint venture with N.V.Philips of Netherlands called Whirlpool Europe
B.V. was formed to manufacture and market appliances in Europe.
1990: Company established joint venture with Matsushita Electric Company of Japan to
produce vacuum cleaners for the North American market.
1991: The Company introduced and committed globally to its Worldwide Excellence
System, which is a TQM program dedicated to exceeding customer expectations. The
vision to globalize 'Whirlpool Corp'. was realized in the same year.
1993: First time Whirlpool became the No.1 stand-alone brand in UK, Ireland,
Netherlands and Belgium
1995: Whirlpool Corp. acquired majority of stake in the TVS Whirlpool Ltd. The DC
manufacturing facility of Kelvinator India was also acquired.
1996: Whirlpool Washing Machines Ltd. and Kelvinator India Ltd. merged together to
form Whirlpool of India Ltd.
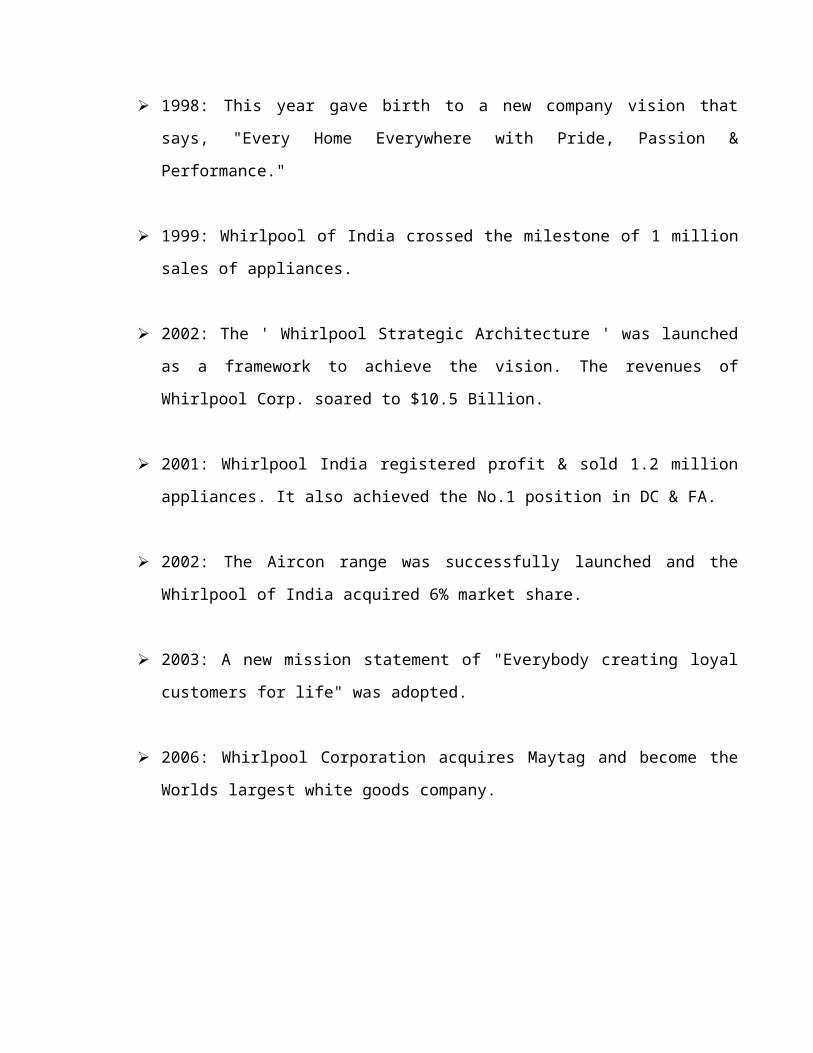
1998: This year gave birth to a new company vision that says, "Every Home Everywhere
with Pride, Passion & Performance."
1999: Whirlpool of India crossed the milestone of 1 million sales of appliances.
2002: The ' Whirlpool Strategic Architecture ' was launched as a framework to achieve
the vision. The revenues of Whirlpool Corp. soared to $10.5 Billion.
2001: Whirlpool India registered profit & sold 1.2 million appliances. It also achieved the
No.1 position in DC & FA.
2002: The Aircon range was successfully launched and the Whirlpool of India acquired
6% market share.
2003: A new mission statement of "Everybody creating loyal customers for life" was
adopted.
2006: Whirlpool Corporation acquires Maytag and become the Worlds largest white
goods company.
1.2.4 BOARD OF DIRECTORS
Dalton Nigel Garrick D‘Silva (Chairman)
Raj Jain (Managing Director)
Robert Lawrence Mink
SS Raman
K.V. Chandrasekaran
SJ Scarff
Anand Bhatia
1.2.5 (a) WHIRLPOOL VISION STATEMENT
Every Home… Everywhere. With Pride, Passion, Performance
Will create the world’s best home appliances, which makes Life easier and more enjoyable for all
people. Their goal is a Whirlpool product in every home, everywhere.
They will achieve this by creating: -
Pride in their work and each other
Passion for creating unmatched customer loyalty for their brands
Performance results that excite & reward global investors with superior returns
They will bring this dream to life through the power of unique global & their
Outstanding people… working together… everywhere.
1.2.5 (b) WHIRLPOOL MISSION STATEMENT
The mission of the corporate is that the demand of their selves so as to care their
customers and they will serve with pride in every home and bring prosperity to their investors
and customers. They are prepared to change the standards of their industry and be the Envy of
their competitors. They will be leaders in home appliances, which all others start to emulate.
1.2.6 CORE COMPETENCIES
Innovation: Unique and compelling solutions valued by our customers and aligned to our
brands create competitive advantage and differentiated shareholder value.
Operational Excellence (OPEX): A methodology for solving problems & continuous
improvement of products & processes through pursuit, acquisition, and utilization of
knowledge using critical thought and planned experimentation helps us achieve
operational excellence.
Customer Excellence: Excelling the customer expectation from the company, its brands,
products and services are a three-step process. The three steps are: Know a customer, Be a
customer, Serve a customer.
Knowing a customer helps us know who our customers are, how to treat them, how we
add value, and what the drivers of brand loyalty are. This information is gathered from the
customer's data base history. This way we are better able to customize products for them and
recommend the right product to solve problems. Being a customer is important to share customer
knowledge and insights, drive actions based on customer insights, be passionate about our brands
and customer loyalty and provide a positive voice for our brands. We show empathy for
customers and seek to resolve their problems by creating consistent customer touch-points, with
our endeavor always being to provide unique solutions for the customer.
1.2.7 PRODUCTION
MANUFACTURING FACILITIES IN INDIA
Whirlpool has invested heavily in its manufacturing facilities in India. While the factories
in Faridabad and Pondicherry have been upgraded to meet the exacting world class standard of
Whirlpool, the one under the construction at Ranjangaon, Pune will set the standards as one of
the world’s front runners in environmental sensitive and eco-friendly manufacturing units.
FARIDABAD
The refrigerator facilitated at Faridabad in Haryana manufactures direct cool.
Refrigerators ranging from 165 liters to 310 liters. Infusion of technology and up gradation of
machinery along with streamlining of processed has enhanced the plant capacity from 7,00,000
units to 8,50,000 units annually. Whirlpool’s focus at this plan in on manufacturing refrigerators
that are made to suit Indian conditions and requirements, while matching Whirlpool global
quality standard.
PUDUCHERRY
The washer’s facility at Puducherry on the East coast, manufacturers semi automatic and
automatic washers. Constant feedback from consumers has resulted in improved product quality
and styling, leading to an improved market share. This unit was awarded the coveted ISO 9001
certification in 1994 and ISO 14001 certification in 1996.
RANJANGAON
A state of art gallery for the manufacturers of the Global No Frost refrigerator at
Ranjangaon near Pune, this Rs. 300 crore plant built to exacting world-class standards, underlines
Whirlpool’s commitments to India. It has been designed in accordance with the ecological and
environmental criteria that have become such a concern in today’s scenario the world over.
1.2.8 WHIRLPOOL BRANDS
North American BrandsNorth American Brands
United States : Whirlpool, Kitchen Aid, Roper, Estate, Gladiator.
Canada : Whirlpool, Inglis, Kitchen Aid.
Mexico : Whirlpool, Acros, Supermatic, Scrolls.
Principal Products
Air Purifiers, Automatic Dryers, Automatic Washers, Built-in Ovens,
Dehumidifiers, Dishwashers, freezers, Hot Water Heaters, HVAC, Microwave Ovens, Ranges
(Gas and Electric, Freezers, Side-by-Side), Room Air Conditioners, Trash Compactors, washers.
Kitchen Aid Products
Blenders, Food Processors, Hand Mixers, Hot-water Dispensers, Stand Mixers, Toasters,
Coffee Makers, Juicers.
Primary Markets Served
United States, Canada and Mexico.
Principal Products
Built-in Ovens, Cookers (Gas and Electric, Freestanding, Built-in and Surface Units),
Dishwashers, Dryers, Freezers (Upright and Chest), Microwave Ovens, Refrigerators (Built-in,
Combis and Side-by-Side), Washers (Front and Top Loading).
Primary Markets Served
Europe, Middle East, Africa, Asia Pacific.
Principal Products
Freezers, Gas and Electric Ranges, Micro Ovens, Refrigerators, Room Air Conditioners,
Washers, Compressors.
1.2.9 WHIRLPOOL OF INDIA LIMITED – PUDUCHERRY
Whirlpool of India Limited is a fully owned company by Whirlpool Corporation, USA
Head quarters at Benton Harbor, Michigan USA. Whirlpool Corporation is the worlds leading
manufacturers and marketer of home appliances. Washing Machines, Dryers, Dish Washers,
Refrigerators, Freezers, Cookers, Microwave Ovens, Room Air Conditioners, Small kitchen
Appliances, etc.
Whirlpool of India limited, washer unit, Puducherry was the first manufacturing venture
of the Whirlpool Corporation, USA, the world’s largest manufacturer of home appliances. In
1987, this unit was formed as a joint venture with M/s Sundaram Clayton limited, a TVS group
companies and was named as TVS Whirlpool Limited. This unit is located on a 100 acre
sprawling area manufacturing automatic and semi automatic washing machine. This unit is
certified ISO 9001 facility by UL. It has also been cleared for “S” mark certification from
Japanese Quality standards for Exports to Japan after our facility approval.In WOIL, washer unit
has a total of 11 departments comprising of 220 employees on the whole. Out of which 67 is
management executives and rest 153 are production operators.
The various departments in the company are
Administration Department
Finance Department
Human Resource Department
Materials Department
Production Department
Medical Department
Stores Department
Plant Maintenance Department (PMD)
Regional Technology Center (RTC)
Process Engineering Development (PED)
Quality Assurance Department (QAD)
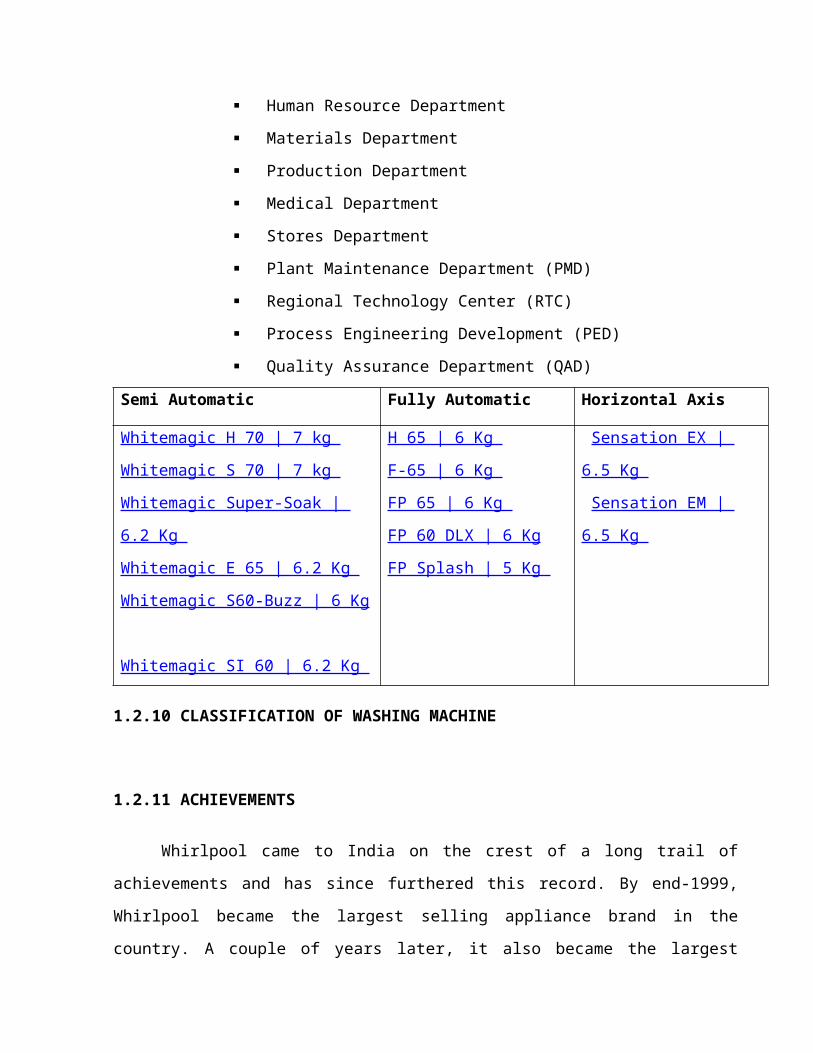
Semi Automatic Fully Automatic Horizontal Axis
Whitemagic H 70 | 7 kg
Whitemagic S 70 | 7 kg
Whitemagic Super-Soak | 6.2 Kg
Whitemagic E 65 | 6.2 Kg
Whitemagic S60-Buzz | 6 Kg
Whitemagic SI 60 | 6.2 Kg
H 65 | 6 Kg
F-65 | 6 Kg
FP 65 | 6 Kg
FP 60 DLX | 6 Kg
FP Splash | 5 Kg
Sensation EX | 6.5 Kg
Sensation EM | 6.5 Kg
1.2.10 CLASSIFICATION OF WASHING MACHINE
1.2.11 ACHIEVEMENTS
Whirlpool came to India on the crest of a long trail of achievements and has since
furthered this record. By end-1999, Whirlpool became the largest selling appliance brand in the
country. A couple of years later, it also became the largest exporter of home appliances from
India. In the course of this growth and development, Whirlpool has also achieved immense brand
equity in the Indian market. Whirlpool has successfully established new rules of marketing and
branding in the home-market sector. Its rivals have adopted the new practices, but the Whirlpool
brand stands out to the extent that authoritative surveys reported it to be the most preferred brand
in refrigerators and washing machines in 2003. (Millward Brown Brand Track).
Whirlpool of India exports to more than 50 high-value markets in Asia and other parts of
the world as well. Its products are customized to the local standards and different needs of each
of these markets. These qualities of Whirlpool are exemplified in its Indian sales as well. The
company has set up a highly equipped product development centre in Pune, which provides
global design services to three other Whirlpool research and development facilities based in
Brazil, Italy and the US. Indeed, the Indian operations of Whirlpool are a very important
contributor to its global vision of "Being in every home, everywhere". In washer products,
Whirlpool was again the first to come out with a Combimatic – a single tub semi-automatic
washing machine that did away with the hassle of shifting clothes from one tub to another.
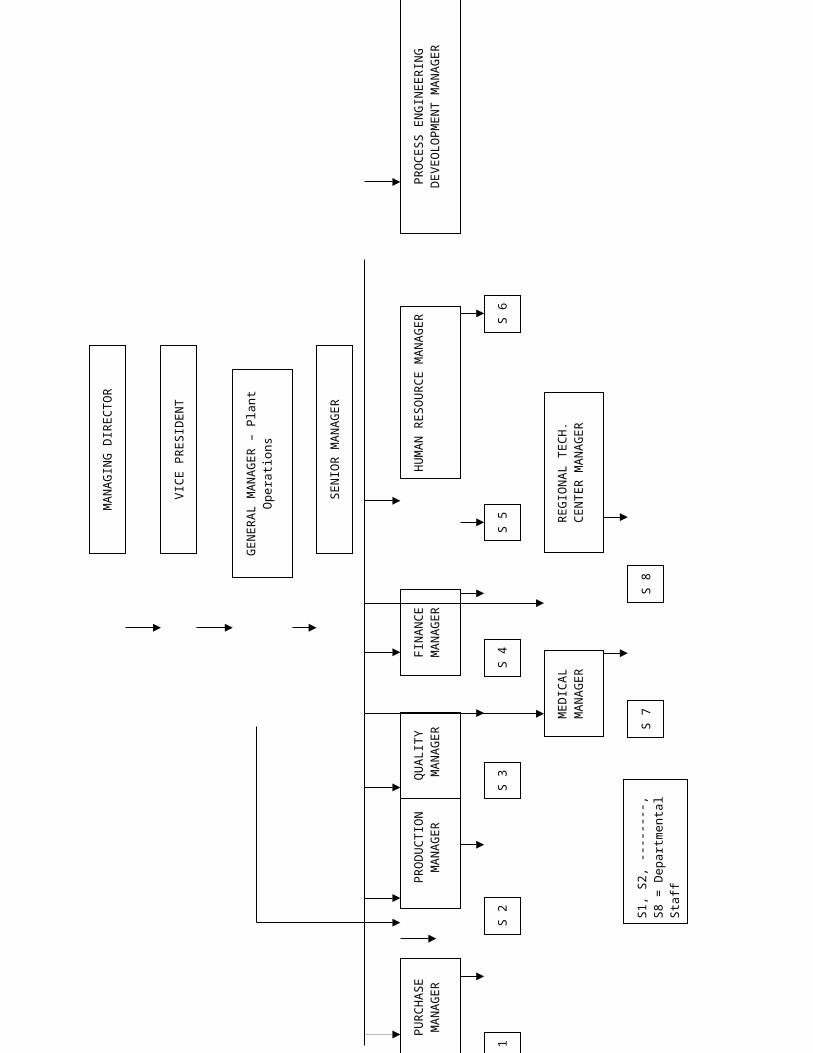
1.2.12 Company is shown by a flat Organization Structure as below:
S1,
S2,
---
----
-, S
8 =
D
epar
tmen
tal S
taff
PU
RC
HA
SE
M
AN
AG
ER
S 1
PR
OC
ES
S E
NG
INE
ER
ING
D
EV
EO
LO
PM
EN
T M
AN
AG
ER
S 6
S 5
MA
NA
GIN
G D
IRE
CT
OR
VIC
E P
RE
SID
EN
T
GE
NE
RA
L M
AN
AG
ER
– P
lant
O
pera
tion
s
SE
NIO
R M
AN
AG
ER
PR
OD
UC
TIO
N
MA
NA
GE
RQ
UA
LIT
Y M
AN
AG
ER
FIN
AN
CE
MA
NA
GE
RH
UM
AN
RE
SO
UR
CE
M
AN
AG
ER
ME
DIC
AL
MA
NA
GE
RR
EG
ION
AL
TE
CH
.C
EN
TE
R M
AN
AG
ER
S 2
S 3
S 4
S 7
S 8
1.3 NEED FOR THE STUDY
Every organization needs inventory for smooth running of its activities. It serves as a link
between production and distribution processes. The investment in inventories constitutes the most
significant part of current assets/working capital in most of the undertakings. Thus, it is very
essential to have proper control and management of inventories. The purpose of inventory
management is to ensure availability of materials in sufficient quantity as and when required and
also to minimise investment in inventories. So, in order to understand the nature of inventory
management of the organization, I took this Inventory Management as a topic for my project, to
give findings and suggestions by adopting and analyzing different inventory control techniques.

CHAPTER-II
REVIEW OF LITERATURE
2.1 MEANING OF INVENTORY
Inventory generally refers to the materials in stock. It is also called the idle resource of a
company. Inventories represent those items which are either stocked for sale or they are in the
process of manufacturing or they are in the form of materials which are yet to be utilized.
It also refers to the stockpile of the products a firm would sell in future in the normal
course of business operations and the components that make up the product.
Inventory is a detailed list of those movable items which are necessary to manufacture a
product and to maintain the equipment and machinery in good working order.
2.2 TYPES OF INVENTORIES
A manufacturing firm generally carries the following types of inventories:
Raw Materials.
Bought out parts.
Work-in-process inventory (WIP).
Finished goods inventories.
Maintenance, repair and operating stores.
Tools inventory.
Miscellaneous inventory.
Goods in transit.
Goods for resale.
Scrap Material.
2.3 REASONS FOR HOLDING INVENTORY
To stabilize production.
To take advantage of price discounts.
To meet the demand during the replenishment period.
To prevent loss of orders.
To keep pace with changing market conditions.
2.4 MOTIVES OF HOLDING INVENTORIES
The Transaction Motive which facilitates continuous production and timely execution of
sales orders.
The Precautionary Motive which necessities the holding of inventories for meeting the
unpredictable changes in demand and supplies of materials.
The Speculative Motive which induces to keep inventories for taking advantage of price
fluctuations, saving in re-ordering costs and quantity discounts etc.,.
2.5 COSTS ASSOCIATED WITH INVENTORY
Production cost.
Capital cost.
Ordering cost.
Carrying cost.
Shortage cost.
2.6 INVENTORY CONTROL
The main objective of inventory control is to achieve maximum efficiency in production
& sales with minimum investment in inventory.
Inventory control is a planned approach of determining what to order, when to order and
how much to order and how much to stock, so that costs associated with buying and storing are
optimal without interrupting production and sales.
2.7 BENEFITS OF INVENTORY CONTROL
The benefits of inventory control are:
Improvement in customers’ relationship because of the timely delivery of goods and
services.
Smooth and uninterrupted production and hence, no stock out.
Efficient utilization of working capital.
Economy in purchasing.
Eliminating the possibility of duplicate ordering.
2.8 PRINCIPLES OF INVENTORY CONTROL
Inventory is only created by spending money for materials and the labour and overhead to
process the materials.
Inventory is reduced through sales and scrapping.
Accurate sales & production schedule forecasts are essential for efficient purchasing,
handing & investment in inventory.
Management policies which are designed to effectively balance size and variety of
inventory with cost of carrying that inventory are the greatest factor in determining
inventory investment.
Forecasts help determine when to order materials. Controlling inventory is accomplished
through scheduling production.
Records do not produce control.
Control is comparative & relative, not absolute. It is exercised through people with
varying experiences and judgment rules & procedures establish a base from which the
individuals can make evaluation and decision.
With the consistent practices being followed, inventory control can become predictable
and properly related to production and sales activity.
2.9 INVENTORY CONTROL – TERMINOLOGY
Demand:
It is the number of items required per unit of time. The demand may be either
deterministic or probabilistic in nature.
Order cycle:
The time period between two successive orders is called order cycle.
Lead time:
The length of time between placing an order and receipts of items is called lead time.
Safety stock:
It is also called buffer stock or minimum stock. It is the stock or inventory needed to
account for delays in materials supply and to account for sudden increase in demand due to
rush orders.
Inventory turnover:
If the company maintains inventories equal to 3 months consumption. It
means that inventory turnover is 4 times a year i.e., the entire inventory is used up and
replaced 4 times a year.
2.10 INVENTORY COST RELATIONSHIPS
There are two major cost associated with inventory. Procurement cost and carrying cost.
Annual procurement cost varies with the numbers of orders. This implies that the procurement
cost will be high, if the item is procured frequently in small lots. The annual procurement cost is
directly proportional to the quantity in stock. The inventory carrying cost decreases, if the
quantity ordered per order is small. The two costs are diametrically opposite to each other. The
right quantity to be ordered is one that strikes a balance between the two opposition costs. This
quantity is referred to as “Economic Order Quantity”.
2.11 ECONOMIC ORDER QUANTITY
MEANING
A decision about how much to order has great significance in inventory management.
The quantity to be purchased should neither be small nor big because costs of buying and
carrying materials are very high. Economic order quantity is the size of the lot to be purchased
which is economically viable. This is the quantity of materials which can be purchased at
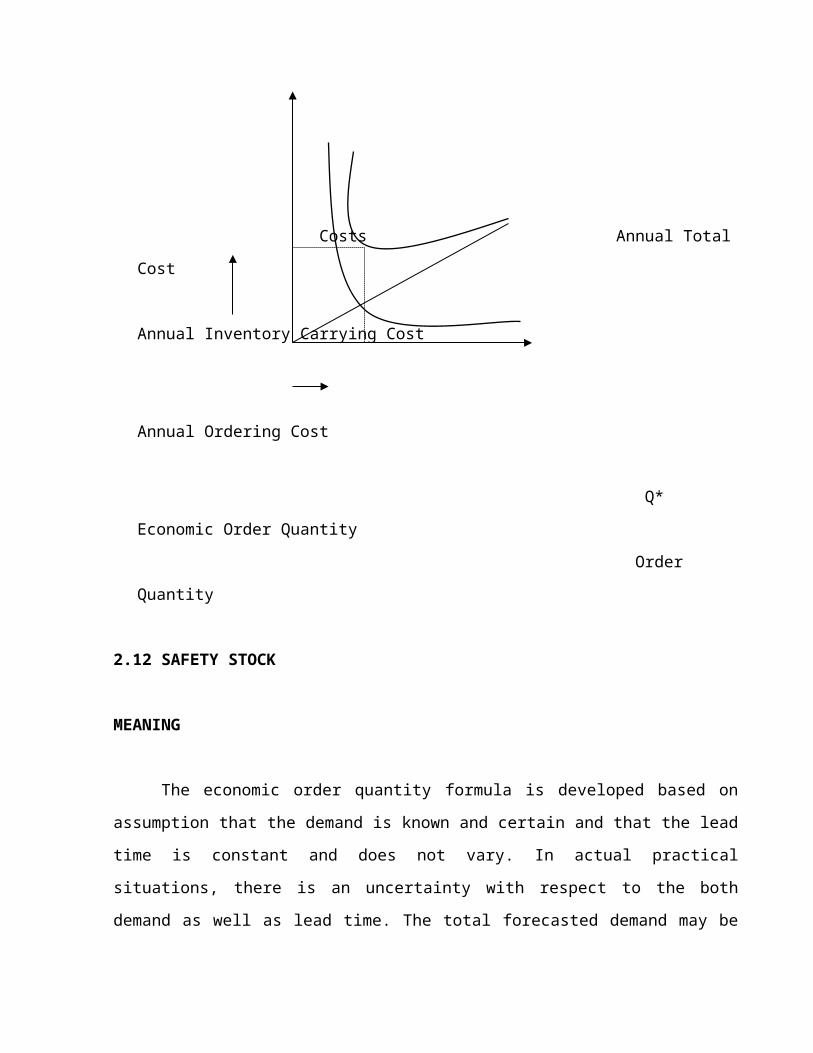
minimum costs. Generally economic order quantity is the point at which inventory carrying costs
are equal to order costs. In determining economic order quantity it is assumed that cost of
managing inventory is made up solely of two parts i.e., ordering cost and carrying cost. The cost
relationships are shown in below figure.
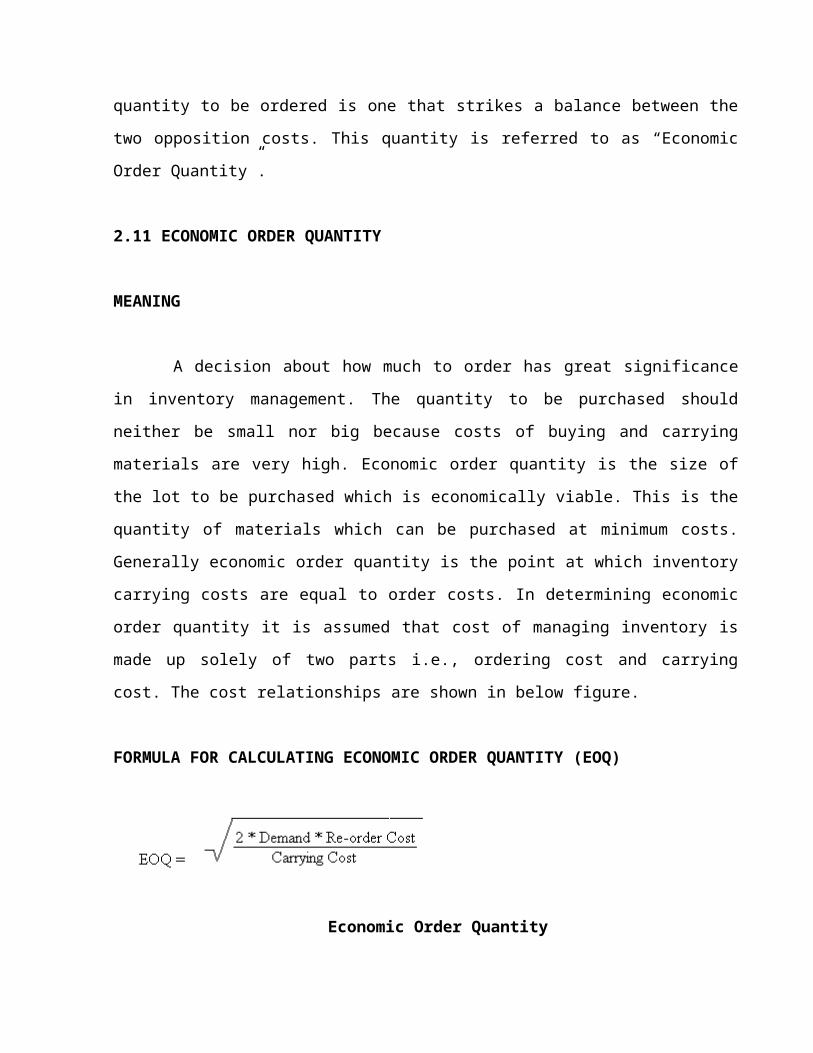
FORMULA FOR CALCULATING ECONOMIC ORDER QUANTITY (EOQ)
Economic Order Quantity
Costs Annual Total Cost
Annual Inventory Carrying Cost
Annual Ordering Cost
Q* Economic Order Quantity
Order Quantity
2.12 SAFETY STOCK
MEANING
The economic order quantity formula is developed based on assumption that the demand
is known and certain and that the lead time is constant and does not vary. In actual practical
situations, there is an uncertainty with respect to the both demand as well as lead time. The total
forecasted demand may be more or less than actual demand and the lead time may vary from
estimated time. In order to minimize the effect of uncertainty due to demand and the lead time, a
firm maintains safety stock, reserve stocks or buffer stocks.
The safety stock is defined as “the additional stock of material to be maintained in order
to meet the unanticipated increase in demand arising out of uncontrollable factors”.
In simple it is tells about which is used to protect against uncertainties.
Because it is difficult to predict the exact amount of safety stock to be maintained, by
using statistical methods and simulation, it is possible to determine the level of safety stock to be
maintained.
DETERMINATION OF SAFETY STOCK
If the level of safety stock is maintained is high, it locks up the capital and there is a
possibility of risk of obsolescence. On the other hand, if it is low, there is a risk of stock out
because of which there may be stoppage of production. When the variation in lead time is
predominant, the safety stock can be computed as:
Safety Stock = (Maximum Lead time- Normal Lead time) * Demand
SAFETY STOCK
The service level of inventory thus depends upon the level safety stocks. Large the
safety stocks, there is a lesser risk of stock out and, hence, higher service level. Sometimes higher
service levels are not desirable as they result in increase in costs, thus, fixing up a safety stock
level is critical. Using past date regarding the demand and lead time data, reliability of suppliers
and service level desired by management, safety stock can be determined with accuracy.
2.13 ABC ANALYSIS
MEANING
The inventory of an organization generally consists of thousands of items with varying
prices, usage rate and lead time. It is neither desirable nor possible to pay equal attention of all
items.
ABC analysis is a basic analytical tool which enables management to concentrate its
efforts where results will be greater. The concept applied to inventory is called as ABC analysis.
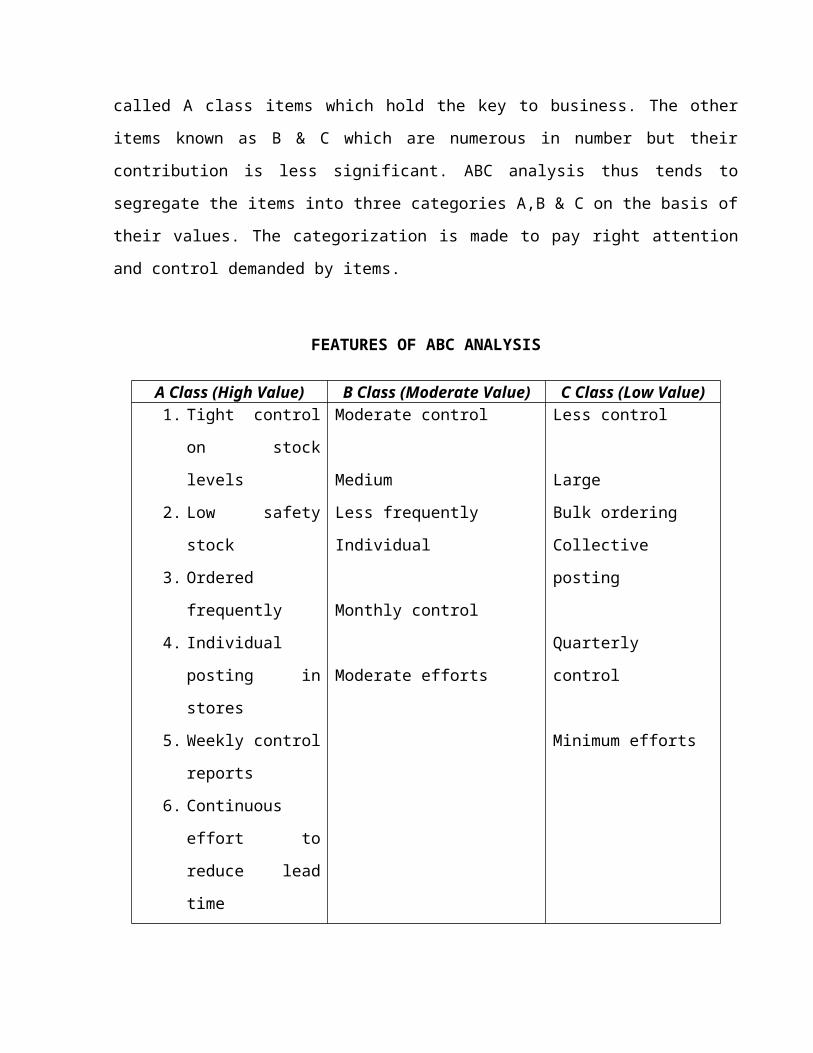
Statistics reveal that just a few items account for bulk of the annual consumption of the
materials. These few items are called A class items which hold the key to business. The other
items known as B & C which are numerous in number but their contribution is less significant.
ABC analysis thus tends to segregate the items into three categories A,B & C on the basis of their
values. The categorization is made to pay right attention and control demanded by items.
FEATURES OF ABC ANALYSIS
A Class (High Value) B Class (Moderate Value) C Class (Low Value)1. Tight control on
stock levels
2. Low safety stock
3. Ordered frequently
4. Individual posting in
stores
5. Weekly control
reports
Moderate control
Medium
Less frequently
Individual
Monthly control
Less control
Large
Bulk ordering
Collective posting
Quarterly control
6. Continuous effort to
reduce lead time
Moderate efforts Minimum efforts
ADVANTAGES
This approach helps the manager to exercise selective control & focus his attention only
on a few items.
By exercising strict control on A class items, the materials manager is able to show the
results within a short period of time.
It results in reducer clerical costs, saves time and effort and results in better planning and
control and increased inventory turnover.
ABC analysis, thus, tries to focus and direct the effort based on the merit of the items and,
thus, becomes an effective management control tool.
2.14 FSN ANALYSIS
All the items in the inventory are not required at the same frequency. Some are required
regularly, some occasionally and some very rarely. FSN analysis classifies items into fast
moving, slow moving, non moving items.
2.15 INVENTORY TURNOVER RATIO
Kohler defines inventory turnover as “a ratio which measures the number of times a
firm’s average inventory is sold during a year”.
A higher turnover rate indicates that the material in question is a fast moving one. A low
turnover rate, on the other hand, indicates over-investment and locking up of working capital on
undesirable items.
Inventory turnover ratio may be calculated in different ways by changing the numerator,
but keeping the same denominator. For instance, the numerator may be materials consumed, cost
of goods sold or net sales. Based on any one of these, the ratio differs from industry to industry.
Stock turnover is measured in terms of the ratio of the value of materials consumed to the
average inventory during the period. the ratio indicates the number of times the average inventory
is consumed and replenished. By diving no. of days in a yeat by turnover ratio, the number of
days for which the average inventory is held, can be ascertained.
Comparing the no. days in the case of two different materials, it is possible to know which
is fast moving & which is slow moving. On that basis, attempt may be made to reduce the
amount of capital locked up, and prevent over-stocking of slow moving items.
Net sales Inventory turnover ratio = Avg. inventory
No. of days in a year Inventory velocity = Inventory turnover ratio
2.16 A STUDY ON INVENTORY MANAGEMENT BY RAMYA
In this review Miss. RAMYA, who as done the project about Inventories at WOIL, it is
constitute the most significant part of the current assets of a large majority of companies in India.
Raw materials, goods in process and finished goods all represent various forms of inventory.
Each type represents money tied up until the inventory leaves the company as purchased
products. Because of the large size of the inventories maintained by firms, a considerable amount
of funds is required to be committed to them. It is therefore absolutely imperative to manage
inventories efficiently and effectively in order to avoid unnecessary investments. One of the most
critical and time-consuming aspects of manufacturing is managing the tasks of maintaining
sufficient amounts of materials on hand at all times. One of the main areas of the project is the
analysis part where the data obtained from the existing study is been utilized. For the analysis
part, ABC analysis was carried out. The norms were fixed for each of the inventory part taken
into account for the project. There by the inventory to be kept for the production of each model
was also arrived at.
2.17 A REPORT ON INVENTORY MANAGEMENT BY VIJAYARAMAN
In this review Mr. VIJAYARAMAN .R, who as done the project about A report Inventory
at WOIL, an Inventory Management System is an essential element in an organization. It is
comprised of a series of processes which provide an assessment of the organization’s inventory.
The Inventory Management System also aids the organization in achieving its goals and
objectives with the primary focus on adding value for the customers. The management of
inventory adds value for customers (quality, speed, flexibility, and cost), and this is the primary
consideration of the Operations Management System. Inventory management is possibly one of
the richest areas of operations management, with many tools and techniques available to help
managers run their processes as effectively as possible.
In this project he made an analysis for Export Oriented Units (EOU) and fixing norms for
Coffee Maker, Coffee Grinder, Grind Mill & Micro Oven. After finishing analysis he compares
between the Suggested norms and Existing norms. He also made an analysis of Washing Machine
and their norms for different classification of Washers at WOIL. Finally he used correlation with
Statistical Tools. He also classified EOU’s & Washers products with ABC Classification.
2.18 INVENTORY AS MANAGING INVENTORY BY WOLFE BAGBY
In this review Mr. WOLFE BAGBY explains inventory as Managing inventory to Meet
Profit Goals, Shortening the cash cycle, avoiding inventory shortage, Avoid excessive carrying
costs for unused inventory, Improving profitability by decreasing cash conversion, JIT.
Getting smart about inventory
When a manufacturing firm works to gain greater control over management of its
inventory, it helps to know what this means for a company. For starters, maximizing a
manufacturer’s cash flow and profitability includes keeping a watchful, discerning eye on
changes in supply and demand, which means simultaneously scrutinizing external factors
that might affect supply and demand.
Shortening the cash conversion cycle
Much of this can be accomplished when manufacturers update their scheduling
systems. The Web-based nature of an inventory management system allows Electronic
data interchange of projected demand and vendor requirements are transmitted throughout
the distribution network. This, in turn, keeps the networks, production and deliveries in
near real-time synchronization with the latest network inventory, forecast and actual
demand information. Another way to shorten the cash conversion cycle is to have clear
channels of communication with vendors. Still, advanced inventory management software
is nothing without a strong internal supply chain, especially when loyal employees who
want to work on behalf of the company’s goals support it.
Avoiding inventory shortage
Most manufacturers recognize that supplier inventories are important. Even
though more stock means higher total costs, the alternative is often too little stock which
tends to put the brakes on operations. This means negative impact in more ways than one.
One obvious way to take precautions for avoiding inventory shortage is by using more
than one vendor in particular areas of the supply chain.
Avoid excessive carrying costs for unused inventory
Most companies need to reduce inventory in whatever way seems most
reasonable, considering the variables faced by the manufacturer. This isn’t to say that
manufacturing firms will be eliminating warehousing anytime soon. But, it is important to
note that drastic reductions in inventory costs are available to most any company that
wants better control. Much of this effort deals with building collaborative relationships
with suppliers to the point where most inventory-related matters can be worked out.
Consignment inventory is another way to save inventory costs. Give someone else the
responsibility for moving inventory so it doesn’t cost the manufacturer as much to hold
onto it
Improving profitability by decreasing cash conversion
Boosting financial performance is another benefit that comes from better
inventory management. In fact, a large number of manufacturers enjoy significant savings
and better performance by choosing the approach to inventory reduction that works best
for them. One vital measurement for determining how effectively a manufacturer’s
inventory management system is operating is referred to as inventory turnover.
Essentially, it measures how efficiently inventory moves through the organization. In fact,
manufacturing executives are told never to underestimate the importance of inventory
turns. Gaining better control over accounts receivables policies is another popularly
reported approach for using inventory to improve profitability. Depending upon the nature
of business, early or on-time payment discounts can be the incentive for moving inventory
faster.
JIT
For years, American manufacturers have strived for improved inventory
management systems. The closer they get to carry zero inventories, the closer they get to
reach the manufacturing efficiency. Such thinking, combined with today’s available
technology, has brought inventory management systems to a new level. Manufacturers
can now meet their customers’ demand without incurring the costs and burdens that come
from stocking excess inventory. Features such as effective forecasting, vendor
management and data management control make it possible for manufacturers to achieve
a much higher rate of efficiency. These features enable manufacturers to seek to manage
inventory as a financial investment, as well as a method for putting more money in their
pockets.
2.19 A STUDY ON INVENTORY MANAGEMENT BY CHARLES ATKINSON
In this review Mr. CHARLES ATKINSON explains inventory as inventory management
topics, he explains average inventory levels, in this topic he explained about two parts. The first
half part of this article covers how to find what inventory levels should be, and the second half
covers how to evaluate it..
Average Inventory Levels
Part I: How to Optimize Average Inventory Levels?
In this part, it provides a brief description for how optimal inventory levels for materials
are kept. Essentially, this section can serve as a starting point for inventory managers. The First
thing he determines the ideal inventory levels is a material's Economic Order Quantity (EOQ).
This is the amount one should be ordering when you place orders.
Next he determines Safety Stock (SS). This is the amount that you should have remaining
when the EOQ arrives. This should be intuitive because safety is what you have when your
shipment arrives and when the order arrives (EOQ) it gets added to the safety stock.
It is clear that average minimum and maximum level because you might not receive the
EOQ exactly when you planned to and therefore may have more or less. On average you should
have the SS amount when you receive shipments. Between these two average minimum and
maximum values lies your long-term average inventory.
Part II: How to Assess (evaluate) Inventory Levels?
Average Inventory can be calculated by Simplistic Method.
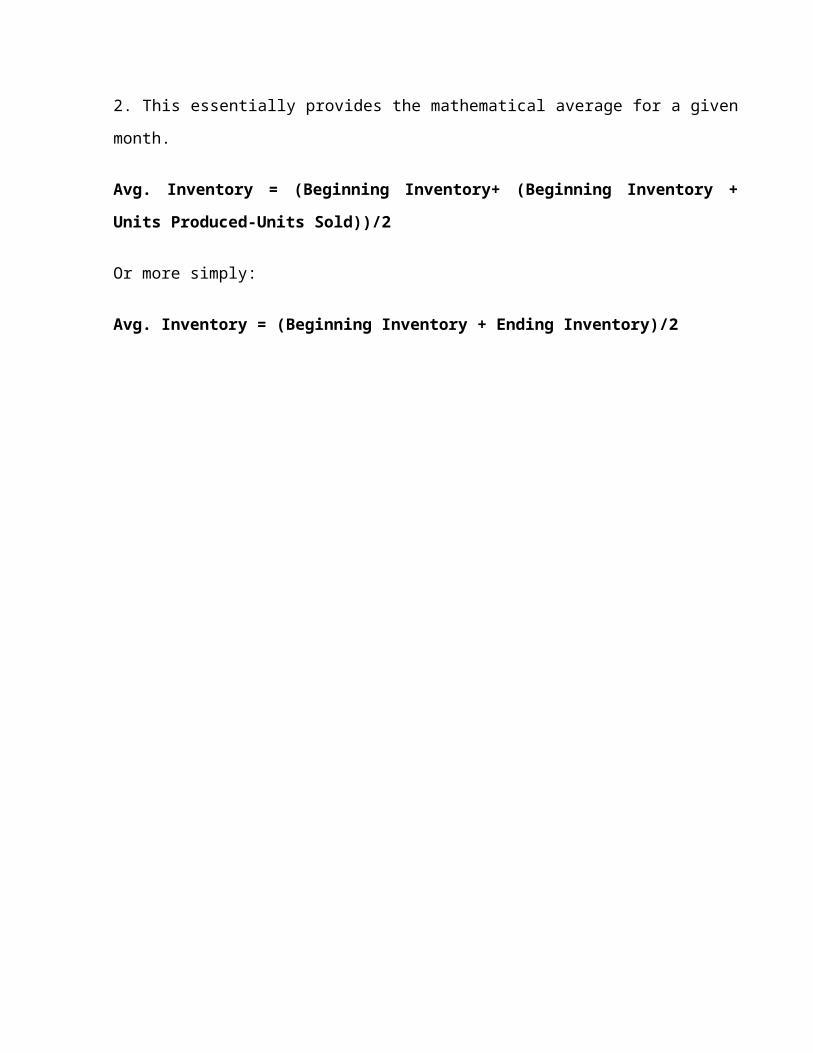
Most methods of accounting take the beginning inventory of a period, add it to the ending
inventory of a period, and divide by 2. This essentially provides the mathematical average for a
given month.
Avg. Inventory = (Beginning Inventory+ (Beginning Inventory + Units Produced-Units
Sold))/2
Or more simply:
Avg. Inventory = (Beginning Inventory + Ending Inventory)/2
CHAPTER-III
OBJECTIVES OF THE STUDY
PRIMARY OBJECTIVE
To analyse the efficiency of Inventory Management of Whirlpool of India Ltd.
SECONDARY OBJECTIVE
To identify optimum level of inventory which minimizes the cost.
To identify the safety stock level for various components.
To classify the various components based on its value and movements.
To identify inventory requirement of the company for the next year.
CHAPTER-IV
RESEARCH METHODOLOGY
4.1 RESEARCH
Research is a process in which the researcher wish to find out the end result for a given
problem and thus the solution helps in future course of action. The research has been defined as
“A careful investigation or enquiry especially through search for new facts in branch of
knowledge”
4.2 RESEARCH DESIGN
The research design used in this project is Analytical in nature the procedure using, which
researcher has to use facts or information already available, and analyze these to make a critical
evaluation of the performance.
4.3 DATA COLLECTION
Primary Sources
1. Data are collected through personal interviews and discussion with Finance-
Executive.
2. Data are collected through personal interviews and discussion with Material
Planning- Deputy Manager.
Secondary Sources
1. The data are collected from the annual reports maintained by the company for the
past six years viz., 2002-2007
2. Data are collected from the company’s website.
3. Books and journals pertaining to the topic.

4.4 TOOLS USED IN THE ANALYSIS
Economic Order Quantity.
Safety Stock.
ABC Analysis.
FSN Analysis.
Linear Regression method.
Inventory turnover ratios.
4.5 PERIOD OF STUDY
The period of the study at Whirlpool of India Limited, Puducherry is for one month.
CHAPTER-V
DATA ANALYSIS AND INTERPRETATION
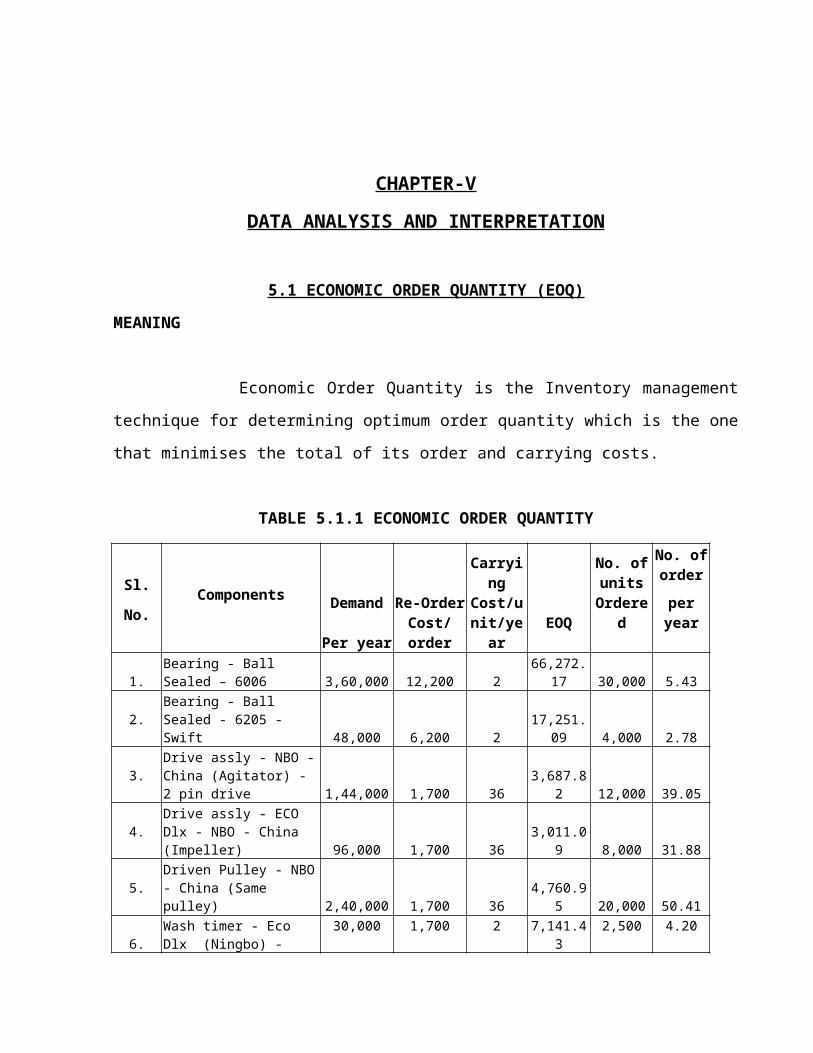
5.1 ECONOMIC ORDER QUANTITY (EOQ)
MEANING
Economic Order Quantity is the Inventory management technique for determining
optimum order quantity which is the one that minimises the total of its order and carrying costs.
TABLE 5.1.1 ECONOMIC ORDER QUANTITY
Sl. No. Components Demand
Per year
Re-Order Cost/ order
Carrying Cost/unit
/yearEOQ
No. of units
Ordered
No. of order
per year
1.Bearing - Ball Sealed – 6006 3,60,000 12,200 2 66,272.17 30,000 5.43
2.Bearing - Ball Sealed - 6205 - Swift 48,000 6,200 2 17,251.09 4,000 2.78
3.Drive assly - NBO - China (Agitator) - 2 pin drive 1,44,000 1,700 36 3,687.82 12,000 39.05
4.Drive assly - ECO Dlx - NBO - China (Impeller) 96,000 1,700 36 3,011.09 8,000 31.88
5.Driven Pulley - NBO - China (Same pulley) 2,40,000 1,700 36 4,760.95 20,000 50.41
6.Wash timer - Eco Dlx (Ningbo) - With buzzer (S60) 30,000 1,700 2 7,141.43 2,500 4.20
7.Wash timer - Eco Dlx (Ningbo) - Without buzzer (SI 60) 42,000 1,700 2 8,449.85 3,500 4.97
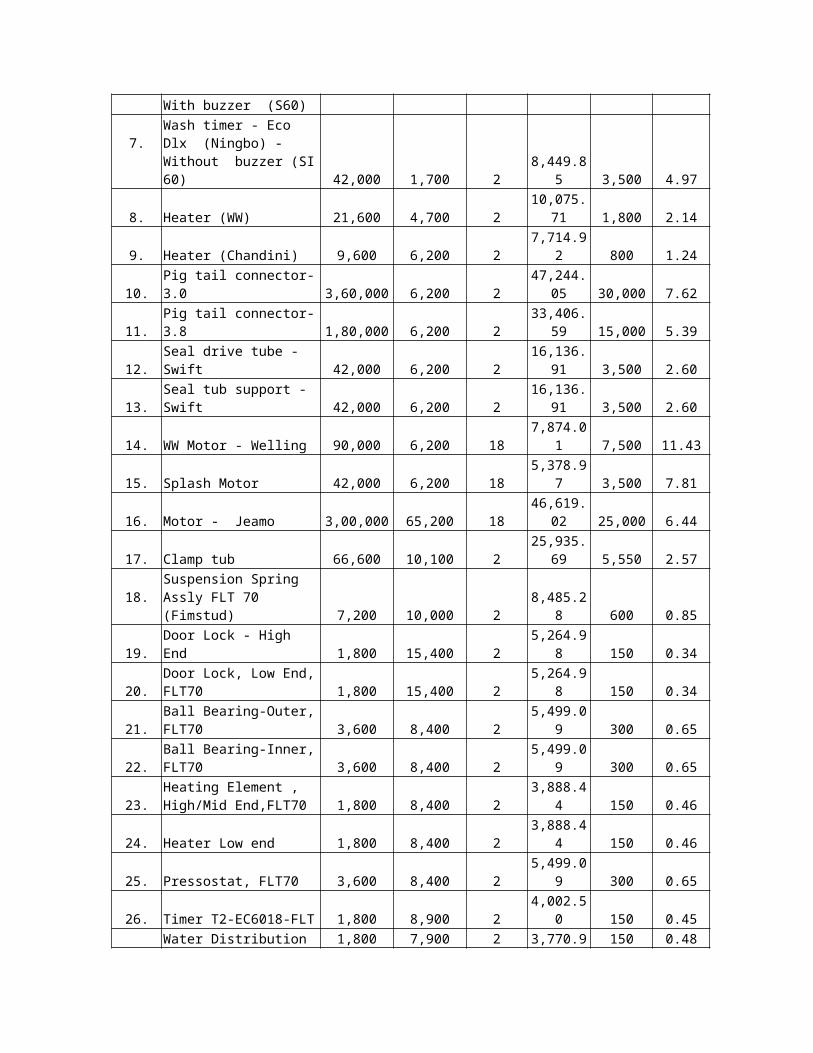
8. Heater (WW) 21,600 4,700 2 10,075.71 1,800 2.14
9. Heater (Chandini) 9,600 6,200 2 7,714.92 800 1.24
10. Pig tail connector-3.0 3,60,000 6,200 2 47,244.05 30,000 7.62
11. Pig tail connector-3.8 1,80,000 6,200 2 33,406.59 15,000 5.39
12. Seal drive tube - Swift 42,000 6,200 2 16,136.91 3,500 2.60
13. Seal tub support - Swift 42,000 6,200 2 16,136.91 3,500 2.60
14. WW Motor - Welling 90,000 6,200 18 7,874.01 7,500 11.43
15. Splash Motor 42,000 6,200 18 5,378.97 3,500 7.81
16. Motor - Jeamo 3,00,000 65,200 18 46,619.02 25,000 6.44
17. Clamp tub 66,600 10,100 2 25,935.69 5,550 2.57
18.Suspension Spring Assly FLT 70 (Fimstud) 7,200 10,000 2 8,485.28 600 0.85
19. Door Lock - High End 1,800 15,400 2 5,264.98 150 0.34
20.Door Lock, Low End, FLT70 1,800 15,400 2 5,264.98 150 0.34
21. Ball Bearing-Outer, FLT70 3,600 8,400 2 5,499.09 300 0.65
22. Ball Bearing-Inner, FLT70 3,600 8,400 2 5,499.09 300 0.65
23.Heating Element , High/Mid End,FLT70 1,800 8,400 2 3,888.44 150 0.46
24. Heater Low end 1,800 8,400 2 3,888.44 150 0.46
25. Pressostat, FLT70 3,600 8,400 2 5,499.09 300 0.65
26. Timer T2-EC6018-FLT 1,800 8,900 2 4,002.50 150 0.45
27.Water Distribution Actuator, FLT70 1,800 7,900 2 3,770.94 150 0.48
28. Nut Push In, FLT70 21,600 16,400 2 18,821.26 1,800 1.15
29. Heater Clip,FLT70 3,600 7,750 2 5,282.05 300 0.68
30. Bellow, FLT70 3,600 84,300 2 17,420.68 300 0.21
31.Shock Absorber Assy, FLT70 7,200 9,800 2 8,400.00 600 0.86
32.Universal Motor Assy, Mid&High End,FLT70 1,800 49,200 18 3,136.88 150 0.57
33. Motor Low end 1,800 57,200 18 3,382.31 150 0.53
34. Window Glass,FLT70 3,600 23,100 18 3,039.74 300 1.18
35. Drain Pump, FLT 1,800 20,100 2 6,014.98 150 0.30
36.On / Off Switch Low end (Push button switch) 1,800 7,700 2 3,722.90 150 0.48
37.Thermostat Variable, Low End, FLT70 1,800 8,500 2 3,911.52 150 0.46
38. Poly V Belt,FLT70 1,800 1,700 2 1,749.29 150 1.03
39. Tub Sealing, FLT70 3,600 1,700 2 2,473.86 300 1.46
40. SS Coil 2,40,000 52,200 18 37,309.52 20,000 6.43
ANALYSIS & INTERPRETATION :
In the above table the EOQ & the no. of orders purchased per year for various
components are calculated. The calculated EOQ is compared with the no. of units of each
component purchased in the organization. It is found that, there is a variation in the EOQ & no. of
unit purchased. It is understood that the company is not following EOQ for purchasing the
materials & therefore the inventory management is not satisfactory.
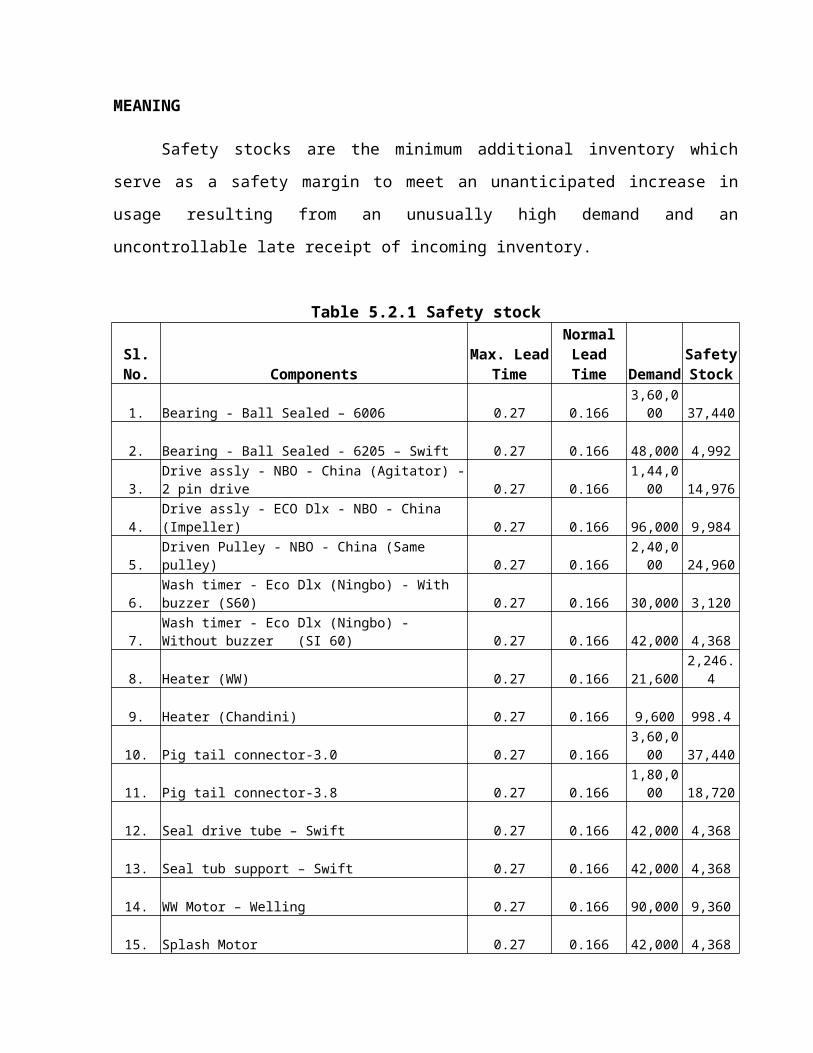
5.2 SAFETY STOCK
MEANING
Safety stocks are the minimum additional inventory which serve as a safety margin to
meet an unanticipated increase in usage resulting from an unusually high demand and an
uncontrollable late receipt of incoming inventory.
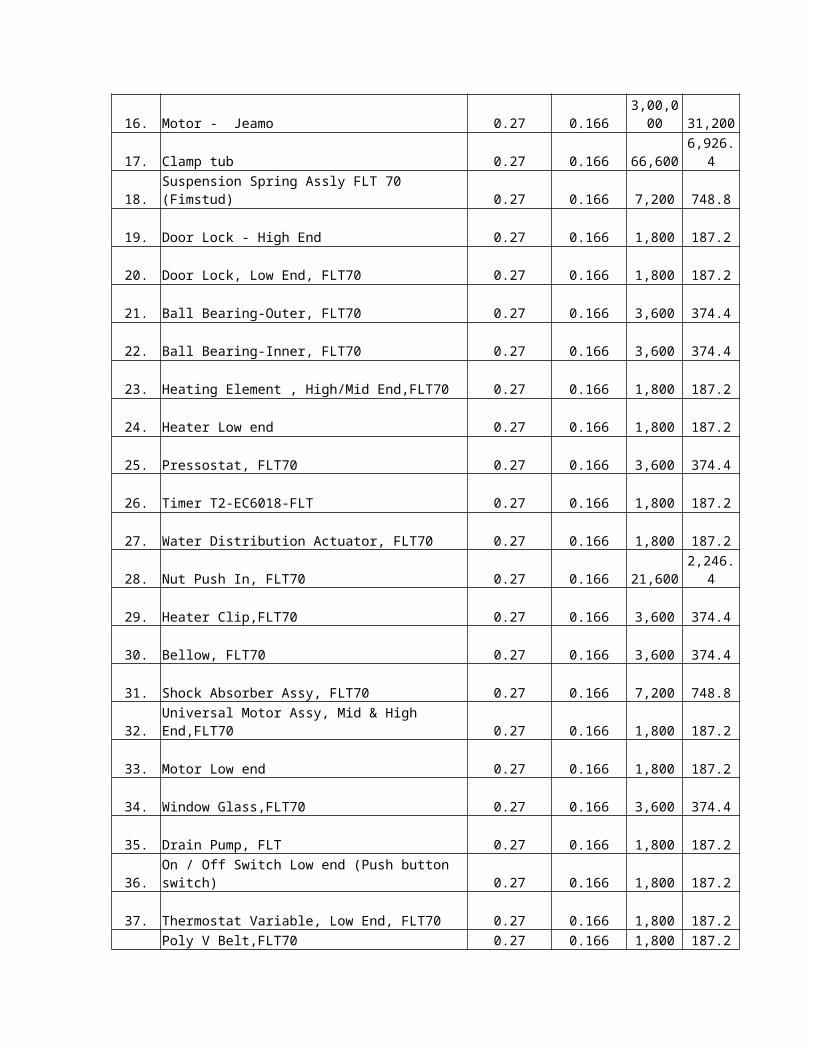
Table 5.2.1 Safety stock
Sl. No. ComponentsMax. Lead
TimeNormal
Lead Time DemandSafety Stock
1. Bearing - Ball Sealed – 6006 0.27 0.166 3,60,000 37,440
2. Bearing - Ball Sealed - 6205 – Swift 0.27 0.166 48,000 4,992
3. Drive assly - NBO - China (Agitator) - 2 pin drive 0.27 0.166 1,44,000 14,976
4. Drive assly - ECO Dlx - NBO - China (Impeller) 0.27 0.166 96,000 9,984
5. Driven Pulley - NBO - China (Same pulley) 0.27 0.166 2,40,000 24,960
6. Wash timer - Eco Dlx (Ningbo) - With buzzer (S60) 0.27 0.166 30,000 3,120
7.Wash timer - Eco Dlx (Ningbo) - Without buzzer (SI 60) 0.27 0.166 42,000 4,368
8. Heater (WW) 0.27 0.166 21,600 2,246.4
9. Heater (Chandini) 0.27 0.166 9,600 998.4
10. Pig tail connector-3.0 0.27 0.166 3,60,000 37,440
11. Pig tail connector-3.8 0.27 0.166 1,80,000 18,720
12. Seal drive tube – Swift 0.27 0.166 42,000 4,368
13. Seal tub support – Swift 0.27 0.166 42,000 4,368
14. WW Motor – Welling 0.27 0.166 90,000 9,360
15. Splash Motor 0.27 0.166 42,000 4,368
16. Motor - Jeamo 0.27 0.166 3,00,000 31,200
17. Clamp tub 0.27 0.166 66,600 6,926.4
18. Suspension Spring Assly FLT 70 (Fimstud) 0.27 0.166 7,200 748.8
19. Door Lock - High End 0.27 0.166 1,800 187.2
20. Door Lock, Low End, FLT70 0.27 0.166 1,800 187.2
21. Ball Bearing-Outer, FLT70 0.27 0.166 3,600 374.4
22. Ball Bearing-Inner, FLT70 0.27 0.166 3,600 374.4
23. Heating Element , High/Mid End,FLT70 0.27 0.166 1,800 187.2
24. Heater Low end 0.27 0.166 1,800 187.2
25. Pressostat, FLT70 0.27 0.166 3,600 374.4
26. Timer T2-EC6018-FLT 0.27 0.166 1,800 187.2
27. Water Distribution Actuator, FLT70 0.27 0.166 1,800 187.2
28. Nut Push In, FLT70 0.27 0.166 21,600 2,246.4
29. Heater Clip,FLT70 0.27 0.166 3,600 374.4
30. Bellow, FLT70 0.27 0.166 3,600 374.4
31. Shock Absorber Assy, FLT70 0.27 0.166 7,200 748.8
32. Universal Motor Assy, Mid & High End,FLT70 0.27 0.166 1,800 187.2
33. Motor Low end 0.27 0.166 1,800 187.2
34. Window Glass,FLT70 0.27 0.166 3,600 374.4
35. Drain Pump, FLT 0.27 0.166 1,800 187.2
36. On / Off Switch Low end (Push button switch) 0.27 0.166 1,800 187.2
37. Thermostat Variable, Low End, FLT70 0.27 0.166 1,800 187.2
38. Poly V Belt,FLT70 0.27 0.166 1,800 187.2
39. Tub Sealing, FLT70 0.27 0.166 3,600 374.4
40. SS Coil 0.27 0.166 2,40,000 24,960
ANALYSIS & INTERPRETATION :
In the above table, safety stock for the various components calculated are shown. Actual
demand is given for each component for a period of 1 year and the lead-time is calculated at a
maximum of 100 days & normal of 60 days and these were converted into per annum. So, from
calculation of safety stock, we can able to determine how much the company can hold the
inventory in reserve stock per annum.
5.3 ABC ANALYSIS
MEANING
The ABC system is a widely used classification technique to identify various items of
inventory for purposes of inventory control. On the basis of unit cost involved, the various items
are classified into 3 categories:
(1) A, consisting of items with the large investment,
(2) C, with relatively small investments but fairly large number of items and
(3) B, which stands mid-way between category A & C.
Category A needs the most rigorous control, C requires minimum attention and B deserves less
attention than A but more than C.
A Class (High Value) Drive assly - NBO - China (Agitator) - 2 pin drive
Drive assly - ECO Dlx - NBO - China (Impeller)
Wash timer - Eco Dlx (Ningbo) - With buzzer (S60)
Heater (WW)
Heater (Chandini)
WW Motor - Welling
Splash Motor
Motor - Jeamo
Heating Element, High/Mid End,FLT70
Heater Low end
Timer T2-EC6018-FLT
Water Distribution Actuator, FLT70
Bellow, FLT70
Thermostat Variable, Low End, FLT70
Universal Motor Assy, Mid & High End,FLT70
Motor Low end
Window Glass,FLT70
Drain Pump, FLT
B Class (Moderate Value)
Bearing - Ball Sealed - 6006
Bearing - Ball Sealed - 6205 - Swift
Wash timer - Eco Dlx (Ningbo) - Without buzzer (SI 60)
Door Lock - High End
Door Lock, Low End, FLT70
Ball Bearing-Outer, FLT70
Ball Bearing-Inner, FLT70
Seal drive tube - Swift
Seal tub support - Swift
Pressostat, FLT70
Shock Absorber Assy, FLT70
On / Off Switch Low end (Push button switch)
SS Coil
Poly V Belt,FLT70
C Class (Low Value)
Driven Pulley - NBO - China (Same pulley)
Pig tail connector-3.0
Pig tail connector-3.8
Clamp tub
Suspension Spring Assly FLT 70 (Fimstud)
Nut Push In, FLT70
Heater Clip,FLT70
Tub Sealing, FLT70
Table 5.3.1 ABC ANALYSIS
Categories Total No. Items in Classes Percentage
A 18 45
B 14 35
C 8 20
Total 40 100
ANALYSIS & INTERPRETATION :
The above table shows the classification of various components as A, B & C classes using
ABC analysis techniques based on unit value. From the classification A classes are those whose
unit value is more than Rs.100 and constitutes 45% of total components. B classes are those
whose unit value is between Rs.25-100 constitutes 35% of total components and C classes are
those whose unit value is less than Rs.25 constitutes 30% of total components. It is good that the
company maintains its inventories based on its value using controlling techniques.
Chart 5.3.1 ABC Analysis
5.4 FSN ANALYSIS
MEANING
All the items in the inventory are not required at the same frequency. Some are required
regularly, some occasionally and some very rarely.
FSN classifies items into Fast moving, Slow moving and Non-moving.
FAST MOVING ITEMS Bearing - Ball Sealed - 6006
Bearing - Ball Sealed - 6205 - Swift
Drive assly - NBO - China ( Agitator ) - 2 pin drive
Drive assly - ECO Dlx - NBO - China ( Impeller )
Driven Pulley - NBO - China ( Same pulley )
Wash timer - Eco Dlx ( Ningbo ) - With buzzer ( S60 )
Wash timer - Eco Dlx ( Ningbo ) - Without buzzer ( SI 60 )
Heater ( WW )
Heater ( Chandini )
Pig tail connector-3.0
Pig tail connector-3.8
Seal drive tube - Swift
Seal tub support - Swift
WW Motor - Welling
Splash Motor
Motor - Jeamo
SS Coil
SLOW MOVING ITEMS
Clamp tub
Suspension Spring Assly FLT 70 ( Fimstud)
Door Lock - High End
Door Lock, Low End, FLT70
Ball Bearing-Outer, FLT70
Ball Bearing-Inner, FLT70
Heating Element , High/Mid End,FLT70
Heater Low end
Pressostat, FLT70
Timer T2-EC6018-FLT
Water Distribution Actuator, FLT70
Nut Push In, FLT70
Heater Clip,FLT70
Bellow, FLT70
Shock Absorber Assy, FLT70
Universal Motor Assy, Mid & High End,FLT70
Motor Low end
Window Glass,FLT70
Drain Pump, FLT
On / Off Switch Low end ( Push button switch )
Thermostat Variable, Low End, FLT70
Poly V Belt,FLT70
Tub Sealing, FLT7023 17
Table 5.4.1 FSN ANALYSIS
Categories Total No. items in Classes Percentage
F 17 43
S 23 57
N 0 0
Total 40 100
ANALYSIS & INTERPRETATION :
In the above table shows the classification of various components as FSN items using
FSN analysis techniques based on movements. From the classification F items are those which
moves fastly and constitutes 43% of total components. S items are those which moves slowly
constitutes 57% of total components and N items are those which doesn’t move (Non-moving
items). According to data given, there is no Non-moving items. It is not good as the company
maintains low percentage in moving items.
Chart 5.4.1 FSN Analysis
5.5 TREND ANALYSIS
MEANING
Regression means dependence and involves estimating the values of a dependent variable
Y, from an independent variable X.
Y = a + bx
Where a= y – b x; b = Σ xy – n x y
Σx2- nx 2
Table 5.5.1 CALCULATION OF INVENTORY TREND
YEAR(x)
Inventories(Rs.)
YX
X=x-2005X2 XY
(Rs)
2003 9,17,88,514 -2 4 -18,35,77,0282004 8,66,68,300 -1 1 -8,66,68,300
2005 20,37,85,550 0 0 0
2006 17,58,61,213 1 1 17,58,61,213
2007 17,22,82,014 2 4 34,45,64,028
TOTAL(Σ) 73,03,85,591 0 10 25,01,79,913
x = Σx/n = 0/5 = 0 y = Σy/n = 73,03,85,591/5 = 14,60,77,118.2
b = Σ xy – n x y = 25,01,79,913- 5 * 0 * 73,03,85,591 =2,50,17,991.3 10-5*0
Σx2- nx 2
a = y – b x = 14,60,77,118.2 – 2,50,17,991.3 * 0 = 14,60,77,118.2
y = a + bx
= 14,60,77,118.2 + 2,50,17,991.3 x
The forecast of inventory for the year 2008 is computed by substituting x = 2008 in the above
equation.
=14,60,77,118.2 + 2,50,17,991.3 x
=14,60,77,118.2 + 2,50,17,991.3 (x-2005)
=14,60,77,118.2 + 2,50,17,991.3 (2008-2005)
=14,60,77,118.2 + 2,50,17,991.3 (3)
=14,60,77,118.2 + 7,50,53,973.9
=22,11,31,092.1
Therefore inventory for the year 2008 will be approximately Rs.22,11,31,100
Table 5.5.2 INVENTORIES PERCENTAGE
Years Inventories Percentage
2003 9,17,88,514 9.65
2004 8,66,68,300 9.15
2005 20,37,85,550 21.40
2006 17,58,61,213 18.50
2007 17,22,82,014 18.10
2008 22,11,31,100 23.20
TOTAL 95,15,16,691 100
ANALYSIS & INTERPRETATION :
In the above table shows the percentage of inventories increases from 9.65 to 18.10 in the
year 2003-2007. the inventory for the year 2008 is expected to be 23.20 which is again in the
increasing trend. This infers that the inventory requirement is increasing in the future period also.
It shows satisfactory position of inventories as it implies increasing production & demand for the
product.
Chart 5.5.2 TREND OF INVENTORY
5.6 INVENTORIES TURNOVER RATIO
MEANING
This ratio is calculated to consider the adequacy of the quantum of capital and its
justification for investing in inventory. A firm must have reasonable stock in comparison to sales.
It is the ratio of net sales and the average inventory. This ratio helps the financial manager to
evaluate inventory policy. This ratio reveals the number of times finished stock is turned over
during a given a accounting period.
The formula for the ratio is Net sales Avg. Inventory
Table 5.6.1 Inventories Turnover Ratio & Velocity
Year Net Sales
(Rs.)
Avg. Inventory (Rs.)
Ratio Velocity
(in Days)
2003 12,30,05,134 8,42,09,371 1.46: 1 250
2004 16,06,43,669 8,92,28,407 1.80: 1 203
2005 11,73,30,581 14,52,26,925 0.80: 1 456
2006 55,53,74,571 18,98,23,381 2.92: 1 125
2007 79,11,78,220 17,40,71,613 4.5: 1 81
ANALYSIS & INTERPRETATION :
In the above table shows inventory turnover ratio for the past years. The ratio is showing
increasing trend from1.46 to 4.5 in the year 2003 to 2007, except in the year 2005 which shows
only 0.80 times.
Whereas in the velocity of inventories shows less in 2007 as compared to 2003 which is
81 days in 2007 and 250 days in 2003 except in the year 2005 which is 456 days. This shows that
the inventories are easily converted into sales within the shortest period i.e. the company was able
to sell Rs. 4.5 by investing rupee one in the stock in 2007.
CHAPTER-VI
6.1 FINDINGS OF THE STUDY
It is found that, there is a variation in the EOQ & no. of unit purchased. It is understood
that the company is not following EOQ for purchasing the materials. So, the inventory
management is not satisfactory.
From calculation of safety stock, we can able to determine how much the company can
hold the inventory in reserve stock per annum.
From the classification A classes are those whose unit value is more than Rs.100 and
constitutes 45% of total components. B classes are those whose unit value is between
Rs.25-100 constitutes 35% of total components and C classes are those whose unit value
is less than Rs.25 constitutes 30% of total components. It is good that the company
maintains its inventories based on its value using controlling techniques.
From the classification F items are those which moves fastly and constitutes 43% of total
components. S items are those which moves slowly constitutes 57% of total components
and N items are those which doesn’t move (Non-moving items). According to data given,
there is no Non-moving items. It is not good as the company maintains low percentage in
fast moving items in compared to Slow moving inventories based on movements using
controlling techniques.
From the calculation it shows, that the percentage of inventoried increases from 9.65 to
18.10 in the year 2003-2007. the inventory for the year 2008 is expected to be 23.20
which is again in the increasing trend. This indicates increasing efficiency of the
management.
The ratio is showing increasing trend from1.46 to 4.5 in the year 2003 to 2007, except in
the year 2005 which shows only 0.80 times. Whereas in the velocity of inventories shows
less in 2007 as compared to 2003 which is 81 days in 2007 and 250 days in 2003 except
in the year 2005 which is 456 days. This shows that the inventories are easily converted
into sales within the shortest period i.e. the company was able to sell Rs. 4.5 by investing
rupee one in the stock in 2007.
6.2 SUGGESTIONS AND RECOMMENDATIONS
According to EOQ, as the company does not follow EOQ for its purchasing, the company
can be adjusted to order materials. This will reduce the cost & help to enhance the profit
of the company.
The company is required to maintain safety stock for its components in order to avoid
stock-out conditions & help in continuous production flow.
Under ABC analysis, the management must have more control on A than B&C, because
A class constitutes more(45%) of higher values. There should be tight control exercised
on stock levels, to avoid deterioration. This is done through maintaining low safety stock,
continuous check on schedules & ordered frequently in inventories, in order to avoid over
investment of working capital.
The company must not go to the Non-moving items as far as possible, because there will
be unnecessary blocking of working capital. This would hinder the other activities of the
organization.
The past data shows increase in inventory the company is also expecting more inventories
for future period i.e. 2008. The management is required to maintain the same inventory
trend in the forth coming year also.
The inventory turnover ratio indicates whether investment in inventory is within proper
limit or not. It also measures how quickly inventory is sold. It requires to maintain a high
turnover ratio than lower ratio. A high ratio implies that good inventory management and
it also reflects efficient business activities.

CHAPTER-VII
CONCLUSION
A better inventory management will surely be helpful in solving the problems the
company is facing with respect to inventory and will pave way for reducing the huge investment
or blocking of money in inventory. From the analysis we can conclude that the Company can
follow the Economic Order Quantity (EOQ) for optimum purchase and it can maintain safety
stock for its components in order to avoid stock-out conditions & help in continuous production
flow. This would reduce the cost and enhance the profit. Also there should be tight control
exercised on stock levels based on ABC analysis & maintain high percentage in fast moving
items in inventories as per on FSN analysis for efficient running of the inventory. Since the
inventory Turnover ratio shows the increasing trend, there will be more demand for the products
in the future periods. If they could properly implement and follow the norms and techniques of
inventory management, they can enhance the profit with minimum cost.
CHAPTER-VIII
8.1 LIMITATIONS OF THE STUDY
The entire analysis applies only to Whirlpool India Ltd, Puducherry.
The study takes into account only the quantitative data and the qualitative aspects were not
taken into account.
The assumption made in the EOQ and Safety stock formulas restrict the use of the formula. In
practice, unit cost, lead time, requirements of inventory items are not accurately predictable.
Rate of consumption varies in many cases. As such application of the formula often becomes
a difficult and complicated matter.
ABC analysis is not one time exercise and items are to be reviewed and recategorised
periodically.
8.2 SCOPE FOR THE FURTHER STUDY
To give plan to the company what to order, when to order and how much to order.
It is useful for deciding operating policy & volume of inventory.
It helps to develop the policies for the executives in inventory.
It helps the company what items goods are categorized.
Project helps to deal with forecasting in inventory.
BIBLIOGRAPHY
REFERENCES BOOKS
M Y Khan P K Jain “Financial Management” 4th edition Tata McGraw Hill.
R.S.N. Pillai V. Bagavathi “Management Accounting” S Chand & Co.
Martand Telsang “Industrial Engineering & Production Management” S Chand & Co.
R. Paneerselvam “Operations Research” Prentice hall Of India Private Ltd.
B.M. Lall Nigam I.C. Jain “Cost Accounting” Prentice hall Of India Private Ltd.
S.P. Iyengar “Cost & Management Accounting” Sultan Chand & Sons.
WEB SITES
www.whirlpoolindia.com
www.inventorymanagementreview.org/2005/06/safety_stock
www.inventorymanagementreview.org/inventory_basics/index
www.inventorymanagementreview.org/justintime/index
www.inventorymanagementreview.org/inventory_control/index