ozarks transportation organization · 2019. 5. 28. · the second letter is for employees of the...
TRANSCRIPT

March 20, 2013
Technical Planning Committee Meeting
OTO Conference Room, Holland Building
205 Park Central East, Suite 212
1:30 – 3:00 PM
Ozarks Transportation Organization

Technical Planning Committee Meeting Agenda
March 20, 2013 1:30 p.m. OTO Offices
Holland Building 205 Park Central East, Suite 212
Springfield, MO
Call to Order .............................................................................................................................. 1:30 PM I. Administration
A. Introductions
B. Approval of the Technical Planning Committee Meeting Agenda (1 minute/Hess) TECHNICAL PLANNING COMMITTEE ACTION REQUESTED TO APPROVE THE AGENDA
C. Approval of the January 16, 2013 Meeting Minutes ............................................................ Tab 1
(1 minute/Hess) TECHNICAL PLANNING COMMITTEE ACTION REQUESTED TO APPROVE THE MEETING MINUTES
D. Public Comment Period for All Agenda Items
(5 minutes/Hess) Individuals requesting to speak are asked to state their name and organization (if any) they represent before making comments. Individuals and organizations have up to five minutes to address the Technical Planning Committee.
E. Executive Director’s Report
(5 minutes/Fields) Sara Fields will provide a review of Ozarks Transportation Organization (OTO) staff activities since the last Technical Planning Committee meeting.
F. Bicycle and Pedestrian Committee Report (3 minutes/Longpine) Staff will provide a review of BPAC’s current activities.
II. New Business
A. Administrative Modification Number Four to the FY 2013-2016 TIP....................... Tab 2 (3 minutes/Longpine) Administration Modification Number Four is a minor change in scope to add an alternate to a pavement improvement project along Route D. NO ACTION REQUIRED – INFORMATIONAL ONLY

B. Amendment Number Four to the FY 2013-2016 TIP .................................................. Tab 3 (5 minutes/Longpine) OTO is requesting the Technical Planning Committee review Amendment Number Four to the FY 2013-2016 Transportation Improvement Program (TIP). The request is for six items. Please see the attached materials for more information. TECHNICAL COMMITTEE ACTION REQUESTED TO RECOMMEND APPROVAL OF TIP AMENDMENT NUMBER FOUR TO THE BOARD OF DIRECTORS
C. FY 2014 Unified Planning Work Program ................................................................... Tab 4 (10 minutes/Fields) OTO is requesting the Technical Planning Committee review and make a recommendation for the approval of the FY 2014 Unified Planning Work Program. TECHNICAL COMMITTEE ACTION REQUESTED TO RECOMMEND APPROVAL OF THE FY 2014 UPWP TO THE BOARD OF DIRECTORS
D. PM Advance ..................................................................................................................... Tab 5 (3 minutes/Longpine) Staff will provide an overview of the EPA PM Advance Program, which is similar to the Ozone Advance Program, in which OTO already participates. TECHNICAL COMMITTEE ACTION REQUESTED TO RECOMMEND PM ADVANCE PROGRAM PARTICIPATION TO THE OTO BOARD OF DIRECTORS.
E. OTO Funds Balance Report – December 2012 ............................................................ Tab 6 (5 minutes/Longpine) Staff will present the OTO Funds Balance Report and OTO’s current obligation of STP-Urban, Small Urban, and Bridge Funds. INFORMATIONAL ONLY - NO ACTION REQUIRED
F. TIP Tool Website ............................................................................................................. Tab 7 (15 minutes/Longpine) Staff will present the new online TIP tool. This tool will be used to produce the FY 2014-2017 TIP. INFORMATIONAL ONLY - NO ACTION REQUIRED
G. OTO Website (5 minutes/Richards) Staff will present the newly designed OTO website.
INFORMATIONAL ONLY - NO ACTION REQUIRED

III. Other Business
A. Technical Planning Committee Member Announcements (5 minutes/Technical Planning Committee Members) Members are encouraged to announce transportation events being scheduled that may be of interest to OTO Technical Planning Committee members.
B. Transportation Issues for Technical Planning Committee Member Review
(5 minutes/Technical Planning Committee Members) Members are encouraged to raise transportation issues or concerns they have for future agenda items or later in-depth discussion by the OTO Technical Planning Committee.
C. Articles For Technical Planning Committee Information ................................................ Tab 8
IV. Adjournment
Targeted for 2:40 P.M. The next Technical Planning Committee meeting is scheduled for Wednesday, May 15, 2013 at 1:30 P.M. at the OTO Offices, 205 Park Central East, Suite 212.
Attachments and Enclosure: Pc: Jim Viebrock, OTO Chair, Springfield Councilman Phil Broyles, City of Springfield Mayor’s Designee
Senator McCaskill’s Office Stacy Burks, Senator Blunt’s Office Jered Taylor, Congressman Long’s Office Area News Media Si usted necesita la ayuda de un traductor del idioma español, por favor comuníquese con la Debbie Parks al teléfono (417) 865-3042, cuando menos 48 horas antes de la junta. Persons who require special accommodations under the Americans with Disabilities Act or persons who require interpreter services (free of charge) should contact Debbie Parks at (417) 865-3042 at least 24 hours ahead of the meeting. If you need relay services please call the following numbers: 711 - Nationwide relay service; 1-800-735-2966 - Missouri TTY service; 1-800-735-0135 - Missouri voice carry-over service. OTO fully complies with Title VI of the Civil Rights Act of 1964 and related statutes and regulations in all programs and activities. For more information or to obtain a Title VI Complaint Form, see www.ozarkstransportation.org or call (417) 865-3042.

TAB 1
MEETING MINUTES AGENDA 3/20/2013; ITEM I.C.
Attached for Technical Committee member review are the minutes from the January 16, 2013 Technical Planning Committee Meeting. Please review these minutes prior to the meeting and note any corrections that need to be made. The Chair will ask during the meeting if any Technical Committee member has any amendments to the attached minutes. TECHNICAL COMMITTEE ACTION REQUESTED: To make any necessary corrections to the minutes and then approve the minutes for public review.
1 January 16, 2013 Minutes to be approved by the Technical Planning Committee
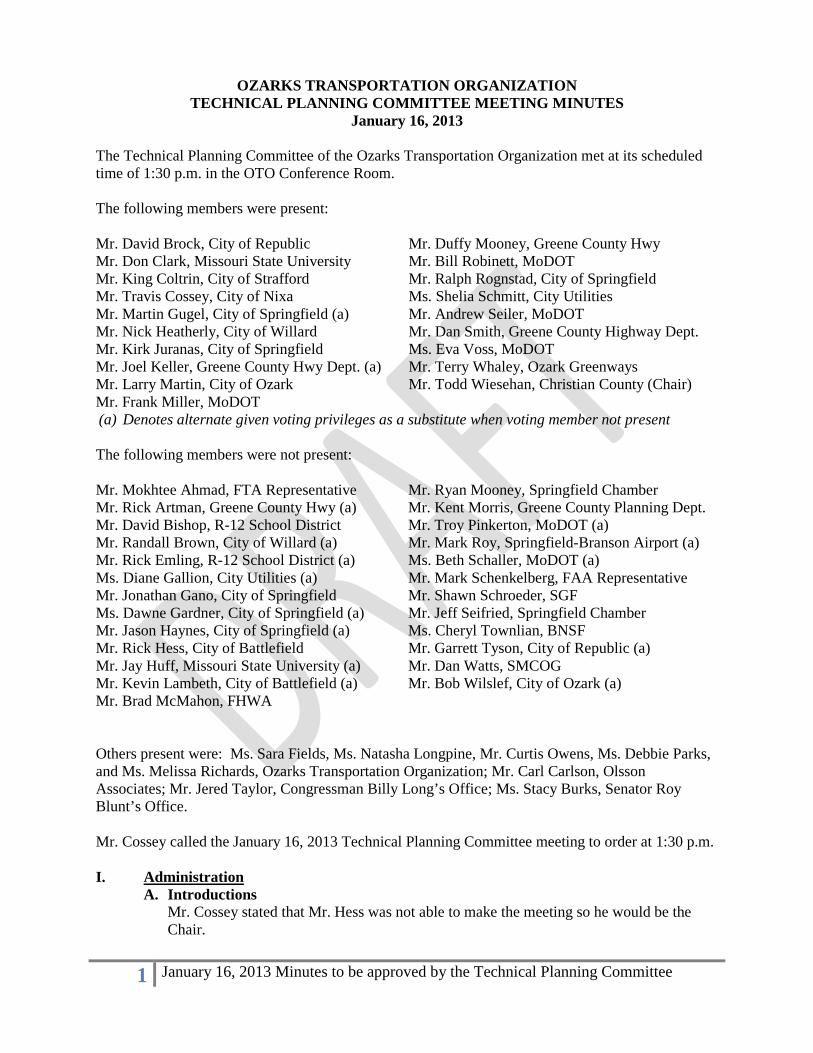
OZARKS TRANSPORTATION ORGANIZATION TECHNICAL PLANNING COMMITTEE MEETING MINUTES
January 16, 2013
The Technical Planning Committee of the Ozarks Transportation Organization met at its scheduled time of 1:30 p.m. in the OTO Conference Room. The following members were present: Mr. David Brock, City of Republic Mr. Duffy Mooney, Greene County Hwy Mr. Don Clark, Missouri State University Mr. King Coltrin, City of Strafford
Mr. Bill Robinett, MoDOT Mr. Ralph Rognstad, City of Springfield
Mr. Travis Cossey, City of Nixa Mr. Martin Gugel, City of Springfield (a) Mr. Nick Heatherly, City of Willard
Ms. Shelia Schmitt, City Utilities Mr. Andrew Seiler, MoDOT Mr. Dan Smith, Greene County Highway Dept.
Mr. Kirk Juranas, City of Springfield Mr. Joel Keller, Greene County Hwy Dept. (a)
Ms. Eva Voss, MoDOT Mr. Terry Whaley, Ozark Greenways
Mr. Larry Martin, City of Ozark Mr. Todd Wiesehan, Christian County (Chair) Mr. Frank Miller, MoDOT (a) Denotes alternate given voting privileges as a substitute when voting member not present
The following members were not present: Mr. Mokhtee Ahmad, FTA Representative Mr. Ryan Mooney, Springfield Chamber Mr. Rick Artman, Greene County Hwy (a) Mr. Kent Morris, Greene County Planning Dept. Mr. David Bishop, R-12 School District Mr. Troy Pinkerton, MoDOT (a) Mr. Randall Brown, City of Willard (a) Mr. Mark Roy, Springfield-Branson Airport (a) Mr. Rick Emling, R-12 School District (a) Ms. Diane Gallion, City Utilities (a)
Ms. Beth Schaller, MoDOT (a) Mr. Mark Schenkelberg, FAA Representative
Mr. Jonathan Gano, City of Springfield Ms. Dawne Gardner, City of Springfield (a) Mr. Jason Haynes, City of Springfield (a) Mr. Rick Hess, City of Battlefield Mr. Jay Huff, Missouri State University (a)
Mr. Shawn Schroeder, SGF Mr. Jeff Seifried, Springfield Chamber Ms. Cheryl Townlian, BNSF Mr. Garrett Tyson, City of Republic (a) Mr. Dan Watts, SMCOG
Mr. Kevin Lambeth, City of Battlefield (a) Mr. Brad McMahon, FHWA
Mr. Bob Wilslef, City of Ozark (a)
Others present were: Ms. Sara Fields, Ms. Natasha Longpine, Mr. Curtis Owens, Ms. Debbie Parks, and Ms. Melissa Richards, Ozarks Transportation Organization; Mr. Carl Carlson, Olsson Associates; Mr. Jered Taylor, Congressman Billy Long’s Office; Ms. Stacy Burks, Senator Roy Blunt’s Office. Mr. Cossey called the January 16, 2013 Technical Planning Committee meeting to order at 1:30 p.m. I. Administration
A. Introductions Mr. Cossey stated that Mr. Hess was not able to make the meeting so he would be the Chair.

2 January 16, 2013 Minutes to be approved by the Technical Planning Committee
B. Approval of the Technical Planning Committee Meeting Agenda Mr. Juranas made the motion to approve the January 16, 2013 agenda and the additions to the agenda. Mr. Smith seconded and the motion carried unanimously.
C. Approval of the November 14, 2012 Meeting Minutes
Mr. Rognstad made the motion to approve the November 14, 2012 Meeting Minutes. Mr. Juranas seconded and the motion carried unanimously.
D. Public Comment Period for All Agenda Items
None.
E. Executive Director’s Report Ms. Fields stated that the electronic TIP is completed and is being processed by the software company. It should be online within the next two to three weeks. At the next Technical Planning Committee meeting, Ms. Longpine will give an overview of how that works. The next TIP document should be electronic. The Travel Demand Model RFP went out this week and will be due back in February. The Census is still looking at May to release the Census Transportation Planning Package. There is not a super fast timeline, but the goal is to have the consultant selected and under contract when that comes out. Ms. Fields stated she was working on the Community Focus Report that will come out at the end of the year. She is the Chair of the Transportation Section so will be in contact with members of the TPC probably around March. OTO has started the Congestion Management Process. OTO hired CJW to conduct travel time runs which are now complete. Staff has not analyzed the data yet. If any member needs the travel time data, staff has the information available. Staff will be contacting several jurisdictions in regards to Growth Trends data. The Growth Trends report is produced every six months. Staff has been working on a new website that should be coming soon, as well as a new logo. There should be a display of the new website at the next meeting. Ms. Fields stated that there is still a six month continuing resolution through March 31. Half of the funding is available and Congress will need to act on the other half. An email was sent about the release of the Blue Ribbon Panel Report, which essentially states that there is a need for more money, but no real answer. Ms. Fields stated she would be out on maternity leave for February and most of March. Ms. Longpine and OTO staff would be available to assist in her absence.
F. Bicycle and Pedestrian Committee Report Ms. Longpine stated that the Bicycle and Pedestrian Committee had a meeting earlier this month where the BPAC priorities were discussed. One item discussed was the annual review of the bike/ped projects out of the LRTP. Everyone is reviewing the list of projects that were submitted in the planning process and seeing what needs to be completed or added as far as future needs are concerned. In addition, MoDOT is seeking

3 January 16, 2013 Minutes to be approved by the Technical Planning Committee
a specific list of ready to construct needs, which could be utilized if money became available.
II. New Business
A. OTO In-Kind Match Letters Ms. Parks stated that new in-kind letters were needed for the TPC positions. There are two types of in-kind letters. The first one is the Volunteer Rate Form. This applies to anyone who is an elected official for a jurisdiction or a volunteer who works on behalf of the jurisdiction, but is not an actual employee. The Volunteer In-Kind Rate changed this year so even if a form has been filled-out previously, members are requested to complete a new one. The second letter is for employees of the jurisdiction. This needs to be completed with hourly rate and the hourly rate with benefits. The OTO is allowed to put the combined hourly and benefit rates on the In-Kind spreadsheets. Since this program started, OTO has received $40,829 in-kind funding to match OTO’s federal funding. This helps build up the OTO reserve balance. The time spent during OTO meetings is submitted. The forms are kept confidential and the auditors do compare the forms to the amounts that are submitted. Ms. Parks directed MoDOT staff and federal employees to ignore the forms, as their time cannot be submitted for OTO’s use as in-kind.
B. OTO Technical Committee Appointment Ms. Parks stated that if there had been changes of the members assigned to the Technical Committee a new letter would be needed from the Mayor or Executive Director of the organization per the OTO By-Laws. If a letter had been turned-in with the past couple months a new letter was not needed. An example letter has been included in the agenda.
C. On System Bridge (BRM) Selection Process OTO annually receives a suballocation of On-System Bridge Replacement fund and Rehabilitation Funding. This has not been awarded for FY 2012 or 2013 and there is a prior balance. OTO appointed a subcommittee at the last TPC meeting who met to decide how to distribute the funding. Only two entities even had bridges eligible for the funding. The subcommittee thought it would make sense to base the decision on the actual deficiencies of the bridges. In this case, since there were only two eligible entities, the subcommittee decided to let the City of Springfield and MoDOT discuss the best use of the funds, considering what is in the pipeline for construction. The recommendation is to share the funding on the Battlefield and 65 Interchange. It is a new cost share project that both are partnering on. Both jurisdictions would be able to take credit for using the money and reduce the local share that would be part of the project. The proposal is to award the balance of $1,189,657 to the Battlefield and 65 Interchange project. Mr. Brock inquired how bridges qualify. Ms. Longpine stated that the bridge has to be on-system and to be a certain amount deficient based on the bridge inspections. Ms. Fields stated that other jurisdictions obviously have bridges on the system but that the bridges were not deficient enough to qualify for the funding right now. Mr. Miller stated that it needs to be Collector or higher. Mr. Brock asked how often the bridges were

4 January 16, 2013 Minutes to be approved by the Technical Planning Committee
inspected. Mr. Miller stated every two years, though some of the major bridges are inspected annually. Mr. Juranas stated that the City of Springfield bridges were inspected this summer. Mr. Juranas made the motion to approve awarding the funding for the Battlefield and 65 Bridge Project. Mr. Smith seconded and the motion carried unanimously.
D. Enhancement Project Selection Process Mr. Cossey stated there was a handout of the amendment proposed on the selected project. Ms. Longpine stated that the Enhancement Subcommittee met after reviewing all the applications and the scores were averaged for each project. It was decided to award funding on the ranking of the scores. Since the ranking, the City of Springfield has found out that one of the projects that was awarded funding may not have the right-of-way that was previously thought. The City of Springfield is proposing to move down to the next project on the list which also happens to be a City of Springfield project. The top six projects were recommended to receive full funding amounts. That includes the City of Strafford Transportation Enhancement Project, which includes sidewalks from the south side of OO towards the school; the Willard sidewalk project, which connects with the trail system; the Jordan Creek Trail at West Meadows, which takes it from the Butler Rosenberry parking lot over to Fort; Route 14 ADA accommodations in Nixa and Ozark, which includes replacing or adding ADA accessible ramps for the sidewalks that exist there; Jefferson Avenue Streetscape Phase I; and Mill Street Streetscape Phase I. Mill Street is the one that the City of Springfield would like to withdraw and replace with Commercial Street Streetscape. The City of Willard project is actually up for a Safe Route to School Grant. It is unknown at this time if the funding will be awarded. The committee made the recommendation to have a project on-deck if Willard is awarded the Safe Routes to School funding. So the next project after Commercial Street Streetscape Phase V would be the Phelps Street Streetscape Phase I. In summary, the City of Springfield is requesting to drop Mill Street, Commercial Street would become partially funded with the remaining funds and Phelps Street would be the on-deck project if the City of Willard receives the Safe Routes to School funding. Ms. Fields stated that with the TPC approval, if one of the entities decided not to go forward then the next project on the list would automatically get the funding. Mr. Miller asked to clarify if Mill Street was the project that did not have the right-of-way. Ms. Longpine confirmed. Mr. Miller made the motion to approve with the change as submitted by Mr. Gugel. Mr. Mooney seconded and the motion was carried unanimously.
E. Amendment Number Three to the FY 2013-2016 TIP Ms. Longpine stated that the Amendment also includes the Enhancement Projects that were just approved. In addition to the Enhancement Projects, there are five additional items. Three of the items are the bridge replacements in Greene County: one on Farm Road 66, two on Farm Road 141, and one on Farm Road 102. The next items would include the BRO funding that was approved earlier on 65 and Battlefield and the McDaniel Lake Bridge. This is part of a program that allows a jurisdiction to turn a

5 January 16, 2013 Minutes to be approved by the Technical Planning Committee
bridge slated for demolition over to a nonprofit who would then use the BRO funding to use it for maintenance, in exchange for taking ownership of the bridge. Items six through 12 are the Enhancements, but Mill Street needs to be removed, Commercial bumped to funded, and Phelps added per the motion that was just made.
Mr. Martin made the motion to approve Amendment Number Three to the FY 2013-2016 TIP with the changes the City of Springfield submitted for Mill Street. Mr. Miller seconded and the motion was carried unanimously.
F. Functional Class and Urbanized Area Boundary Ms. Longpine stated that the Functional Class Changes discussed at the last meeting are being brought back. The subcommittee decided during the November 14 subcommittee meeting to move forward with MoDOT’s requested changes. After discussion it was decided to downgrade Kearney to the old terminal to a minor arterial. MoDOT also sent information on changes to the Urbanized Area Boundary for the Springfield Area. The Census releases the data about two years after the Census every ten years. MPOs have the ability to smooth the boundaries of the Census released urbanized area. MoDOT’s Central Office has reviewed the Census released boundaries and recommended several changes that basically clean them up. Looking at some of the maps, there might be a skinny line that fills in the gap. Most of these are minor. Included is information on what can be affected by smoothing the Urbanized Area, including the Highway Functional Classification, the highway performance monitoring system, and distribution of STP funds. This really impacts the amount of what must be spent in a rural area. The amount of change here would be so insignificant that a difference probably would not be seen in the STP funding. There were seven changes proposed by MoDOT and an additional one proposed by the committee. Most of the changes are minor, but the final one, shows a line going down 65 south of Ozark outside the MPO boundary. Apparently that got changed within the MODOT system. If it was not removed it would require a change of all the OTO boundaries. Since the source of the change is unknown the subcommittee is recommending going back to the previous boundary. In addition to the Urbanized Boundary Changes there was an additional review of the Functional Classifications that follow these boundary changes. Maps have been included in the agenda. The maps are hand written because that is how the OTO received the maps. OTO concurred with most of the eight changes requested. Some of the changes have options to choose between. There is one change that the OTO is recommending to not follow the MoDOT recommendation. Change number one is to downgrade from principal to minor arterial between the US 65 northbound ramp and Blackman Road on Sunshine. OTO actually recommended keeping that a principal arterial all the way to Blackman as it is now. Change number two was to downgrade National Avenue south of Republic Road to a minor arterial from a principal arterial. The subcommittee agreed with that recommendation. Change number three had a few different options. The option that the subcommittee recommended was to upgrade Norton Road from a major collector to a minor arterial between Kansas Expressway and Glenstone and to upgrade Grant to a minor arterial between I-44 and Norton, but north of

6 January 16, 2013 Minutes to be approved by the Technical Planning Committee
Norton to downgrade it to local. Staff talked to Greene County and it actually helped with one of the bridges by making it local. Changes four and five that were recommended were to go between major and minor collectors but in the urban area, it goes by the general collector classification so the subcommittee felt there was no change necessary. Change number six, recommendation was to actually down grade route P in Republic south Miller Road from a minor arterial to a collector, but after reviewing the area, the OTO recommended keeping it a minor arterial. Change number seven, the subcommittee had a few options for where the line was drawn here. The subcommittee recommended changing the functional classification of Route 174 between what is considered the west urban limit and Kansas Street, going ahead and changing it from a minor arterial to a collector. Change number eight is on Business Route 65 in Ozark from 65 to 14, going ahead and upgrading it to minor arterial. Mr. Martin made the motion to recommend approval of the proposed Functional Class and Urbanized Area Boundary changes to the Board of Directors. Mr. Heatherly seconded and the motion was carried unanimously. Mr. Brock asked if the motion was to follow the subcommittee’s recommendations. Mr. Cossey stated yes it was as submitted.
G. MoDOT’s On The Move Initiative
Mr. Miller presented an overview of MoDOT’s On the Move Initiative. MoDOT is conducting outreach with the citizens of Missouri to talk about the transportation needs of the state. It is similar to the Blue Ribbon Panel information that the panel had sent out. The emphasis of this initiative is that MoDOT is trying to create a broader group of stakeholders in the state and to remind people that transportation is relevant. There is a window for MoDOT to raise the level of awareness about transportation amongst stakeholder groups and also there is a lot of interest at the State and Legislative level in transportation. There are some opening statements that the current legislature had about what they are looking to achieve during the coming legislative year. Transportation is on the agenda. Part of the message is that Missouri is a big transportation state. Transportation is very relevant. Missouri has the seventh largest highway system in the nation with 33,000 miles of highways. There are 213 bridges statewide that are over 1,000 feet. In the OTO area, that is principally the railway overpass over Kansas Expressway and some flyover bridges. But looking beyond the OTO there is the Missouri and Mississippi Rivers. In the Southwest District there are six major lakes with bridges spanning those lakes. There are over 10,000 bridges of all sizes. There are 4,800 miles of track that carried 410 million tons of freight in 2010. Missouri has the fourth greatest volume of freight in the state. Locally, this can be seen with the BNSF lines bringing coal from Wyoming to take it to the southeast power plants. Also containers come from the port of Los Angeles through Springfield up towards St. Louis and down towards Memphis. It is pretty significant. In the other part of southwest Missouri, over in Joplin and up to Nevada, there is the Kansas City Southern Line that carries freight from the northern part of the United States to Mexico, where Kansas City Southern actually owns the railroad. Kansas City and St. Louis are the second and third largest rail hubs in the nation. Seven million transit trips occur in the state. Transit is significant in the State of Missouri. Eighty-one percent of the travel occurs on 17 percent of the roads. These are major

7 January 16, 2013 Minutes to be approved by the Technical Planning Committee
roads, the ones that MoDOT focuses on resurfacing in the State, the principal arterials. There are 125 airports. The Springfield-Branson National Airport is an important airport for the region. The Branson airport has flights going to other parts of the United States and Joplin Regional Airport also has commercial flights going to Dallas. There are 14 public ports. There are the Missouri and Mississippi Rivers, so freight transportation on the rivers is very important. Right now the water level on the Missouri River is low. It is starting to cause problems. There is a concern about getting the freight from point A to B if the rivers cannot be relied on to do this. Locally, looking at the past ten years MoDOT has accomplished many things in the area. MoDOT has six-laned Highway 65, completed improvements at the 60/65 interchange and the I-44/65 interchange. MoDOT has completed three diverging diamond interchanges. One is under construction, two are planned. MoDOT has done interchange improvements on non-DDIs at four interchanges. There has been a lot of bridge work and resurfacing. There was a list of bicycle and pedestrian priorities. MoDOT is getting ready to let two of those pedestrian priorities which are the north Glenstone sidewalks and Kearney Street sidewalks. There has been work done on Hunt Road and 160 in Willard that will include pedestrian accommodations, another identified high priority. Ward Branch Greenway was identified as a bicycle priority, it is moving forward. There are some needs left. MoDOT has the projects of regional significance outlined. There are a lot of unfunded needs. The extension of transit in the region from the OTO study is not funded. There are still bicycle and pedestrian needs left in the region. The funding is now stagnant and is not keeping up with the needs. As a reminder of the funding, 45percent of the funding comes from the federal gas tax, which is 18.4 cents per gallon. That is not depending on a certain percentage of gas. If gas cost $6.00 per gallon or $1.00 per gallon it is still 18.4 cents for that gallon. It is not a percentage like a sales tax would be. Twenty-two percent of the funding comes from the state gas tax which is 17 cents per gallon, 12 percent of the funding comes from license and registration fees that come back to MoDOT for transportation funding, 12 percent comes from the vehicle sales tax whenever a new car is purchased, and 9 percent comes from the revenue at the state level and most of that goes to other modes such as the little bit that CU and rural transit systems get, as well as the subsidy for the Amtrack service between St. Louis and Kansas City. There is also assistance for small airports. It is really critical for the municipal airports like Bolivar and Monet. Since MoDOT passed the last gas tax in 1992 the revenue has grown 86 percent, but inflation for transportation projects has grown faster. The price of steel in the same period has gone up 100 percent. The price of asphalt has gone up 176 percent and the price of concrete has gone up 199 percent. So the revenues have not kept pace with the inflation. Part of the case that MoDOT wants to make to the public is that MoDOT is doing a good job delivering projects. In the past ten years, MoDOT has delivered 4,220 projects that are valued at 11.6 billion dollars. Those projects have been 4 percent under budget and 95 percent have been delivered on time. MoDOT conducts an annual customer service survey that came back with an 85 percent customer satisfaction rate. The people that conducted the survey went back and checked the numbers since it was so high. Apple has an 83 percent customer satisfaction. The next was SAMS Club with an 81 percent.

8 January 16, 2013 Minutes to be approved by the Technical Planning Committee
MoDOT also has the 4th lowest administrative cost in the nation among the DOTs. MoDOT recently made changes in the departments to find more cost savings. The districts were reorganized from 10 to 7. There are now 1200 positions and 131 facilities have been closed. MoDOT has sold 750 pieces of equipment. Right now there is $342 million in savings, with the goal of $512 million in savings. At the last TPC, meeting a TIP amendment to resurface Route 125 and a portion of Route D was because of savings. MoDOT has made a lot of progress making the roads safer. For the first time since the 1950s, fatalities have been less than 1,000 people per year in the state. Last year there were 823, which is up slightly from 2011, but is good from when there were 1,200 to 1,400 fatalities. MoDOT has done a lot by implementing measures like guardrails, guard cable on the interstates, and most recently with the minor routes in the rural areas putting in two foot shoulders with rumble stripes. MoDOT would like that put everywhere if possible. There is still a lot to be done to make the roads safer. MoDOT has done a good job taking care of the major routes, where there is 80 percent of the traffic. In the southwest District those routes are 94 percent in good condition. It is going to take most of the resources to keep the maintenance cycle going. In addition to Missouri being a big state for transportation, the actual act of investing in transportation is a real economic benefit to the state. For every dollar invested in transportation, there is a $4 return. For every $1 billion invested there are 34,000 jobs generated. Right now is a good time to move Missouri forward with transportation and have this discussion. Missourians can be reminded again of the importance transportation plays in their lives. Companies need to remember the importance the transportation network plays in how business is done. As there is a slow economic recovery, Missouri needs to be poised strategically to take advantage as a state of transportation with rivers, rail and interstate. The next step is going to be introducing a website called Missourionthemove.org. MoDOT is requesting that individuals, agencies, and the OTO comment on where MoDOT should be headed. There will be listening sessions around the state. In February, there will be at least one in Springfield and one in Joplin. In April there will be a mobile listening tour. There will be vans wrapped in the new logo and will be going to every county in the state to get input from the citizens of the state. This will be used for the input of the Long Range Transportation Plan Update.
H. FY 2013 Unified Planning Work Program Subcommittee and Project Proposals Ms. Fields stated the UPWP is essentially the OTO budget with the items that the OTO will be working on the next fiscal year. The fiscal year runs July 1 to June 30. Because of all the federal approvals required, the process has to start now. She requested volunteers to serve on the subcommittee. Larry Martin, Dawn Gardner, Nick Heatherly, Joel Keller, and Eva Voss volunteered for the subcommittee.
III. Other Business
A. Technical Planning Committee Member Announcements Mr. Martin announced that the City of Ozark voted to ask the voters for a 3/8th cent transportation capital improvement sales tax. It will be on the April ballot. It is a five year sunset, much like the Springfield program. It is for road rebuilding, no new road

9 January 16, 2013 Minutes to be approved by the Technical Planning Committee
construction, just for maintenance repaving, but the sidewalks can be for new constructions. The city does not have a transportation sales tax yet. Ms. Longpine asked if there was a specific list being proposed. Mr. Martin stated that they have taken their conventional five year plan, which is a sustainable plan. Every year it turns into a new five year plan and the City has incorporated that into an existing versus what we would do in the next five years and overlaying over that a fifteen year plan. Mr. Rognstad stated that next week, January 22, 2013 at 5:30 the City of Springfield is having a public meeting on the College St. Streetscape and Route 66 Park concept plan. It will be at the Abundant Life Church. The City has gotten to the point where there are three conceptual designs and are asking for input on those. The final plan should be ready in February. Ms. Schmidt stated that CU had the opportunity to approach Megabus and it stops in Springfield. It just started this month at Boonville. It is an express route to St. Louis.
B. Transportation Issues for Technical Planning Committee Member Review
Mr. Smith stated that Ms. Fields had asked for comments on the BRO. MoDOT is reviewing the program for potential ways to improve it. Greene County likes the program as it is. The reason is that MoDOT has done a good job of managing it for several decades. Greene and Christian Counties have been the beneficiaries of the program. The proposal was for the RPCs to administer it. Greene County understands the funding issues that MoDOT has had. Greene County suggested a small portion of the funds go into administration that would cover the cost. Mr. Miller clarified that the proposal did not actually switch administration to the Regional Planning Commission, just the selection process. The projects would still be administered by MoDOT. Mr. Smith stated that the current needs based approach looking at the amount of bridges and the classification. Basing the funding on the needs has been very successful. One item that can be improved is that there is a soft match trade program. If there was a way of putting people together who wanted to make trades for soft match that would help to get some of the projects out the door. Mr. Miller stated as background for the rest of the committee members, the funding that was mentioned gets distributed to the counties. Altogether in Missouri, there are 114 counties. Some of the pieces get pretty small. One county gets $7,500 a year. All of the smaller counties are building their balance up, creating a $72 million balance. Counties have to wait until there is enough funding to build a project. Counties traditionally go two years in the hole. Some counties are comfortable doing that, while some are not. The concept was if counties could pool at a larger level then the county that is ready to go would have enough money to go at that time. Then the next priority project might be in another county. That is the concept. MoDOT is trying to solve the problem of how to get access to the funding but have the counties be able to complete a project. Ideas would be appreciated and there is an advisory group. Mr. Duffy Mooney is on the advisory group. Ms. Burks stated that she had been to six counties in the last two weeks and there has not been a single commissioner there that has been in favor of the changes proposed. That is not going to help out MoDOT in their endeavor, but it goes back to the issues that were discussed. Mr. Miller stated that the TPC just approved a TIP amendment that will help bring that

10 January 16, 2013 Minutes to be approved by the Technical Planning Committee
balance down. Ms. Fields stated she was going to draft a letter with some of the thoughts mentioned and take it to the Executive Committee. She inquired if there was anyone who was not of the opinion that it should be left alone. Ms. Burks stated that Peter Henry in D.C. has gone over to the Environment and Public Works Committee. That actually is the committee that Senator Inhofe is ranking member on, it is the committee that writes the Highway Authorization Bill. Senator Blunt’s Office will still have a connection with him, and is currently sorting out exactly who is handling transportation issues in D.C.
C. Articles For Technical Planning Committee Information
Ms. Fields stated that MoDOT got an article in Forbes, about their social technology. MPTA, the Missouri Public Transit Association is lobbying for state funding again. Ms. Longpine stated there was an article about the capital bike share program in D.C. Kansas City also has a program they just started.
IV. Adjournment
Mr. Martin made the motion to adjourn at 2:26. Mr. Miller seconded and the meeting adjourned.

TAB 2
TECHNICAL COMMITTEE AGENDA 3/20/2013; ITEM II.A.
Administrative Modification Number Four to the FY 2013-2016 Transportation Improvement Program
Ozarks Transportation Organization
(Springfield, MO Area MPO)
AGENDA DESCRIPTION: There is one item to be included as part of TIP Administrative Modification Four to the FY 2013-2016 Transportation Improvement Program. • Revision – Minor Changes to the Scope of a Project:
East Sunshine Street Pavement Improvements (SP1319) – Modified 3/11/2013 This project was updated to include an alternate should the low bid stay within the programmed amount. The alternate includes pavement improvements on Route 65 at Route D interchange. The programmed funding has not changed with this minor change in scope.
TECHNICAL PLANNING COMMITTEE ACTION REQUESTED: No action required. Informational only.

W I44
E I44
W JRF
S US6
5
S SHJ
E SHD
E US60
N US
65
E JRF
E DIVISION ST
N SH
AB
W SH266
W SHEE
N SH
125
S CAM
PBEL
L AVE
E KEARNEY ST
W US160
W US60
W SUNSHINE ST
E SHOO
W SHM
W KEARNEY ST
S NAT
IONA
L AVE
E GRAND ST
S SHZ
Z
E SUNSHINE ST
W CHESTNUT EXPY
W REPUBLIC ST
S SHN
N
S SHF
F
N NA
TIONA
L AVE
S SHM
M
E US60 EAST
E BATTLEFIELD RDW BATTLEFIELD RD
S FR1
63
S WES
TBYP
ASS
BYP
E CHESTNUT EXPY
N GL
ENST
ONE A
VEN
SHH
N KA
NSAS
EXPY
S KAN
SAS E
XPY N
GRAN
T AVE
N SH13
E REPUBLIC ST
W SHFF
S SHB
E FR192
E SH174
E SAINT LOUIS ST
W REPUBLIC RD
W GRAND ST
N SH13 HWY
W DIVISION ST W DIVISION ST
S US6
5
W US60
E US60
W I44
N US
65
W JRF
E JRF
E I44
0 2 4
MilesAdministrative Modification #4
2013-2016 TIP
SP1319
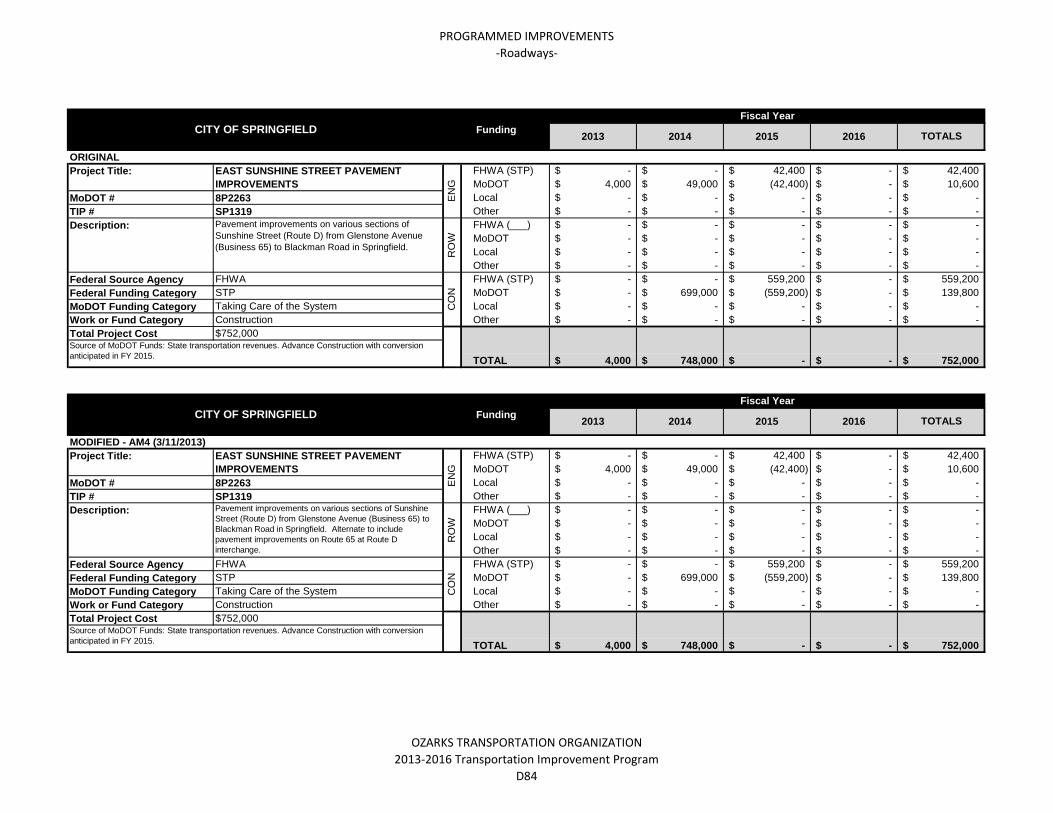
PROGRAMMED IMPROVEMENTS
-Roadways-
ORIGINAL
FHWA (STP) -$ -$ 42,400$ -$ 42,400$
MoDOT 4,000$ 49,000$ (42,400)$ -$ 10,600$
MoDOT # 8P2263 Local -$ -$ -$ -$ -$
TIP # SP1319 Other -$ -$ -$ -$ -$
FHWA (___) -$ -$ -$ -$ -$
MoDOT -$ -$ -$ -$ -$
Local -$ -$ -$ -$ -$
Other -$ -$ -$ -$ -$
Federal Source Agency FHWA FHWA (STP) -$ -$ 559,200$ -$ 559,200$
Federal Funding Category STP MoDOT -$ 699,000$ (559,200)$ -$ 139,800$
MoDOT Funding Category Taking Care of the System Local -$ -$ -$ -$ -$
Work or Fund Category Construction Other -$ -$ -$ -$ -$
Total Project Cost $752,000
MODIFIED - AM4 (3/11/2013)
FHWA (STP) -$ -$ 42,400$ -$ 42,400$
MoDOT 4,000$ 49,000$ (42,400)$ -$ 10,600$
MoDOT # 8P2263 Local -$ -$ -$ -$ -$
TIP # SP1319 Other -$ -$ -$ -$ -$
FHWA (___) -$ -$ -$ -$ -$
MoDOT -$ -$ -$ -$ -$
Local -$ -$ -$ -$ -$
Other -$ -$ -$ -$ -$
Federal Source Agency FHWA FHWA (STP) -$ -$ 559,200$ -$ 559,200$
Federal Funding Category STP MoDOT -$ 699,000$ (559,200)$ -$ 139,800$
MoDOT Funding Category Taking Care of the System Local -$ -$ -$ -$ -$
Work or Fund Category Construction Other -$ -$ -$ -$ -$
Total Project Cost $752,000
-$ 752,000$
Source of MoDOT Funds: State transportation revenues. Advance Construction with conversion
anticipated in FY 2015.
CO
N
TOTAL 4,000$ 748,000$ -$
Project Title: EAST SUNSHINE STREET PAVEMENT
IMPROVEMENTS
EN
G
Description: Pavement improvements on various sections of Sunshine
Street (Route D) from Glenstone Avenue (Business 65) to
Blackman Road in Springfield. Alternate to include
pavement improvements on Route 65 at Route D
interchange.
RO
W
-$ 752,000$
Source of MoDOT Funds: State transportation revenues. Advance Construction with conversion
anticipated in FY 2015.
CITY OF SPRINGFIELD Funding
Fiscal Year
2013 2014 2015 2016
-$
TOTALS
CO
N
TOTAL 4,000$ 748,000$
Description: Pavement improvements on various sections of
Sunshine Street (Route D) from Glenstone Avenue
(Business 65) to Blackman Road in Springfield.
RO
W
CITY OF SPRINGFIELD FundingTOTALS
Project Title: EAST SUNSHINE STREET PAVEMENT
IMPROVEMENTS
EN
G
Fiscal Year
2013 2014 2015 2016
OZARKS TRANSPORTATION ORGANIZATION
2013-2016 Transportation Improvement Program
D84

FINANCIAL SUMMARY
- Roadways -
YEARLY SUMMARY
PROJECT MoDOT Local Other TOTAL
STP STP-Urban NHS Safety ITS I/M 130 Bridge BRM BRO
MO1105 284,000$ 284,000$
MO1106 7,000$ 7,000$
MO1107 27,000$ 3,000$ 30,000$
MO1150 195,000$ 195,000$
MO1201 900$ 100$ 1,000$
MO1206 13,000$ 13,000$
MO1303 260,000$ 451,000$ 65,000$ 776,000$
MO1304 39,000$ 39,000$
MO1306 4,000$ 4,000$
MO1308 25,000$ 25,000$
MO1309 25,000$ 25,000$
CC0901 2,000$ 2,000$
CC1102 2,000$ 2,000$
CC1110 22,000$ 22,000$
CC1201 288,000$ 32,000$ 320,000$
CC1202 1,800$ 200$ 2,000$
CC1203 447,000$ 447,000$
CC1301 1,000$ 1,000$
CC1302 504,000$ 56,000$ 560,000$
CC1303 12,000$ 12,000$
CC1304 11,700$ 1,300$ 13,000$
CC1305 2,700$ 300$ 3,000$
CC1306 2,984,000$ 2,984,000$
CC1307 10,000$ 10,000$
CC1401 11,700$ 1,300$ 13,000$
GR0909 320,000$ 80,000$ 400,000$
GR1010 2,000$ 2,000$
GR1206 33,600$ 8,400$ 42,000$
GR1212 960,000$ 240,000$ 1,200,000$
GR1213 1,133,600$ 283,400$ 1,417,000$
GR1302 160,000$ 40,000$ 200,000$
GR1303 4,486,000$ 4,486,000$
GR1304 2,000$ 2,000$
GR1305 10,000$ 10,000$
GR1306 2,000$ 2,000$
GR1307 216,000$ 216,000$
GR1308 2,000$ 2,000$
GR1309 290,848$ 5,000$ 1,674,367$ 1,970,215$
GR1310 861,000$ 1,047,000$ 1,908,000$
GR1311 168,000$ 42,000$
GR1312 371,200$ 92,800$
NX0601 1,989,600$ 633,400$ 2,623,000$
NX0701 301,920$ 75,480$ 377,400$
NX1201 30,000$ 30,000$
NX1301 189,000$ 189,000$
OK1004 2,433,600$ 608,400$ 3,042,000$
OK1006 723,000$ 767,000$ 20,000$ 1,510,000$
OK1101 909,600$ 227,400$ 1,137,000$
RP1201 272,000$ 272,000$
RP1301 2,000$ 2,000$
RP1302 1,187,000$ 1,187,000$
RP1303 64,000$ 16,000$ 80,000$
RP1304 50,000$ 50,000$
RP1305 228,000$ 228,000$
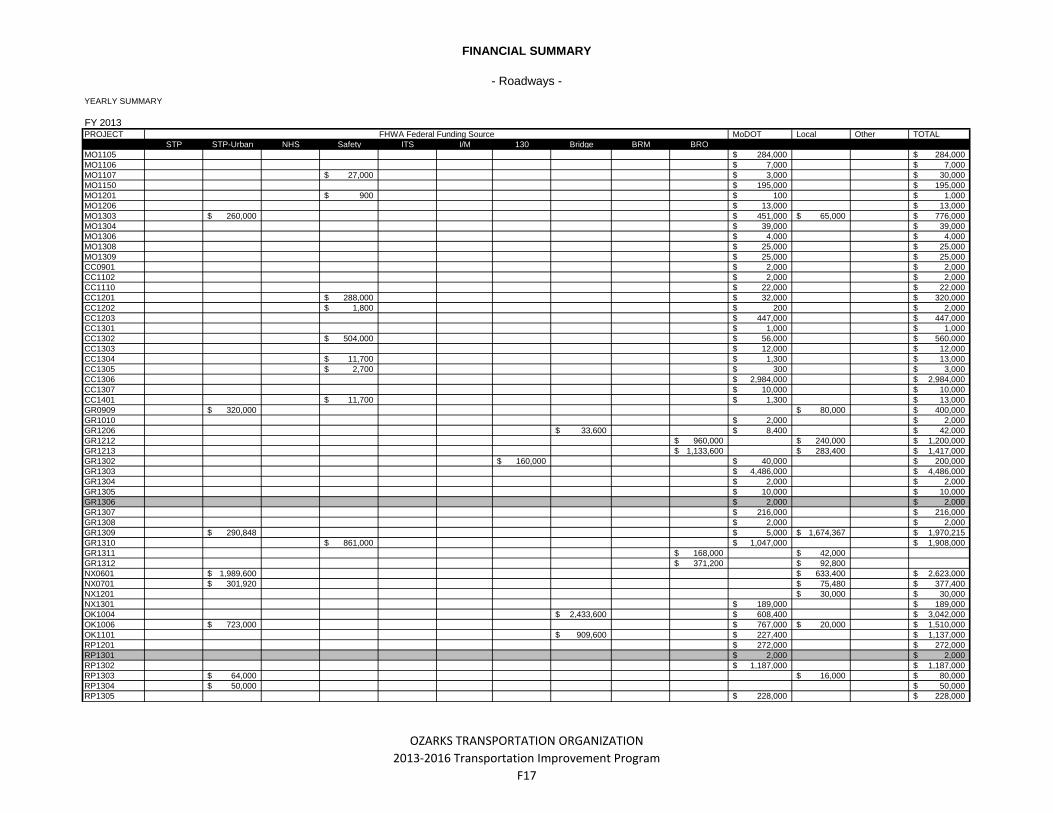
FY 2013FHWA Federal Funding Source
OZARKS TRANSPORTATION ORGANIZATION
2013-2016 Transportation Improvement Program
F17

FINANCIAL SUMMARY
- Roadways -
YEARLY SUMMARY
2013 Continued
PROJECT MoDOT Local Other TOTAL
STP STP-Urban NHS Safety ITS I/M 130 Bridge BRM BRO
RG0901 2,000$ 2,000$
RG1201 1,000$ 1,000$
SP1018 80,000$ 20,000$ 100,000$
SP1021 825,000$ 825,000$
SP1106 100,000$ 1,349,942$ 1,178,942$ 2,628,884$
SP1107 830,000$ 830,000$
SP1108 25,000$ 25,000$
SP1109 2,000$ 2,000$
SP1110 1,571,000$ 1,571,000$
SP1112 5,000$ 5,000$
SP1113 80,000$ 20,000$ 100,000$
SP1115 160,000$ 40,000$ 200,000$
SP1202 1,469,000$ 1,469,000$
SP1203 1,024,000$ 1,024,000$
SP1204 2,000$ 2,000$
SP1206 120,000$ 120,000$
SP1212 160,000$ 40,000$ 200,000$
SP1213 100,000$ 100,000$
SP1302 80,000$ 20,000$ 100,000$
SP1303 160,000$ 40,000$ 200,000$
SP1304 160,000$ 40,000$ 200,000$
SP1305 160,000$ 40,000$ 200,000$
SP1306 160,000$ 40,000$ 200,000$
SP1307 160,000$ 40,000$ 200,000$
SP1308 160,000$ 40,000$ 200,000$
SP1309 160,000$ 40,000$ 200,000$
SP1310 1,000$ 1,000$
SP1311 2,000$ 2,000$
SP1312 6,000$ 6,000$
SP1313 2,135,742$ 2,669,677$ 533,936$ 5,339,355$
SP1314 12,000$ 12,000$
SP1315 2,000$ 2,000$
SP1316 2,000$ 2,000$
SP1317 2,000$ 2,000$
SP1318 2,000$ 2,000$
SP1319 4,000$ 4,000$
SP1320 627,000$ 109,500$ 110,500$ 847,000$
SP1321 10,000$ 3,984$ 13,984$
SP1322 190,000$ 560,000$ 750,000$
SP1401 2,000$ 2,000$
ST1201 133,000$ 133,000$
ST1204 400,000$ 100,000$ 500,000$
WI1201 21,000$ 593,000$ 614,000$
WI1301 2,000$ 2,000$
TOTAL 2,862,742$ 4,030,368$ -$ 1,708,800$ -$ -$ 2,160,130$ 3,456,800$ -$ 2,632,800$ 25,496,519$ 5,639,809$ -$ 47,313,838$
FHWA Federal Funding Source
OZARKS TRANSPORTATION ORGANIZATION
2013-2016 Transportation Improvement Program
F18

FINANCIAL SUMMARY
- Roadways -
YEARLY SUMMARY
PROJECT MoDOT Local Other TOTAL
STP STP-Urban NHS Safety ITS I/M 130 Bridge BRM BRO
FHWA Federal Funding Source
MO1105 284,000$ 284,000$
MO1107 13,500$ 1,500$ 15,000$
MO1150 202,000$ 202,000$
MO1201 900$ 100$ 1,000$
MO1206 2,230,000$ 2,230,000$
MO1306 2,000$ 2,000$
MO1309 25,000$ 25,000$
MO1401 29,000$ 29,000$
MO1403 268,000$ 451,000$ 67,000$ 786,000$
CC0901 2,000$ 2,000$
CC1102 2,000$ 2,000$
CC1110 238,000$ 166,000$ 404,000$
CC1201 1,885,500$ 209,500$ 2,095,000$
CC1202 274,500$ 30,500$ 305,000$
CC1203 495,000$ 495,000$
CC1301 105,000$ 264,000$ 369,000$
CC1302 967,500$ 107,500$ 1,075,000$
CC1303 1,808,000$ 1,808,000$
CC1304 104,400$ 11,600$ 116,000$
CC1305 146,700$ 16,300$ 163,000$
CC1306 2,387,200$ (2,387,200)$ -$
CC1401 180,900$ 20,100$ 201,000$
GR1010 2,000$ 2,000$
GR1104 80,000$ 20,000$ 100,000$
GR1206 34,400$ 8,600$ 43,000$
GR1303 3,588,800$ (3,588,800)$ -$
GR1304 17,000$ 17,000$
GR1305 1,574,000$ 1,574,000$
GR1306 8,000$ 8,000$
GR1308 2,000$ 2,000$
GR1309 5,000$ 5,000$
NX0801 175,000$ 175,000$
NX0803 1,313,314$ 1,313,314$
NX1401 188,700$ 188,700$
OK1006 535,200$ (535,200)$ -$
RP1201 217,600$ (217,600)$ -$
RP1301 7,000$ 7,000$
RP1302 949,600$ (949,600)$ -$
RP1305 182,400$ (182,400)$ -$
RG0901 2,000$ 2,000$
RG1201 1,000$ 1,000$
SP1018 80,000$ 20,000$ 100,000$
SP1021 660,000$ (660,000)$ -$
SP1106 1,315,742$ (1,315,742)$ -$
SP1108 174,892$ 25,751$ 200,643$
SP1109 2,067,130$ 84,604$ 2,000,000$ 4,151,734$
SP1110 1,256,800$ (1,256,800)$ -$
SP1112 5,000$ 5,000$
SP1202 1,175,200$ (1,175,200)$ -$
SP1203 819,200$ (819,200)$ -$
SP1204 2,000$ 2,000$
FHWA Federal Funding Source
FY 2014
OZARKS TRANSPORTATION ORGANIZATION
2013-2016 Transportation Improvement Program
F19
FINANCIAL SUMMARY
- Roadways -
YEARLY SUMMARY
2014 Continued
PROJECT MoDOT Local Other TOTAL
STP STP-Urban NHS Safety ITS I/M 130 Bridge BRM BRO
SP1206 715,000$ 715,000$
SP1213 100,000$ 100,000$
SP1310 2,000$ 2,000$
SP1311 2,000$ 2,000$
SP1312 1,027,000$ 1,027,000$
SP1313 3,105,079$ 3,881,350$ 776,269$ 7,762,698$
SP1314 1,880,000$ 1,880,000$
SP1315 2,000$ 2,000$
SP1316 13,000$ 13,000$
SP1317 2,000$ 2,000$
SP1318 7,000$ 7,000$
SP1319 748,000$ 748,000$
SP1321 10,000$ 3,984$ 13,984$
SP1322 125,000$ 375,000$ 500,000$
SP1401 3,000$ 3,000$
ST1201 549,000$ 549,000$
WI1201 470,200$ (470,200)$ -$
WI1301 3,000$ 3,000$
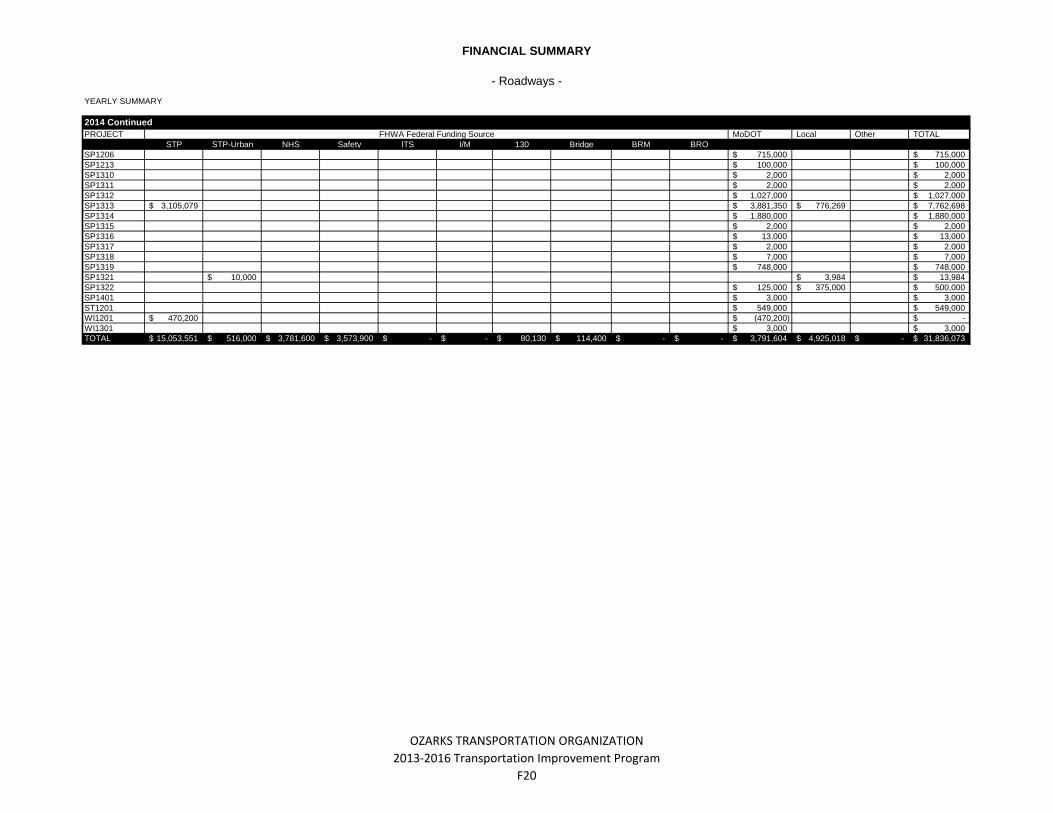
TOTAL 15,053,551$ 516,000$ 3,781,600$ 3,573,900$ -$ -$ 80,130$ 114,400$ -$ -$ 3,791,604$ 4,925,018$ -$ 31,836,073$
FHWA Federal Funding Source
OZARKS TRANSPORTATION ORGANIZATION
2013-2016 Transportation Improvement Program
F20
FINANCIAL SUMMARY
- Roadways -
YEARLY SUMMARY
PROJECT MoDOT Local Other TOTAL
STP STP-Urban NHS Safety ITS I/M 130 Bridge BRM BRO
MO1105 284,000$ 284,000$
MO1150 206,000$ 206,000$
MO1201 900$ 100$ 1,000$
MO1206 1,700,000$ 1,700,000$
MO1306 4,246,000$ 4,246,000$
MO1309 25,000$ 25,000$
MO1501 22,000$ 22,000$
MO1503 276,000$ 451,000$ 69,000$ 796,000$
CC0901 2,000$ 2,000$
CC1102 2,000$ 2,000$
CC1110 2,072,000$ 4,740,000$ 1,557,000$ 8,369,000$
CC1203 753,600$ (753,600)$ -$
CC1301 212,000$ (212,000)$ -$
CC1303 1,456,000$ (1,456,000)$ -$
GR1010 2,000$ 2,000$
GR1104 40,000$ 10,000$ 50,000$
GR1206 1,708,800$ 427,200$ 2,136,000$
GR1304 2,880,000$ 2,880,000$
GR1305 1,267,200$ (1,267,200)$ -$
GR1306 1,663,000$ 1,663,000$
GR1308 2,000$ 2,000$
NX0801 1,530,000$ 1,530,000$
NX0906 1,754,941$ (8,000)$ 1,746,941$ 3,493,882$
NX1501 150,000$ 150,000$
RP1301 1,422,000$ 1,422,000$
RG0901 2,000$ 2,000$
RG1201 1,000$ 1,000$
SP1018 5,639,200$ 1,409,800$ 7,049,000$
SP1108 3,295,436$ 1,189,657$ 4,711,276$ 4,127,755$ 13,324,124$
SP1109 658,533$ 5,329,258$ 1,190,415$ 7,178,206$
SP1112 50,000$ 50,000$
SP1114 160,000$ 40,000$ 200,000$
SP1120 4,000$ 1,000$ 5,000$
SP1204 2,000$ 2,000$
SP1206 668,000$ (668,000)$ -$
SP1310 241,000$ 241,000$
SP1311 28,000$ 28,000$
SP1312 821,600$ (821,600)$ -$
SP1313 5,240,822$ (5,240,822)$ -$
SP1314 1,427,920$ (1,427,920)$ -$
SP1315 753,000$ 753,000$
SP1316 2,361,000$ 2,361,000$
SP1317 689,000$ 689,000$
SP1318 1,453,000$ 1,453,000$
SP1319 601,600$ (601,600)$ -$
SP1321 10,000$ 3,984$ 13,984$
SP1322 47,610$ 232,390$ 280,000$
SP1401 5,000$ 5,000$
ST1101 468,000$ (468,000)$ -$
ST1201 546,800$ (546,800)$ -$
WI1301 5,000$ 5,000$
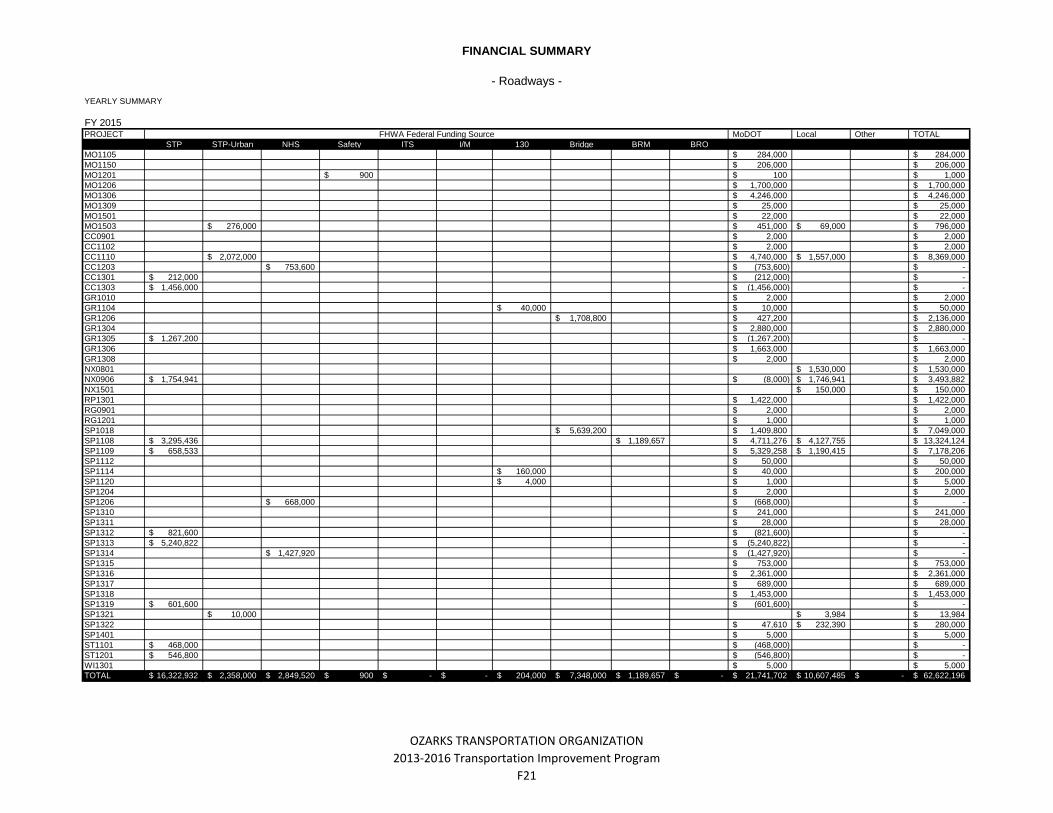
TOTAL 16,322,932$ 2,358,000$ 2,849,520$ 900$ -$ -$ 204,000$ 7,348,000$ 1,189,657$ -$ 21,741,702$ 10,607,485$ -$ 62,622,196$
FY 2015FHWA Federal Funding Source
OZARKS TRANSPORTATION ORGANIZATION
2013-2016 Transportation Improvement Program
F21

FINANCIAL SUMMARY
- Roadways -
YEARLY SUMMARY
PROJECT MoDOT Local Other TOTAL
STP STP-Urban NHS Safety ITS I/M 130 Bridge BRM BRO
MO1105 284,000$ 284,000$
MO1150 210,000$ 210,000$
MO1201 2,700$ 300$ 3,000$
MO1206 1,164,000$ 1,164,000$
MO1306 3,401,600$ (3,401,600)$ -$
MO1309 25,000$ 25,000$
MO1601 21,000$ 21,000$
MO1603 284,000$ 451,000$ 71,000$ 806,000$
CC0901 2,000$ 2,000$
CC1102 2,000$ 2,000$
CC1110 3,862,400$ (3,862,400)$ -$
GR1010 2,000$ 2,000$
GR1104 40,000$ 10,000$ 50,000$
GR1304 2,319,200$ (2,319,200)$ -$
GR1306 1,338,400$ (1,338,400)$ -$
NX1502 1,500,000$ 1,500,000$
RP1301 1,144,800$ (1,144,800)$ -$
RG0901 2,000$ 2,000$
RG01201 27,000$ 27,000$
SP1112 166,134$ 1,911,866$ 2,078,000$
SP1204 16,000$ 16,000$
SP1310 195,200$ (195,200)$ -$
SP1311 25,600$ (25,600)$ -$
SP1315 605,600$ (605,600)$ -$
SP1316 1,900,800$ (1,900,800)$ -$
SP1317 554,400$ (554,400)$ -$
SP1318 1,169,600$ (1,169,600)$ -$
SP1321 10,000$ 3,984$ 13,984$
SP1401 70,000.00 70,000$
WI1301 50,000.00 50,000$
TOTAL 6,934,400$ 294,000$ 9,583,200$ 2,700$ -$ 166,134$ 40,000$ -$ -$ -$ (12,269,434)$ 1,574,984$ -$ 6,325,984$
FY 2016FHWA Federal Funding Source
OZARKS TRANSPORTATION ORGANIZATION
2013-2016 Transportation Improvement Program
F22

FINANCIAL SUMMARY
- Roadways -
FINANCIAL CONSTRAINT
State
STP STP-Urban NHS Safety I/M 130 Bridge BRM BRO
TOTAL
Federal
Funds
MoDOT
Programmed
Funds
Operations and
Maintenance TOTAL Local Other TOTAL
2009
2013 Funds
Programmed 2,862,742$ 4,030,368$ -$ 1,708,800$ -$ 2,160,130$ 3,456,800$ -$ 2,632,800$ 16,851,640$ 25,496,519$ 6,245,959$ 48,594,118$ 5,639,809$ -$ 54,233,927$
2014 Funds
Programmed 15,053,551$ 516,000$ 3,781,600$ 3,573,900$ -$ 80,130$ 114,400$ -$ -$ 23,119,581$ 3,791,604$ 6,439,584$ 33,350,769$ 4,925,018$ -$ 38,275,787$
2015 Funds
Programmed 16,322,932$ 2,358,000$ 2,849,520$ 900$ -$ 204,000$ 7,348,000$ 1,189,657$ -$ 30,273,009$ 21,741,702$ 6,639,211$ 58,653,922$ 10,607,485$ -$ 69,261,407$
2016 Funds
Programmed 6,934,400$ 294,000$ 9,583,200$ 2,700$ 166,134$ 40,000$ -$ -$ -$ 17,020,434$ (12,269,434)$ 6,838,387$ 11,589,387$ 1,574,984$ -$ 13,164,371$
Total 41,173,625$ 7,198,368$ 16,214,320$ 5,286,300$ 166,134$ 2,484,260$ 10,919,200$ 1,189,657$ 2,632,800$ 87,264,664$ 38,760,391$ 26,163,141$ 152,188,196$ 22,747,296$ -$ 161,771,121$
Prior Year 2013 2014 2015 2016 TOTAL
Available State and
Federal Funding $0 $21,534,163 $28,611,163 $19,949,000 $31,800,000 $101,894,325
Available
Operations and
Maintenance
Funding $0 6,245,959$ 6,439,584$ 6,639,211$ 6,838,387$ $26,163,141
Available
Suballocated STP-
U $20,641,220 $4,346,528 $4,346,528 $4,346,528 $4,346,528 $38,027,332
Available
Suballocated BRM $1,420,249 $326,535.00 $326,535.00 $326,535.00 $326,535.00 $2,726,389
TOTAL AVAILABLE
FUNDING
$22,061,469 $32,453,185 $39,723,810 $31,261,274 $43,311,450 $168,811,187
Programmed State
and Federal
Funding $0 (48,594,118)$ (33,350,769)$ (58,653,922)$ (11,589,387)$ ($152,188,196)TOTAL
REMAINING $22,061,469 ($16,140,934) $6,373,041 ($27,392,648) $31,722,063 $16,622,991
Remaining State
and Federal
Funding ($15,742,705)
Remaining
Suballocated STP-
Urban $30,828,964
Remaining
Suballocated BRM $1,536,732TOTAL
REMAINING $16,622,991
FHWA Federal Funding Source
OZARKS TRANSPORTATION ORGANIZATION
2013-2016 Transportation Improvement Program
F23

TAB 3

TECHNICAL COMMITTEE AGENDA 3/20/2013; ITEM II.B.
Amendment Number Four to the FY 2013-2016 Transportation Improvement Program
Ozarks Transportation Organization (Springfield, MO Area MPO)
AGENDA DESCRIPTION: There are six items to be included as part of TIP Amendment Number Four to the FY 2013-2016 Transportation Improvement Program.
1. Safe Routes to School Program (EN1308)
MoDOT received a Safe Routes to School Grant for a mobile classroom, bike helmets, school guard training and equipment, and promotional items to support bicycle and pedestrian safety education in area for a total programmed amount of $74,990.
2. Ozark East Elementary Sidewalks (EN1309)
The City of Ozark received a Safe Routes to School Grant for Phase I of a sidewalk project for East Elementary, connecting the Autumn Meadows subdivision, along Samuel J. Street and 20th Avenue, with the school for a programmed amount of $152972.50.
3. West Sunshine Pavement Improvements (GR1306)
MoDOT is requesting acceleration of this project for the Southwest Pavement Plan, with funds programmed in 2014 and anticipated conversion in 2015. This includes pavement improvements on various sections of Sunshine Street from Kansas Expressway to James River Freeway for a total programmed amount of $1,841,000.
4. Route 60 Pavement Improvements (RP1301)
MoDOT is requesting acceleration of this project for the Southwest Pavement Plan, with funds programmed in 2014 and anticipated conversion in 2015. This includes pavement improvements on various sections of Route 60 from James River Freeway to Route 174 for a total programmed amount of $1,685,000.
5. Intersection Improvements at Kearney and Packer (SP1323)
MoDOT is requesting to do scoping for intersection improvements at Kearney Street and Packer Road in Springfield for a total programmed amount of $12,000.
6. Sound Abatement on James River Freeway (SP1324)
MoDOT is requesting to do scoping for sound abatement at various locations on James River Freeway from Kansas Expressway to Campbell Avenue for a total programmed amount of $22,000.
TECHNICAL PLANNING COMMITTEE ACTION REQUESTED: To make a recommendation to the Board of Directors on approving Amendment Number Four to the FY 2013-2016 TIP.

SHJJ
US65
SHNN
SHF
SHCC
3RD
JACKSON
SOUTH SH14
SHW
SH125
SHJ
SH14E9TH
SH14SOUTH
SH14
US65
US65
SH14
0 0.9 1.8
MilesAmendment #42013-2016 TIP
EN1309
OZARK

W I44
E I44
W JRF
S US6
5
S SHJ
E SHD
E US60
N US
65
E JRF
E DIVISION ST
N SH
AB
W SH266
W SHEE
N SH
125
S CAM
PBEL
L AVE
E KEARNEY ST
W US160
W US60
W SUNSHINE ST
E SHOO
W SHM
W KEARNEY ST
S NAT
IONA
L AVE
E GRAND ST
S SHZ
Z
E SUNSHINE ST
W CHESTNUT EXPY
W REPUBLIC ST
S SHN
N
S SHF
F
N NA
TIONA
L AVE
S SHM
M
E US60 EAST
E BATTLEFIELD RDW BATTLEFIELD RD
S FR1
63
S WES
TBYP
ASS
BYP
E CHESTNUT EXPY
N GL
ENST
ONE A
VEN
SHH
N KA
NSAS
EXPY
S KAN
SAS E
XPY N
GRAN
T AVE
N SH13
E REPUBLIC ST
W SHFF
S SHB
E FR192
E SH174
E SAINT LOUIS ST
W REPUBLIC RD
W GRAND ST
N SH13 HWY
W DIVISION ST W DIVISION ST
S US6
5
W US60
E US60
W I44
N US
65
W JRF
E JRF
E I44
0 2 4
MilesAmendment #42013-2016 TIP
GR1306
RP1301
SP1323
SP1324

PROGRAMMED IMPROVEMENTS
-Bicycle and Pedestrian-
PROPOSED
FHWA (SRTS) 74,990$ -$ -$ -$ 74,990$
MoDOT -$ -$ -$ -$ -$
MoDOT # N/A Local -$ -$ -$ -$ -$
TIP # EN1308 Other -$ -$ -$ -$ -$
FHWA (___) -$ -$ -$ -$ -$
MoDOT -$ -$ -$ -$ -$
Local -$ -$ -$ -$ -$
Other -$ -$ -$ -$ -$
Federal Source Agency FHWA FHWA (___) -$ -$ -$ -$ -$
Federal Funding Category SRTS MoDOT -$ -$ -$ -$ -$
MoDOT Funding Category Safe Routes to School Local -$ -$ -$ -$ -$
Work or Fund Category Program Other -$ -$ -$ -$ -$
Total Project Cost $74,990
PROPOSED
FHWA (SRTS) -$ -$ -$ -$ -$
MoDOT -$ -$ -$ -$ -$
MoDOT # N/A Local -$ -$ -$ -$ -$
TIP # EN1309 Other -$ -$ -$ -$ -$
FHWA (___) -$ -$ -$ -$ -$
MoDOT -$ -$ -$ -$ -$
Local -$ -$ -$ -$ -$
Other -$ -$ -$ -$ -$
Federal Source Agency FHWA FHWA (___) 152,973$ -$ -$ -$ 152,973$
Federal Funding Category SRTS MoDOT -$ -$ -$ -$ -$
MoDOT Funding Category Safe Routes to Schools Local -$ -$ -$ -$ -$
Work or Fund Category Construction Other -$ -$ -$ -$ -$
Total Project Cost $152,973
-$ 152,973$
Source of Funds: Safe Routes to School Program Balances
CO
N
TOTAL 152,973$ -$ -$
Project Title: EAST ELEMENTARY SIDEWALKSE
NG
Description: Phase 1 of 3. Sidewalk connections in and
between Autumn Meadows subdivision and
Ozark East Elementary, with sidewalk along S.
20th Ave. and E. Samuel J. Street.
RO
W
-$ 74,990$
Source of Funds: Safe Routes to School Program Balances
CITY OF OZARK Funding
Fiscal Year
2013 2014 2015 2016
-$
TOTALS
CO
N
TOTAL 74,990$ -$
TOTALS
Project Title: SAFE ROUTES TO SCHOOL PROGRAM
EN
G
Description: Mobile classroom, bike helmets, school guard
training and equipment, promotional items to
support bicycle and pedestrian safety education
in schools.
RO
W
AREA WIDE Funding
Fiscal Year
2013 2014 2015 2016
OZARKS TRANSPORTATION ORGANIZATION
2013-2016 Transportation Improvement Program
C20

FINANCIAL SUMMARY
- Bicycle and Pedestrian -
YEARLY SUMMARY
FY2013
PROJECT MoDOT Local Other TOTAL
Enhancement SRTS RTP STP-U STP
EN0808 489,600$ -$ -$ -$ -$ -$ 122,400$ -$ 612,000$
EN0817 364,800$ -$ -$ -$ -$ -$ 159,440$ -$ 524,240$
EN0818 268,800$ -$ -$ -$ -$ -$ 74,603$ -$ 343,403$
EN1002 -$ -$ -$ 50,000$ -$ -$ 12,500$ -$ 62,500$
EN1101 534,000$ -$ -$ -$ 75,200$ 175,300$ 156,500$ -$ 941,000$
EN1102 -$ -$ -$ -$ 200,000$ -$ 50,000$ -$ 250,000$
EN1111 -$ -$ -$ 200,000$ -$ -$ 178,286$ 2,500$ 380,786$
EN1112 219,840$ -$ -$ -$ -$ -$ 237,043$ -$ 456,883$
EN1113 216,000$ -$ -$ -$ -$ -$ 54,000$ -$ 270,000$
EN1301 240,000$ -$ -$ -$ -$ -$ 60,000$ -$ 300,000$
EN1302 240,000$ -$ -$ -$ -$ -$ 60,000$ -$ 300,000$
EN1303 200,000$ -$ -$ -$ -$ -$ 50,000$ -$ 250,000$
EN1304 165,587$ -$ -$ -$ -$ -$ 70,966$ -$ 236,553$
EN1305 220,413$ -$ -$ -$ -$ -$ 179,587$ -$ 400,000$
EN1306 320,000$ -$ -$ -$ -$ -$ 80,000$ -$ 400,000$
EN1307 200,000$ -$ -$ -$ -$ -$ 50,000$ -$ 250,000$
EN1308 -$ 74,990$ -$ -$ -$ -$ -$ -$ 74,990$
EN1309 -$ 152,973$ -$ -$ -$ -$ -$ -$ 152,973$
TOTAL 3,679,040$ 227,963$ -$ 250,000$ 275,200$ 175,300$ 1,595,325$ 2,500$ 6,205,328$
FY2014
PROJECT MoDOT Local Other TOTAL
Enhancement SRTS RTP STP-U STP
-$ -$ -$ -$ -$ -$ -$ -$ -$
TOTAL -$ -$ -$ -$ -$ -$ -$ -$ -$
FY2015
PROJECT MoDOT Local Other TOTAL
Enhancement SRTS RTP STP-U STP
None -$ -$ -$ -$ -$ -$ -$ -$ -$
TOTAL -$ -$ -$ -$ -$ -$ -$ -$ -$
FY2016
PROJECT MoDOT Local Other TOTAL
Enhancement SRTS RTP STP-U STP
-$ -$ -$ -$ -$ -$ -$ -$
TOTAL -$ -$ -$ -$ -$ -$ -$ -$ -$
MoDOT Local Other TOTAL
Enhancement SRTS RTP STP-U STP
TOTAL
PROGRAM 3,679,040$ 227,963$ - 250,000.00 275,200$ 175,300$ 1,595,325$ 2,500$ 6,205,328$
Federal Funding Source
Federal Funding Source
Federal Funding Source
Federal Funding Source
Federal Funding Source
OZARKS TRANSPORTATION ORGANIZATION
2013-2016 Transportation Improvement Program
F15

FINANCIAL SUMMARY
- Bicycle and Pedestrian -
Enhancement SRTS RTP STP-U STP MoDOT Local Other TOTAL2009
PRIOR YEAR
Balance $0 $0 $0 $0 $0 $0 $0 $0 $0
2013
Funds Anticipated 4,029,040$ 227,963$ -$ 250,000$ 275,200$ 175,300$ 1,595,325$ 2,500$ 6,555,328
Funds Programmed (3,679,040)$ (227,963)$ -$ (250,000)$ (275,200)$ (175,300)$ (1,595,325)$ (2,500)$ (6,205,328)$
Running Balance $350,000 $0 $0 $0 $0 $0 $0 $0 $350,000
2014
Funds Anticipated 550,000$ -$ -$ -$ -$ -$ -$ -$ 550,000
Funds Programmed -$ -$ -$ -$ -$ -$ -$ -$ -$
Running Balance $900,000 $0 $0 $0 $0 $0 $0 $0 $900,000
2015
Funds Anticipated 550,000$ -$ -$ -$ -$ -$ -$ -$ 550,000
Funds Programmed -$ -$ -$ -$ -$ -$ -$ -$ 0
Running Balance $1,450,000 $0 $0 $0 $0 $0 $0 $0 $1,450,000
2016
Funds Anticipated 550,000$ -$ -$ -$ -$ -$ -$ -$ 550,000
Funds Programmed -$ -$ -$ -$ -$ -$ -$ -$ 0
Running Balance $2,000,000 $0 $0 $0 $0 $0 $0 $0 $2,000,000
Funding Source
FINANCIAL CONSTRAINTS
OZARKS TRANSPORTATION ORGANIZATION
2013-2016 Transportation Improvement Program
F16

PROGRAMMED IMPROVEMENTS
-Roadways-
ORIGINAL
FHWA (STP) -$ -$ -$ 90,400$ 90,400$
MoDOT 2,000$ 8,000$ 103,000$ (90,400)$ 22,600$
MoDOT # 8S3003 Local -$ -$ -$ -$ -$
TIP # GR1306 Other -$ -$ -$ -$ -$
FHWA (___) -$ -$ -$ -$ -$
MoDOT -$ -$ -$ -$ -$
Local -$ -$ -$ -$ -$
Other -$ -$ -$ -$ -$
Federal Source Agency FHWA FHWA (STP) -$ -$ -$ 1,248,000$ 1,248,000$
Federal Funding Category STP MoDOT -$ -$ 1,560,000$ (1,248,000)$ 312,000$
MoDOT Funding Category Taking Care of the System Local -$ -$ -$ -$ -$
Work or Fund Category Construction Other -$ -$ -$ -$ -$
Total Project Cost $1,673,000
PROPOSED
FHWA (STP) -$ -$ 108,800$ -$ 108,800$
MoDOT 2,000$ 136,000$ (108,800)$ -$ 29,200$
MoDOT # 8S3003 Local -$ -$ -$ -$ -$
TIP # GR1306 Other -$ -$ -$ -$ -$
FHWA (___) -$ -$ -$ -$ -$
MoDOT -$ -$ -$ -$ -$
Local -$ -$ -$ -$ -$
Other -$ -$ -$ -$ -$
Federal Source Agency FHWA FHWA (STP) -$ -$ 1,362,400$ -$ 1,362,400$
Federal Funding Category STP MoDOT -$ 1,703,000$ (1,362,400)$ -$ 340,600$
MoDOT Funding Category Taking Care of the System Local -$ -$ -$ -$ -$
Work or Fund Category Construction Other -$ -$ -$ -$ -$
Total Project Cost $1,841,000
-$ 1,841,000$
Source of MoDOT Funds: State transportation revenues. Advance Construction with anticipated
conversion in FY 2015.
CO
N
TOTAL 2,000$ 1,839,000$ -$
TOTALS
Project Title: WEST SUNSHINE PAVEMENT
IMPROVEMENTS
EN
G
Description: Pavement improvements on various sections of
Sunshine Street (Route 413) from Kansas
Expressway (Route 13) to James River Freeway
(Route 60) in Springfield.
RO
W
-$ 1,673,000$
Source of MoDOT Funds: State transportation revenues. Advance Construction with anticipated
conversion in FY 2016.
GREENE COUNTY Funding
Fiscal Year
2013 2014 2015 2016
CO
N
TOTAL 2,000$ 8,000$ 1,663,000$
TOTALS
Project Title: WEST SUNSHINE PAVEMENT
IMPROVEMENTS
EN
G
Description: Pavement improvements on various sections of
Sunshine Street (Route 413) from Kansas
Expressway (Route 13) to James River Freeway
(Route 60) in Springfield.
RO
W
GREENE COUNTY Funding
Fiscal Year
2013 2014 2015 2016
OZARKS TRANSPORTATION ORGANIZATION
2013-2016 Transportation Improvement Program
D85

PROGRAMMED IMPROVEMENTS
-Roadways-
GREENE COUNTY Funding
Fiscal Year
ORIGINAL
FHWA (STP) -$ -$ -$ 77,600$ 77,600$
MoDOT 2,000$ 7,000$ 88,000$ (77,600)$ 19,400$
MoDOT # 8P3004 Local -$ -$ -$ -$ -$
TIP # RP1301 Other -$ -$ -$ -$ -$
FHWA (___) -$ -$ -$ -$ -$
MoDOT -$ -$ -$ -$ -$
Local -$ -$ -$ -$ -$
Other -$ -$ -$ -$ -$
Federal Source Agency FHWA FHWA (STP) -$ -$ -$ 1,067,200$ 1,067,200$
Federal Funding Category STP MoDOT -$ -$ 1,334,000$ (1,067,200)$ 266,800$
MoDOT Funding Category Taking Care of the System Local -$ -$ -$ -$ -$
Work or Fund Category Construction Other -$ -$ -$ -$ -$
Total Project Cost $1,431,000
PROPOSED
FHWA (STP) -$ -$ 88,800$ -$ 88,800$
MoDOT 2,000$ 111,000$ (88,800)$ -$ 24,200$
MoDOT # 8P3004 Local -$ -$ -$ -$ -$
TIP # RP1301 Other -$ -$ -$ -$ -$
FHWA (___) -$ -$ -$ -$ -$
MoDOT -$ -$ -$ -$ -$
Local -$ -$ -$ -$ -$
Other -$ -$ -$ -$ -$
Federal Source Agency FHWA FHWA (STP) -$ -$ 1,257,600$ -$ 1,257,600$
Federal Funding Category STP MoDOT -$ 1,572,000$ (1,257,600)$ -$ 314,400$
MoDOT Funding Category Taking Care of the System Local -$ -$ -$ -$ -$
Work or Fund Category Construction Other -$ -$ -$ -$ -$
Total Project Cost $1,685,000
CITY OF REPUBLIC Funding
Fiscal Year
2013 2014 2015 2016
CO
N
TOTAL 2,000$ 1,683,000$ -$
TOTALS
Project Title: ROUTE 60 PAVEMENT IMPROVEMENTSE
NG
Description: Pavement improvements on various sections of Route
60 from Route 174 to the James River Freeway (Route
360/60) in Republic.
RO
W
-$ 1,685,000$
Source of MoDOT Funds: State transportation revenues. Advance Construction with anticipated
conversion in FY 2015.
CO
N
TOTAL 2,000$ 7,000$ 1,422,000$
TOTALS
Project Title: ROUTE 60 PAVEMENT IMPROVEMENTS
EN
G
Description: Pavement improvements on various sections of Route
60 from Route 174 to the James River Freeway (Route
360/60) in Republic.
RO
W
CITY OF REPUBLIC Funding
Fiscal Year
2013 2014 2015 2016
-$ 1,431,000$
Source of MoDOT Funds: State transportation revenues. Advance Construction with anticipated
conversion in FY 2016.
OZARKS TRANSPORTATION ORGANIZATION
2013-2016 Transportation Improvement Program
D86

PROGRAMMED IMPROVEMENTS
-Roadways-
GREENE COUNTY Funding
Fiscal Year
PROPOSED
FHWA (STP) -$ -$ -$ 10,000$ 10,000$
MoDOT 12,000$ -$ -$ (10,000)$ 2,000$
MoDOT # 8S3019 Local -$ -$ -$ -$ -$
TIP # SP1323 Other -$ -$ -$ -$ -$
FHWA (___) -$ -$ -$ -$ -$
MoDOT -$ -$ -$ -$ -$
Local -$ -$ -$ -$ -$
Other -$ -$ -$ -$ -$
Federal Source Agency FHWA FHWA (STP) -$ -$ -$ -$ -$
Federal Funding Category STP MoDOT -$ -$ -$ -$ -$
MoDOT Funding Category Major Projects and Emerging Needs. Local -$ -$ -$ -$ -$
Work or Fund Category Engineering Other -$ -$ -$ -$ -$
Total Project Cost $1,000,000 - $2,000,000
PROPOSED
FHWA (STP) -$ -$ -$ 18,000$ 18,000$
MoDOT 22,000$ -$ -$ (18,000)$ 4,000$
MoDOT # 8P3020 Local -$ -$ -$ -$ -$
TIP # SP1324 Other -$ -$ -$ -$ -$
FHWA (___) -$ -$ -$ -$ -$
MoDOT -$ -$ -$ -$ -$
Local -$ -$ -$ -$ -$
Other -$ -$ -$ -$ -$
Federal Source Agency FHWA FHWA (STP) -$ -$ -$ -$ -$
Federal Funding Category STP MoDOT -$ -$ -$ -$ -$
MoDOT Funding Category Major Projects and Emerging Needs Local -$ -$ -$ -$ -$
Work or Fund Category Engineering Other -$ -$ -$ -$ -$
Total Project Cost $450,000 - $500,000
-$ 22,000$
Source of MoDOT Funds: District operating budget. Advance Construction with anticipated
conversion in FY 2015.
CO
N
TOTAL 22,000$ -$ -$
TOTALS
Project Title: SOUND ABATEMENT ON JAMES RIVER
FREEWAY
EN
G
Description: Scoping for sound abatement at various locations on
James River Freeway (Route 60) from Kansas
Expressway to Campbell Avenue.
RO
W
-$ 12,000$
Source of MoDOT Funds: District operating budget. Advance Construction with anticipated
conversion in FY 2015.
CITY OF SPRINGFIELD Funding
Fiscal Year
2013 2014 2015 2016
CITY OF SPRINGFIELD Funding
Fiscal Year
2013 2014 2015 2016
CO
N
TOTAL 12,000$ -$ -$
TOTALS
Project Title: INTERSECTION IMPROVEMENTS AT
KEARNEY AND PACKER
EN
G
Description: Scoping for intersection improvements at Kearney
Street (Route 744) and Packer Road in Springfield.
RO
W
OZARKS TRANSPORTATION ORGANIZATION
2013-2016 Transportation Improvement Program
D87
FINANCIAL SUMMARY
- Roadways -
YEARLY SUMMARY
PROJECT MoDOT Local Other TOTAL
STP STP-Urban NHS Safety ITS I/M 130 Bridge BRM BRO
MO1105 284,000$ 284,000$
MO1106 7,000$ 7,000$
MO1107 27,000$ 3,000$ 30,000$
MO1150 195,000$ 195,000$
MO1201 900$ 100$ 1,000$
MO1206 13,000$ 13,000$
MO1303 260,000$ 451,000$ 65,000$ 776,000$
MO1304 39,000$ 39,000$
MO1306 4,000$ 4,000$
MO1308 25,000$ 25,000$
MO1309 25,000$ 25,000$
CC0901 2,000$ 2,000$
CC1102 2,000$ 2,000$
CC1110 22,000$ 22,000$
CC1201 288,000$ 32,000$ 320,000$
CC1202 1,800$ 200$ 2,000$
CC1203 447,000$ 447,000$
CC1301 1,000$ 1,000$
CC1302 504,000$ 56,000$ 560,000$
CC1303 12,000$ 12,000$
CC1304 11,700$ 1,300$ 13,000$
CC1305 2,700$ 300$ 3,000$
CC1306 2,984,000$ 2,984,000$
CC1307 10,000$ 10,000$
CC1401 11,700$ 1,300$ 13,000$
GR0909 320,000$ 80,000$ 400,000$
GR1010 2,000$ 2,000$
GR1206 33,600$ 8,400$ 42,000$
GR1212 960,000$ 240,000$ 1,200,000$
GR1213 1,133,600$ 283,400$ 1,417,000$
GR1302 160,000$ 40,000$ 200,000$
GR1303 4,486,000$ 4,486,000$
GR1304 2,000$ 2,000$
GR1305 10,000$ 10,000$
GR1306 2,000$ 2,000$
GR1307 216,000$ 216,000$
GR1308 2,000$ 2,000$
GR1309 290,848$ 5,000$ 1,674,367$ 1,970,215$
GR1310 861,000$ 1,047,000$ 1,908,000$
GR1311 168,000$ 42,000$
GR1312 371,200$ 92,800$
NX0601 1,989,600$ 633,400$ 2,623,000$
NX0701 301,920$ 75,480$ 377,400$
NX1201 30,000$ 30,000$
NX1301 189,000$ 189,000$
OK1004 2,433,600$ 608,400$ 3,042,000$
OK1006 723,000$ 767,000$ 20,000$ 1,510,000$
OK1101 909,600$ 227,400$ 1,137,000$
RP1201 272,000$ 272,000$
RP1301 2,000$ 2,000$
RP1302 1,187,000$ 1,187,000$
RP1303 64,000$ 16,000$ 80,000$
RP1304 50,000$ 50,000$
RP1305 228,000$ 228,000$
FY 2013FHWA Federal Funding Source
OZARKS TRANSPORTATION ORGANIZATION
2013-2016 Transportation Improvement Program
F17

FINANCIAL SUMMARY
- Roadways -
YEARLY SUMMARY
2013 Continued
PROJECT MoDOT Local Other TOTAL
STP STP-Urban NHS Safety ITS I/M 130 Bridge BRM BRO
RG0901 2,000$ 2,000$
RG1201 1,000$ 1,000$
SP1018 80,000$ 20,000$ 100,000$
SP1021 825,000$ 825,000$
SP1106 100,000$ 1,349,942$ 1,178,942$ 2,628,884$
SP1107 830,000$ 830,000$
SP1108 25,000$ 25,000$
SP1109 2,000$ 2,000$
SP1110 1,571,000$ 1,571,000$
SP1112 5,000$ 5,000$
SP1113 80,000$ 20,000$ 100,000$
SP1115 160,000$ 40,000$ 200,000$
SP1202 1,469,000$ 1,469,000$
SP1203 1,024,000$ 1,024,000$
SP1204 2,000$ 2,000$
SP1206 120,000$ 120,000$
SP1212 160,000$ 40,000$ 200,000$
SP1213 100,000$ 100,000$
SP1302 80,000$ 20,000$ 100,000$
SP1303 160,000$ 40,000$ 200,000$
SP1304 160,000$ 40,000$ 200,000$
SP1305 160,000$ 40,000$ 200,000$
SP1306 160,000$ 40,000$ 200,000$
SP1307 160,000$ 40,000$ 200,000$
SP1308 160,000$ 40,000$ 200,000$
SP1309 160,000$ 40,000$ 200,000$
SP1310 1,000$ 1,000$
SP1311 2,000$ 2,000$
SP1312 6,000$ 6,000$
SP1313 2,135,742$ 2,669,677$ 533,936$ 5,339,355$
SP1314 12,000$ 12,000$
SP1315 2,000$ 2,000$
SP1316 2,000$ 2,000$
SP1317 2,000$ 2,000$
SP1318 2,000$ 2,000$
SP1319 4,000$ 4,000$
SP1320 627,000$ 109,500$ 110,500$ 847,000$
SP1321 10,000$ 3,984$ 13,984$
SP1322 190,000$ 560,000$ 750,000$
SP1323 12,000$ 12,000$
SP1324 22,000$ 22,000$
SP1401 2,000$ 2,000$
ST1201 133,000$ 133,000$
ST1204 400,000$ 100,000$ 500,000$
WI1201 21,000$ 593,000$ 614,000$
WI1301 2,000$ 2,000$
TOTAL 2,862,742$ 4,030,368$ -$ 1,708,800$ -$ -$ 2,160,130$ 3,456,800$ -$ 2,632,800$ 25,530,519$ 5,639,809$ -$ 47,347,838$
FHWA Federal Funding Source
OZARKS TRANSPORTATION ORGANIZATION
2013-2016 Transportation Improvement Program
F18

FINANCIAL SUMMARY
- Roadways -
YEARLY SUMMARY
PROJECT MoDOT Local Other TOTAL
STP STP-Urban NHS Safety ITS I/M 130 Bridge BRM BRO
FHWA Federal Funding Source
MO1105 284,000$ 284,000$
MO1107 13,500$ 1,500$ 15,000$
MO1150 202,000$ 202,000$
MO1201 900$ 100$ 1,000$
MO1206 2,230,000$ 2,230,000$
MO1306 2,000$ 2,000$
MO1309 25,000$ 25,000$
MO1401 29,000$ 29,000$
MO1403 268,000$ 451,000$ 67,000$ 786,000$
CC0901 2,000$ 2,000$
CC1102 2,000$ 2,000$
CC1110 238,000$ 166,000$ 404,000$
CC1201 1,885,500$ 209,500$ 2,095,000$
CC1202 274,500$ 30,500$ 305,000$
CC1203 495,000$ 495,000$
CC1301 105,000$ 264,000$ 369,000$
CC1302 967,500$ 107,500$ 1,075,000$
CC1303 1,808,000$ 1,808,000$
CC1304 104,400$ 11,600$ 116,000$
CC1305 146,700$ 16,300$ 163,000$
CC1306 2,387,200$ (2,387,200)$ -$
CC1401 180,900$ 20,100$ 201,000$
GR1010 2,000$ 2,000$
GR1104 80,000$ 20,000$ 100,000$
GR1206 34,400$ 8,600$ 43,000$
GR1303 3,588,800$ (3,588,800)$ -$
GR1304 17,000$ 17,000$
GR1305 1,574,000$ 1,574,000$
GR1306 1,839,000$ 1,839,000$
GR1308 2,000$ 2,000$
GR1309 5,000$ 5,000$
NX0801 175,000$ 175,000$
NX0803 1,313,314$ 1,313,314$
NX1401 188,700$ 188,700$
OK1006 535,200$ (535,200)$ -$
RP1201 217,600$ (217,600)$ -$
RP1301 1,683,000$ 1,683,000$
RP1302 949,600$ (949,600)$ -$
RP1305 182,400$ (182,400)$ -$
RG0901 2,000$ 2,000$
RG1201 1,000$ 1,000$
SP1018 80,000$ 20,000$ 100,000$
SP1021 660,000$ (660,000)$ -$
SP1106 1,315,742$ (1,315,742)$ -$
SP1108 174,892$ 25,751$ 200,643$
SP1109 2,067,130$ 84,604$ 2,000,000$ 4,151,734$
SP1110 1,256,800$ (1,256,800)$ -$
SP1112 5,000$ 5,000$
SP1202 1,175,200$ (1,175,200)$ -$
SP1203 819,200$ (819,200)$ -$
SP1204 2,000$ 2,000$
FHWA Federal Funding Source
FY 2014
OZARKS TRANSPORTATION ORGANIZATION
2013-2016 Transportation Improvement Program
F19

FINANCIAL SUMMARY
- Roadways -
YEARLY SUMMARY
2014 Continued
PROJECT MoDOT Local Other TOTAL
STP STP-Urban NHS Safety ITS I/M 130 Bridge BRM BRO
SP1206 715,000$ 715,000$
SP1213 100,000$ 100,000$
SP1310 2,000$ 2,000$
SP1311 2,000$ 2,000$
SP1312 1,027,000$ 1,027,000$
SP1313 3,105,079$ 3,881,350$ 776,269$ 7,762,698$
SP1314 1,880,000$ 1,880,000$
SP1315 2,000$ 2,000$
SP1316 13,000$ 13,000$
SP1317 2,000$ 2,000$
SP1318 7,000$ 7,000$
SP1319 748,000$ 748,000$
SP1321 10,000$ 3,984$ 13,984$
SP1322 125,000$ 375,000$ 500,000$
SP1401 3,000$ 3,000$
ST1201 549,000$ 549,000$
WI1201 470,200$ (470,200)$ -$
WI1301 3,000$ 3,000$
TOTAL 15,053,551$ 516,000$ 3,781,600$ 3,573,900$ -$ -$ 80,130$ 114,400$ -$ -$ 7,298,604$ 4,925,018$ -$ 35,343,073$
FHWA Federal Funding Source
OZARKS TRANSPORTATION ORGANIZATION
2013-2016 Transportation Improvement Program
F20

FINANCIAL SUMMARY
- Roadways -
YEARLY SUMMARY
PROJECT MoDOT Local Other TOTAL
STP STP-Urban NHS Safety ITS I/M 130 Bridge BRM BRO
MO1105 284,000$ 284,000$
MO1150 206,000$ 206,000$
MO1201 900$ 100$ 1,000$
MO1206 1,700,000$ 1,700,000$
MO1306 4,246,000$ 4,246,000$
MO1309 25,000$ 25,000$
MO1501 22,000$ 22,000$
MO1503 276,000$ 451,000$ 69,000$ 796,000$
CC0901 2,000$ 2,000$
CC1102 2,000$ 2,000$
CC1110 2,072,000$ 4,740,000$ 1,557,000$ 8,369,000$
CC1203 753,600$ (753,600)$ -$
CC1301 212,000$ (212,000)$ -$
CC1303 1,456,000$ (1,456,000)$ -$
GR1010 2,000$ 2,000$
GR1104 40,000$ 10,000$ 50,000$
GR1206 1,708,800$ 427,200$ 2,136,000$
GR1304 2,880,000$ 2,880,000$
GR1305 1,267,200$ (1,267,200)$ -$
GR1306 1,471,200$ (1,471,200)$ -$
GR1308 2,000$ 2,000$
NX0801 1,530,000$ 1,530,000$
NX0906 1,754,941$ (8,000)$ 1,746,941$ 3,493,882$
NX1501 150,000$ 150,000$
RP1301 1,346,400$ (1,346,400)$ -$
RG0901 2,000$ 2,000$
RG1201 1,000$ 1,000$
SP1018 5,639,200$ 1,409,800$ 7,049,000$
SP1108 3,295,436$ 1,189,657$ 4,711,276$ 4,127,755$ 13,324,124$
SP1109 658,533$ 5,329,258$ 1,190,415$ 7,178,206$
SP1112 50,000$ 50,000$
SP1114 160,000$ 40,000$ 200,000$
SP1120 4,000$ 1,000$ 5,000$
SP1204 2,000$ 2,000$
SP1206 668,000$ (668,000)$ -$
SP1310 241,000$ 241,000$
SP1311 28,000$ 28,000$
SP1312 821,600$ (821,600)$ -$
SP1313 5,240,822$ (5,240,822)$ -$
SP1314 1,427,920$ (1,427,920)$ -$
SP1315 753,000$ 753,000$
SP1316 2,361,000$ 2,361,000$
SP1317 689,000$ 689,000$
SP1318 1,453,000$ 1,453,000$
SP1319 601,600$ (601,600)$ -$
SP1321 10,000$ 3,984$ 13,984$
SP1322 47,610$ 232,390$ 280,000$
SP1401 5,000$ 5,000$
ST1101 468,000$ (468,000)$ -$
ST1201 546,800$ (546,800)$ -$
WI1301 5,000$ 5,000$
TOTAL 19,140,532$ 2,358,000$ 2,849,520$ 900$ -$ -$ 204,000$ 7,348,000$ 1,189,657$ -$ 15,839,102$ 10,607,485$ -$ 59,537,196$
FY 2015FHWA Federal Funding Source
OZARKS TRANSPORTATION ORGANIZATION
2013-2016 Transportation Improvement Program
F21

FINANCIAL SUMMARY
- Roadways -
YEARLY SUMMARY
PROJECT MoDOT Local Other TOTAL
STP STP-Urban NHS Safety ITS I/M 130 Bridge BRM BRO
MO1105 284,000$ 284,000$
MO1150 210,000$ 210,000$
MO1201 2,700$ 300$ 3,000$
MO1206 1,164,000$ 1,164,000$
MO1306 3,401,600$ (3,401,600)$ -$
MO1309 25,000$ 25,000$
MO1601 21,000$ 21,000$
MO1603 284,000$ 451,000$ 71,000$ 806,000$
CC0901 2,000$ 2,000$
CC1102 2,000$ 2,000$
CC1110 3,862,400$ (3,862,400)$ -$
GR1010 2,000$ 2,000$
GR1104 40,000$ 10,000$ 50,000$
GR1304 2,319,200$ (2,319,200)$ -$
GR1306 -$
NX1502 1,500,000$ 1,500,000$
RP1301 -$
RG0901 2,000$ 2,000$
RG01201 27,000$ 27,000$
SP1112 166,134$ 1,911,866$ 2,078,000$
SP1204 16,000$ 16,000$
SP1310 195,200$ (195,200)$ -$
SP1311 25,600$ (25,600)$ -$
SP1315 605,600$ (605,600)$ -$
SP1316 1,900,800$ (1,900,800)$ -$
SP1317 554,400$ (554,400)$ -$
SP1318 1,169,600$ (1,169,600)$ -$
SP1321 10,000$ 3,984$ 13,984$
SP1323 10,000$ (10,000)$ -$
SP1324 18,000$ (18,000)$ -$
SP1401 70,000.00 70,000$
WI1301 50,000.00 50,000$
TOTAL 4,479,200$ 294,000$ 9,583,200$ 2,700$ -$ 166,134$ 40,000$ -$ -$ -$ (9,814,234)$ 1,574,984$ -$ 6,325,984$
FY 2016FHWA Federal Funding Source
OZARKS TRANSPORTATION ORGANIZATION
2013-2016 Transportation Improvement Program
F22

TAB 4

TECHNICAL PLANNING COMMITTEE AGENDA 3/20/2013; ITEM II.C.
FY 2014 Unified Planning Work Program (UPWP)
Ozarks Transportation Organization (Springfield, MO Area MPO)
AGENDA DESCRIPTION:
OTO is required on an annual basis to prepare a Unified Planning Work Program (UPWP), which includes plans and programs the MPO will undertake during the fiscal year. The UPWP is programmed into the following tasks:
Task 010 – OTO General Administration Task 020 – OTO Committee Support Task 030 – General Planning and Plan Implementation Task 040 – Project Selection and Programming Task 050 – Transportation Demand Management Task 060 – OTO and City Utilities Transit Planning Task 070 – Special Studies and Related Projects The UPWP contains the proposed budget for FY 2014. The budget is based on the federal funds available and the local 20 percent match. The OTO portion of the budget for FY 2014 is shown below:
Ozarks Transportation Organization FY 2013 FY2014 Consolidated FHWA/FTA PL Funds $666,439.02 $ 721,534.40 Local Jurisdiction Match Funds $128,648.76 $ 96,803.60 In-Kind Match, Direct Cost, Donated $ 27,961.00 $ 75,000.00 City Of Springfield Aerial Match $ 10,000.00 $ -- Employee Insurance Premium $ -- $ 8,580.00 Total OTO Revenue $833,048.78 $901,918.00
The total UPWP budget also includes FTA 5307 Transit Funds going directly to City Utilities in the amount of $158,000. City Utilities is providing the local match in the amount of $39,500. The total budget amount for FY 2014 UPWP is $1,099,418. OTO is utilizing In-Kind Match, Direct Cost, and Donated City Utilities Match Funds. These additional match sources allow OTO to build an operating fund balance. The UPWP Subcommittee met on January 28, 2013 and voted to recommend the Draft FY 2014 UPWP to the Technical Planning Committee.
TECHNICAL PLANNING COMMITTEE ACTION REQUESTED: That a member of the Technical Planning Committee make a recommendation to the Board of Directors to approve the FY 2014 UPWP.

APPROVED BY OTO BOARD OF DIRECTORS:
APPROVED BY ONEDOT:
OZARKS TRANSPORTATION ORGANIZATION
METROPOLITAN PLANNING ORGANIZATION (MPO)
UNIFIED PLANNING WORK PROGRAM FISCAL YEAR 2014
(July 1, 2013 – June 30, 2014)
Ozarks Transportation Organization
Metropolitan Planning Organization Staff
Directed by the Ozarks Transportation Organization Metropolitan Planning Organization, which is composed of the:
City of Battlefield City of Nixa
City of Ozark City of Republic
City of Springfield City of Strafford City of Willard
Christian County Greene County
Missouri Department of Transportation (Non-Voting) Federal Highway Administration (Non-Voting) Federal Transit Administration (Non-Voting)

The MPO fully complies with Title VI of the Civil Rights Act of 1964 and related statutes and regulations in all programs and activities. The MPO does not discriminate on the basis of race, color, national origin, English proficiency, religious creed, disability, age, sex. Any person who believes he/she or any specific class of persons has been subjected to discrimination prohibited by Title VI or related statutes or regulations may, herself/himself or via a representative, file a written complaint with the MPO. A complaint must be filed no later than 180 calendar days after the date on which the person believes the discrimination occurred. A complaint form and additional information can be obtained by contacting the MPO (see below) or at www.ozarkstransportation.org.
For additional copies of this document or to request it in an accessible format, contact:
By mail: Ozarks Transportation Organization 205 Park Central East, Suite 205 Springfield, MO 65806 By Telephone: 417-865-3042, Ext. 100
By Fax: 417-862-6013
By Email [email protected]
Or download it by going to www.ozarkstransportation.org.
The preparation of this report was financed in part by Metropolitan Planning Funds from the Federal Transit Administration and Federal Highway Administration, administered by the Missouri Department of Transportation. Its contents do not necessarily reflect the official views or policies of the U.S. DOT.

i
Table of Contents
Table of Contents .............................................................................................................................. i
Introduction ...................................................................................................................................... 1
Task 010 – OTO General Administration ....................................................................................... 2
Task 020 – OTO Committee Support ............................................................................................... 5
Task 030 – General Planning and Plan Implementation .................................................................. 7
Task 040 – Project Selection and Programming ............................................................................ 11
Task 050 – Transportation Demand Management ......................................................................... 13
Task 060 – OTO and City Utilities Transit Planning ..................................................................... 14
Task 070 – Special Studies and Related Projects ........................................................................... 18
Financial Revenues and Expenditures Summary ........................................................................... 20
OTO Boundary Map ....................................................................................................................... 22
OTO Organization Chart ................................................................................................................ 23
Appendix A
Budget Summary ............................................................................................................................ 24
Appendix B
Anticipated Consultant Usage ........................................................................................................ 26
Appendix C
OTO Budget Detail ........................................................................................................................ 26

1
Introduction
The Unified Planning Work Program (UPWP) is a description of the proposed activities of the Ozarks Transportation Organization during Fiscal Year 2014 (July 2013 - June 2014). The program is prepared annually and serves as a basis for requesting federal planning funds from the U. S. Department of Transportation. All tasks are to be completed by OTO staff unless otherwise identified.
It also serves as a management tool for scheduling, budgeting, and monitoring the planning activities of the participating agencies. This document was prepared by staff from the Ozarks Transportation Organization (OTO), the Springfield Area Metropolitan Planning Organization (MPO), with assistance from various agencies, including the Missouri Department of Transportation (MoDOT), the Federal Highway Administration (FHWA), the Federal Transit Administration (FTA), City Utilities (CU) Transit, Missouri State University Transportation Department, and members of the OTO Technical Planning Committee consisting of representatives from each of the nine OTO jurisdictions. Federal funding is received through a Federal Transportation Grant from the Federal Highway Administration and the Federal Transit Administration, known as a Consolidated Planning Grant (CPG).
The implementation of this document is a cooperative process of the OTO, Missouri Department of Transportation, the Federal Highway Administration, the Federal Transit Administration, City Utilities Transit, Missouri State University Transportation Department, and members of the OTO Technical Planning Committee and Board of Directors.
The Ozarks Transportation Organization’s Public Participation Plan may be found on the OTO website at:
http://www.ozarkstransportation.org
The planning factors used as a basis for the creation of the UPWP are:
• Support the economic vitality of the metropolitan area, especially by enabling global competitiveness, productivity, and efficiency;
• Increase the safety of the transportation system for motorized and non-motorized users; • Increase the security of the transportation system for motorized and non-motorized users; • Increase the accessibility and mobility of people and freight; • Protect and enhance the environment, promote energy conservation, improve the quality
of life, and promote consistency between transportation improvements and state and local planned growth and economic development patterns;
• Enhance the integration and connectivity of the transportation system, across and between modes, for people and freight;
• Promote efficient system management and operation; and • Emphasize the preservation of the existing transportation system.

2
Task 010 – OTO General Administration
Conduct daily administrative activities including accounting, payroll, maintenance of equipment, software, and personnel needed for federally-required regional transportation planning activities.
Work Elements Estimated Cost
Financial Management ........................................................................................................ $47,315 July to June Responsible Agency – OTO
• Preparation of quarterly progress reports, payment requests, payroll, and year-end reports to MoDOT.
• Maintenance of OTO accounts and budget, with reporting to Board of Directors.
Financial Audit ...................................................................................................................... $6,000 August to October Consultant Contract Needed Responsible Agency – OTO
• Conduct an annual and likely single audit of FY2013 and report to Board of Directors.
Unified Planning Work Program ......................................................................................... $9,863 January to June Responsible Agency – OTO
• Modifications to the FY 2014 UPWP as necessary. • Development of UPWP for FY 2015, including subcommittee meetings,
presentation at Technical Planning Committee and Board of Directors Meetings, and public participation in accordance with the OTO Public Participation Plan.
Travel and Training ............................................................................................................ $44,000 July to June Responsible Agency – OTO
• Travel to meetings both regionally and statewide. Training and development of OTO staff and OTO members through educational programs that are related to OTO work committees. Training could include the following:
o Transportation Research Board (TRB) Conferences o Association of MPOs Annual Conference o Census Bureau Training o ESRI User Conference o Association for Commuter Transportation Conference o Institute for Transportation Engineers Conferences including meetings of the
Missouri Valley Section and Ozarks Chapter o ITE Web Seminars o National American Planning Association Conference o Missouri Chapter, American Planning Association Conference and Activities o Midwest Transportation Planning Conference o National Transit Institute and National Highway Institute Training o Small to Medium Sized Communities Planning Tools Conference o Geographic Information Systems (GIS) Advanced Training (ESRI’s Arc

3
Products) o Bicycle/Pedestrian Professional Training o Provide Other OTO Member Training Sessions, as needed and appropriate o Missouri Association of Procurement Professional Training o GFOA Institute Training o Missouri Public Transit Association Annual Conference o Employee Educational Assistance
General Administration and Contract Management ....................................................... $13,998 July to June Responsible Agency – OTO
• Coordinate contract negotiations and Memorandums of Understanding.
Electronic Support for OTO Operations........................................................................... $29,315 July to June Responsible Agency – OTO
• Maintain and update website. • Software upgrades and maintenance contracts. • Web hosting and backup services.
Civil Rights Compliance ....................................................................................................... $7,729 July to June Responsible Agency – OTO
• Meet federal and state reporting requirements. • Meet MoDOT established DBE goals. • Accept and process complaint forms and review all projects for Title VI compliance. • Continue to include environmental justice and low-English proficiency requirements in
planning process.
IRS Tax Status Determination ........................................................................................... $16,000 July to June Consultant Contract Needed Responsible Agency – OTO
• Attorney to file request for IRS Tax Ruling for determination of tax status for required tax filings. Ruling may span multiple budget years.
End Products for FY 2014
• Complete quarterly progress reports, payment requests and the end-of-year report provided to MoDOT
• Completion of the FY 2015 Unified Planning Work Program • Attendance of OTO staff and OTO members at the various training programs • Monthly updates of website • Financial reporting to Board of Directors • Calculate dues and send out statements • DBE reporting • Title VI reporting and complaint tracking • IRS submission for tax ruling

4
Tasks Completed in FY 2013
• Completed quarterly and year end reports for MoDOT (Completed June 2013) • Completed the FY 2014 UPWP (Completed April 2013) • Staff attended the following conferences and training (Completed June 2013)
o FHWA Web Seminars o FTA Web Seminars o American Planning Association Web Seminars o MAP-21 Web Seminars o Association of Pedestrian and Bicycle Professionals Web Seminars o Organizational Leadership Classes o Springfield Chamber 9th Annual Economic Outlook Conference o Missouri MPO Annual Meeting o Pictometry (aerial photo) Training o FHWA – Congestion Management Process o Springfield Area Human Resource Association Annual Conference o TRB Tools of the Trade Conference o Ozarks Chapter ITE Technical Conference and Lunch Seminars o Missouri Public Transit Association Conference o Association for Commuter Transportation Conference o AMPO National Conference o Missouri Chapter American Planning Association Conference o National American Planning Association Conference o ESRI Online Training o Social Media Marketing Conference o Missouri Coalition for Roadway Safety Conference
• Dues calculated and mailed statements for July 2013 (Completed April 2013) • Website maintenance (Completed June 2013) • Completed DBE reporting (Completed June 2013) • Title VI Reporting and Tracking (Completed June 2013)
Funding Sources
Local Match Funds $34,844 20.00%
Federal CPG Funds $139,376 80.00%
Total Funds $174,220 100.00%

5
Task 020 – OTO Committee Support
Support various committees of the OTO and participate in various community committees directly relating to regional transportation planning activities.
Work Elements Estimated Cost
OTO Committee Support ................................................................................................... $81,624 July to June Responsible Agency – OTO
• Conduct and staff all Technical Planning Committee, Bicycle and Pedestrian Advisory Committee, Local Coordinating Board for Transit, and Board of Directors meetings.
• Respond to individual committee requests. • Facilitate and administer any OTO subcommittees formed during the Fiscal Year.
Community Committee Participation ............................................................................... $13,371 July to June Responsible Agency – OTO
• Participate in and encourage collaboration among various community committees directly related to transportation. Committees include:
o The Springfield Area Chamber of Commerce Transportation Committee o The Southwest Missouri Council of Governments Board and Transportation
Advisory Committee o Missouri Public Transit Association o MoDOT Blueprint for Safety o Ozarks Clean Air Alliance and Clean Air Action Plan Committee o Ozark Greenways Technical Committee o Ozark Greenways Sustainable Transportation Advocacy Resource Team (STAR
Team) o SeniorLink Transportation Committee o Missouri Safe Routes to School Network o Ozark Safe Routes to School Committee o Local Safe Routes to School o Childhood Obesity Action Group and Healthy Living Alliance o Other committees as needed
OTO Policy and Administrative Documents....................................................................... $9,925 July to June Responsible Agency – OTO
• Process amendments to bylaws, policy documents, and administrative staff support consistent with the OTO organizational growth.
• Conduct an annual review of the OTO Public Participation Plan and make any needed revisions, consistent with federal guidelines.
Member Attendance at OTO Meetings ............................................................................. $10,000 July to June Responsible Agencies – OTO and Member Jurisdictions
• OTO member jurisdiction time spent at OTO meetings.

6
End Product(s) for FY 2014
• Conduct meetings, prepare agendas and meeting minutes for OTO Committees and Board • Attendance of OTO staff and OTO members at various community committees • Revisions to bylaws, inter-local agreements and the Public Participation Plan as needed • Documented meeting attendance for in-kind reporting • Staff participation in multiple community committees
Tasks Completed in FY 2013
• Conducted Technical Planning Committee Meetings, Bicycle and Pedestrian Committee Meetings, UPWP Subcommittee Meetings, Local Coordinating Board for Transit Meetings, and Board of Directors meetings
• Prepared agendas and minutes • Documented meeting attendance for in-kind reporting • Staff participated in multiple community committees • Review of Public Participation Plan • Worked with the MO Coalition of Roadway Safety SW District
Funding Sources
Local Match Funds $12,984 11.30%
In-kind Services $10,000 8.70%
Federal CPG Funds $91,936 80.00%
Total Funds $114,920 100.00%
Task 030 – OTO General Planning and Plan Implementation

7
Task 030 – General Planning and Plan Implementation
This task addresses general planning activities, including the OTO Long-Range Transportation Plan (LRTP), approval of the functional classification map, the Congestion Management Process (CMP), the Bicycle and Pedestrian Plan, as well as the implementation of related plans and policies. MAP-21 guidance will be incorporated as it becomes available.
Work Elements Estimated Cost
OTO Long-Range Transportation Plan, Journey 2035 ...................................................... $2,700 July to June Responsible Agency – OTO
• Process amendments to the Long Range Transportation Plan, including the Major Thoroughfare Plan.
• Prepare for the LRTP update, which is due by 12/2016. This includes incorporating MAP-21 performance measures and other guidance, as well as new guidance from the next transportation reauthorization.
OTO Travel Demand Model Update ............................................................................... $155,000 July to June (Continued from Prior Year) Consultant Contract Continued Responsible Agency – OTO
• Travel Demand Model Update to reflect new 2010 census data which is expected to be released in May 2013.
Congestion Management Process Update ......................................................................... $30,000 July to October (Continued from Prior Year) Responsible Agency – OTO
• Publish updated Phase III report to reflect 2012 traffic conditions.
Bicycle and Pedestrian Plan Implementation ..................................................................... $5,000 July to June Responsible Agency – OTO
• The Bicycle and Pedestrian Advisory Committee will continue the coordination and monitoring of the implementation of the OTO Bicycle and Pedestrian Plan.
Geographic Information Systems (GIS) ............................................................................ $18,000 July to June Responsible Agency – OTO
• Continue developing the Geographic Information System (GIS) and work on inputting data into the system that will support Transportation Planning efforts.
Federal Certification Review ................................................................................................ $3,000 July to December Responsible Agency – OTO
• Prepare for, coordinate with MoDOT and ONEDOT, and participate in OTO’s Federal Certification Review.

8
Air Quality Planning ............................................................................................................. $5,000 July to June Responsible Agency – OTO
• Staff serves on the Ozarks Clean Air Alliance along with Springfield Greene-County Health Department, which is updating the regional Clean Air Action Plan, in hopes to preempt designation as a non-attainment area for ozone.
Demographics and Future Projections ................................................................................ $5,000 July to June Responsible Agency – OTO
• Continue to analyze growth and make growth projections for use in transportation decision-making by collecting and compiling development data into a demographic report that will be used in travel demand model runs, plan updates, and planning assumptions.
MoDOT Transportation Studies and Data Collection ..................................................... $65,000 MoDOT Southwest District - $65,000 July to June Responsible Agency – MoDOT Southwest District
• MoDOT, in coordination with OTO and using non-federal funding, performs several activities to improve the overall efficiency of the metropolitan transportation system.
o OTO and MoDOT work to conduct a Traffic Count Program to provide hourly and daily volumes for use in the Congestion Management Process, Long Range Transportation Plan, and Travel Demand Model.
o Transportation studies would be conducted to provide accident data for use in the Congestion Management Process.
o Speed studies would be conducted to analyze signal progression to meet requirements of Congestion Management Process.
o Miscellaneous studies to analyze congestion along essential corridors would also be a billable activity under this task.
Source of Eligible MoDOT Match
MoDOT Position Yearly Salary
Yearly Fringe
Annual Salary Additives Yearly Total %
Time Eligible
Senior Traffic Studies Specialist $53,496.000 $35,184.32 $19,408.35 $108,088.67 20 $21,617.73
Senior Traffic Studies Specialist
$47,796.00 $31,435.43 $17,340.39 $96,571.82 20 $19,314.36
Senior Traffic Technician $35,556.00 $23,385.18 $12,899.72 $71,840.390 34 $24,425.91
TOTAL Eligible Match $65,358.00
TOTAL Match Requested $65,000.00

9
Performance Measures ......................................................................................................... $5,000 July to June Responsible Agency – OTO
• Coordinate with MoDOT on efforts to address national performance measures as outlined in MAP-21
• Production of an annual report to monitor the performance measures as outlined in the Long Range Transportation Plan, incorporating connection to MAP-21 performance measures.
Mapping and Graphics Support for OTO Operations .................................................... $11,502 July to June Responsible Agency – OTO
• Development and maintenance of mapping and graphics for OTO activities, including, but not limited to, the OTO website, OTO publications, and other printed or digital materials.
Travel Time Collection Units ............................................................................................. $82,000 December to June Responsible Agencies – OTO, MoDOT, City of Springfield
• Joint purchase with the City of Springfield and MoDOT of travel time collection units and reporting software for use in transportation planning. The overall cost is $600,000 for 90 units, with OTO’s share at $80,000 for 8 units. MoDOT and the City of Springfield will split the remainder, while collaborating on the installation of the units through the Transportation Management Center. OTO’s share includes the 8 units, the installation of those units, and equipment such as cabling, cabinets, solar, and cellular technology. The per unit cost is higher for the 8 OTO units as they are being installed in the outlying area and those inside the City of Springfield can take advantage of existing equipment and infrastructure.
End Product(s) for FY 2014
• Amendments to the Long Range Transportation Plan • Implementation of Bicycle and Pedestrian Plan • Complete updated Travel Demand Model • Continued monitoring of attainment status • Demographic Report • Performance Measure Report • Updated CMS Phase III • Complete installation of travel time collection units
Tasks Completed in FY 2013
• Changes to Springfield Urbanized Area Boundary • Changes to Federal Functional Classification System • Maintenance of GIS System Layers • Bicycle and Pedestrian Plan Implementation Status Report • Demographic Report • Continued Monitoring of Attainment Status

10
• Selection of Enhancement and support of Safe Routes to School Projects • Performance Measure Report • Distribution of LRTP Executive Summary • Assisted in Update of Clean Air Action Plan
Funding Sources Local Match Funds $12,440 3.21%
MoDOT Direct Costs $65,000 16.79%
Federal CPG Funds $309,762 80.00%
Total Funds $387,202 100.00%

11
Task 040 – Project Selection and Programming
Prepare a four-year program for anticipated transportation improvements and amendments as needed.
Work Elements Estimated Cost
Solicit Applications and Select 2014-2017 Transportation Projects ................................. $5,000 July to June Responsible Agency – OTO
• Continue to improve project selection processes including project application development, scoring, and selection criteria for multiple transportation funding sources.
2014-2017 Transportation Improvement Program (TIP) .................................................. $7,485 July to August Responsible Agency – OTO
• Complete and publish the 2014-2017 TIP. o Item should be on the July Technical Planning Committee Agenda and the
August Board of Directors Agenda. 2015-2018 Transportation Improvement Program (TIP) ................................................ $60,625 March to June Responsible Agency – OTO
• Begin development of the 2015-2018 TIP. • Conduct the Public Involvement Process for the TIP (March-August). • Work with the TIP subcommittees (June). • Complete Draft document.
TIP Amendments ................................................................................................................. $11,784 July to June Responsible Agency – OTO
• Process all modifications to the FY 2013-2016 and 2014-2017 TIPs including the coordination, advertising, public comment and Board approval and submissions to MoDOT for incorporation in the STIP.
Federal Funds Tracking........................................................................................................ $3,923 July to June Responsible Agency – OTO
• Gather obligation information and develop the Annual Listing of Obligated Projects and publish to website.
• Monitor STP-Urban, Small Urban, and bridge balances. • Track area cost-share projects.
Online TIP Tool ................................................................................................................... $10,000 June to December Consultant Contract Responsible Agency – OTO
• Maintenance contract for web-based tool to make an online searchable database for projects.

12
End Product(s) for FY 2014
• TIP amendments, as needed • Adopt FY 2014-2017 Transportation Improvement Program as approved by the OTO
Board and ONEDOT • Draft of the FY 2015-2018 Transportation Improvement Program • Annual Listing of Obligated Projects • Online searchable database of TIP projects • Solicit and select projects for various funding sources
Tasks Completed in FY 2013
• Adopted FY 2013-2016 Transportation Improvement Program as approved by the OTO Board and ONEDOT
• Draft of the FY 2014-2017 Transportation Improvement Program • Amended the FY 2013-2016 TIP numerous times • Annual Listing of Obligated Projects • Solicited and selected projects for various funding sources
Funding Sources Local Match Funds $19,763 20.00%
Federal CPG Funds $79,054 80.00%
Total Funds $98,817 100.00%

13
Task 050 – Transportation Demand Management
Planning Activities to support the Regional Rideshare program. Work Elements Estimated Cost
Coordinate Employer Outreach Activities .......................................................................... $6,000 July to June Responsible Agencies – OTO, City of Springfield
• Work with the City of Springfield to identify and coordinate with major employers to develop employer-based programs to promote ridesharing and other transportation demand management (TDM) techniques within employer groups.
Collect and Analyze Data to Determine Potential Demand ............................................... $6,000 July to June Responsible Agency – OTO
• Gather and analyze data to determine the best location in terms of demand to target ridesharing activities.
End Product(s) for FY 2014
• Annual report of TDM activities including number of users, employer promotional activities, results of location data analysis, and benefits to the region.
Tasks Completed in FY 2013
• Not included in FY2013 UPWP Funding Sources Local Match Funds $2,400 20.00%
Federal CPG Funds $9,600 80.00%
Total Funds $12,000 100.00%
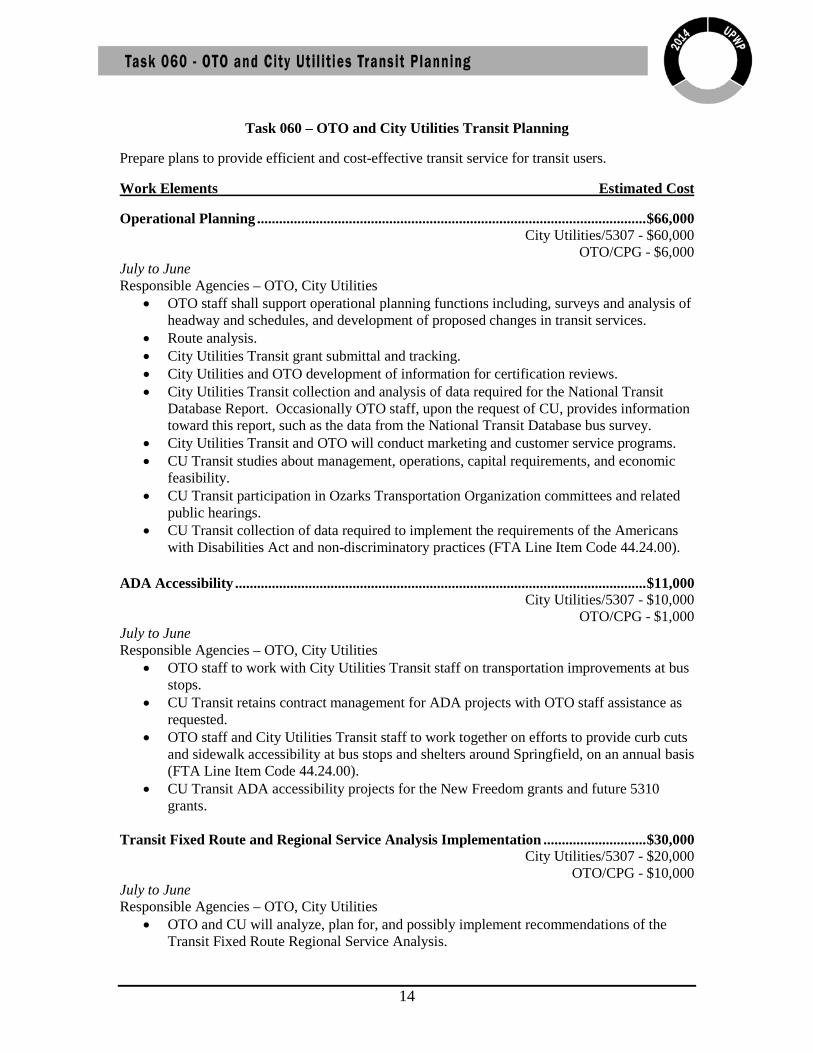
14
Task 060 – OTO and City Utilities Transit Planning
Prepare plans to provide efficient and cost-effective transit service for transit users.
Work Elements Estimated Cost
Operational Planning .......................................................................................................... $66,000 City Utilities/5307 - $60,000 OTO/CPG - $6,000 July to June Responsible Agencies – OTO, City Utilities
• OTO staff shall support operational planning functions including, surveys and analysis of headway and schedules, and development of proposed changes in transit services.
• Route analysis. • City Utilities Transit grant submittal and tracking. • City Utilities and OTO development of information for certification reviews. • City Utilities Transit collection and analysis of data required for the National Transit
Database Report. Occasionally OTO staff, upon the request of CU, provides information toward this report, such as the data from the National Transit Database bus survey.
• City Utilities Transit and OTO will conduct marketing and customer service programs. • CU Transit studies about management, operations, capital requirements, and economic
feasibility. • CU Transit participation in Ozarks Transportation Organization committees and related
public hearings. • CU Transit collection of data required to implement the requirements of the Americans
with Disabilities Act and non-discriminatory practices (FTA Line Item Code 44.24.00).
ADA Accessibility ................................................................................................................ $11,000 City Utilities/5307 - $10,000 OTO/CPG - $1,000 July to June Responsible Agencies – OTO, City Utilities
• OTO staff to work with City Utilities Transit staff on transportation improvements at bus stops.
• CU Transit retains contract management for ADA projects with OTO staff assistance as requested.
• OTO staff and City Utilities Transit staff to work together on efforts to provide curb cuts and sidewalk accessibility at bus stops and shelters around Springfield, on an annual basis (FTA Line Item Code 44.24.00).
• CU Transit ADA accessibility projects for the New Freedom grants and future 5310 grants.
Transit Fixed Route and Regional Service Analysis Implementation ............................ $30,000 City Utilities/5307 - $20,000 OTO/CPG - $10,000 July to June Responsible Agencies – OTO, City Utilities
• OTO and CU will analyze, plan for, and possibly implement recommendations of the Transit Fixed Route Regional Service Analysis.

15
Service Planning .................................................................................................................. $40,000 City Utilities/5307 - $30,000 OTO/CPG - $10,000 July to June Responsible Agencies – OTO, City Utilities
• Per the recommendations of the Transit Coordination Plan, use recommended project selection criteria for selection of human service agency transit projects.
• OTO staff collection of data from paratransit operations as required. • OTO staffing of the Local Coordinating Board for Transit • CU Transit development of route and schedule alternatives to make services more
efficient and cost-effective within current hub and spoke system operating within the City of Springfield. (FTA Line Item Code 44.23.01)
• OTO staff and City Utilities Transit participation in special transit studies. • As part of the TIP process, a competitive selection process will be conducted for
selection of projects utilizing relevant federal funds. Financial Planning ............................................................................................................... $30,000 City Utilities/5307 - $30,000 July to June Responsible Agency – City Utilities
• CU Transit analysis of transit system performance by adopted policies to achieve effective utilization of available resources.
• CU Transit preparation of long and short-range financial and capital plans. • CU Transit will identify possible cost-saving techniques and opportunities. • CU Transit, with potential assistance from OTO staff, will identify potential revenue
from non-federal sources to meet future operating deficit and capital costs (FTA Line Item Code 44.26.84).
Competitive Contract Planning ............................................................................................ $9,000 City Utilities/5307 - $8,000 OTO/CPG - $1,000 July to June Responsible Agencies – OTO, City Utilities, Missouri State University
• CU Transit will study opportunities for transit cost reductions through the use of third-party and private sector providers.
• Missouri State University (MSU) will continue to monitor costs of their third-party private sector transit contractor.
• CU Transit and OTO staff will study potential coordination of private sector transportation with the existing and potential public sector providers to minimize unserved populace.
• OTO staff to maintain a list of operators developed in the transit coordination plan for use by City Utilities (CU) and other transit providers in the development of transit plans.
• OTO staff to cooperate with MSU, CU, and their consultants in the evaluation of existing services.

16
Safety, Security and Drug and Alcohol Control Planning ............................................... $20,500 City Utilities/5307 - $19,500 OTO/CPG - $1,000 July to June Responsible Agencies – OTO, City Utilities, Missouri State University
• CU and Missouri State University have adopted policies of drug-free awareness programs to inform their employees on the dangers of drug abuse (FTA Line Item Code 44.26.82). Funding is intended to assist in the development of a drug and alcohol awareness program in an effort to provide a drug- and alcohol-free working environment for the employees at CU, and MSU transit. In particular, special studies addressing critical transportation and related drug and alcohol issues may need to be completed.
• OTO, CU, and MSU will review existing plans and procedures for maintaining security on existing transit facilities and take steps to mitigate any identified shortcomings.
• Implementation of additional safety and security policies as required by MAP-21. Transit Coordination Plan Implementation...................................................................... $23,000 City Utilities/5307 - $10,000 OTO/CPG - $13,000 July to June Responsible Agencies – OTO, City Utilities, Human Service Transit Providers
• Update of the existing Transit Coordination Plan including examination and possible update of the competitive selection process to comply with MAP-21 legislation.
Program Management Plan.................................................................................................. $6,000 City Utilities/5307 - $1,000 OTO/CPG - $5,000 July to June
• Update the existing program management plan to ensure compliance with MAP-21. Data Collection and Analysis .............................................................................................. $12,987 City Utilities/5307 - $9,000 OTO/CPG - $3,987 July to June Responsible Agencies – OTO, City Utilities
• OTO will assist CU in providing necessary demographic analysis for proposed route and/or fare changes.
• Update CU Title VI and LEP plans, with new demographics provided by OTO. • CU will collect and analyze, with OTO’s assistance, ridership data for use in transit
planning and other OTO planning efforts. End Products for FY 2014
• Transit agency coordination (OTO staff) • Project rankings and allocations in the 2014-2017 TIP related to transit, and various new
ADA accessible bus shelters and stops (OTO staff) • Special Studies (OTO staff, CU, and possible consultant services as necessary) • On-Board Bus Surveys as needed (OTO staff, CU) • Quarterly reporting to National Transit Database (CU) • Transit Coordination Plan Implementation of Selected Strategies
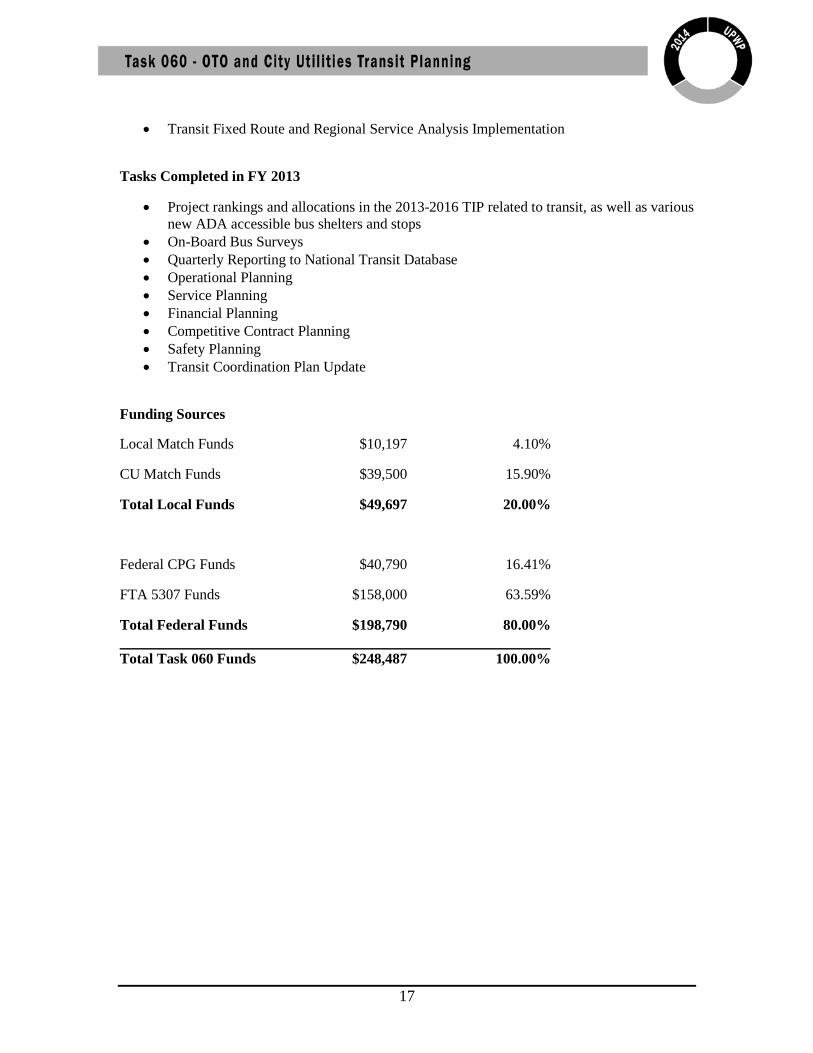
17
• Transit Fixed Route and Regional Service Analysis Implementation
Tasks Completed in FY 2013
• Project rankings and allocations in the 2013-2016 TIP related to transit, as well as various new ADA accessible bus shelters and stops
• On-Board Bus Surveys • Quarterly Reporting to National Transit Database • Operational Planning • Service Planning • Financial Planning • Competitive Contract Planning • Safety Planning • Transit Coordination Plan Update
Funding Sources
Local Match Funds $10,197 4.10%
CU Match Funds $39,500 15.90%
Total Local Funds $49,697 20.00%
Federal CPG Funds $40,790 16.41%
FTA 5307 Funds $158,000 63.59%
Total Federal Funds $198,790 80.00% Total Task 060 Funds $248,487 100.00%
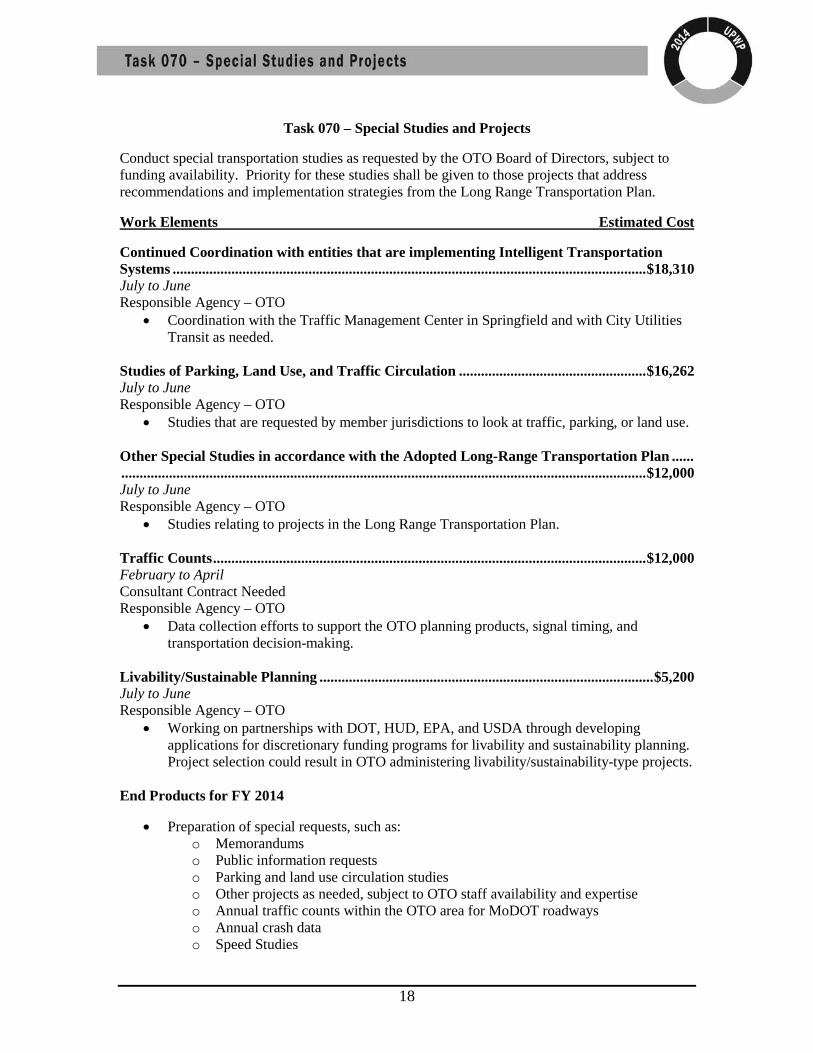
18
Task 070 – Special Studies and Projects
Conduct special transportation studies as requested by the OTO Board of Directors, subject to funding availability. Priority for these studies shall be given to those projects that address recommendations and implementation strategies from the Long Range Transportation Plan.
Work Elements Estimated Cost
Continued Coordination with entities that are implementing Intelligent Transportation Systems ................................................................................................................................. $18,310 July to June Responsible Agency – OTO
• Coordination with the Traffic Management Center in Springfield and with City Utilities Transit as needed.
Studies of Parking, Land Use, and Traffic Circulation ................................................... $16,262 July to June Responsible Agency – OTO
• Studies that are requested by member jurisdictions to look at traffic, parking, or land use. Other Special Studies in accordance with the Adopted Long-Range Transportation Plan ...... ............................................................................................................................................... $12,000 July to June Responsible Agency – OTO
• Studies relating to projects in the Long Range Transportation Plan. Traffic Counts ...................................................................................................................... $12,000 February to April Consultant Contract Needed Responsible Agency – OTO
• Data collection efforts to support the OTO planning products, signal timing, and transportation decision-making.
Livability/Sustainable Planning ........................................................................................... $5,200 July to June Responsible Agency – OTO
• Working on partnerships with DOT, HUD, EPA, and USDA through developing applications for discretionary funding programs for livability and sustainability planning. Project selection could result in OTO administering livability/sustainability-type projects.
End Products for FY 2014
• Preparation of special requests, such as: o Memorandums o Public information requests o Parking and land use circulation studies o Other projects as needed, subject to OTO staff availability and expertise o Annual traffic counts within the OTO area for MoDOT roadways o Annual crash data o Speed Studies

19
o ITS Coordination Tasks Completed in FY 2013
• Traffic Counts within the OTO Area for MoDOT roadways • Crash Data • Speed Studies • ITS Coordination • Transportation Section of the Community Report Card
Funding Sources
Total Local Match Funds $12,754 20.00%
Federal CPG Funds $51,018 80.00%
Total Funds $63,772 100.00%

20
Financial Revenues Summary
Ozarks Transportation Organization Revenue Total Amount Budgeted Consolidated FHWA/FTA PL Funds $721,534.40 Local Jurisdiction Match Funds $96,803.60 In-kind Match, Direct Cost, Donated** $75,000.00 Employee Insurance Premium $8,580.00 City of Springfield Aerial Photography Match Funds $0.00 Total Ozarks Transportation Organization Revenue $901,918.00
Direct Outside Grant Total Amount Budgeted City Utilities Transit Planning – FTA 5307 $158,000.00 City Utilities Local Match $39,500.00 Total Direct Outside Grant $197,500.00
TOTAL REVENUE $1,099,418.00
Financial Expenditures Summary
Local Federal
Task OTO CU MoDOT In-Kind Services CPG 5307 Total Percent
(%) 010 $34,844 $139,376 $174,220 15.85 020 $12,984 $10,000 $91,936 $114,920 10.45 030 $12,440 $65,000 $309,762 $387,202 35.22 040 $19,763 $79,054 $98,817 8.99 050 $2,400 $9,600 $12,000 1.09 060 $10,197 $39,500 $40,790 $158,000 $248,487 22.60 070 $12,754 $51,018 $63,772 5.80
TOTAL $105,382 $39,500 $65,000 $10,000 $721,536 $158,000 $1,099,418 100.00

21
FY11 (MO-81-0011) Balance $505,468.45 FY12 (MO-81-0012) Balance $478,455.68 CPG Fund Balance as of 12/31/12* $983,924.13 Remaining funds committed to fulfill last year’s FY2013 UPWP ($415,945.99) Remaining CPG Funds Balance available from Prior Years UPWP* $567,978.14 FY 2013 Estimated CPG Funds allocation** $502,309.00 FY 2014 Estimated CPG Funds allocation*** $512,000.00 TOTAL Estimated CPG Funds Available for FY 2014 UPWP $1,582,287.14 TOTAL CPG Funds Programmed for FY 2014 ($721,534.40) Remaining Unprogrammed Balance $860,752.74 *Previously allocated but unspent CPG Funds through FY 2012 **FY 2013 Estimated CPG Funds Allocation ***The TOTAL Estimated CPG Funds Available for FY 2014 UPWP is an estimated figure based on an estimate for the FY 2013 allocation.
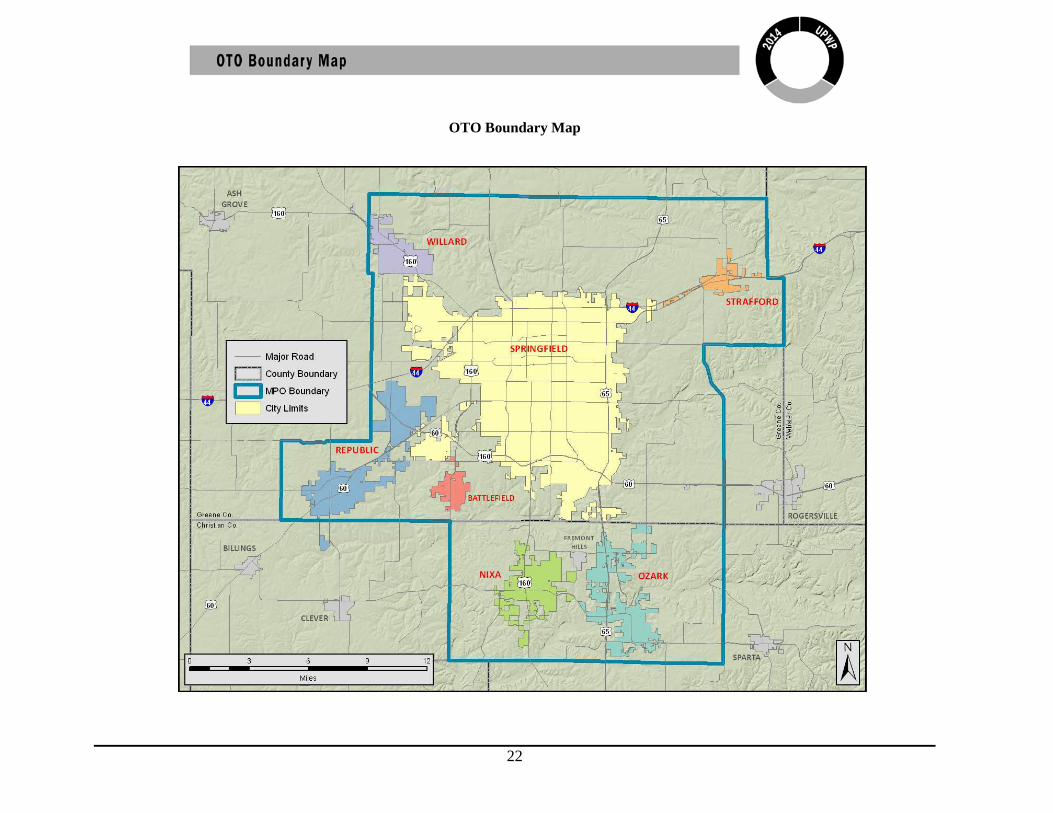
22
OTO Boundary Map

23
OTO Organization Chart
Board and Committee membership composition may be found at: http://www.ozarkstransportation.org

ESTIMATED EXPENDITURES
Cost Category
Prior Budgeted FY2013
Total Amount Prior Budgeted
FY2013
Budgeted Amount FY2014
Total Amount Budgeted FY2014
Increase/ Decrease
PersonnelSalaries & Fringe $361,000.78 $385,000.00Mobile Data Plans $1,620.00 $2,700.00Payroll Services $2,600.00 $3,000.00Total Personnel $365,220.78 $390,700.00 ↑ $25,479.22
BuildingBuilding Lease $55,367.00 $51,108.00Parking $1,000.00 $960.00Total Building $56,367.00 $52,068.00 ↓ ($4,299.00)
CommoditiesOffice Supplies/Furniture $16,000.00 $10,000.00Publications $1,000.00 $400.00Total Commodities $17,000.00 $10,400.00 ↓ ($6,600.00)
Information TechnologyIT Maintenance Contract $12,000.00 $9,000.00Computer Upgrades/Equipment Replacement/Repair $4,500.00 $6,000.00Data Backup/Storage $3,600.00 $2,500.00GIS Licenses $7,000.00 $4,500.00Software $2,000.00 $3,000.00Webhosting $550.00 $550.00Total Information Technology $29,650.00 $25,550.00 ↓ ($4,100.00)
InsuranceBoard of Directors Insurance $2,300.00 $2,600.00Liability Insurance $1,400.00 $1,100.00Workers Comp $1,400.00 $1,300.00Total Insurance $5,100.00 $5,000.00 ↓ ($100.00)
OperatingCopy Machine Lease $4,000.00 $3,000.00Education/Training/Travel $32,000.00 $25,000.00Food/Meeting Expense $4,500.00 $4,000.00IRS Tax Fees $0.00 $11,000.00Legal/Bid Notices (formerly Advertising) $3,800.00 $3,400.00Staff Mileage Reimbursement $2,000.00 $2,500.00Postage/Postal Services $4,000.00 $3,500.00Printing/Mapping Services (combines two categories) $14,500.00 $12,000.00Dues/Memberships $4,200.00 $4,300.00Telephone $5,000.00 $4,500.00Total Operating $74,000.00 $73,200.00 ↓ ($800.00)
APPENDIX AFY 2014
July 1, 2013 - June 30, 2014
OTO BUDGET DETAILUtilizing Consolidated Planning Grant Funds
24

ESTIMATED EXPENDITURES Continued
Cost Category
Prior Budgeted FY2013
Total Amount Prior Budgeted
FY2013
Budgeted Amount FY2014
Total Amount Budgeted FY2014
Increase/ Decrease
ServicesAerial Photos $50,000.00 $0.00Audit $4,750.00 $6,000.00Professional Services (Legal & Accounting) $8,000.00 $12,000.00TIP Tool Maintenance $25,000.00 $10,000.00Travel Time Collection Units $0.00 $80,000.00Travel Time Runs and Traffic Counts $20,000.00 $12,000.00Travel Model Consultant $150,000.00 $150,000.00Total Services $257,750.00 $270,000.00 ↑ $12,250.00TOTAL OTO Expenditures $805,087.78 $826,918.00 ↑ $21,830.22
In-Kind Match, Direct Cost, DonatedMember Attendance at Meetings $8,000.00 $10,000.00Direct Cost - MoDOT Salaries $15,977.00 $65,000.00
Total In-Kind Match, Direct Cost, Donated $23,977.00 $75,000.00 ↑ $51,023.00TOTAL OTO Budget $829,064.78 $901,918.00 ↑ $72,853.22
Direct Outside GrantCU Transit Salaries* $121,230.00 $197,500.00 ↑ $76,270.00TOTAL EXPENDITURES $950,294.78 $1,099,418.00 ↑ $149,123.22Notes * Cost includes federal and required 20% matching funds.
ESTIMATED REVENUES
Cost Category
Prior Budgeted FY2013
Total Amount Prior Budgeted
FY2013
Budgeted Amount FY2014
Total Amount Budgeted FY2014
Increase/ Decrease
Ozarks Transportation Organization RevenueConsolidated FHWA/FTA PL Funds $663,251.82 $721,534.40Local Jurisdiction Match Funds $131,835.96 $96,803.60In-kind Match, Direct Cost, Donated** $23,977.00 $75,000.00Employee Insurance Premium $0.00 $8,580.00City of Springfield Aerial Photography Match Funds $10,000.00 $0.00Total Ozarks Transportation Organization Revenue $829,064.78 $901,918.00 ↑ $72,853.22
Direct Outside GrantCity Utilities Transit PlanningFTA 5307 $96,984.00 $158,000.00City Utilties Local Match $24,246.00 $39,500.00Total Direct Outside Grant $121,230.00 $197,500.00 ↑ $76,270.00TOTAL REVENUE $950,294.78 $1,099,418.00 ↑ $149,123.22Notes: * Cost includes federal and required 20% matching funds. Pass through funds, OTO does not administer or spend the City Utility funds.
** In the event that In-kind Match/Direct Cost/Donated is not available, local jurisdictions match funds will be utilized.
25

Cost Category
Prior Budgeted FY2013
Total Amount Prior Budgeted
FY2013
Budgeted Amount FY2014
Total Amount Budgeted FY2014
Increase/ Decrease
Audit $4,750.00 $6,000.00Professional Services Fees $8,000.00 $12,000.00Data Storage/Backup $3,600.00 $2,500.00IT Maintenance Contract $12,000.00 $9,000.00TIP Tool $25,000.00 $10,000.00Travel Time Runs and Traffic Counts $20,000.00 $12,000.00Travel Model Consultant $150,000.00 $150,000.00Total Consultant Usage $223,350.00 $201,500.00 ↓$21,850.00
Cost Category
Prior Budgeted FY2013
Total Amount Prior Budgeted
FY2013
Budgeted Amount FY2014
Total Amount Budgeted FY2014
Increase/ Decrease
Multi-media Public Relations* $0.00 $3,000.00$0.00 $3,000.00 ↑ $3,000.00
* Public Relations (of the nature of governmental unit promotion) is not an allowable expense in the Consolidated Planning Grant under OMB Circular A-87.
This expense will not be submitted to MoDOT for reimbursement and will come solely from the Local Juridiction Funds.
Utilizing Local Jurisdiction Funds
APPENDIX CFY 2014
July 1, 2013 - June 30, 2014
OTO BUDGET DETAIL
ANTICIPATED CONSULTANT USAGE
July 1, 2013 - June 30, 2014FY 2014
APPENDIX B
26

TAB 5

TECHNICAL COMMITTEE AGENDA 3/20/2013; ITEM II.D.
PM Advance
Ozarks Transportation Organization (Springfield, MO Area MPO)
AGENDA DESCRIPTION:
PM Advance is a collaborative effort by EPA, states, tribes, and local governments to encourage emission reductions in PM2.5 attainment areas nationwide to maintain the National Ambient Air Quality Standard (NAAQS) for fine particulates (PM2.5). The goals of the program are to help attainment areas take action in order to keep PM levels below the level of the PM2.5 NAAQS to ensure continued health protection for their citizens, better position areas to remain in attainment, and efficiently direct available resources toward actions to address PM problems quickly. The PM Advance program offers participating governments the opportunity to work in partnership with EPA and each other. While participation is not a guarantee that an area will avoid a future nonattainment designation or other Clean Air Act requirements, it can better position the area to comply with the requirements associated with such a designation. For example, emission reduction actions undertaken as part of the program could potentially receive credit in State Implementation Plans (SIPs) in the event an area is eventually designated nonattainment with a moderate or higher classification, either in terms of reflecting a lower baseline from which additional reductions are needed to meet reasonable further progress goals or, if they occur after the baseline year, as a measure that shows progress toward attainment. The Ozarks Clean Air Alliance has voted to apply to this program and would like the Ozarks Transportation Organization as a partner in that application. Many of the steps required to be a part of this program are already underway with the development and update of the Clean Air Action Plan. Participation in this program does not commit the region to any new regulatory requirements. The region already participates in the Ozone Advance program. The efforts required under PM Advance would be an extension of that program.
TECHNICAL COMMITTEE ACTION REQUESTED: To make a recommendation to the Board of Directors regarding participation in the PM Advance Program.

TAB 6

TECHNICAL COMMITTEE AGENDA 3/20/2013; ITEM II.E.
OTO Funds Balance Report – December 2012
Ozarks Transportation Organization (Springfield, MO Area MPO)
AGENDA DESCRIPTION: Ozarks Transportation Organization is allocated STP-Urban, Small Urban, and BRM (On-System Bridge) funds each year through MoDOT from the Federal Highway Administration. MoDOT has enacted a policy of allowing no more than three years of this STP-Urban allocation to accrue due to requirements by FHWA. If a balance greater than 3 years accrues, funds will lapse (be forfeited). OTO has elected to sub-allocate the STP-Urban and Small Urban funds among the jurisdictions within the MPO area. Each of these jurisdiction’s allocations are based upon the population within the MPO area. OTO’s balance is monitored as a whole by MoDOT, while OTO staff monitors each jurisdiction’s individual balance. When MoDOT calculates the OTO balance, it is based upon obligated funds and not programmed funds, so a project is only subtracted from the balance upon obligation from FHWA. OTO receives reports showing the projects that have been obligated. MoDOT’s policy allows for any cost share projects with MoDOT that are programmed in the Statewide Transportation Improvement Program, although not necessarily obligated, to be subtracted from the balance. The next deadline to meet the MoDOT funds lapse policy is September 30, 2013. Staff has included a report which documents the balance allowed, the balance obligated, and the balance that needs to be obligated by the end of the Federal Fiscal Year in order not to be rescinded by MoDOT. According to staff records, as a whole, OTO has obligated or has programmed in cost shares with MoDOT, funding exceeding the minimum amount required to be programmed for FY 2013, therefore, there is not an immediate threat of rescission by MoDOT. The report also outlines activity in other OTO funding accounts, such as BRM and Small Urban. These accounts are subject to the same rescission policy. The Obligation Summary Report Balance Sheet (Page 1) indicates the STP-Urban balance for OTO as a whole. OTO has an ending balance of $26,884,546.48 as of December 31, 2012. After the MoDOT cost share projects that appear in the STIP are subtracted, the balance is $8,948,874.64. This is well within the balance allowed to be carried by MoDOT. In 2009, $3.5 million in STP-Urban funding was rescinded when SAFETEA-LU expired, though it was restored nine months later. The only action that prevents a rescission of federal funding is obligation. The OTO unobligated balance that is subject to rescission is $26,884,546.48. It is recommended that this funding be obligated as quickly as possible to protect against further rescissions. Several jurisdictions have partnered with MoDOT to spend these funds. OTO commends those who have acted in response to the suggestion that these funds be spent. TECHNICAL COMMITTEE ACTION: No official action requested, however, OTO is requesting each jurisdiction review the report for any inaccuracies or changes in project status and advise staff.

This report was prepared in cooperation with the USDOT, including FHWA and FTA, as well as the Missouri Department of Transportation.
Ozarks Transportation Organization
Funds Balance Report
December 2012

OZARKS TRANSPORTATION ORGANIZATION FUNDS BALANCE REPORT – DECEMBER 2012
Ozarks Transportation Organization
Funds Balance Report
Table of Contents
Balance Sheet ................................................................................................................................................ 1
Appropriations .............................................................................................................................................. 2
Obligations .................................................................................................................................................... 3
Ending Balance by Jurisdiction ...................................................................................................................... 5
MoDOT Cost Shares ...................................................................................................................................... 6
Bridge Balance .............................................................................................................................................. 7
Christian County ............................................................................................................................................ 8
Greene County .............................................................................................................................................. 9
City of Battlefield ........................................................................................................................................ 10
City of Nixa .................................................................................................................................................. 11
City of Ozark ................................................................................................................................................ 12
City of Republic ........................................................................................................................................... 13
City of Springfield ........................................................................................................................................ 14
City of Strafford ........................................................................................................................................... 16
City of Willard ............................................................................................................................................. 17
MPO Population Distribution ...................................................................................................................... 18
STP Funding Allocation................................................................................................................................ 19
STP-Urban Running Balance........................................................................................................................ 20
MoDOT Reports .......................................................................................................................................... 22

TOTAL APPROPRIATIONS FY2003-FY2013 (See Pg 2) $48,683,189.30
TOTAL OBLIGATIONS FY2003-FY2013 (See Pg 2) ($21,798,642.82)
TOTAL UNOBLIGATED BALANCE $26,884,546.48
MoDOT COST SHARES (See Pg 5) ($17,935,671.84)
BALANCE AFTER COST SHARES $8,948,874.64
TOTAL BALANCE* $8,948,874.64
STP URBAN ONLY BALANCE $24,173,423.90
AFTER MoDOT COST SHARES $6,237,752.06
MAXIMUM STP URBAN BALANCE ALLOWED $16,144,476.00
REMAINING STP URBAN TO BE OBLIGATED BY SEPT 2013 $0.00
* Total Balance reflects cost shares committing future STP-U funding not yet allocated.
Balance Sheet
OZARKS TRANSPORTATION ORGANIZATION
FUNDS BALANCE REPORT - DECEMBER 2012
1
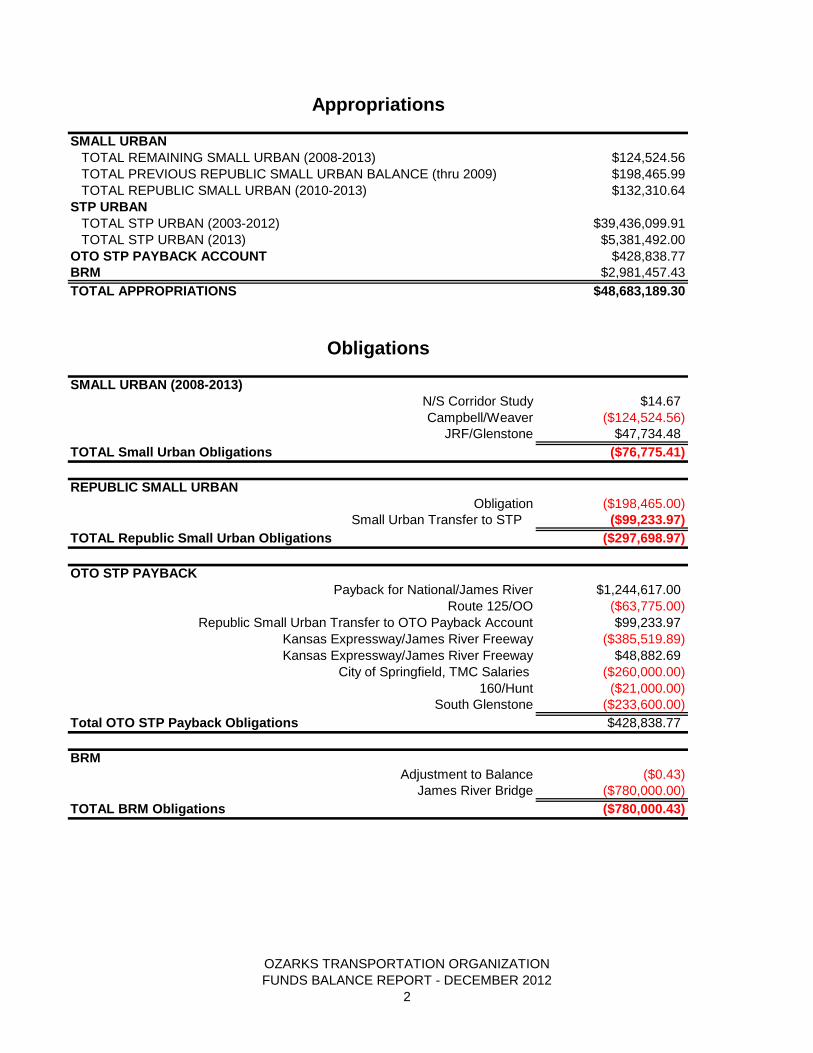
SMALL URBAN
TOTAL REMAINING SMALL URBAN (2008-2013) $124,524.56
TOTAL PREVIOUS REPUBLIC SMALL URBAN BALANCE (thru 2009) $198,465.99
TOTAL REPUBLIC SMALL URBAN (2010-2013) $132,310.64
STP URBAN
TOTAL STP URBAN (2003-2012) $39,436,099.91
TOTAL STP URBAN (2013) $5,381,492.00
OTO STP PAYBACK ACCOUNT $428,838.77
BRM $2,981,457.43
TOTAL APPROPRIATIONS $48,683,189.30
SMALL URBAN (2008-2013)
N/S Corridor Study $14.67
Campbell/Weaver ($124,524.56)
JRF/Glenstone $47,734.48
TOTAL Small Urban Obligations ($76,775.41)
REPUBLIC SMALL URBAN
Obligation ($198,465.00)
Small Urban Transfer to STP ($99,233.97)
TOTAL Republic Small Urban Obligations ($297,698.97)
OTO STP PAYBACK
Payback for National/James River $1,244,617.00
Route 125/OO ($63,775.00)
Republic Small Urban Transfer to OTO Payback Account $99,233.97
Kansas Expressway/James River Freeway ($385,519.89)
Kansas Expressway/James River Freeway $48,882.69
City of Springfield, TMC Salaries ($260,000.00)
160/Hunt ($21,000.00)
South Glenstone ($233,600.00)
Total OTO STP Payback Obligations $428,838.77
BRM
Adjustment to Balance ($0.43)
James River Bridge ($780,000.00)
TOTAL BRM Obligations ($780,000.43)
Obligations
Appropriations
OZARKS TRANSPORTATION ORGANIZATION
FUNDS BALANCE REPORT - DECEMBER 2012
2
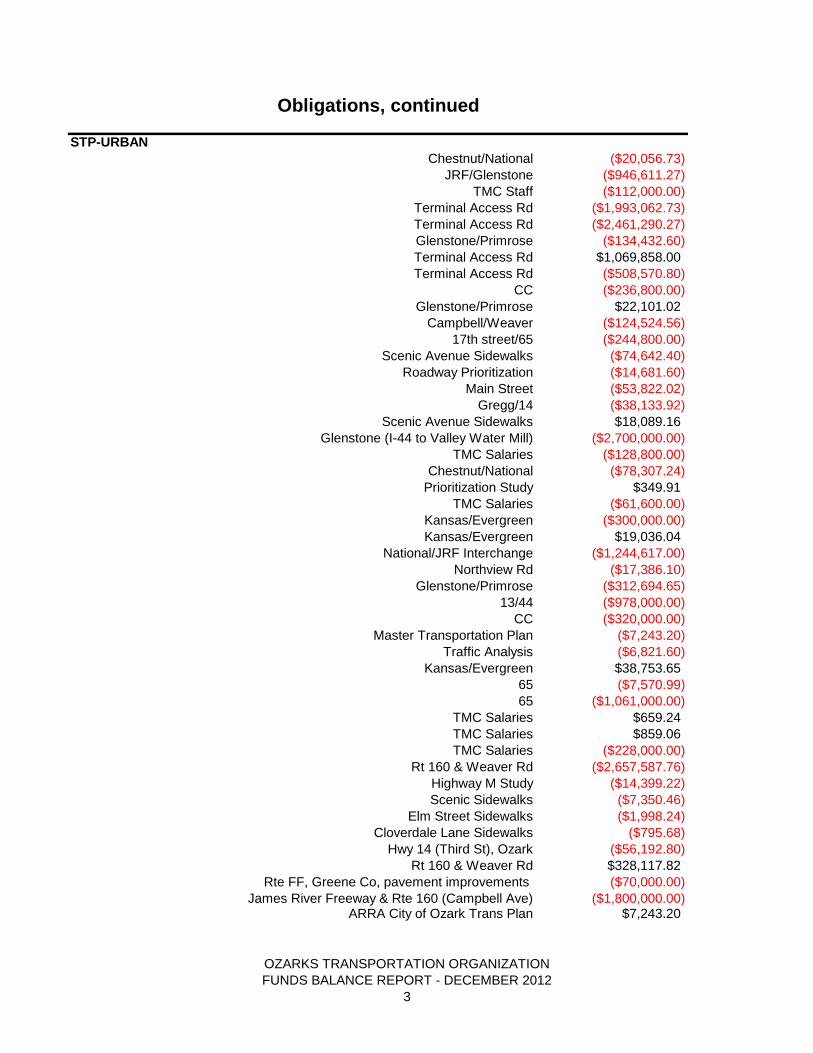
STP-URBAN
Chestnut/National ($20,056.73)
JRF/Glenstone ($946,611.27)
TMC Staff ($112,000.00)
Terminal Access Rd ($1,993,062.73)
Terminal Access Rd ($2,461,290.27)
Glenstone/Primrose ($134,432.60)
Terminal Access Rd $1,069,858.00
Terminal Access Rd ($508,570.80)
CC ($236,800.00)
Glenstone/Primrose $22,101.02
Campbell/Weaver ($124,524.56)
17th street/65 ($244,800.00)
Scenic Avenue Sidewalks ($74,642.40)
Roadway Prioritization ($14,681.60)
Main Street ($53,822.02)
Gregg/14 ($38,133.92)
Scenic Avenue Sidewalks $18,089.16
Glenstone (I-44 to Valley Water Mill) ($2,700,000.00)
TMC Salaries ($128,800.00)
Chestnut/National ($78,307.24)
Prioritization Study $349.91
TMC Salaries ($61,600.00)
Kansas/Evergreen ($300,000.00)
Kansas/Evergreen $19,036.04
National/JRF Interchange ($1,244,617.00)
Northview Rd ($17,386.10)
Glenstone/Primrose ($312,694.65)
13/44 ($978,000.00)
CC ($320,000.00)
Master Transportation Plan ($7,243.20)
Traffic Analysis ($6,821.60)
Kansas/Evergreen $38,753.65
65 ($7,570.99)
65 ($1,061,000.00)
TMC Salaries $659.24
TMC Salaries $859.06
TMC Salaries ($228,000.00)
Rt 160 & Weaver Rd ($2,657,587.76)
Highway M Study ($14,399.22)
Scenic Sidewalks ($7,350.46)
Elm Street Sidewalks ($1,998.24)
Cloverdale Lane Sidewalks ($795.68)
Hwy 14 (Third St), Ozark ($56,192.80)
Rt 160 & Weaver Rd $328,117.82
Rte FF, Greene Co, pavement improvements ($70,000.00)
James River Freeway & Rte 160 (Campbell Ave) ($1,800,000.00)ARRA City of Ozark Trans Plan $7,243.20
Obligations, continued
OZARKS TRANSPORTATION ORGANIZATION
FUNDS BALANCE REPORT - DECEMBER 2012
3

STP-URBAN, continued
Gregg/14 ($54,780.00)
Airport Blvd, SPGFD $0.15
Airport Blvd, SPGFD ($43,205.64)
Airport Blvd, SPGFD ($59,268.28)
Hwy 14 (Third St), Ozark - Streetscape ($72,962.40)
City of Nixa - Northview Rd ($89,798.40)
Rte 65, Greene Co, pedestrian accommodations on Bus 65/Loop 44 ($106,000.00)
Rte FF, Greene Co, pavement improvements $35,578.89
City of Springfield, TMC Salaries ($276,000.00)
Springfield/Greene County Bicycle Destination Plan, Ph. 1 ($40,033.84)
Ozark Traffic Study from Jackson to Church on 3rd $17.39
60/65 Interchange Improvements ($100,000.00)
14/3rd Street Streetscape ($177,500.00)
Northview Rd $107,184.50
14 and Gregg Intersection Improvements ($209,764.71)
Route 60 Intersection Improvemenst at Oakwood/FR93 ($173,050.00)
Route 65 Interchange Improvements at Chestnut Expy ($1,369,515.74)
65 and Evans Rd Interchange ($500,000.00)
Route FF Pavement Improvements $3,552.55
14 and Gregg Intersection Improvements $104.26
TOTAL STP-Urban Obligations ($20,644,168.01)
TOTAL OBLIGATIONS ($21,798,642.82)
OZARKS TRANSPORTATION ORGANIZATION
FUNDS BALANCE REPORT - DECEMBER 2012
4

Jurisdiction Allocations Obligations Balance
MoDOT Cost
Share Balance
Balance after Cost
Shares
Christian* $2,428,434.72 ($320,000.00) $2,108,434.72 ($2,300,000.00) ($191,565.28)
Greene (inc. Small-U) $10,213,681.82 ($6,845,221.67) $3,368,460.15 ($1,236,637.20) $2,131,822.95
Battlefield $526,834.69 ($116,614.25) $410,220.44 N/A $410,220.44
Nixa $2,336,493.82 ($593,196.39) $1,743,297.43 ($1,052,948.47) $690,348.96
Ozark $1,984,448.02 ($705,391.10) $1,279,056.92 ($594,344.80) $684,712.12
Republic (inc. Small-U) $867,869.23 ($371,515.00) $496,354.23 N/A $496,354.23
Springfield (inc. Small-U) $29,762,356.54 ($14,752,038.16) $15,010,318.38 ($12,751,741.37) $2,258,577.01
Strafford $110,844.83 ($63,775.00) $47,069.83 N/A $47,069.83
Willard $230,877.38 ($21,000.00) $209,877.38 $0.00 $209,877.38
TOTAL $48,461,841.05 ($23,788,751.57) $24,673,089.48 ($17,935,671.84) $6,737,417.64
* Overprogrammed Balance reflects cost shares committing future STP-U funding not yet allocated.
Ending Balance by Jurisdiction FY 2013
OZARKS TRANSPORTATION ORGANIZATION
FUNDS BALANCE REPORT - DECEMBER 2012
5

Christian Greene Nixa Ozark Springfield Willard Total
Chestnut/65 -$ $0.00 -$ -$ ($953,606.26) -$ ($953,606.26)
14/3rd Street -$ -$ -$ ($594,344.80) -$ -$ ($594,344.80)
CC/65 ($2,300,000.00) -$ -$ -$ -$ -$ ($2,300,000.00)
South Glenstone -$ -$ -$ -$ ($5,007,156.00) -$ ($5,007,156.00)
Kansas Expy/JRF -$ ($336,637.20) -$ -$ ($1,669,880.11) -$ ($2,006,517.31)
Hunt/160 -$ -$ -$ -$ -$ $0.00 $0.00
Battlefield/65 -$ ($500,000.00) -$ -$ ($2,795,436.00) -$ ($3,295,436.00)
Chestnut RR Overpass -$ ($400,000.00) -$ -$ ($2,325,663.00) -$ ($2,725,663.00)
TOTAL ($2,300,000.00) ($1,236,637.20) -$ ($594,344.80) ($12,751,741.37) $0.00 ($16,882,723.37)
Christian Greene Nixa Ozark Springfield Willard Total
Main-Aldersgate to Tracker -$ -$ ($1,052,948.47) -$ -$ -$ ($1,052,948.47)
TOTAL -$ -$ ($1,052,948.47) -$ -$ -$ ($1,052,948.47)
GRAND TOTAL ($2,300,000.00) ($1,236,637.20) ($1,052,948.47) ($594,344.80) ($12,751,741.37) $0.00 ($17,935,671.84)
Proposed Cost Shares Pending Agreement**
Christian Greene Nixa Ozark Springfield Willard Total
Route 60/NN/J Right-of-Way -$ ($200,000.00) -$ -$ ($200,000.00) -$ ($400,000.00)
Plainview and Campbell -$ -$ -$ -$ ($1,186,848.00) -$ ($1,186,848.00)
TOTAL -$ ($200,000.00) -$ -$ ($1,386,848.00) -$ ($1,586,848.00)
**Until Cost Share Agreements are final, these numbers will not count against the remaining balance.
Approved Cost Shares Not Yet Programmed*
*Will be placed in the STIP once agreements have been approved and signed by jurisdiction
MoDOT Cost Shares
Projects Currently Programmed in the STIP
OZARKS TRANSPORTATION ORGANIZATION
FUNDS BALANCE REPORT - DECEMBER 2012
6

2004 $210,242.66
2005 $203,613.48
2006 $265,090.64
Adjustment to Balance ($0.43)
2007 $255,748.00
James River Bridge ($780,000.00)
2008 $297,860.03
2009 $299,406.62
2010 $341,753.00
2011 $326,535.00
2012 $395,013.00
2013* $386,195.00
TOTAL $2,201,457.00
Programmed (Farmer Branch) ($1,000,000.00)
Programmed (Battlefield/65) ($1,189,657.00)
TOTAL AVAILABLE $11,800.00
Maximum Balance Allowed $1,158,585.00
Need to Obligate an Additional $0.00
*Funds for FY2013 are estimates only.
Bridge (BRM) Balance
OZARKS TRANSPORTATION ORGANIZATION
FUNDS BALANCE REPORT - DECEMBER 2012
7

Christian County
Allocation/Project Amount
Running
Balance
Allocation FY 03/04 $348,765.16 $348,765.16
Allocation FY 05 $210,184.62 $558,949.78
Allocation FY 06 $176,680.04 $735,629.82
Allocation FY 07 $205,358.35 $940,988.17
Allocation FY 08 $219,817.75 $1,160,805.92
Allocation FY 09 $225,611.20 $1,386,417.12
CC ($320,000.00) $1,066,417.12
Allocation FY 10 $263,786.21 $1,330,203.33
Allocation FY 11 $255,650.53 $1,585,853.86
Allocation FY 12 $239,722.79 $1,825,576.65
Allocation FY 13 $282,858.07 $2,108,434.72
TOTAL ALLOCATIONS $2,428,434.72
TOTAL OBLIGATIONS ($320,000.00)
TOTAL AVAILABLE $2,108,434.72
Remaining MoDOT Cost Shares
CC/65 ($2,300,000.00)
Total Available after MoDOT Cost Shares* ($191,565.28)
Maximum Balance Allowed $848,574.21
Need to Obligate an Additional $0.00
STP-Urban Balance Based on Current Obligations
*Note: Christian County cost shares with MoDOT assume future year
STP-Urban funding availability not reflected in this report.
OZARKS TRANSPORTATION ORGANIZATION
FUNDS BALANCE REPORT - DECEMBER 2012
8

Greene County
Allocation/Project Amount Running Balance
Small Urban Remaining Funds $344,278.68 $344,278.68
Allocation FY 03/04 $1,399,042.73 $1,743,321.41
Allocation FY 05 $843,138.29 $2,586,459.70
Transfer from City of Battlefield $45,000.00 $2,631,459.70
Allocation FY 06 $708,737.42 $3,340,197.12
Allocation FY 07 $823,778.07 $4,163,975.19
Allocation FY 08 $881,780.76 $5,045,755.95
Transfer from City of Springfield $43,450.00 $5,089,205.95
Scenic Avenue Sidewalks ($74,642.40) $5,014,563.55
Scenic Avenue Sidewalks $18,089.16 $5,032,652.71
JRF/Glenstone ($500,000.00) $4,532,652.71
Division Underground Tank Removal ($64,027.15) $4,468,625.56
Midfield Terminal Access Road ($1,000,000.00) $3,468,625.56
Glenstone (I-44 to Valley Water Mill) ($1,500,000.00) $1,968,625.56
Allocation FY 09 $905,020.70 $2,873,646.26
Transfer from City of Battlefield $20,000.00 $2,893,646.26
Allocation FY 10 $1,058,156.57 $3,951,802.83
Campbell/Weaver ($124,524.56) $3,827,278.27
Campbell/Weaver ($1,328,793.88) $2,498,484.39
Scenic Avenue Sidewalks ($7,350.46) $2,491,133.93
Campbell/Weaver $164,058.91 $2,655,192.84
James River Freeway & Rte 160 (Campbell Ave) ($1,000,000.00) $1,655,192.84
Allocation FY 11 $1,025,521.09 $2,680,713.93
Bicycle Destination Plan ($40,033.84) $2,640,680.09
Allocation FY 12 $1,020,316.77 $3,660,996.86
65/Chestnut Interchange Improvements ($1,000,000.00) $2,660,996.86
65 and Evans Rd Interchange ($500,000.00) $2,160,996.86
Route FF Pavement Improvements $3,552.55 $2,164,549.41
Allocation FY 13 $1,203,910.74 $3,368,460.15
TOTAL ALLOCATIONS (inc. prior Small Urban) $10,213,681.82
TOTAL OBLIGATIONS ($6,845,221.67)
TOTAL AVAILABLE $3,368,460.15
MoDOT Cost Shares
Kansas/JRF ($336,637.20)
Battlefield/65 ($500,000.00)
Chestnut RR Overpass ($400,000.00)
Total Available after MoDOT Cost Shares $2,131,822.95
Maximum Balance Allowed $3,611,732.22
Need to Obligate an Additional $0.00
STP-Urban Balance Based on Current Obligations
OZARKS TRANSPORTATION ORGANIZATION
FUNDS BALANCE REPORT - DECEMBER 2012
9

City of Battlefield
Allocation/Project Amount Running Balance
Allocation FY 03/04 $63,402.45 $63,402.45
Transfer to Greene County ($45,000.00) $18,402.45
Allocation FY 05 $38,209.72 $56,612.17
Allocation FY 06 $32,118.88 $88,731.05
Allocation FY 07 $37,332.34 $126,063.39
Allocation FY 08 $39,960.94 $166,024.33
Allocation FY 09 $41,014.13 $207,038.46
Transfer to Greene County ($20,000.00) $187,038.46
Allocation FY 10 $47,954.01 $234,992.47
Highway M Study ($14,399.22) $220,593.25
Elm Street Sidewalks ($1,998.24) $218,595.01
Cloverdale Lane Sidewalks ($795.68) $217,799.33
Rte FF, Greene Co, pavement improvements ($70,000.00) $147,799.33
Allocation FY 11 $46,475.03 $194,274.36
Rte FF, Greene Co, pavement improvements $35,578.89 $229,853.25
Allocation FY 12 $82,739.59 $312,592.84
Allocation FY 13 $97,627.60 $410,220.44
TOTAL ALLOCATIONS $526,834.69
TOTAL OBLIGATIONS ($116,614.25)
TOTAL AVAILABLE $410,220.44
Maximum Balance Allowed $292,882.80
Need to Obligate an Additional $117,337.64
STP-Urban Balance Based on Current Obligations
OZARKS TRANSPORTATION ORGANIZATION
FUNDS BALANCE REPORT - DECEMBER 2012
10

City of Nixa
Allocation/Project Amount Running Balance
Allocation FY 03/04 $315,253.93 $315,253.93
Allocation FY 05 $189,988.95 $505,242.88
Allocation FY 06 $159,703.67 $664,946.55
CC Realignment ($236,800.00) $428,146.55
Main Street ($53,822.02) $374,324.53
Allocation FY 07 $185,626.40 $559,950.93
Allocation FY 08 $198,696.47 $758,647.40
Gregg/14 ($38,133.92) $720,513.48
Allocation FY 09 $203,933.25 $924,446.73
Northview ($17,386.10) $907,060.63
Allocation FY 10 $238,440.19 $1,145,500.82
Allocation FY 11 $231,086.26 $1,376,587.08
Northview ($89,798.40) $1,286,788.68
Gregg/14 ($54,780.00) $1,232,008.68
Allocation FY 12 $281,551.42 $1,513,560.10
Northview $107,184.50 $1,620,744.60
Gregg/14 ($209,764.71) $1,410,979.89
Allocation FY 13 $332,213.28 $1,743,193.17
Gregg/14 $104.26 $1,743,297.43
TOTAL ALLOCATION $2,336,493.82
TOTAL OBLIGATIONS ($593,196.39)
TOTAL AVAILABLE $1,743,297.43
MoDOT Cost Shares
Main - Aldersgate to Tracker ($1,052,948.47)
Total Available after MoDOT Cost Shares $690,348.96
Maximum Balance Allowed $996,639.84
Need to Obligate an Additional $0.00
STP-Urban Balance Based on Current Obligations
OZARKS TRANSPORTATION ORGANIZATION
FUNDS BALANCE REPORT - DECEMBER 2012
11
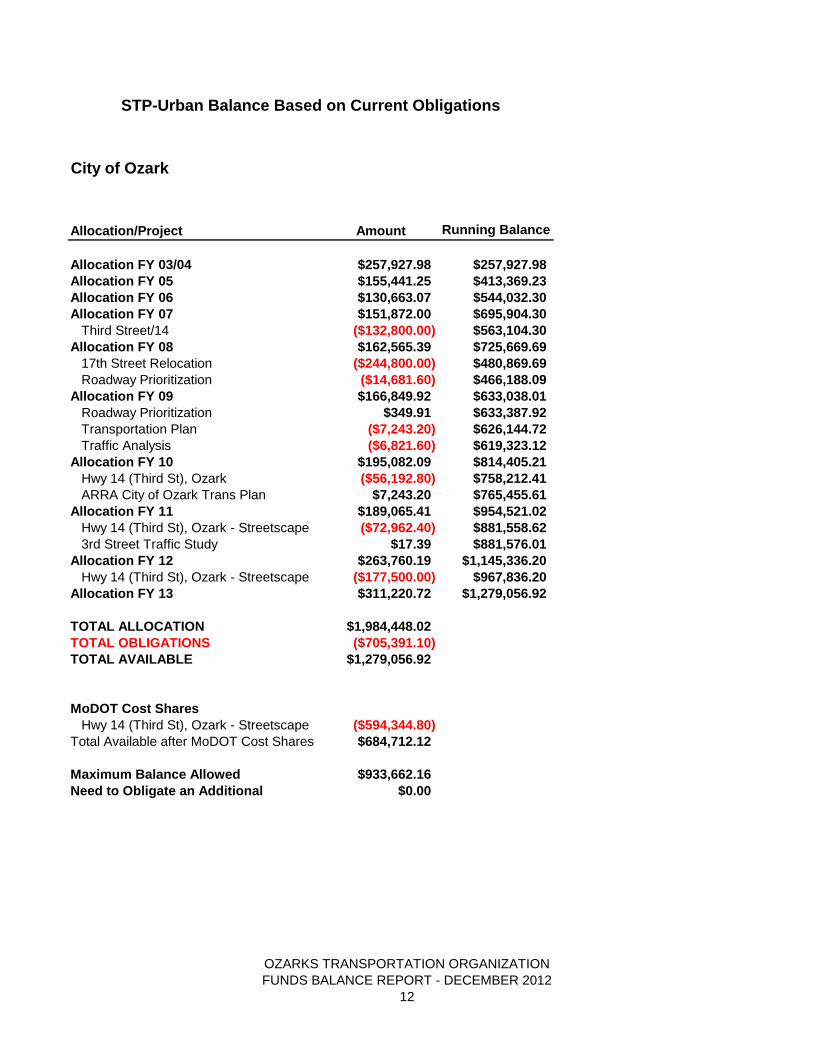
City of Ozark
Allocation/Project Amount Running Balance
Allocation FY 03/04 $257,927.98 $257,927.98
Allocation FY 05 $155,441.25 $413,369.23
Allocation FY 06 $130,663.07 $544,032.30
Allocation FY 07 $151,872.00 $695,904.30
Third Street/14 ($132,800.00) $563,104.30
Allocation FY 08 $162,565.39 $725,669.69
17th Street Relocation ($244,800.00) $480,869.69
Roadway Prioritization ($14,681.60) $466,188.09
Allocation FY 09 $166,849.92 $633,038.01
Roadway Prioritization $349.91 $633,387.92
Transportation Plan ($7,243.20) $626,144.72
Traffic Analysis ($6,821.60) $619,323.12
Allocation FY 10 $195,082.09 $814,405.21
Hwy 14 (Third St), Ozark ($56,192.80) $758,212.41
ARRA City of Ozark Trans Plan $7,243.20 $765,455.61
Allocation FY 11 $189,065.41 $954,521.02
Hwy 14 (Third St), Ozark - Streetscape ($72,962.40) $881,558.62
3rd Street Traffic Study $17.39 $881,576.01
Allocation FY 12 $263,760.19 $1,145,336.20
Hwy 14 (Third St), Ozark - Streetscape ($177,500.00) $967,836.20
Allocation FY 13 $311,220.72 $1,279,056.92
TOTAL ALLOCATION $1,984,448.02
TOTAL OBLIGATIONS ($705,391.10)
TOTAL AVAILABLE $1,279,056.92
MoDOT Cost Shares
Hwy 14 (Third St), Ozark - Streetscape ($594,344.80)
Total Available after MoDOT Cost Shares $684,712.12
Maximum Balance Allowed $933,662.16
Need to Obligate an Additional $0.00
STP-Urban Balance Based on Current Obligations
OZARKS TRANSPORTATION ORGANIZATION
FUNDS BALANCE REPORT - DECEMBER 2012
12
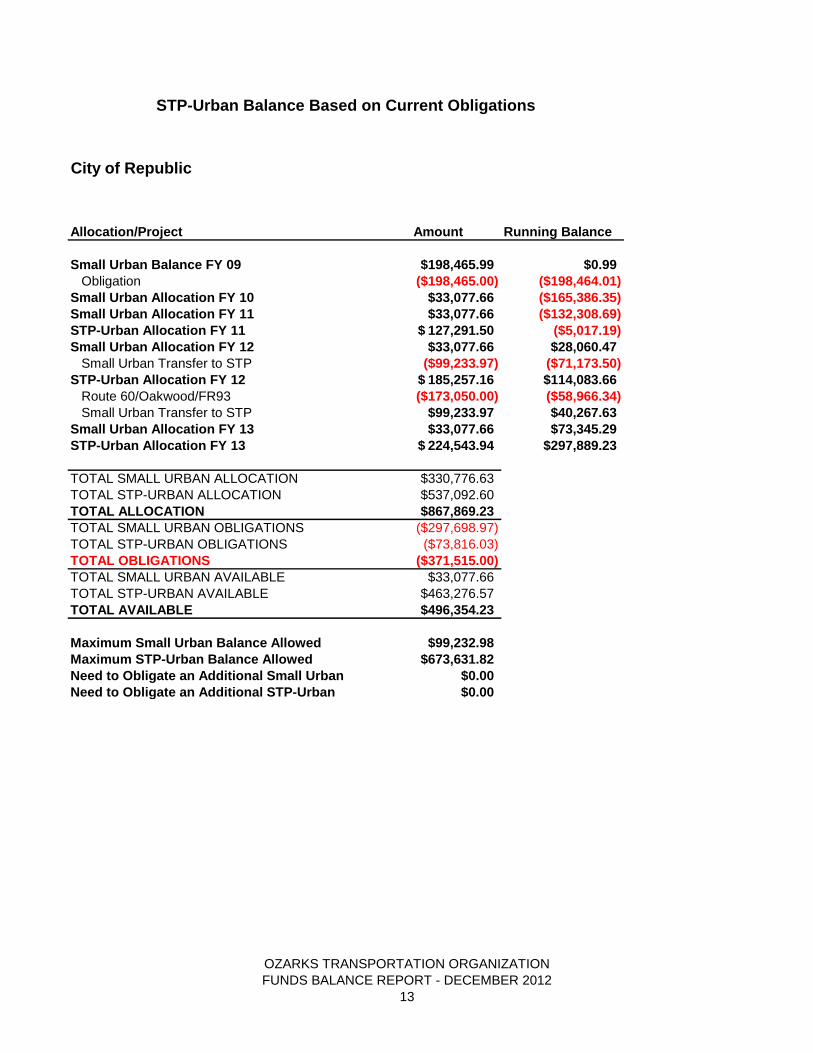
Allocation/Project Amount Running Balance
Small Urban Balance FY 09 $198,465.99 $0.99
Obligation ($198,465.00) ($198,464.01)
Small Urban Allocation FY 10 $33,077.66 ($165,386.35)
Small Urban Allocation FY 11 $33,077.66 ($132,308.69)
STP-Urban Allocation FY 11 127,291.50$ ($5,017.19)
Small Urban Allocation FY 12 $33,077.66 $28,060.47
Small Urban Transfer to STP ($99,233.97) ($71,173.50)
STP-Urban Allocation FY 12 185,257.16$ $114,083.66
Route 60/Oakwood/FR93 ($173,050.00) ($58,966.34)
Small Urban Transfer to STP $99,233.97 $40,267.63
Small Urban Allocation FY 13 $33,077.66 $73,345.29
STP-Urban Allocation FY 13 224,543.94$ $297,889.23
TOTAL SMALL URBAN ALLOCATION $330,776.63
TOTAL STP-URBAN ALLOCATION $537,092.60
TOTAL ALLOCATION $867,869.23
TOTAL SMALL URBAN OBLIGATIONS ($297,698.97)
TOTAL STP-URBAN OBLIGATIONS ($73,816.03)
TOTAL OBLIGATIONS ($371,515.00)
TOTAL SMALL URBAN AVAILABLE $33,077.66
TOTAL STP-URBAN AVAILABLE $463,276.57
TOTAL AVAILABLE $496,354.23
Maximum Small Urban Balance Allowed $99,232.98
Maximum STP-Urban Balance Allowed $673,631.82
Need to Obligate an Additional Small Urban $0.00
Need to Obligate an Additional STP-Urban $0.00
STP-Urban Balance Based on Current Obligations
City of Republic
OZARKS TRANSPORTATION ORGANIZATION
FUNDS BALANCE REPORT - DECEMBER 2012
13

City of Springfield
Allocation/Project Amount Running Balance
Small Urban Balance $3,163,403.16 $3,163,403.16
Allocation FY 03/04 $3,925,754.34 $7,089,157.50
Allocation FY 05 $2,365,870.41 $9,455,027.91
Allocation FY 06 $1,988,737.70 $11,443,765.61
Allocation FY 07 $2,311,545.07 $13,755,310.68
Allocation FY 08 $2,474,302.31 $16,229,612.99
44/65 ($74,000.00) $16,155,612.99
Chestnut/National ($20,056.73) $16,135,556.26
Chestnut/National ($948,888.79) $15,186,667.47
JRF/Glenstone ($2,103,741.90) $13,082,925.57
JRF/Glenstone ($446,611.27) $12,636,314.30
Midfield Terminal Access Road ($2,461,290.27) $10,175,024.03
Glenstone/Primrose ($134,432.60) $10,040,591.43
Midfield Terminal Access Road $1,069,858.00 $11,110,449.43
Glenstone/Primrose $22,101.02 $11,132,550.45
TMC Salaries ($112,000.00) $11,020,550.45
Weaver/Campbell ($124,524.56) $10,896,025.89
JRF/Glenstone ($946,611.27) $9,949,414.62
Midfield Terminal Access Road ($993,062.73) $8,956,351.89
Midfield Terminal Access Road ($508,570.80) $8,447,781.09
Transfer to Greene County ($43,450.00) $8,404,331.09
JRF/Glenstone (small urban credit) $1,071,135.83 $9,475,466.92
Glenstone (I-44 to VW Mill) ($1,200,000.00) $8,275,466.92
Allocation FY 09 $2,539,514.25 $10,814,981.17
TMC Salaries ($128,800.00) $10,686,181.17
Chestnut/National ($78,307.24) $10,607,873.93
TMC Salaries ($61,600.00) $10,546,273.93
Kansas/ Evergreen ($300,000.00) $10,246,273.93
Kansas/ Evergreen $19,036.04 $10,265,309.97
National/JRF ($1,244,617.00) $9,020,692.97
13/44 ($978,000.00) $8,042,692.97
Glenstone/Primrose ($312,694.65) $7,729,998.32
Kansas/ Evergreen $38,753.65 $7,768,751.97
JRF/Glenstone (small urban credit) $47,734.48 $7,816,486.45
Allocation FY 10 $2,969,217.93 $10,785,704.38
65 ($7,570.99) $10,778,133.39
65 ($1,061,000.00) $9,717,133.39
TMC Salaries $659.24 $9,717,792.63
TMC Salaries $859.06 $9,718,651.69
TMC Salaries ($228,000.00) $9,490,651.69
Campbell/Weaver ($1,328,793.88) $8,161,857.81
Campbell/Weaver $164,058.91 $8,325,916.72
JRF/Campbell ($800,000.00) $7,525,916.72
STP-Urban Balance Based on Current Obligations
OZARKS TRANSPORTATION ORGANIZATION
FUNDS BALANCE REPORT - DECEMBER 2012
14

City of Springfield
Allocation/Project Amount Running Balance
STP-Urban Balance Based on Current Obligations
Allocation FY 11 $2,877,641.82 $10,403,558.54
Midfield Terminal Access Road $0.15 $10,403,558.69
Midfield Terminal Access Road ($43,205.64) $10,360,353.05
Midfield Terminal Access Road ($59,268.28) $10,301,084.77
Glenstone Sidewalks ($106,000.00) $10,195,084.77
TMC Salaries ($276,000.00) $9,919,084.77
Allocation FY 12 $2,360,786.90 $12,279,871.67
60/65 Interchange Improvements ($100,000.00) $12,179,871.67
65/Chestnut Interchange Improvements ($369,515.74) $11,810,355.93
Payback on National/James River Freeway $1,244,617.00 $13,054,972.93
Kansas Expressway/James River Freeway ($385,519.89) $12,669,453.04
Allocation FY 13 $2,785,582.65 $15,455,035.69
Kansas Expressway/James River Freeway $48,882.69 $15,503,918.38
TMC Salaries ($260,000.00) $15,243,918.38
South Glenstone ($233,600.00) $15,010,318.38
TOTAL ALLOCATIONS (inc. prior Small Urban) $29,762,356.54
TOTAL OBLIGATIONS ($14,752,038.16)
TOTAL AVAILABLE $15,010,318.38
MoDOT Cost Shares
Chestnut/65 ($953,606.26)
Battlefield/65 ($2,795,436.00)
Chestnut RR Overpass ($2,325,663.00)
South Glenstone ($5,007,156.00)
Kansas/James River Freeway ($1,669,880.11)
Total Available after MoDOT Cost Shares $2,258,577.01
Maximum Balance Allowed $8,356,747.95
Need to Obligate an Additional $0.00
OZARKS TRANSPORTATION ORGANIZATION
FUNDS BALANCE REPORT - DECEMBER 2012
15
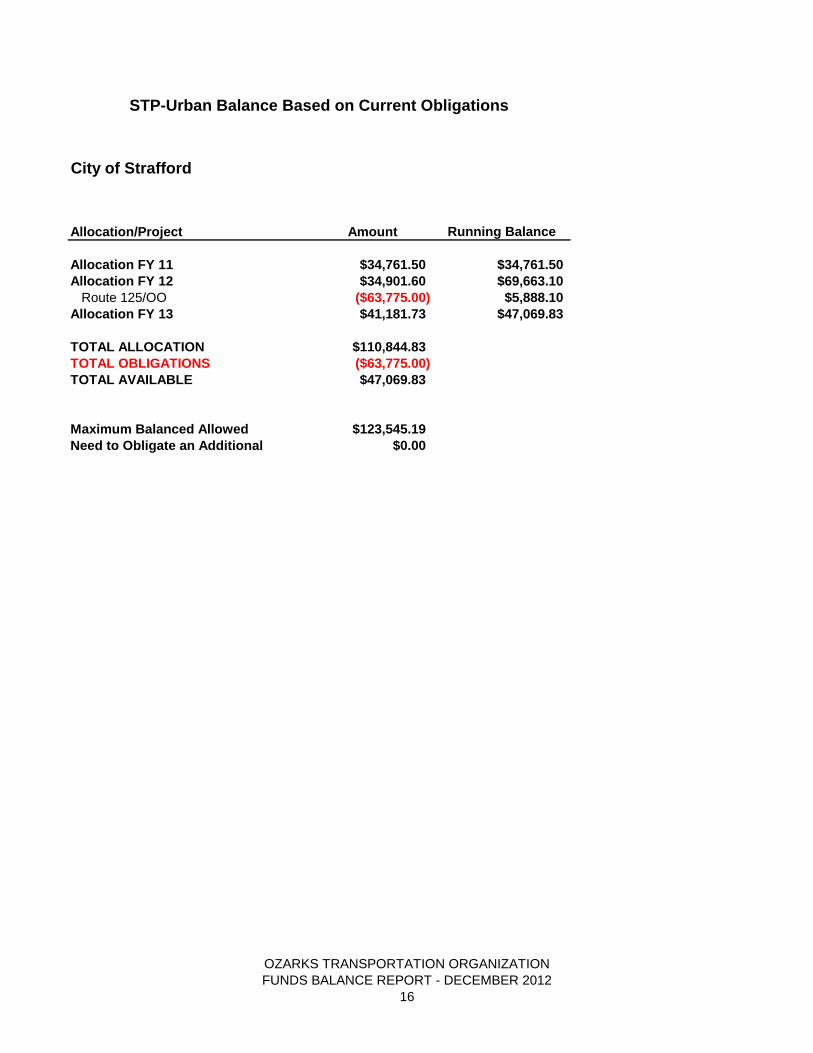
City of Strafford
Allocation/Project Amount Running Balance
Allocation FY 11 $34,761.50 $34,761.50
Allocation FY 12 $34,901.60 $69,663.10
Route 125/OO ($63,775.00) $5,888.10
Allocation FY 13 $41,181.73 $47,069.83
TOTAL ALLOCATION $110,844.83
TOTAL OBLIGATIONS ($63,775.00)
TOTAL AVAILABLE $47,069.83
Maximum Balanced Allowed $123,545.19
Need to Obligate an Additional $0.00
STP-Urban Balance Based on Current Obligations
OZARKS TRANSPORTATION ORGANIZATION
FUNDS BALANCE REPORT - DECEMBER 2012
16

City of Willard
Allocation/Project Amount
Running
Balance
Allocation FY 11 $60,254.53 $60,254.53
Allocation FY 12 $78,269.58 $138,524.11
Allocation FY 13 $92,353.27 $230,877.38
Hunt/160 ($21,000.00) $209,877.38
TOTAL ALLOCATION $230,877.38
TOTAL OBLIGATIONS ($21,000.00)
TOTAL AVAILABLE $209,877.38
MoDOT Cost Shares
Hunt/160 $0.00
Total Available after MoDOT Cost Shares $209,877.38
Maximum Balance Allowed $277,059.81
Need to Obligate an Additional $0.00
STP-Urban Balance Based on Current Obligations
OZARKS TRANSPORTATION ORGANIZATION
FUNDS BALANCE REPORT - DECEMBER 2012
17

Jurisdiction
2000
Population in
MPO Area
Population in
Urbanized Area
% of MPO
Population
%of Urbanized
Area Population
2010
Population in
MPO Area
% of MPO
Population Percent Change
Christian County 13,488 13,488 5.24% 5.53% 16,196 5.23% 0.00%
Greene County 54,106 54,106 21.01% 22.17% 68,934 22.28% 1.26%
Battlefield 2,452 2,452 0.95% 1.00% 5,590 1.81% 0.85%
Nixa 12,192 12,192 4.73% 5.00% 19,022 6.15% 1.41%
Ozark 9,975 9,975 3.87% 4.09% 17,820 5.76% 1.88%
Republic 8,461 - 3.29% 0.00% 14,751 4.77% 1.48%
Springfield 151,823 151,823 58.96% 62.21% 159,498 51.54% -7.42%
Strafford 1,834 - 0.71% 0.00% 2,358 0.76% 0.05%
Willard 3,179 - 1.23% 0.00% 5,288 1.71% 0.47%
Totals 257,510 244,036 100.00% 100.00% 309,457 100.00% 0.00%
MPO Population Distribution
OZARKS TRANSPORTATION ORGANIZATION
FUNDS BALANCE REPORT - DECEMBER 2012
18
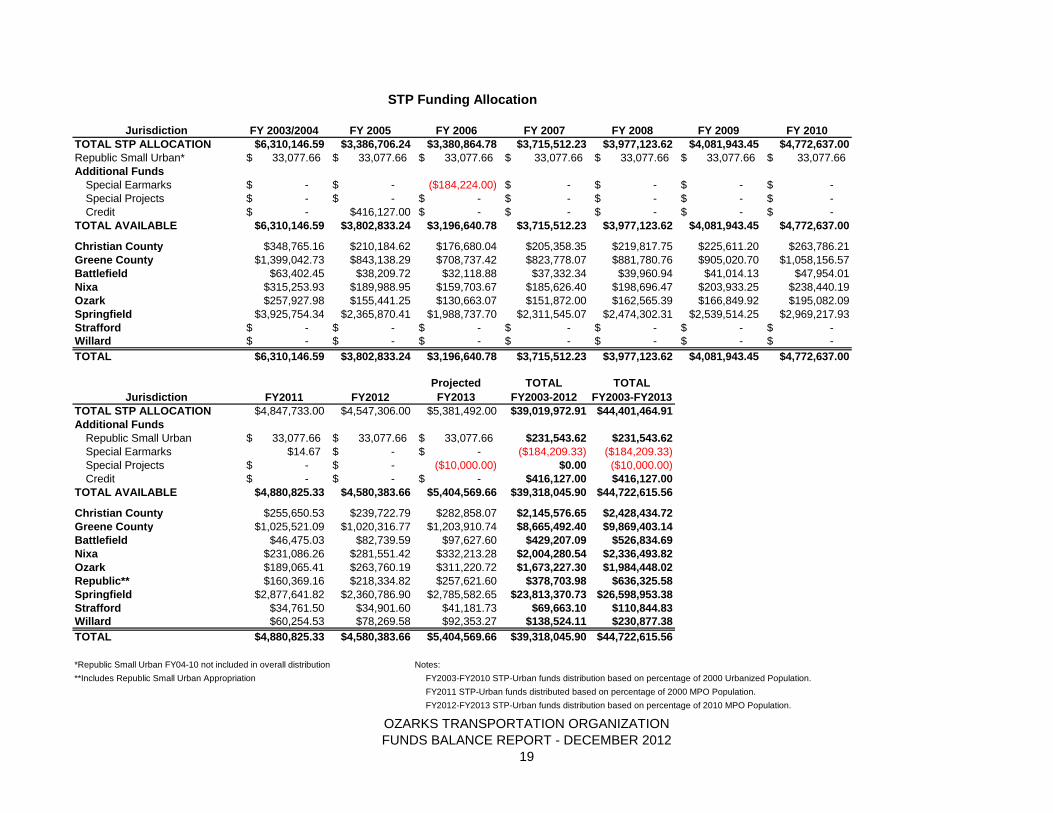
Jurisdiction FY 2003/2004 FY 2005 FY 2006 FY 2007 FY 2008 FY 2009 FY 2010
TOTAL STP ALLOCATION $6,310,146.59 $3,386,706.24 $3,380,864.78 $3,715,512.23 $3,977,123.62 $4,081,943.45 $4,772,637.00
Republic Small Urban* 33,077.66$ 33,077.66$ 33,077.66$ 33,077.66$ 33,077.66$ 33,077.66$ 33,077.66$
Additional Funds
Special Earmarks -$ -$ ($184,224.00) -$ -$ -$ -$
Special Projects -$ -$ -$ -$ -$ -$ -$
Credit -$ $416,127.00 -$ -$ -$ -$ -$
TOTAL AVAILABLE $6,310,146.59 $3,802,833.24 $3,196,640.78 $3,715,512.23 $3,977,123.62 $4,081,943.45 $4,772,637.00
Christian County $348,765.16 $210,184.62 $176,680.04 $205,358.35 $219,817.75 $225,611.20 $263,786.21
Greene County $1,399,042.73 $843,138.29 $708,737.42 $823,778.07 $881,780.76 $905,020.70 $1,058,156.57
Battlefield $63,402.45 $38,209.72 $32,118.88 $37,332.34 $39,960.94 $41,014.13 $47,954.01
Nixa $315,253.93 $189,988.95 $159,703.67 $185,626.40 $198,696.47 $203,933.25 $238,440.19
Ozark $257,927.98 $155,441.25 $130,663.07 $151,872.00 $162,565.39 $166,849.92 $195,082.09
Springfield $3,925,754.34 $2,365,870.41 $1,988,737.70 $2,311,545.07 $2,474,302.31 $2,539,514.25 $2,969,217.93
Strafford -$ -$ -$ -$ -$ -$ -$
Willard -$ -$ -$ -$ -$ -$ -$
TOTAL $6,310,146.59 $3,802,833.24 $3,196,640.78 $3,715,512.23 $3,977,123.62 $4,081,943.45 $4,772,637.00
Jurisdiction FY2011 FY2012
Projected
FY2013
TOTAL
FY2003-2012
TOTAL
FY2003-FY2013
TOTAL STP ALLOCATION $4,847,733.00 $4,547,306.00 $5,381,492.00 $39,019,972.91 $44,401,464.91
Additional Funds
Republic Small Urban 33,077.66$ 33,077.66$ 33,077.66$ $231,543.62 $231,543.62
Special Earmarks $14.67 -$ -$ ($184,209.33) ($184,209.33)
Special Projects -$ -$ ($10,000.00) $0.00 ($10,000.00)
Credit -$ -$ -$ $416,127.00 $416,127.00
TOTAL AVAILABLE $4,880,825.33 $4,580,383.66 $5,404,569.66 $39,318,045.90 $44,722,615.56
Christian County $255,650.53 $239,722.79 $282,858.07 $2,145,576.65 $2,428,434.72
Greene County $1,025,521.09 $1,020,316.77 $1,203,910.74 $8,665,492.40 $9,869,403.14
Battlefield $46,475.03 $82,739.59 $97,627.60 $429,207.09 $526,834.69
Nixa $231,086.26 $281,551.42 $332,213.28 $2,004,280.54 $2,336,493.82
Ozark $189,065.41 $263,760.19 $311,220.72 $1,673,227.30 $1,984,448.02
Republic** $160,369.16 $218,334.82 $257,621.60 $378,703.98 $636,325.58
Springfield $2,877,641.82 $2,360,786.90 $2,785,582.65 $23,813,370.73 $26,598,953.38
Strafford $34,761.50 $34,901.60 $41,181.73 $69,663.10 $110,844.83
Willard $60,254.53 $78,269.58 $92,353.27 $138,524.11 $230,877.38
TOTAL $4,880,825.33 $4,580,383.66 $5,404,569.66 $39,318,045.90 $44,722,615.56
*Republic Small Urban FY04-10 not included in overall distribution Notes:
**Includes Republic Small Urban Appropriation FY2003-FY2010 STP-Urban funds distribution based on percentage of 2000 Urbanized Population.
FY2011 STP-Urban funds distributed based on percentage of 2000 MPO Population.
FY2012-FY2013 STP-Urban funds distribution based on percentage of 2010 MPO Population.
STP Funding Allocation
OZARKS TRANSPORTATION ORGANIZATION
FUNDS BALANCE REPORT - DECEMBER 2012
19

Allocation STP Balance Bridge Balance STP Expenditures
Bridge
Expenditures TOTAL Balance
FY 2003 STP $3,014,341.72 $0.00 $3,014,341.72
FY 2004 STP $3,295,804.87 $6,310,146.59
Bridge $210,242.66 $210,242.66 $6,520,389.25
FY 2005 STP $3,386,706.24 $9,696,852.83
Bridge $203,613.48 $413,856.14
STP Credit $416,127.00
$10,112,979.83 $10,526,835.97
FY 2006 STP $3,380,864.78 $13,493,844.61
Bridge $265,090.64 $678,946.78 $14,172,791.39
ADJUSTMENT TO BRIDGE BALANCE ($0.43) $14,172,790.96
13,493,844.61 $678,946.35 $14,172,790.96
FY 2007 STP $3,715,512.23 $17,209,356.84
Bridge $255,748.00 $934,694.35 $18,144,051.19
Chestnut and National ($20,056.73) $18,123,994.46
17,189,300.11 934,694.35 $18,123,994.46
FY 2008 STP $3,977,123.62 $21,166,423.73
Bridge $297,860.03 $1,232,554.38 $22,398,978.11
10/23/07 JRF/GLENSTONE Springfield ($946,611.27) $21,452,366.84
10/24/07 TMC STAFF Springfield ($112,000.00) $21,340,366.84
11/8/07 TERMINAL ACCESS ROAD Springfield/Greene ($1,993,062.73) $19,347,304.11
11/9/07 TERMINAL ACCESS ROAD Springfield/Greene ($2,461,290.27) $16,886,013.84
12/21/07 GLENSTONE/PRIMROSE Springfield ($134,432.60) $16,751,581.24
1/24/08 TERMINAL ACCESS ROAD Springfield/Greene $1,069,858.00 $17,821,439.24
2/15/08 TERMINAL ACCESS ROAD Springfield/Greene ($508,570.80) $17,312,868.44
2/22/08 CC Nixa ($236,800.00) $17,076,068.44
2/29/08 GLENSTONE/PRIMROSE Springfield $22,101.02 $17,098,169.46
3/7/08 CAMPBELL/WEAVER Springfield/Greene ($124,524.56) $16,973,644.90
4/18/08 17TH STREET/65 Ozark ($244,800.00) $16,728,844.90
5/23/08 SCENIC SIDEWALKS Greene ($74,642.40) $16,654,202.50
7/1/08 ROADWAY PRIORITIZATION Ozark ($14,681.60) $16,639,520.90
8/7/08 MAIN STREET Nixa ($53,822.02) $16,585,698.88
8/7/08 GREGG/14 Nixa ($38,133.92) $16,547,564.96
8/15/08 SCENIC SIDEWALKS Greene $18,089.16 $16,565,654.12
9/18/08 GLENSTONE (H) Greene ($2,700,000.00) $13,865,654.12
$12,633,099.74 $1,232,554.38 $13,865,654.12
FY 2009 STP* $4,081,943.45 $16,715,043.19
Bridge $299,406.62 $1,531,961.00 $18,247,004.19
11/28/2008 TMC SALARIES Springfield ($128,800.00) $18,118,204.19
11/28/2008 CHESTNUT AND NATIONAL Springfield ($78,307.24) $18,039,896.95
12/10/2008 PRIORITIZATION STUDY Ozark $349.91 $18,040,246.86
1/8/2009 LAKE SPRINGFIELD BRIDGE ($780,000.00) $17,260,246.86
3/13/2009 TMC SALARIES Springfield ($61,600.00) $17,198,646.86
3/25/2009 KANSAS/ EVERGREEN Springfield ($300,000.00) $16,898,646.86
5/1/2009 KANSAS/ EVERGREEN Springfield $19,036.04 $16,917,682.90
6/18/2009 NATIONAL/JRF Springfield ($1,244,617.00) $15,673,065.90
7/9/2009 NORTHVIEW ROAD Nixa ($17,386.10) $15,655,679.80
7/9/2009 GLENSTONE/PRIMROSE Springfield ($312,694.65) $15,342,985.15
8/21/2009 13/44 Springfield ($978,000.00) $14,364,985.15
9/17/2009 CC STUDY Christian County ($320,000.00) $14,044,985.15
9/3/2009 TRAFFIC ANALYSIS Ozark ($6,821.60) $14,038,163.55
9/5/2009 KANSAS/ EVERGREEN Springfield $38,753.65 $14,076,917.20
9/22/2009 MASTER TRANSPORTATION PLAN Ozark ($7,243.20) $14,069,674.00
$13,317,713.00 $751,961.00 $14,069,674.00
STP Urban Running Balance
OZARKS TRANSPORTATION ORGANIZATION
FUNDS BALANCE REPORT - DECEMBER 2012
20
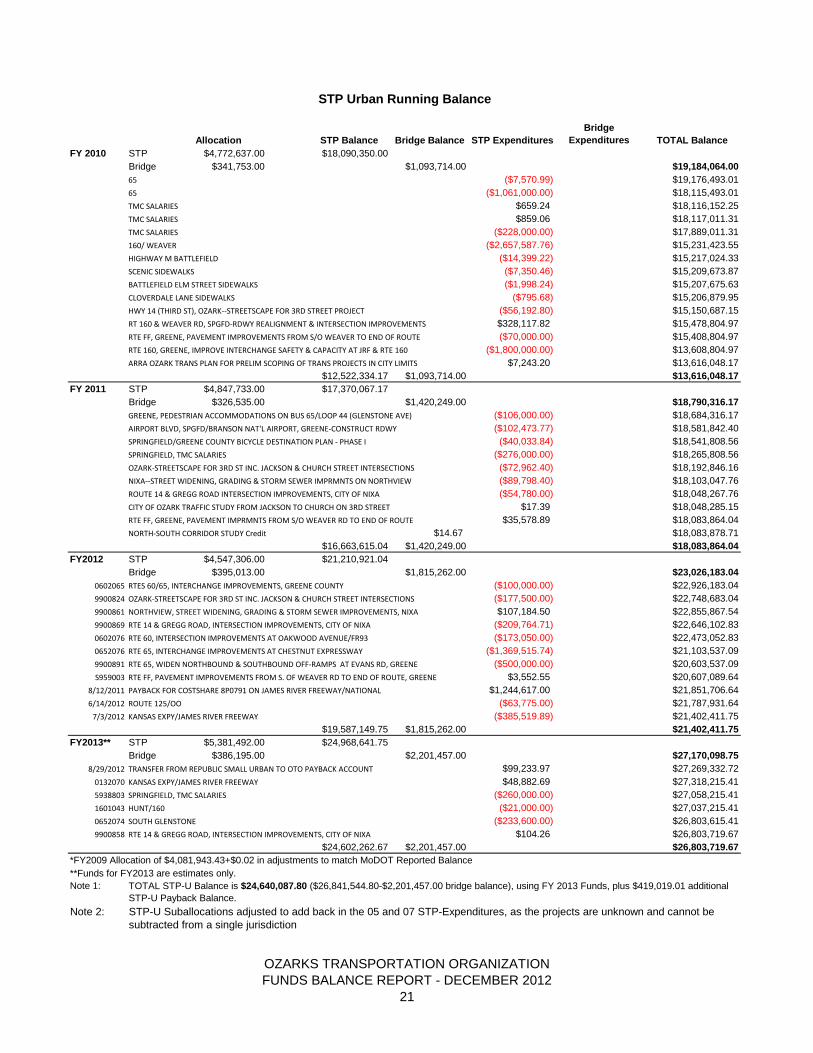
Allocation STP Balance Bridge Balance STP Expenditures
Bridge
Expenditures TOTAL Balance
STP Urban Running Balance
FY 2010 STP $4,772,637.00 $18,090,350.00
Bridge $341,753.00 $1,093,714.00 $19,184,064.00
65 ($7,570.99) $19,176,493.01
65 ($1,061,000.00) $18,115,493.01
TMC SALARIES $659.24 $18,116,152.25
TMC SALARIES $859.06 $18,117,011.31
TMC SALARIES ($228,000.00) $17,889,011.31
160/ WEAVER ($2,657,587.76) $15,231,423.55
HIGHWAY M BATTLEFIELD ($14,399.22) $15,217,024.33
SCENIC SIDEWALKS ($7,350.46) $15,209,673.87
BATTLEFIELD ELM STREET SIDEWALKS ($1,998.24) $15,207,675.63
CLOVERDALE LANE SIDEWALKS ($795.68) $15,206,879.95
HWY 14 (THIRD ST), OZARK--STREETSCAPE FOR 3RD STREET PROJECT ($56,192.80) $15,150,687.15
RT 160 & WEAVER RD, SPGFD-RDWY REALIGNMENT & INTERSECTION IMPROVEMENTS $328,117.82 $15,478,804.97
RTE FF, GREENE, PAVEMENT IMPROVEMENTS FROM S/O WEAVER TO END OF ROUTE ($70,000.00) $15,408,804.97
RTE 160, GREENE, IMPROVE INTERCHANGE SAFETY & CAPACITY AT JRF & RTE 160 ($1,800,000.00) $13,608,804.97
ARRA OZARK TRANS PLAN FOR PRELIM SCOPING OF TRANS PROJECTS IN CITY LIMITS $7,243.20 $13,616,048.17
$12,522,334.17 $1,093,714.00 $13,616,048.17
FY 2011 STP $4,847,733.00 $17,370,067.17
Bridge $326,535.00 $1,420,249.00 $18,790,316.17
($106,000.00) $18,684,316.17
($102,473.77) $18,581,842.40
($40,033.84) $18,541,808.56
($276,000.00) $18,265,808.56
($72,962.40) $18,192,846.16
($89,798.40) $18,103,047.76
($54,780.00) $18,048,267.76
$17.39 $18,048,285.15
$35,578.89 $18,083,864.04
NORTH-SOUTH CORRIDOR STUDY Credit $14.67 $18,083,878.71
$16,663,615.04 $1,420,249.00 $18,083,864.04
FY2012 STP $4,547,306.00 $21,210,921.04
Bridge $395,013.00 $1,815,262.00 $23,026,183.04
0602065 RTES 60/65, INTERCHANGE IMPROVEMENTS, GREENE COUNTY ($100,000.00) $22,926,183.04
9900824 ($177,500.00) $22,748,683.04
9900861 NORTHVIEW, STREET WIDENING, GRADING & STORM SEWER IMPROVEMENTS, NIXA $107,184.50 $22,855,867.54
9900869 RTE 14 & GREGG ROAD, INTERSECTION IMPROVEMENTS, CITY OF NIXA ($209,764.71) $22,646,102.83
0602076 RTE 60, INTERSECTION IMPROVEMENTS AT OAKWOOD AVENUE/FR93 ($173,050.00) $22,473,052.83
0652076 RTE 65, INTERCHANGE IMPROVEMENTS AT CHESTNUT EXPRESSWAY ($1,369,515.74) $21,103,537.09
9900891 RTE 65, WIDEN NORTHBOUND & SOUTHBOUND OFF-RAMPS AT EVANS RD, GREENE ($500,000.00) $20,603,537.09
S959003 RTE FF, PAVEMENT IMPROVEMENTS FROM S. OF WEAVER RD TO END OF ROUTE, GREENE $3,552.55 $20,607,089.64
8/12/2011 PAYBACK FOR COSTSHARE 8P0791 ON JAMES RIVER FREEWAY/NATIONAL $1,244,617.00 $21,851,706.64
6/14/2012 ROUTE 125/OO ($63,775.00) $21,787,931.64
7/3/2012 KANSAS EXPY/JAMES RIVER FREEWAY ($385,519.89) $21,402,411.75
$19,587,149.75 $1,815,262.00 $21,402,411.75
FY2013** STP $5,381,492.00 $24,968,641.75
Bridge $386,195.00 $2,201,457.00 $27,170,098.75
8/29/2012 $99,233.97 $27,269,332.72
0132070 $48,882.69 $27,318,215.41
5938803 ($260,000.00) $27,058,215.41
1601043 ($21,000.00) $27,037,215.41
0652074 ($233,600.00) $26,803,615.41
9900858 RTE 14 & GREGG ROAD, INTERSECTION IMPROVEMENTS, CITY OF NIXA $104.26 $26,803,719.67
$24,602,262.67 $2,201,457.00 $26,803,719.67
*FY2009 Allocation of $4,081,943.43+$0.02 in adjustments to match MoDOT Reported Balance
**Funds for FY2013 are estimates only.
Note 1:
Note 2:
HUNT/160
SOUTH GLENSTONE
TRANSFER FROM REPUBLIC SMALL URBAN TO OTO PAYBACK ACCOUNT
STP-U Suballocations adjusted to add back in the 05 and 07 STP-Expenditures, as the projects are unknown and cannot be
subtracted from a single jurisdiction
TOTAL STP-U Balance is $24,640,087.80 ($26,841,544.80-$2,201,457.00 bridge balance), using FY 2013 Funds, plus $419,019.01 additional
STP-U Payback Balance.
SPRINGFIELD, TMC SALARIES
KANSAS EXPY/JAMES RIVER FREEWAY
OZARK-STREETSCAPE FOR 3RD ST INC. JACKSON & CHURCH STREET INTERSECTIONS
GREENE, PEDESTRIAN ACCOMMODATIONS ON BUS 65/LOOP 44 (GLENSTONE AVE)
AIRPORT BLVD, SPGFD/BRANSON NAT'L AIRPORT, GREENE-CONSTRUCT RDWY
SPRINGFIELD/GREENE COUNTY BICYCLE DESTINATION PLAN - PHASE I
SPRINGFIELD, TMC SALARIES
OZARK-STREETSCAPE FOR 3RD ST INC. JACKSON & CHURCH STREET INTERSECTIONS
NIXA--STREET WIDENING, GRADING & STORM SEWER IMPRMNTS ON NORTHVIEW
ROUTE 14 & GREGG ROAD INTERSECTION IMPROVEMENTS, CITY OF NIXA
CITY OF OZARK TRAFFIC STUDY FROM JACKSON TO CHURCH ON 3RD STREET
RTE FF, GREENE, PAVEMENT IMPRMNTS FROM S/O WEAVER RD TO END OF ROUTE
OZARKS TRANSPORTATION ORGANIZATION
FUNDS BALANCE REPORT - DECEMBER 2012
21

Apportionment Available (OL)
Balance as of September 30, 2011 $18,067,018.13 $16,663,615.04
Fiscal Year 2012 Apportionment (OL percentage = 96.76%) $4,699,572.00 $4,547,306.00
Fiscal Year 2012 Obligations:
0602065 RTES 60/65, INTERCHANGE IMPROVEMENTS, GREENE
COUNTY
-$100,000.00 -$100,000.00
9900824 RTE 14 (THIRD STREET), STREETSCAPE FOR 3RD STREET
PROJECT INCLUDING JACKSON AND CHURCH STREET
INTERSECTIONS, CITY OF OZARK
-$177,500.00 -$177,500.00
9900861 NORTHVIEW ROAD, STREET WIDENING, GRADING AND
STORM SEWER IMPROVEMENTS, CITY OF NIXA
$107,184.50 $107,184.50
9900869 RTE 14 & GREGG ROAD, INTERSECTION IMPROVEMENTS,
CITY OF NIXA
-$209,764.71 -$209,764.71
0602076 RTE 60, INTERSECTION IMPROVEMENTS AT OAKWOOD
AVENUE/COUNTY ROAD 93, CITY OF REPUBLIC
-$173,050.00 -$173,050.00
0652076 RTE 65, INTERCHANGE IMPROVEMENTS AT CHESTNUT
EXPRESSWAY, CITY OF SPRINGFIELD
-$1,369,515.74 -$1,369,515.74
9900891 RTE 65, WIDEN NORTHBOUND & SOUTHBOUND OFF-RAMPS
AT EVANS ROAD TO TWO LANES WITH SIGNALS, GREENE
COUNTY
-$500,000.00 -$500,000.00
S959003 RTE FF, PAVEMENT IMPROVEMENTS FORM SOUTH OF
WEAVER ROAD TO END OF ROUTE, GREENE COUNTY
$3,552.55 $3,552.55
Balance as of September 30, 2012 $20,347,496.73 $18,791,827.64
Fiscal Year 2013 Apportionment (OL percentage = 94.6%, Preliminary) $5,688,681.00 $5,381,492.00
Fiscal Year 2013 Obligations:
9900858 RTE 14 & GREGG ROAD, CITY OF NIXA $104.26 $104.26
Balance as of December 31, 2012 $26,036,281.99 $24,173,423.90
Surface Transportation Program (STP)
Springfield Urban Area
OZARKS TRANSPORTATION ORGANIZATION
FUNDS BALANCE REPORT - DECEMBER 2012
22

Transaction Amount
Cost Share payback on 8P0791 $1,244,617.00
FY2013 Obligations
9900878 - Strafford > Route 125/OO ($63,775.00)
0132070 - Springfield > Kansas and James River Freeway ($385,519.89)
Transfer from Republic Small Urban $99,233.97
FY2013 Obligations
0132070 - Springfield > Kansas and James River Freeway $48,882.69
5938803 - Springfield > Springfield TMC ($260,000.00)
1601043 - Willard > 160 and Hunt Road ($21,000.00)
0652074 - Springfield > South Glenstone ($233,600.00)
Balance of STP-OTO Payback 12/31/2012 $428,838.77
STP - OTO Payback
OZARKS TRANSPORTATION ORGANIZATION
FUNDS BALANCE REPORT - DECEMBER 2012
23

Transaction
Amount
Balance ending August 31, 2009 $124,524.56
Project Obligations:
5907801 ($124,524.56)
Return of funds from Final Voucher:
0602064 and 5900837 $47,749.15
Balance $47,749.15
5900837 $14.67
North-South Corridor Study
Attributed to Springfield in OTO STP Report
Obligated $184,224 in FY2006
Deobligated $14.67 in FY2011
0602064 $47,734.48
Rt 60 at JRF/Glenstone - Grading, drainage, alternate bid PCC or Superpave pavement
TIP # - SP040; Under construction FY08-09; Complete FY10
Obligated $946,611.27 in FY2008
Deobligated $47734.48 in FY2010
Total $47,749.15
No FY2013 Activity
Springfield Area Small Urban
OZARKS TRANSPORTATION ORGANIZATION
FUNDS BALANCE REPORT - DECEMBER 2012
24

Date
Amount
Available
Amount
Obligated Balance
10/1/2003 $303,436.03 $ - $303,436.03
3/19/2004 $33,077.66 ($303,436.00) $33,077.69
2005 $33,077.66 $ - $66,155.35
2006 $33,077.66 $ - $99,233.01
2007 $33,077.66 $ - $132,310.67
2008 $33,077.66 $ - $165,388.33
2009 $33,077.66 ($198,465.00) $0.99
2010 $33,077.66 $33,078.65
2011 $33,077.66 $ - $66,156.31
2012 $33,077.66 ($99,233.97) $0.00
2013 $33,077.66 $ - $33,077.66
City of Republic Small Urban
OZARKS TRANSPORTATION ORGANIZATION
FUNDS BALANCE REPORT - DECEMBER 2012
25

Apportionment Available (OL)
Balance as of September 30, 2011 $1,523,280.00 $1,420,249.00
Fiscal Year 2012 Apportionment (OL percentage = 96.76%) $408,240.00 $395,013.00
Fiscal Year 2012 Obligations:
None $0.00 $0.00
Balance as of September 30, 2012 $1,931,520.00 $1,815,262.00
Fiscal Year 2013 Apportionment (OL percentage = 94.6%, Preliminary) $408,240.00 $386,195.00
Fiscal Year 2013 Obligations:
None $0.00 $0.00
Balance as of December 31, 2012 $2,339,760.00 $2,201,457.00
Highway Bridge Program (BRM)
Springfield Urban Area
OZARKS TRANSPORTATION ORGANIZATION
FUNDS BALANCE REPORT - DECEMBER 2012
26

TAB 7

TECHNICAL COMMITTEE AGENDA 3/20/2013; ITEM II.F.
TIP Tool Website
Ozarks Transportation Organization (Springfield, MO Area MPO)
AGENDA DESCRIPTION: The Ozarks Transportation Organization has purchased an online tool for producing the Transportation Improvement Program. This tool will be used for the development of the FY2014-2017 TIP. The tool is online, with the editing functions for the program accessible via the web, providing access to each OTO jurisdiction. TIP projects are visible and searchable through an online map. Reports can be customized for specific projects or jurisdictions. OTO is hosting training ahead of the Technical Planning Committee meeting. This training will show jurisdictions how to login and edit data. During the TPC meeting, OTO staff will provide a brief overview of the tool including how to search for projects and generate reports. TECHNICAL COMMITTEE ACTION REQUESTED: INFORMATIONAL ONLY - NO ACTION REQUIRED

TAB 8


Dori Grinder, executive director of the Ozark Chamber of Commerce,discusses her thoughts about what issues are important to Missouri
transportation. / Christine Temple/News-Leader
Public considers MoDOT prioritiesWritten by Christine TempleMar. 11 news-leader.com
Want to give your input?
Go to www.missourionthemove.org and navigateto Community Engagement. Select the ProjectSuggestion Form and fill in your suggestions.Also, check the On the Move site to see whenMoDOT will bring its mobile tour to your area.
As the Missouri Department of Transportationcreates its long-term transportation plan, it islooking for input from the community.
With limited funds available to southwestMissouri and costs continuing to rise, projectsand maintenance must be prioritized, said Becky
Baltz, head of MoDOT’s District 7.
A listening session was held Thursday to gather business leaders, community groups and local governmentrepresentatives to discuss what transportation issues are important to southwest Missouri, said Bob Edwards,MoDOT spokesperson.
These listening sessions are part of an effort launched in January called Missouri On the Move. Listeningsessions have been held across the state, Baltz said.
Forty-eight members of the southwest Missouri community shared what they thought MoDOT’s prioritiesshould be looking ahead to the next 20 years.
The attendees were split into groups of five or six to discuss questions about priorities, challenges andopportunities in Missouri transportation.
The groups’ consensus was that maintaining road conditions, upgrading safety features and improving publictransportation were the most important issues.
The groups also said MoDOT should focus on high-need areas. Baltz said 80 percent of traffic uses 17percent of the roads.
Springfield’s 3M plant manager Sylvia Propps said, “I think MoDOT is doing a lot in the community, andthey are certainly doing a lot where 3M is in Springfield. I just want to make sure that we had enough inputand understand what the plans are.
“Transportation impacts economic development, so it is definitely important that we are all on the samepage.”
Jim Anderson, president of the Springfield Chamber of Commerce, said, “Quality transportation equates tobusiness success. Everyone here today has a stake in the conversation.”
Public considers MoDOT priorities | Springfield News-Leader | news-lea... http://www.news-leader.com/article/20130308/NEWS01/303080061/mod...
1 of 2 3/12/2013 2:46 PM

Baltz said that in Missouri, every $1 invested in transportation leads to $4 in new economic activity.
The organizations represented at the session included the Branson Chamber of Commerce, Springfield’sNAACP chapter, Mercy Hospital, AARP and Care to Learn.
Mara Campbell, MoDOT director of organizational results, said On the Move will launch a mobile tour inApril to hear public opinion on MoDOT projects. She said this could mean going anywhere from city councilmeetings to ballgames.
The mobile tour will end in June, and shortly after that MoDOT will have a final draft of its 20-year plan.
Jeff Glenn, CEO of GlennView Strategies, helped to facilitate the discussion between MoDOT and thecommunity during the meeting. He said there is a frank discussion needed about Missouri roads.
“It’s about tradeoffs,” he said. “We will never have enough money to do everything that needs to be done.”
Dan Smith, administrator for the Greene County Highway Department, said, “When MoDOT works withlocal entities and tries to benefit local organizations, it’s a win/win.”
Public considers MoDOT priorities | Springfield News-Leader | news-lea... http://www.news-leader.com/article/20130308/NEWS01/303080061/mod...
2 of 2 3/12/2013 2:46 PM

A Bobcat grapple loader, operated by volunteer Mike Chiles,helps move the heaviest debris off the future path of the OzarkGreenways Trail of Tears in southwest Springfield. The trail isbeing developed with private donations and volunteer labor.
Greenway path marks Trail of TearsWritten by Wes JohnsonMar. 11 news-leader.com
Purchase Image Zoom
A Bobcat grapple loader, operated by volunteer Mike Chiles,helps move the heaviest debris off the future path of theOzark Greenways Trail of Tears in southwest Springfield.The trail is being developed with private donations andvolunteer labor. / Wes Johnson/News-Leader
Amid the whine of chainsaws and the crackling crunches of aheavy grappling machine, volunteers are clearing anovergrown railroad bed in southwest Springfield that traces aportion of the infamous 1830s Trail of Tears.
By the end of the year, the nonprofit Ozark Greenways hopesto transform the rail bed into a hiking/biking trail — the Ozark Greenways Trail of Tears — with signsexplaining the historic nature of the path through southwest Springfield and Greene County.
Historians believe about 4,500 Cherokee died on the trail after being forced off their eastern U.S. lands bythe U.S. government. Several relocation routes crossed the country, the northern route cutting diagonallyacross Greene County.
The Cherokee called the grueling forced relocationnunahi-duna-dlo-hilu-I –“the trail where they cried.”
“There are not many sections of the Trail of Tears that look and feel the way it did when the people walkedit,” said Jack Shryock, a member of the southeastern Cherokee of Georgia who helped clear the trail with achainsaw this week.
“This is something that’s very meaningful to us, to be able to walk these grounds that our people walked onmany years ago and the suffering that they went through,” he said. “We’re feeling some of that as we standon these trails and paths. We just want to do everything we can to bring this to the attention of everybodywho has the heart to feel this is important to them, as it is to us.”
Four people with ties to the Cherokee Nation helped other volunteers clear the long-abandoned railway,which runs southwest from Walnut Lawn Street to the town of Battlefield, where a section of the Trail ofTears Greenway path has already been completed. Several Ozark Greenways board members pitched in thisweek, and brothers Mike and Dan Chiles donated their Bobcat machine with grappling claw to quickly grabtree debris and move it out of the way.
Eventually the Trail of Tears Greenway will run from the city of Battlefield to just south of Nathanael GreenePark, connecting with the South Creek Greenway on its way east through Springfield.
It approximates the route Native Americans walked on their forced relocation. Though it will be arecreational trail, Terry Whaley, executive director of Ozark Greenways, said the trail will respect the past.
Greenway path marks Trail of Tears | Springfield News-Leader | news-le... http://www.news-leader.com/article/20130308/LIFE06/303080034/trail-o...
1 of 2 3/12/2013 2:47 PM

“This is an opportunity to interpret the cultural experience that happened here,” Whaley said. “Over time,we’ve already disfigured the actual route of the Trail of Tears, with railroads and subdivisions. We hope thistrail will be the closest representation of where the Cherokee walked and will give us a chance to tell thestory of the Trail of Tears to a whole new generation of people.”
Along with being a Green County Historic Site, the Trail of Tears through Green County has been designateda National Historic Trail by the National Park Service.
After the trail is completed, Whaley said Cherokee Nation leaders will be invited to dedicate it, much as theydid when the city of Battlefield completed its Trail of Tears park in 2011.
They estimate that more than 13,000 Cherokee passed through the Ozarks from their lands in the Tennessee,North Carolina and Georgia mountains to the designated Indian Territory in present-day Oklahoma.
About the Trail of Tears
To commemorate tragic removal of the Cherokee Nation in 1838-39, Congress designated the Trail of TearsNational Historic Trail in December 1987. The legislated trail encompasses about 2,200 miles of land andwater routes. The Cherokee Heritage Center Museum at Tahlequah, Okla., has an extensive display of theNational Historic Trail of Tears. The Trail of Tears is not one distinct road, but a web of routes and riverstraveled by the organized tribal groups from Alabama, Florida, Georgia, Mississippi, North Carolina andTennessee. The National Park Service has more about the Trail of Tears National Historic Trail athttp://www.nps.gov/trte/index.htm The Museum of the Cherokee Indian in Cherokee, N.C., is anotherresource for information about the Trail of Tears: http://www.cherokeemuseum.org/html/collections_tot.htmlSource: National Park Service
Greenway path marks Trail of Tears | Springfield News-Leader | news-le... http://www.news-leader.com/article/20130308/LIFE06/303080034/trail-o...
2 of 2 3/12/2013 2:47 PM

March 12, 2013
Missourinet
Your source for Missouri News and Sports
HomeArchives
AOWM ArchivesPostcards of State CapitolMissouri Death RowHarry Snodgrass
Contact UsReportersAffiliatesSportsMIZ-SECPostsComments
Politics & GovernmentLegislatureEconomyEducationSports
Press BoxAll Topics
You are here: Home / Featured / Missouri Highways and Transportation Commission announces newchairman
March 7, 2013 By Mary Farucci
The Missouri Highways and Transportation Commission has chosen a new chairman to replace formerchairman Rudy Farber, whose term ended on March 1st. During a highway commission hearing, Farberannounced that Lloyd “Joe” Carmichael (D-Springfield) will succeed him and fill the position as chairman.Carmichael says Farber is a tough act to follow.
Carmichael thanked his fellow commissioners for their vote and confidence. “I’d like to thank Rudy (Farber)for all his hard work over the last year…and if we get this funding proposal through, frankly, it will be in
Missouri Highways and Transportation Commission announces new cha... http://www.missourinet.com/2013/03/07/missouri-highways-and-transpor...
1 of 4 3/12/2013 2:48 PM

Share this:
large part because of your leadership and effort in that regard,” he says. “And that’s a tremendous legacy.”
He says Farber’s message to him is “don’t drop the ball.” Carmichael says he promises to keep the ball inplace while he serves as chairman.
Filed Under: Featured, News, Transportation Tagged With: Chairman Rudy Farber, Lloyd "Joe" CarmichaelNext PostDepartment of Transportation looks to improve safety with technology (AUDIO)Previous PostUPDATE: Rep. Guernsey says anonymous source told him about concealed carry info going toHomeland Security
Featured Stories
Missourinet Blog
Missouri Highways and Transportation Commission announces new cha... http://www.missourinet.com/2013/03/07/missouri-highways-and-transpor...
2 of 4 3/12/2013 2:48 PM

Larry Copeland, @ByLarryCopeland, USA TODAY 1:23a.m. EDT March 11, 2013
Ridership on buses, subways and other modes of public transportation in the USA rose 1.5% to 10.5 billiontrips last year, the highest annual total since 2008, according to a new report.
Although Superstorm Sandy and its aftermath slowed ridership on some of the nation's largest transit systems,at least 16 systems reported record ridership numbers in 2012, says the American Public TransportationAssociation.
"When Sandy hit, and the snowstorm that followed it, an estimated 74 million (transit) trips were lost, and yetwe still had the second-highest ridership since 1957," said APTA president and CEO Michael Melaniphy.
Melaniphy says the increase in transit ridership was driven, at least partly, by high gas prices, the volatility of those prices and the nation's changingdemographics.
"In the last 18 months or so, we've seen prices be very volatile," he says. "When you think about the impact of that on your budget, when you can't counton your transportation costs being consistent day over day, week over week, that's really hard on the budget."
A 2012 report by the National Conference of State Legislatures said that "affordability likely plays a role" in the growth of transit, noting "estimates are thatan individual can save more than $10,000 a year by riding public transit instead of driving."
That report also noted the growing popularity of public transportation, especially among Baby Boomers, empty-nesters and Millennials, who total about150 million people.
"We expect we're going to continue to have good ridership," Melaniphy says. "More than 80% of transit systems have cut services, raised fares orconsidered it. Think about what ridership numbers would look like if they didn't have to cut back."
He says public transportation "is really part of the overall transportation system" that gives people choices for trips.
Melaniphy notes that in 2012, there were 62 local tax elections on transportation funding proposals that had at least a significant transit component; 49 ofthem passed.
"We're seeing record transit ridership on systems all over the country, in the Midwest, the East, the South, the North and the West," he says.
Among them:
In Michigan, the Ann Arbor Transportation Authority (TheRide) saw a 6.6% increase in ridership to a record 6.6 million trips in 2012, spokesman DonKline says. "We have the transit-dependent riders, but we also have the choice riders," he says. "We really play into the national trends, with youngpeople ditching their cars."
The 34-year-old system, which operates mainly in Ann Arbor and Ypsilanti, saw ridership numbers spike last year when gas prices hit $4 a gallon, Klinesays.
In Washington state, ridership on Sound Transit soared 12% last year to just over 28 million — a record in the agency's 14-year history, spokesmanBruce Gray says.
"Ridership growth over the past several years has a lot to do with the recession trailing off, finally, and more people using our trains and buses to get toand from work," he says. "If you add more jobs and higher gas prices, that equals higher ridership on all of our services."
(Photo: Handout)
Public transportation hits 10.5B rides in 2012 http://www.usatoday.com/story/news/nation/2013/03/11/public-transporta...
1 of 2 3/12/2013 2:45 PM
EMILY BADGER JAN 23, 2013 43 COMMENTS
THE BIG FIX
Geometry tells us that the traditional four‐way intersection is inherently dangerous. When you plot all
of the potential points of conflict on a diagram – and transportation engineers actually do this – it
turns out that vehicles have 32 distinct opportunities to collide into one another at the nexus of two
two‐lane roadways. Cars can crash into each other while merging or diverging from a given lane. Then
the worst action happens right in the middle of the interchange, at that perilous point where vehicles
turn left across oncoming traffic.
There, the geometry gets even more gruesome. Cars colliding head‐on, or at a right angle to each
other, are much more likely to cause serious carnage than two vehicles merging at a shallower angle
(as happens on a right‐hand turn). This is what a traditional intersection looks like when you analyze
it as a potential death trap:
Federal Highway Administration
Could These Crazy Intersections Make Us Safer? - Emily Badger - The A... http://www.theatlanticcities.com/commute/2013/01/could-these-crazy-int...
1 of 5 3/12/2013 2:22 PM
With that geometry in mind, it becomes clear what we need in the holy grail of intersection design: a
scheme that would eliminate left‐hand turns while still enabling drivers to move in all four directions.
The basic roundabout does this, with only eight relatively less harmful points of conflict:
Federal Highway Administration
The challenge is to translate that same idea onto much busier roads. You may already be familiar with
the “Michigan Left,” also known as the “median U‐turn,” which solves this problem by requiring
drivers to pass through an intersection, make a u‐turn and then re‐approach it from the opposite
direction, ultimately making a safer right‐hand turn. The concept is also intended to improve traffic
flow by eliminating that pesky left‐turn cycle at the light:
Federal Highway Administration
The simple Michigan Left, though, only begins to tap the wilder dreams of transportation engineers.
They’ve concocted some much more intricate intersection designs – and in a few cases actually built
them – to improve road safety, save states money and generally stall the inevitable expansion of
highways. John Sangster, a doctoral candidate at Virginia Tech and an alternative intersection
enthusiast, introduced us to several and pointed us to some spellbinding animations from the Applied
Technology and Traffic Analysis Program at the University of Maryland (many thanks to researchers
there for sharing these clips).
Meet, for instance, the Jughandle:
And the Superstreet (now gaining steam in North Carolina):
Could These Crazy Intersections Make Us Safer? - Emily Badger - The A... http://www.theatlanticcities.com/commute/2013/01/could-these-crazy-int...
2 of 5 3/12/2013 2:22 PM

And the Diverging Diamond (now in existence outside Springfield, Missouri):
As you can imagine, these designs are not an easy sell. “It’s a two‐fold sale that has to happen,”
Sangster tells us. “We’re not going to build these if they’re not safe. We’re also not going to build them
if they don’t work better.”
In theory – i.e., in conflict‐point diagrams – these intersections should be safer than more traditional
ones. But there are two caveats to that promise: Sangster is really talking about safer intersections for
cars. Pedestrians and bikers aren’t figured into any of these models, and Sangster has yet to encounter
designs that do a good job of incorporating them (or transit). There also isn’t much hard data on the
safety of these designs because so few of them have been built (and even accurately modeling them on
a computer can be tricky and expensive).
These intersections are also clearly not meant for the inner city. They may work best, Sangster says,
when a local road outside of town has grown so congested that it needs to be converted into a
highway. Some of these designs could delay that prospect, while allowing communities to forgo the
expensive construction of ramps, bridges and underpasses, still facilitating heavier traffic flow.
Traffic engineers generally measure the performance of an intersection in the average delay per
vehicle sitting at it. This means that if 50 cars on a major road have to wait 30 seconds each at a red
light so that a lone car can pass from a side street, you don’t have a very efficient intersection.
“It’s definitely not trying to give equal time to everyone on the road,” Sangster says. “It’s trying to
make the whole road work better.ʺ And sometimes that means making life extremely inconvenient for
a small number of drivers in order to make the whole system work better for the majority. More often,
this also means designing increasingly complex geometry, as in this “Continuous Flow” model:
Could These Crazy Intersections Make Us Safer? - Emily Badger - The A... http://www.theatlanticcities.com/commute/2013/01/could-these-crazy-int...
3 of 5 3/12/2013 2:22 PM

Sponsored Links
Elsewhere on the Web
Create An Edible Container Garden
With Kids (The Honest Company)
8 College Degrees That Arenʹt Worth
The Money (Salary.com)
10 Things You Should Never Buy at
Garage Sales (Reader's Digest)
Auto Service Retailers Ignore Younger
Drivers (BusinessNewsDaily)
Why You Shouldn’t Buy A Hybrid
(Consumer Car Reviews)
The Maryland researchers have even modeled some three‐dimensional solutions that, for instance,
elevate drivers making left turns to keep them out of the main roadway:
None of these models are to be confused with some equally mind‐boggling (and pedestrian‐
unfriendly) simulations of intersections for driverless cars. These ʺalternativeʺ intersections,
conversely, would require actual human drivers to learn radically new – and often counterintuitive –
traffic patterns. And we all know how thatʹs gone in America with the simple roundabout.
“The biggest problem is that you can educate locally as many people as you can reach,” Sangster
admits. “But there’s always going to be somebody visiting from out of town.”
Keywords: traffic, Road Safety, roundabouts, Intersections
Emily Badger is a staff writer at The Atlantic Cities. Her work has previously appeared in Pacific Standard,
GOOD, The Christian Science Monitor, and The New York Times. She lives in the Washington, D.C. area. All
posts »
Don't miss the latest from Cities – subscribe to our daily email
Could These Crazy Intersections Make Us Safer? - Emily Badger - The A... http://www.theatlanticcities.com/commute/2013/01/could-these-crazy-int...
4 of 5 3/12/2013 2:22 PM

February 22, 2013
Wyoming Officials Approve 10-Cent Fuel Tax Increase forTransportation
Wyoming Governor Matt Mead last week signed into law a 10-cent a gallon fuel tax increase thatraises the state tax on gas and diesel fuels to 24 cents per gallon, effective July 1.
According to the Casper (Wyoming) Star Tribune, the increase should raise roughly $71 million in the2014 fiscal year with $47 million set aside for state highways, $16 million for county roads, and therest for local roads and state parks.
The fuel tax increase, the first in Wyoming since 1998, was supported by a pro-fuel tax hike coalitionof 18 organizations led by the Wyoming Taxpayers Association and included the mineral, trucking,tourism, and ranching industries as well as the Wyoming Association of Municipalities and theWyoming Association of County Commissioners.
Wyoming Department of Transportation officials have identified a $135 million annual fundingshortfall.
Questions regarding this article may be directed to [email protected].
http://www.aashtojournal.org/Pages/022213Wyoming10cent.aspx?Journ...
1 of 1 3/12/2013 2:38 PM
HOME | E-MAIL | SHARE | PRINT | SUBSCRIBE | ARCHIVE SEARCH: GO
March 1, 2013
© American Association of State Highway and Transportation Officials.444 N Capitol St. NW - Suite 249 - Washington, DC 20001
About AASHTO | Legal Information | Privacy Policy | Copyright Notice
Virginia Passes Measure to Eliminate State GasTax, Fund Transportation through Sales Tax
The Virginia General Assembly last week approved a transportation funding package that is expected to raise more than$860 million per year for transportation.
Under the new law, that state gas tax will be replaced by a 3.5 percent wholesale tax on fuel and a 6 percent tax on dieselfuel. The deal also includes an increase in the registration fee for electric cars (now up to $100), while also making thatfee mandatory for alternative fuel and hybrid vehicles. Additionally, the plan will increase the sales tax from 5 percent to5.3 percent on nonfood merchandise and rely on some state general fund revenues.
Gov. Bob McDonnell, who originally proposed a similar transportation package on Jan. 8, hailed the passage of the bill.
"Virginia's economy depends upon a modern transportation system," McDonnell said in a statement. "Without good roads,rail, transit, and bridges we cannot attract the new businesses that will create the good-paying jobs our citizens need anddeserve. A continued failure to dramatically improve transportation would leave the Commonwealth less competitiveeconomically, shrink our tax base, and endanger our well-earned reputation as the best state in the nation in which to dobusiness."
Though passage of the bill was not easy, McDonnell said the support he received from various individuals and groupshelped push the plan through.
"I thank the over 60 percent of legislators in each chamber who voted for this bill and I thank Secretary of TransportationSean Connaughton and his team and the many individuals and groups all across Virginia who have advocated for thislegislation from business to labor, and local government to technology."
Virginia will see the state gas tax change to a sales tax in July. Additional information on the plan is available here.
Questions regarding this article may be directed to [email protected].
AASHTO Journal - March 1, 2013 - Virginia Passes Measure to Eliminat... http://www.aashtojournal.org/Pages/030113VirginiaTranspoFunding.asp...
1 of 1 3/12/2013 2:37 PM

ERIC JAFFE MAR 11, 2013 17 COMMENTS
THE BIG FIX
This month marks 120 years since the federal government got involved in funding road
transportation. (Strange as it sounds, bicycle advocates did the bulk of the lobbying.) The original
Office of Road Inquiry — today, the Federal Highway Administration — was a line item with a budget
of $10,000. That was only enough money to build about three miles of road, and the office wasnʹt
empowered to build roads anyway, but states fought tooth and nail against giving the feds even this
incredibly modest level of transport oversight.
Today the federal transportation program faces perhaps its greatest
challenge since that shaky start. The most urgent problem is
funding. The Highway Trust Fund that pays for Americaʹs road
and rail program is heading straight toward bankruptcy. For two
decades politicians have refused to raise the 18.4‐cents‐per‐gallon
gas tax that populates the trust, even as it steadily loses purchasing
power to inflation and fuel‐efficient cars. The public has yet to
embrace alternative funding sources — road fares or mileage fees
on the user‐pay side favored by economists; income taxes on the
social welfare end — in part because people (mistakenly) believe
they already pay a lot for transportation.
Money is only part of the problem. The other big sticking point is
purpose. Thereʹs no longer a clear priority for national transport
investment like there was during the heyday (or, rather, hey‐half
century) of the interstate highway program. Maintaining existing
roads lacks the ribbon‐cutting appeal of opening new ones. The
closest thing to a new national initiative is a high‐speed rail
program, but while regional lines will no doubt emerge in dense
corridors like California and the Northeast, political support for a national bullet train network is, to
be generous, rather tepid. Lawmakers can barely muster the energy to pay for the rail system America
already has, let alone a brand new one.
At stake is the very nature of Americaʹs top‐down system of surface transportation funding.
Confronted with these obstacles, officials and experts have intensified the debate over what role the
federal government will play in funding transportation. Many are wondering, just as they did 120
years ago, whether there should be a federal role at all.
The End of Federal Transportation Funding as We Know It - Eric Jaffe -... http://www.theatlanticcities.com/politics/2013/03/its-end-federal-transpor...
1 of 4 3/12/2013 2:27 PM

The Case for Devolution
On one hand, there are those who believe the country would be better off if federal governance of
transportation were either significantly reduced or entirely eliminated. Last year urban scholar
Edward Glaeser of Harvard called for the country to de‐federalize transport spending because the
central government has played an ʺoutsized roleʺ for decades. Earlier this year, writing for Bloomberg
View, former New York City planning guru Rohit Aggarwala echoed the sense that the time has
arrived for ʺcutting Washingtonʹs role in surface transportationʺ:
Ending the federal surface‐transportation program would be a radical move. But if Congress
can’t get in gear, moving its stalled car out of the way of American transportation policy might
help us all get where we need to go.
Many experts see a great deal of logic in devolving transportation funding responsibility to states and
localities. The vast majority of the countryʹs road network is local, and likewise most travel occurs in a
personʹs home county [PDF], so to some extent it makes sense for this level of government to generate
its own funding revenues and establish its own funding priorities. A World Bank report from back in
1994, which examined a number of developed countries, even concluded that as decentralization
increases, so does local infrastructure spending.
Proponents of decentralization also point out that, like it or not, the process has already started. This
past fall, a number of cities passed referendums to fund local transportation, extending a trend that
goes back several years. Legislatures from Oregon to Virginia are handling the depleted power of state
gas taxes by testing out new funding mechanisms like V.M.T. fees or sales taxes. In other words, with
the federal government struggling to find its own funding footing, states and localities have found
ways to fill the gaps themselves.
ʺIʹd expect under a decentralized system weʹd see more variation
across metropolitan areas,ʺ says planner David King of Columbia
University. ʺWe donʹt necessarily have shared needs, or
homogenous needs across the country, when it comes to what we
need for transportation.ʺ
King and others in the decentralization camp note that the federal
government frequently gets transport policy wrong. Financial and
housing incentives used during the interstate construction era led,
in large part, to the sprawl thatʹs crippling metropolitan areas
today. Thereʹs widespread feeling that federal involvement in
transportation has resulted in more roads and rails than America
needs, with the prospect of free federal money encouraging
questionable projects — such as the Detroit People Mover years
ago, and some streetcar lines more recently — that might not have
been built with local funding alone.
On top of all that, thereʹs reason to question whether the federal
government actually redistributes Highway Trust funding fairly. Under the current system, states
send their federal gas taxes to Washington, which returns most of the money (at least 95 cents on the
dollar in the latest bill) to its place of origin. The feds have the power to redistribute the difference to
states with greater needs, but a recent study published in the journal Transportation found that states
benefiting from the system have less highway usage and higher income — not to mention better
Congressional committee representation.
In other words, conclude study authors Pengyu Zhu of Boise State University and Jeffrey Brown of
Florida State University, the extra money goes to places that may not need it at all:
These findings indicate that the user tax revenues are not used in places where they are most
needed. Thus they provide little empirical support for any compelling policy argument for
continued geographic redistribution of federal highway user tax dollars.
ʺDecentralization of transport finance is happening, and we shouldnʹt fear it,ʺ says King. ʺIt may or
may not be better than what we have, but the current system is not sufficiently wonderful that we
should fight to make sure it remains.ʺ
The Case for Continued Federal Funding
Last month, for his first hearing as chair of the House transportation committee, Congressman Bill
The End of Federal Transportation Funding as We Know It - Eric Jaffe -... http://www.theatlanticcities.com/politics/2013/03/its-end-federal-transpor...
2 of 4 3/12/2013 2:27 PM
Shuster convened a panel to discuss ʺThe Federal Role in Americaʹs Infrastructure.ʺ All three
witnesses advocated for central involvement to continue, stressing the historical roots of national
transportation investment and the need to coordinate interstate infrastructure.
ʺItʹs kind of a myth that it will be feasible for the federal government simply to shed responsibility and
leave it to the states,ʺ says transport scholar Martin Wachs of the RAND Corporation, a
California‐based think tank. ʺThereʹs a national interest in every aspect of the transportation system,
and itʹs a political question as to how to organize it. Itʹs a terrible mistake to think that the best thing to
do is just to let it go.ʺ
A major counterpoint to devolution is that state infrastructure
spending isnʹt always done wisely. Many new state and local
funding measures have involved sales tax increases, but research
has found that approach can be regressive, disproportionately
harming low‐income residents compared to wealthier parts of the
population [PDF]. Virginiaʹs new funding system has drawn some
of this criticism: by scrapping the user‐paid gas tax for a series of
other taxes, the plan addresses the budget shortage but threatens
transportation equity, especially if most of the money goes toward
building roads.
Some progressives believe that transportation is a basic social
service that must be provided to all people equally, and that many
states and regions will simply extend a general dependency on
single‐occupancy car travel if left to their own devices. A report
released last July [PDF] by the Tri‐State Transportation Campaign
found that many states clearly prioritize road funding, leaving little
opportunity to expand transit systems. Yonah Freemark of the
Transport Politic blog (and occasional Atlantic Cities contributor) has
found that metro areas with high poverty rates spend less money
on public transit networks — a problem he feels would be
exacerbated in the absence of federal involvement:
We should reevaluate whether it is reasonable for metropolitan areas to take responsibility for
funding transit, or whether such funding concerns would be better placed in the hands of
national government decision‐makers, who might be more likely to prioritize equal spending
on transit across regions.
Another question facing strict devolution is whether current federal regulations would remain in
place. If the federal government stopped collecting a gas tax, for instance, would it still oblige states to
meet responsibilities in the Americans with Disabilities Act, stating that transit systems must offer
comparable services to the disabled? Some states might consider such a scenario an unfunded
mandate and either ignore the regulations or make drastic cuts to other parts of the transportation
system to cover its costs.
Perhaps the biggest fear about decentralization is that certain states will decide to let their segments of
the national highway or rail systems slip into disrepair. Speaking at the recent Congressional hearing,
Edward Rendell, former governor of Pennsylvania, worried that without federal oversight, ʺAmerica’s
transportation infrastructure would resemble a patchwork of disconnected roads and railsʺ [PDF]. As
a cohesive unit, the national infrastructure systems keep the cost of commercial transport incredibly
low.
ʺI think that itʹs probably possible for the federal government and state governments to reduce their
responsibility for some roads, for some rail lines, and so on,ʺ says Wachs. ʺI also think, however, in the
end weʹre going to decide that there is a federal role. That we are a more integrated national society
today than weʹve been at any point in our history.ʺ
Ideas for Reform
Of course thereʹs a middle ground to this discussion. The federal government can keep some sort of
funding involvement in the nationʹs roads and rails but see its traditional top‐down role of governance
reformed. Metropolitan policy expert Robert Puentes of the Brookings Institution has called for a new
model that flips the old one on its head, with states and cities now taking the lead on funding. ʺThe
question of devolution in this context is provocative,ʺ he wrote last spring, ʺbut itʹs not an either/or.ʺ
Americans interested in a new model of transport governance might want to take a long hard look at
their neighbors up north, says David King. Canadaʹs funding system does include a federal gas tax,
but that money is returned to provinces with few restrictions, more or less enabling localities to direct
The End of Federal Transportation Funding as We Know It - Eric Jaffe -... http://www.theatlanticcities.com/politics/2013/03/its-end-federal-transpor...
3 of 4 3/12/2013 2:27 PM

Sponsored Links
Elsewhere on the Web
Restaurant owners: Turnover tables
quicker with right wiping strategy
(Tork USA)
Don’t Make This Common Design
Mistake! (Interior Decor Experts)
How the Fiscal Cliff Deal Affects Tax
Planning in 2013 (U.S. Trust)
Who is subsidizing whom?
(ExxonMobil's Perspectives Blog)
3 Things Bloggers Need to Know
About Taxes (H&R Block)
[?]
spending as they see fit. In fact, only 7 percent of the Canadian federal fuel tax went to roads,
according to a 2005 report by transport economist Robin Lindsey [PDF, p. 55].
Thatʹs not to say Canadaʹs central government devolves all responsibility. Far from it. Individual
projects can receive federal grants, and the federal government recently dedicated a portion of the gas
tax to urban transport. But even with provinces and cities taking the lead, Canada has nevertheless
produced some excellent public transit. Canadaʹs top cities outrank every American city but New York
on important ridership and farebox metrics — though Lindsey is quick to note that much of this
difference is the result of Canada having far fewer interstates running through its cities.
ʺI would say the U.S. model and the Canadian model differ quite a bit, but you canʹt really say one is
clearly superior to another,ʺ he says.
David Levinson, transport scholar at the University of Minnesota, has proposed a number of new
governance models. One popular plan, drafted with Matthew Kahn and published by Brookings in
2011, outlines a three‐step federal model of first fixing existing roads with the gas tax, then expanding
them with competitive funding, then rewarding strong projects with subsidies. At his Transportationist
blog, Levinson has also suggested limiting the federal role to research and regulation.
The best system, he says, might reduce central authority and reconfigure state departments of
transportation as public utilities. In this ʺenterprisingʺ model, as Levinson called it in a January report
[PDF], a new transport utility would work with a local oversight commission to establish fair usage
rates and maintain service quality. Australia operates with this type of system, as does the
multi‐modal TransLink agency in Vancouver, as do water and sewage and electric companies in the
United States.
If infrastructure governance were a bit more decentralized, says Levinson, youʹd expect innovative
concepts like enterprising transport to reach the fore. (ʺItʹs the ʹlaboratories of democracyʹ idea,ʺ he
says.) Then again, given the complexity of the situation, not to mention the general intransigence of
the federal government in recent times, it seems quite possible that lawmakers will respond to the
urgent need for transport funding reform with no reform at all.
ʺMy sense is itʹs more likely to fade away than it is be reversed in terms of a great new federal role or
be eliminated entirely,ʺ says Levinson.ʺ The status quo policy is to leave the gas tax where it is, and it
will slowly diminish over time until it becomes almost an irrelevancy. If I had to predict what I think
will happen over the next 20 years, I think thatʹs the most likely outcome.ʺ
Top image: Brad Ingram/Shutterstock.com
Keywords: Transportation, Federal Funding, Transportation Funding
Eric Jaffe is a contributing writer to The Atlantic Cities and the author of The Kingʹs Best Highway: The Lost
History of the Boston Post Road, the Route That Made America. He lives in New York. All posts »
Don't miss the latest from Cities – subscribe to our daily email
Copyright 2013 The Atlantic Monthly Group. CDN powered by Edgecast Networks. Insights powered by Parsely.
The End of Federal Transportation Funding as We Know It - Eric Jaffe -... http://www.theatlanticcities.com/politics/2013/03/its-end-federal-transpor...
4 of 4 3/12/2013 2:27 PM

HOME | E-MAIL | SHARE | PRINT | SUBSCRIBE | ARCHIVE SEARCH: GO
March 1, 2013
© American Association of State Highway and Transportation Officials.444 N Capitol St. NW - Suite 249 - Washington, DC 20001
About AASHTO | Legal Information | Privacy Policy | Copyright Notice
Teen Driver Fatalities Jump in 2012, Preliminary Data Shows
More teenage drivers died in the first six months of 2012 than in the same period the previous year, according topreliminary data released Tuesday by the Governor's Highway Safety Association. But while the uptick in teen driverfatalities is alarming, it is out of sync with the general trend that shows an overall decrease in teen driver deaths.
"We are still at a much better place than we were ten or even five years earlier," said Dr. Allen Williams, the report'sauthor, in a statement. "However, the goal is to strive toward zero deaths, so our aim would be that these deaths shouldgo down every year."
According to the report, 240 fatalities of 16 and 17-year-old drivers were reported in the first half of 2012, up from 202 inthe first six months of 2011. The increase was higher for 16-year-olds (from 86 in 2011 to 107 in 2012, or a 24 percentincrease) than 17-year-olds (from 116 in 2011 to 133 in 2012, or a 15 percent increase).
There are several factors that could have contributed to the rise in teen driver fatalities in the preliminary 2012 data,Williams said, including the improving economy (as teens are more affected by economic downturns in their ability todrive, so an improved economy means more drivers). Another factor could be that the benefit of graduated driverlicensing could be leveling off, Williams said.
GHSA chair and Director of the Tennessee Governor's Highway Safety Office Kendall Poole said that there is clearly morework to be done.
"Any increase in highway deaths is unacceptable, particularly among our teens. We know from research and experiencethat teen drivers are not only a danger to themselves, but also a danger to others on the roadways," said Poole.
The full 14-page report is available here.
Questions regarding this article may be directed to [email protected].
AASHTO Journal - March 1, 2013 - Teen Driver Fatalities Jump in 2012,... http://www.aashtojournal.org/Pages/030113GHSAteendriver.aspx?Journ...
1 of 1 3/12/2013 2:35 PM

EMILY BADGER FEB 28, 2013 33 COMMENTS
Sponsored Links
Elsewhere on the Web
The 12 Worst Supermarkets in America
(The Fiscal Times)
3 Things Bloggers Need to Know
About Taxes (H&R Block)
Restaurant owners: Turnover tables
quicker with right wiping strategy
(Tork USA)
10 Cheapest U.S. Cities Worth Visiting
CHARTS
Once a week or so we come across yet another sign that Millennials care much less about car
ownership than previous generations. Theyʹre less likely to drive than their parents. Theyʹve got less
debt tied up in cars. Theyʹd rather hang out with their friends on Twitter than get in a car to go see
them.
And hereʹs yet another: Ask Millennials which piece of technology they could least live without, and it
turns out theyʹd more happily part with their cars than their computers or cell phones. That question,
graphed below, comes from the third installment of Zipcarʹs annual Millennial survey.
According to those results, which are based on a national online survey of 1,015 adults, cars are the
most prized piece of technology (at least among those offered here) among every age group but the
under‐35s. Our other big takeaway from this report: No one cares about the lonely TV any more.
Keywords: Computers, car‐sharing, Sharing, Millennials, Zipcar
Emily Badger is a staff writer at The Atlantic Cities. Her work has previously appeared in Pacific Standard,
GOOD, The Christian Science Monitor, and The New York Times. She lives in the Washington, D.C. area. All
posts »
Don't miss the latest from Cities – subscribe to our daily email
Millennials Say They'd Give Up Their Cars Before Their Computers or C... http://www.theatlanticcities.com/commute/2013/02/millennials-say-theyd...
1 of 2 3/12/2013 2:30 PM

SARA JOHNSON MAR 05, 2013 16 COMMENTS
MAPS
Hereʹs our takeaway from the Census Bureauʹs latest report on commute times: not much has changed
in the past decade.
The percentage of workers with commutes of an hour or more has remained fairly stable from 2000 to
2011, hovering right around 8 percent (8.1 percent of all workers who do not work from home in
2011). The national average commute time hasnʹt changed much either.
But like most things, the awfulness of your commute depends a lot on where you live. See, for
example, this map below of where the ʺmegacommuters,ʺ (those 586,805 unlucky Americans who
travel at least 50 miles and 90 minutes to work each day) live.
The two tables below highlight the top metro areas for these super‐long commutes. Note that the San
Francisco metro has both the longest average travel time and average distance.
The Census also breaks out the rate of long commutes by the type of community workers are coming
from and headed to. As you might expect, the trip from the suburb to the city had the highest share of
workers with a commute of over an hour, followed by those traveling from a city to a suburb. Beyond
that, the rate of hour‐plus commutes is about the same outside a metro area and within cities, and
even smaller from suburb to suburb.
Nearly 80 percent of workers who donʹt work from home drive to work alone; about 10 percent
carpool. Almost a quarter of workers who have a commute of over an hour use public transportation
to get to work, compared to just 3.7 percent for those with sub‐hour commutes. (Put another way,
Where It Takes the Longest to Get To Work - Sara Johnson - The Atlanti... http://www.theatlanticcities.com/commute/2013/03/where-it-takes-longes...
1 of 2 3/12/2013 2:28 PM

Sponsored Links
Elsewhere on the Web
8 College Degrees That Donʹt Pay Off
(Salary.com)
11 Silly Signs Seen Around the U.S.
(Reader's Digest)
Cheesy Surprise Cornbread Biscuits
(Pillsbury)
3 Things Bloggers Need to Know
About Taxes (H&R Block)
Restaurant owners: Turnover tables
quicker with right wiping strategy
(Tork USA)
[?]
almost 2.5 million people spend an hour or more getting to work on public transit.)
The report suggests that the use of public transportation may be related to commute time, noting that
ʺthe average travel time for public transportation commuters is consistently longer than that of the
general working population.ʺ
Some great maps on all this commute data have circulated this morning. The Washington Post
mapped where people travel to get to work. WNYC created a fantastic map showing average commute
times by zip code.
Keywords: public transit, Suburbs, Census, commute
Sara Johnson is a fellow at The Atlantic Cities. All posts »
Don't miss the latest from Cities – subscribe to our daily email
Copyright 2013 The Atlantic Monthly Group. CDN powered by Edgecast Networks. Insights powered by Parsely.
Where It Takes the Longest to Get To Work - Sara Johnson - The Atlanti... http://www.theatlanticcities.com/commute/2013/03/where-it-takes-longes...
2 of 2 3/12/2013 2:28 PM

SARAH GOODYEAR MAR 11, 2013 7 COMMENTS
A year and a half ago, Mathieu Lefevre, a 30‐year‐old artist and resident of Williamsburg, Brooklyn,
was hit and killed by the driver of a truck while riding his bicycle. The driver left the scene and later
claimed he had no idea he had struck anyone. Lefevre’s family, who are from Canada, traveled to the
United States to protest the lax investigation of their son’s death by the New York City Police
Department.
The driver was never charged in the case, and the Lefevre family went to court to protest the way
information about their son’s death had been withheld from them – a case that was eventually
dismissed as moot.
The NYPD’s attitude toward what happened that October night in 2011 was summed up by a remark
made by an officer to Metro, a local newspaper:
“There’s no criminality,” an NYPD spokesman told Metro. “That’s why they call it an accident.”
But police in New York won’t be calling occurrences like the one that took Lefevre’s life “accidents”
any longer – at least not officially. According to a report in The New York Times, as part of a package of
reforms in the way it handles traffic fatalities, the NYPD is now replacing the term “accidentʺ with the
word “collision.ʺ
ʺIt’s not just semantics,ʺ says Paul Steely White, executive director of the advocacy group
Transportation Alternatives. ʺIt underscores a new approach.ʺ
There has been a global movement over the past few years to change the way people talk about traffic
deaths. The British group RoadPeace has been one of the advocacy organizations calling for change,
and recently tried – unsuccessfully – to get The Guardian to change its style from “accident” to “crash”
or “collision” – a change that was made by the peer‐reviewed BMJ (British Medical Journal) back in
2001.
To explain the importance of language in this case, RoadPeace cites [PDF] a key passage from a 2010
report [PDF] by the Campaign for Global Road Safety, authored by Kevin Watkins of Oxford
University:
It's No 'Accident': NYPD Changes the Way It Talks About Traffic Deaths... http://www.theatlanticcities.com/commute/2013/03/whats-word-nypd-ch...
1 of 3 3/12/2013 2:26 PM

Sponsored Links
Elsewhere on the Web
10 Things You Should Never Buy at
The vocabulary of the road traffic injury epidemic helps to explain the neglect. While child
deaths from, say, malaria are viewed as avoidable tragedies that can be stopped through
government action, road traffic deaths and injuries are widely perceived as ‘accidents’ –
unpredictable events happening on a random basis to people who have the misfortune to be in
the wrong place at the wrong time.
The vocabulary is out of step with reality. Road traffic fatalities and injuries are accidents only
in the narrow technical sense that they are not intended outcomes. They are eminently
predictable, and we know in advance the profile of the victims. Of the 3,500 people who will die
on the world’s roads today around 3000 will live in a developing country and at least half will
be a pedestrian or vulnerable road user who is not driving a car. When it comes to road traffic
injury, the future is not just predictable – it is also changeable. Far from being the consequence
of forces beyond human control, road traffic death and disability is in large measure the
consequence of government action and inaction.
In New York, the police department has been criticized for many years by Transportation Alternatives
and other advocacy groups for its reluctance to press criminal charges in traffic deaths. Even as the
city has made enormous advances in street design and in education campaigns about traffic safety,
enforcement has lagged.
As I wrote in a piece about pedestrian deaths a couple of weeks back, the words “no criminality is
suspected” have become a kind of catchphrase for an attitude that deaths caused by automobiles are
just part of the price we have to pay for living in a densely populated modern city. The NYPD’s way of
talking about and handling these cases has added to an atmosphere that makes it difficult for
prosecutors to prove that reckless drivers are acting outside of the standards that would be observed
by a “reasonable person.”
But the changes in NYPD policy indicate the department’s attitude might finally be shifting along with
its language. Until now, the department’s Accident Investigation Squad has only been deployed when
a crash victim was dead or assessed as “likely to die.” Now, that unit – soon to be renamed the
Collision Investigation Squad – will respond when there has been a critical injury or when a Police
Department duty captain believes the extent of the injuries and/or unique circumstances of a collision
warrant such action,” according to a letter to the City Council from NYPD commissioner Ray Kelly
cited by the Times. Kelly also wrote: ʺIn the past, the term ‘accident’ has sometimes given the
inaccurate impression or connotation that there is no fault or liability associated with a specific event.ʺ
It is a huge change in tone for a department that has come under increasing pressure in recent years to
reform its approach to traffic fatalities.
White says he is also heartened by a related policy change that will put more control over crash
investigations with local precinct authorities. ʺIt’s local police who are more concerned about what’s
happening on their local streets,ʺ says White, who also noted that the new policies will lead to a more
evidence‐based, data‐driven approach to investigating – and preventing – more traffic deaths in the
city.
White adds that the changes come after family members and friends of crash victims, including
Mathieu Lefevre’s, have spoken out repeatedly about the the NYPD’s flawed and opaque handling of
traffic deaths.
ʺThis would not be happening without those brave folks standing up on the steps of City Hall and
testifying before the City Council,ʺ says White. ʺThey spoke with such moral authority that it was hard
for the NYPD to ignore.ʺ
Top image: Mathieu Lefevreʹs mother, Erika Lefevre, speaking at a Transportation Alternatives rally.
(Dmitry Gudkov/Transportation Alternatives)
Keywords: New York, Traffic Fatalities, pedestrian safety, NYPD, Language
Sarah Goodyear has written about cities for a variety of publications, including Grist and Streetsblog. She
lives in Brooklyn. All posts »
Don't miss the latest from Cities – subscribe to our daily email
It's No 'Accident': NYPD Changes the Way It Talks About Traffic Deaths... http://www.theatlanticcities.com/commute/2013/03/whats-word-nypd-ch...
2 of 3 3/12/2013 2:26 PM

W orkers can be at significant risk when installing roadside equipment. Twenty-two-year-old Nick Micieli,
for example, was killed last June in Milton – a Toronto suburb in Canada – while installing a traffic-counting device. He and a colleague were working on the road in front of their van, which was rear-ended by a Toyota pick-up truck before spinning around and subsequently colliding with Micieli, who was pronounced dead shortly after being rushed to hospital. Although just one example, such incidents are actually more common than you would think.
So-called hose counting or pneumatic devices are particularly challenging when it comes to installation as they have to stretch from one side of the road to the other. This is a potentially dangerous process that raised the alarm for Swedish road authorities, which subsequently approached Denmark’s Geveko ITS to come up with an alternative solution. “That was about three years ago now,” reflects Bruno Hansen, general manager at Geveko ITS. “And what we have in our prototype after a lot of research and development is a multifaceted, multifunctional alternative to hoses, embedded inductive loops and even radar,” he reveals.
System setupThe LED-Guide – which measures around 12cm2 and is a mere 7mm thick – performs traffic counting at lane level. “These compact dimensions actually allow you to collect data in the winter,” Hansen continues. “With just a small groove, it can be mounted flush to the road so snow plows can run over the top without adversely affecting performance.”
And because it’s a lane-level installation, each lane on a road can be assessed independently. Housing the latest magnetic field sensors, vibration sensors and temperature sensors, the LED-Guide is not only able to
January 2013 Traffic Technology Internationalwww.TrafficTechnologyToday.com 011
Intelligence as standard
| Prototype Focus
In addition to traffic counting, Bruno Hansen reveals that Geveko’s
LED-Guide can unlock added-value features such as detecting what direction a vehicle is driving in: “If you are driving a vehicle the wrong way on a highway, for example, our system can provide a warning and detail the speed of the vehicle. Also, should you approach a sharp bend, a running light can indicate that you are driving too fast.”
Contemplating a more active approach where technology and operations are concerned, Hansen says it’s also possible to set up the infrastructure to communicate with the latest intelligent units from a remote location via the ‘gateway’ mounted along the line: “With
this in place, all the road studs may be brought
online and as a result can be monitored from anywhere in the world and – if required – the data forwarded to other systems.”
Requiring just 15 minutes to install, this prototype traffic counter integrated within an intelligent road stud offers great potential to improve road worker safety, writes Lloyd Fuller
Out for the count
Processing and portal
Gateway
Road surface units
detect vehicles but can also compute the vehicle length and number of axles, among other functionalities, potentially opening it up to applications such as weigh-in-motion, vehicle classification for tunnels, bridges, etc. “With two sensors in place, we can also calculate a point-to-point average speed, so you can assess traffic speeds on particular stretches of road,” Hansen continues.
Vitally, though, LED-Guide is installed at the side of the road, so workers don’t have to put themselves in danger during installation and removal. The system is composed of independent units that are connected with each other using wireless communication. For a two-lane road, there could be four road surface units performing the sensing task and low-level aggregation task. “The aggregated data is then transmitted through a nearby gateway into the processing unit located in the ‘cloud’,” Hansen explains. “When the processing of the aggregated and transmitted data is completed, that data is available in the portal and reports can be extracted.”
Currently being evaluated in trials near Trondheim, Norway – and with a trial set to start in Sweden, too – LED-Guide could be ready for deployment as soon as mid-2013.
(Left) The schematic shows the system level view of the traffic-counting system
this in place, all the road studs may be brought
online and as a result can be monitored from anywhere in the world and – if required – the data forwarded to other systems.”
each other using wireless communication.
the portal and reports can be extracted.”
iRoad is an ongoing Swedish project involving Luleå
University of Technology, Geveko, Eistec and
Vägverket, which aims to develop intelligent
road surfaces

004
Intersection Safety |
Traffic Technology International January 2013www.TrafficTechnologyToday.com
messagesSaul Wordsworth discovers that although the evidence for red light cameras appears overwhelming, the minority opposition continues to shout loudest
The positive data relating to red light cameras is sometimes disregarded
at state level. Certain regions remain undecided, swaying this way and that. New Jersey recently introduced new laws to ban them across the state.
“It’s clear that towns have little interest in actually making intersections safer,” Senator
Michael Doherty said of the situation. “They want violations to occur so that they can continue collecting fines to prop up government spending.”
David Kelly of the National Coalition of Safer Roads believes that while there will always be anomalies such as New Jersey, there remains a net gain in the use of cameras across the USA.
“Decisions are often made for political gain,” he insists. “When you get a change in power or a shake-up at board level, these things can happen. Such outcomes are subject to many variables and we don’t set much store by them. In the normal cycle of events, programs come and go. What we do know is that cameras work and people support them.”
Mixed

005January 2013 Traffic Technology Internationalwww.TrafficTechnologyToday.com
| Intersection Safety
Kansas City Police Department recently reported its red light program to be so successful that for two years following
its introduction in January 2009 there were no fatalities at the city’s 17 enforced traffic intersections. Meanwhile a 2011 study by the Insurance Institute for Highway Safety (IIHS) found that red light safety cameras reduce violations by up to 50% and fatalities by 24%. You would think that such statistics would be enough to convince naysayers that red light safety cameras are a force for good – but you would be wrong.
“People on the other side of the argument are often highly vocal,” accepts David Kelly, president and executive director of the National Coalition of Safer Roads (NCSR). “They put up websites, arrange petitions… They are highly motivated. The more reasoned side of the argument doesn’t have the same fervor because red light cameras make too much sense.”
In the USA notions of freedom and privacy are held dear. Owning a driver’s license may be an agreement to abide by certain rules, but in some eyes cameras remain a breach of civil liberty. Although evidence that cameras act as a deterrent is overwhelming, there remains a strong and outspoken anti-camera lobby, often backed by a media that is quick to raise suspicions about revenue generation. It can be a challenge for Kelly and others to defend themselves against those who choose to ignore what to them seems obvious.
Brian Ceccarelli is a software engineering consultant from North Carolina. In 2010 he received two tickets for running red lights. Since then he has fought his case by challenging on a scientific basis the yellow change interval formula.
“I am not against red light cameras, merely against the duration of the yellow light,” says Ceccarelli. “Based on the laws of physics, the
liberty. Although evidence that cameras
Private auto passenger liability
rose 12% to US$64.1 billion in 2010 from US$57.1
billion in 2005, say figures from the Insurance
Information Institute
Prior to the installation of red light cameras in Dallas five years ago, nearly a third of
the city’s accidents at traffic signals were attributed to red light running. In the first year of camera operation, intersection accidents were reduced by 56% and tickets for red light running fell by nearly half. Dallas now has 60 red light safety cameras operating at the city’s 1,300 traffic lights.
Based on the laws of physics,
the formula doesn’t give enough time to decelerate. It’s the reason the red light camera industry is in business
Better enforcement of traffic signals using cameras is a solution that can quickly be implemented on a large scale

007January 2013 Traffic Technology Internationalwww.TrafficTechnologyToday.com
| Intersection Safety
formula doesn’t give enough time to decelerate. It’s the reason the red light camera industry is in business. Fix the formula and there will be no red light camera industry because very few people will be running red lights. Even if the car arrives in time, it is still necessary for the driver to know exactly what the safe stopping distance is, which is a mathematically exact value.”
The case of Ceccarelli versus the town of Cary, North Carolina goes to court in January 2013. Backing him are several expert witnesses who will help defend his point of view.
Majority view“The notion that there is some sort of great conspiracy to shorten yellow light time is wrong,” says Kelly. “There are many factors that go into how you calibrate a yellow light timing interval. These are complex fact-based formulas. It is not an arbitrary number. The idea of simply extending the yellow light is something you get from people who don’t understand the process. Traffic engineers are professionals and you are demeaning the most objective person in traffic safety to suggest otherwise.”
The statistics weigh heavily in Kelly’s favor. A 2007 study in Philadelphia revealed that after yellow lights were adjusted to one second longer than the standard three to six seconds, red light running dropped by 36% – but it dropped a further 96% after cameras were installed
“The interval times at intersections are constantly recalibrated,” says Kelly. “Our opponents often demonize the wrong people simply because it fits their own political or personal objective.”
Supporting dataIn 2011 the study Evaluation of Photographic Traffic Signal Enforcement Systems in Texas was published. Researchers examined 11,122 crash records from 275 intersections in Texas where red light safety cameras were in use and compared crash frequencies both before and after cameras were installed. They found that side-on crashes decreased by 32% at intersections with cameras, and there was an overall fall of 25%.
“There are many reports that say red light cameras reduce crashes,” says Ceccarelli. “The problem is they never investigate why the crashes happened in the first place. There is no forensic analysis, simply a before and after. They blame the drivers for all the bad things even though there could be gross engineering mistakes. If a report claims that these cameras reduce crashes by 25%, what about the other 75%?”
Kelly’s riposte is to cite America’s litigious society, which is “always looking to blame others,” whereas in fact accidents happen “because of driver behavior” and red light safety cameras have been shown time and again to change such behavior and make motorists drive better.
“There is never one definitive study that proves once and for all the benefits of cameras, but the same could be said of all driver behavioral studies. The key is that all studies generally point to the effectiveness of red light safety cameras. The numbers vary, but if you were to complete a meta-analysis of all the surveys and research it would say red light safety cameras save lives.”
Who, when and why?Ninety-eight percent of Americans believe that running red lights is dangerous, yet 56% admit to doing it and 20% at the past 10 lights. Offenders cut across all demographics, though there are some interesting variables. According to results obtained by the Stop Red Light Running Partnership, parents with children younger than 20 years old are more likely (65.6%)
crashes happened in the first place. There is no forensic analysis, simply a before and after. They blame the drivers for all the
fact accidents happen “because of driver
FHWA
figures from the USA suggest that over a period of five years
ending in 2010, nearly 800 people a year on average died in red light running
accidents
According to a 2011 poll taken by the Insurance Institute for Highway
Safety (IIHS), more than 66% of drivers in 14 major cities were in favor of red light cameras at intersections. This follows a study across the same cities showing that cameras reduced fatal intersection incidents by nearly 25%. Of particular note was Houston, where the majority still voted in favor of cameras despite the city having shut them down in 2010. Of those polled, 25% said they opposed the use of red light safety cameras because they can make mistakes. Nineteen percent said they make the roads less safe. A similar poll taken in Connecticut in 2012 by the National Coalition for Safer Roads showed that 68% of those questioned were in favor of red light cameras at intersections.
Support for the red
(Top) An estimated 122,000 people were injured in red light running crashes in 2010. A 25% reduction would prevent 30,500 injuries and save insurers US$1.95 billion (Right) Opponents are extremely vocal, but studies show they are in the minority

Intersection Safety |
008 Traffic Technology International January 2013www.TrafficTechnologyToday.com
to run red lights than those with older children (40.8%). Individuals are also more liable to offend than those with passengers, particularly if the passengers are children. Motorists who don’t wear a seatbelt are also more regular red light runners.
Such statistics seems to contradict Ceccarelli’s viewpoint, as does a recent NCSR Safer Roads Report, which concludes that violations are at their peak on Fridays (33% higher) and their lowest on Sundays. Reasons proffered by professionals for red light running include schedule overload, self-importance, and the human instinct of trying to get away with something.
“People see the consequences of not running the red light as greater than running it,” says Ann Sweet, spokeswoman for the National Campaign to Stop Red Light Running. “They don’t see it in terms of blood and guts and twisted metal.”
Red light running is a fascinating subject but not one that can easily be examined, due to the lack of a controlled environment. However, one such opportunity arose in 2005 when a team of psychologists led by expert Professor Bryan Porter had a rare chance to study how drivers adjust their behavior in the presence – or otherwise – of red light cameras. Virginia had allowed camera enforcement to expire and researchers discovered that in the immediate aftermath the chances of someone running a red light were three times higher than they were when the cameras were in operation.
“Red-light safety cameras have proved to be an effective tool for law enforcement to combat red light running,” says James Tuton, president and CEO of American Traffic Solutions
(ATS), a company responsible for nearly half of the 7,000 cameras in operation across the USA. “The goal of any red light safety camera program is to change driver behavior. For programs that our company operates, more than 95% of drivers that receive a violation don’t receive a second, proving that penalization through technology alters driving habits.”
Last words“People run lights because they are too impatient to wait for the next light cycle,” says Kelly, wearily dismissing Ceccarelli’s proclamation that “99% of people run red lights because engineers make them.” He continues: “People must take responsibility. Most motorists do it close to their home, where they know the intersection and are familiar with the timing. They do it because they don’t think they are going to get caught – and when they get a letter three weeks later they become angry. There is always a need for more research, but even some of our opponents will acknowledge that these cameras save lives.”
Research body John Dunham and Associates recently completed
an extensive report focusing on the potential savings that may accrue from the presence of red light safety cameras on US roads. The analysis, which calculated money saved through fewer accidents and traffic delays, the reduced impact on local hospitals, less property damage and insurance, and the redeployment of traffic officers, was commissioned by American Traffic Solutions. Although numbers varied from city to city, every camera was shown to provide a positive economic benefit to the local community. One red light camera in Hazelwood, Missouri was projected to save US$163,000 in one year and US$729,000 over five years.
Wise investment
(Left) Studies have shown that the presence of cameras reduces red light running (Below) Independent audits of red light camera enforcement have shown that in some jurisdictions fines exceeded program costs, while in others, the programs didn’t break even
People see the consequences
of not running the red light as greater than running it … not blood and guts and twisted metal