oyerhrul(u) my tank-automotive 1/2 mi d …. author(a) 8. contract or grant number(e) douglas...
TRANSCRIPT

RD-R149 127 11M± NEW VERSUS OYERHRUL(U) MY TANK-AUTOMOTIVE 1/2COMMAND WARREN MI D J HACKENBRUCII NOV 84 TRCON-83-34
U.INCLSSIFIED F/O193 NL
momhmhhhmmhhhl

1
.1
'.
1 111a.~
L 136 I"I-
iII111.25, 1 .4 ___
MICROCOPY RESOLUTION TEST CHARTNATIONAL BUREAU OF STANDARDS 1963 A
% %.
... ' . .. . .
...: ...._. , ....... .... .... ........ .... . . . . . . . . . . . . .,.. . . . . ..... .. . ..i. ....., ..2 Z .. ... .. . .' .. .. ... .. ... .. . . . ...._. _._.:. ,..:_...._.._. :., .. .. 1 ... .. .. ". . ,.... ... . .......... ,. . ,,..

C REPORT NUMBER 83-34
M113 NEW VS. OVERHAUL
r
U.
I
NOVEMBER 1984
DOUGLAS J. HACKENBRUCH -
JAN010905-. titjn is U~l rnIte rC -
'or Public relea: r ond Sole;it
LiJ
TACOMSYSTEMS ANALYSIS DIVISION
-'*RYANKAUTMOTV. "COMMAND
84 12 3 1 094

. ...... .. . .... - ... .* . -.: .. : ....- /.
SECURITY CLASSIFICATION OF THIS PAGE fWhen Dte. Entered)
REPORT DOCUMENTATION PAGE BFR CMTING FORMI. REPORT NUMBER .oCiPIENTS CATALOG NUMBER83-344. TITL.E (end Subtitle) S. TYPE OF REPORT & PERIOD COVERED
"113 New vs. Overhaul Final .6. PERFORMING ORG. REPORT NUMBER
7. AUTHOR(a) 8. CONTRACT OR GRANT NUMBER(e)
Douglas Hackenbruch None
9. PERFORMING ORGANIZATION NAME AND ADDRESS 10. PROGRAM ELEMENT. PROjECT. TASK
U.S. Arm, Tank-Autmotive Command AREA & WORK UNIT NUMBERS
Systems and Cost Analysis Directorate (AMSTA-V)Warren, MI 48090
I I. CONTROLLING OFFICE NAME AND ADDRESS 12. REPORT DATE
November 198413. NUMBER OF PAGES
12814. MONITORING AGENCY NAME & ADDRESS(if different irom Controlling Ofice) 15. SECURITY CLASS. (of thi report)
Unclassified1S. DECLASSIFICATION/DOWNGRADING
SCHEDULE
16. DISTRIBUTION STATEMENT (of thie Report)
17. DISTRIBUTION STA-EMENT (.1 the abstract entered in Block 20, if different from Report)
IS. SUPPLEMENTARY NOTES
19. KEY WORDS (Continue on reverse side if necessary nd Identify by block number) S
reliability, statistical analysis, M113, armored personnel carrier, SDC, dataanalysis, Multi-vari Methodology, linear regression, analysis of variance
20. ABSTRACT I'CuiA an reverseee t if nwear ry md Identify by block nmber)
The sample data collection on Xl13 FOV for 5 bases for 4 quarters in 1982was analyzed to determine that depot processed vehicles are as reliable asnew vehicles. Data base biases of period miles, vehicle age, base effect,vehicle type and others here removed by Multi-vari Methodology. Cost driversand maintenance practices were evaluated.
DO JI 173 DinON OF NOV s IS O&SOLETI-
SECURITY CLASSIFICATION OF THII PA&E (When Data Batesed)

ACKNOWLEDGEMENTS
This study was a group effort within the System and Cost AnalysisDirectorate. Lee Dowd who completed the sister report M60 New vs. Overhaulworked hand-in-hand with this effort. Arnold Solomon and Sam Tam contributedsignificant guidance on the statistical analysis procedures used herein.Albert Van Horn is to be especially commended for his efforts at researching,modernizing, and applying this reports main statistical analysis procedure,the Multi-vari methodology, without which no valid conclusions could be drawn.
The bulk of the work, sorting, correcting, organizing and manipulatingthe 68,000 M113 SDC records was successfully accomplished by two very brightand diligent co-op students, Mary Dimercurio and Laura Lamparski. These Stwo spent countless hours at the computer terminals and in the process ofcompiled volumes of original and innovative software used to explore andmanipulate the data base. They were told when they were hired that theywere to do all the work and get none of the credit. Hopefully, this willcompensate for some of that.
pLastly, the report typist, Karen Smith, is to be given many thanks for
completing this report without the use of a text editor. %
I.
•.
i+I _ _...
• '-'-'.. .... '-' ... v " . ... .' " .". ." .' '-----" .- , ".':.,-.-. ', .-.. '''''-.'''-'-'..- _ __"-_."-_. -:--l' ,"' -::" " " "

TABLE OF CONTENTS
*Objectives. ............. ..................... 1
*Summary of Main Conclusions .. ............. ........... 3
Data Analysis Methodology ............. ............. 6
Test Site Results ............ .................. 7
M ,113 SDC Data Base Description. ............ ........... 13
*M113 Data Formatting. .......... ................... 25
*Dependent Incidents Analysis. ............ ............ 30
*Group Mean Miles Analysis ............. ............. 33
Two and Three Way ANOVA .......... ................. 35L
Multi-vani Univariate Methodology ............ ...... ..... 44
*Actual Vehicle Failure #analysis ............. .......... 72
First Failure Analysis. ........... ... ................ 74
*Depot Action Effect .. ............. ............... 75
Q-Service Effect. ............ ................... 79
Subsystem Reliability ........... .................. 88
*Cost Drivers. ........... ...................... 91
*Detailed Conclusions. ............ ................ 93
Recommendations ........... ..................... 96

*- -" - w'
NEW VS. OVERHAUL M113 FOV
OBJECTIVES
1. Determine the reliability performance differences of depot processedand non-depot processed (new) M113 FOV in a field environment.
2. Determine the effect of the depot process on the reliability of the M113FOV.
3. Identify a methodology that will provide field data to evaluate changesin depot practices.
4. Provide guidance to a subsequent analysis (termed Phase II New vs.Overhaul) that will investiage depot processes to further enhance object2 above.
%.

INTRODUCTION
DARCOM was tasked by DA, on 26 July 1983 to determine the opt ial pointof cost versus reliability performance for depot programs. The ME was theinitial targeted effort. DARCOM tasked AMSAA on 12 August to do i multiplestudy to include the M113 FOV. Systems and Cost Analysis partic pated inthese planning meetings and was tasked by AMSAA in February 1984 1 conductthis study on the M113 FOV.
The original objective of the DA tasking could not be addres,, d. Thatis, the optimal funding level to invest in the depot processing t( minimizelife cycle costs, could not be answered. Records on depot c anges toindividual vehicles processed through the depot and a field bacl loop ofreliability performance on these vehicles does not exist.
The question of how well the depot processed vehicles are doing i relationto new vehicles can be answered on a fleet basis. Cost drivers can alsobe identified. This report can then be used as an aid for a Phase IIinvestigation in which the depot effects can be addressed in answ r to theoriginal DA objective.
2. . . \~~~~~~ .. * * . . ' ' * . . * * . *. .. '.

SUMMARY ID MAJOR CONCLUSIONS
There are two data bases use for this study. Initial Rebui I Test (IRT)an( Initial Production Tests (I r) at either Aberdeen Proving -round (APG)or 'uma Proving Ground (YPG) is ne source of data. The other the SampleDat Collection on M113 Family 3f Vehicles (FOV) from 17 Nov ber 1981 to
30 ovember 1982.
The test site data analysis shows that depot processed vel cles are asre' able as non-depot processed vehicles.* It also shows tha the M113A2ha better reliability performanc than the MII3AI. This data is tatisticallylit ted in that these conclusions are not statistically significar
The SDC M113 data base anal 3is reflected the same conclus ,ns, however
th( conclusion of both depot and )n-depot vehicles having the sap reliabilitype. ormance is statistically si iificant. The A2 versions, hc aver do notpe7 orm that much better than the \I version to be statistically s pportable.
The M113 SDC data base pro ad to have several flaws. T- se are: (1)Th( data had 17.5% of the un :heduled maintenance incidents reported asin( pendent when the parts were, n fact, replaced in the process 3f repairing
th( independent part. (2) Th data base is totally unscore That is,th( e parts that failed due to iriver/operator error and/or a; ident couldnot be filtered out. (3) The ita contained a small percentag of mismatch(pi t number, NSN or nomenclatu .) that required correction. ( ) The dataco' ection and reporting proce tres showed indications of ir ansistenciesfr( the five different bases nvolved. (5) The data has r tong biases
thz are unbalanced or not in( pendent among vehicle type, 1 se location
or epot effect.
In spite of the above, it i felt that the conclusions dra herein areva d. Those that are not statis ically supporatable are caviatec 3s requiringve- fication in Phase II analysis
Since the M113 SDC data ba: was not balanced (i.e., less than exact)fr( biasing effects, an historic I data analysis technique (Multi ari method)wa! upgraded with current stati tical methodology and used to dentify andret ve these biasing effects. \n untreated data analysis sh !s that thedel t vehicles were performing regard to reliability signifi intly betterthi non-depot vehicles. Howe% r, the Multi-vari methodology successfully
re ,ved the biasing effects and r sulted in the above conclusion.
*A lepot vehicle is a vehicle t it has been processed by a dep . This can
be rebuilt, overhauled through , inspect and repair process. A non-depot
- vel cle is one that has some t les accumulated but has no bE n through ade: ,t process.
3

The Mll3 SDC data was analyzed to see if the year that the vehicle wasprocessed through the depot had a significant effect on vehicle field
. reliability. This is of special interest since the depot process went fromcomplete overhaul thru an Inspect and Repair process. Also of interest wouldbe the effect of various depots on field reliability and how many times thevehicle went through a depot process. These were not possible due to the -
.*'
-
lack of definition within the SDC data base.
The year of depot processing has no significant impact on reliabilityperformance. This is significant since the depot process changed from completeoverhaul through an I&R process with no degradation in reliability performance.
The effect of both frequency and thoroughness of the scheduled quarterlyservice was assessed. It has no significant impact for non-depot vehiclesbut as vehicles age after going through one or more depot processes, it becomesan important effect on vehicle reliability.
Subsystem reliability of depot and non-depot vehicles are statisticallythe same except for three systems, fuel, track, and springs/shocks. Asignificantly higher number of fuel and track failures were present for thedepot vehicles. No explanation of why is evident from the data. Depotreplaced springs/shocks are performing better than new.
Cost drivers were identified that were either high dollar items or highvolume items (high labor cost). The cost driver items were periscopes andtelescopes and power train components from engine thru track pads. A fewnuts and screws and washers were identified as cost drivers. This is dueto the fact that a disproportionate labor cost was associated with thereplacement of these parts. A listing by cost is enclosed in Appendix C.
Object 3 was deferred to Phase II because this phase with its plannedin-depth analysis of depot practices will have a better understanding ofmeasuring impact of depot process changes on field reliability.
Several measures of vehicle reliability performance were used: A MMBI(Mean Mile Between Failure Incident) with and without dependent incidentsand a MMIBFF (Mean Miles Between Actual Vehicle Failures). This latter measureremoved the random start and random finish nature of the M113 SDC data.
An attempt on a first failure analysis was performed. This analysiswould be of interest in evaluating depot processed components against newcomponents. As the vehicles fail and get repaired in the field, they tendto become homogeneous, that is lose their depot/non-depot identity. Thisanalysis was not possible.
Thirty-nine detailed conclusions are present in the detailed conclusionsection. These are followed by recommendations to improve the validity andutility of the data collection process.
~74. ,

The SDC unscheduled maintenance data was grouped into Federal GroupClassification (FGC) and data analyzed to see if there were any significantdifferences in major component reliability performance.
an attempt was made to address the question of maintenance ratio between. depot and non-depot vehicles. It was concluded that the manhour charges* against particular parts were not consistent with base to base or part to
same part to draw valid conclusions. In fact, the way of recording manhourcharges to each and every part replaced including fasteners was questionedas to its validity.
Detailed description of the above areas of investigation are containedwithin the appropriate section within this report with supporting datacontained in the appendicies.
5
b °

DATA ANALYSIS METHODOLOGY
The data for this analysis comes from two sources. The APG/YUMA testresults on Initial Rebuild Test (IRT) or Initial Production Tests (OPT) fornew vehicles and from Sample Data Collection (SDC) for four quarters on afleet of 408 vehicles at five bases. Each data source was analyzed separatelybecause of their incompatibility.
The main analysis in this report was done using the M113 SDC data basewhich contained over 68,000 records. The M113 SDC reporting procedure mixed
* independent (actual failed parts) failures and dependent (parts replacedto get at the independent failed part) failure. An elaborate analysis isolatedand identified these parts. In addition, an analysis was performed to seeif the failure incident reporting procedures were consistent at each base.
* Indications are that they were not.
Data required to support the analysis was extracted from the M113 SDCrecords, blocked into various formats reflecting vehicle depot effect, base
*location and vehicle type. A two and three way Analysis of Variance (ANOVA)was attempted to determine these effects. However, vehicle age and how manymiles the vehicles were driven during the SDC reporting period (termed periodmiles) and possibly other effects displayed strong biasing 'effects in theunmodified data. No valid conclusions could be drawn from this analysis.
A Multi-vani technique (an older statistical technique useful forunstructured data analysis) was resurrected and up-dated using modernstatistical package techniques to perform the required analysis on the M113
*SDC data. Biasing effects from unbalancing and dependent results weresystematically measured and removed.
6
. . .7

Test Site Results
The test on new or depot vehicles that were run at APG or YPG from 1963to 1980 are shown in Table 1. This table does not include all M113 FOV testing
completed at these sites. It includes only the new production vehicles and/orvehicles that were processed at Red River Army Depot (RRAD). The history
of each RRAD vehicle is unknown as well as what exactly was done to the vehicle
to process it through the depot. Thus no measure of depot effect is possible.
Table 1 shows two RAM performance measures, a measured mean miles betweenfailure for mission failures and a mean miles between unscheduled maintenance
actions. An unscheduled maintenance action is any incident that requirescorrective action. It does not necessarily cause vehicle downtime frominability to commence operation, by degradation of performance or safetyrelated incident. This measure is approximately equivalent to the MMBI measure
used in the SDC data analysis in this report.
Graphs of these two performance measures shown in Figures TSI-4 indicateinteresting trends. The depot vehicles have maintained an increasing MMBF
mission over time (Figure TSI) with one exception, the 1980 test of one M113A2,as well as an increasing MMBUMA (Figure TS2). It should be noted that becauseof the low numbers of mission failures in each MMBF data point, a statisticalconfidence band for each mean shown would be large. Thus the true mean ofthe MMBF measure could be quite different than the sample MMBF shown in the
graph. For this reason, the MMBUMA would be a more significant RAM performancemeasure. It has substantially more actions charged against the system although
its measure of variability is still large.
The MMBUMA RAM performance measure on new M113 vehicles (Figure TS3) showsthat the vehicles have been performing fairly constantly over time withinthe variability limits on the means. The possible exception is the one M113A2test in 1980 which shows an improvement.
The MMBUMA for the depot vehicles (Figure TS2) shows an increasing meanover time up to the same approximate level shown in Figure TS4 for the newvehicles. The one M113A2 depot vehicle shows the same MMBUMA level of RAMperformance as the new M113A2.
These graphs tend to show that in the 1979-1980 era, the depot vehiclesperform as well as the new vehicles in Initial Production Tests (IPT) orRebuild Verification Tests (RVT) or their equivalent at YPG or APG. It shouldbe noted that this trend observation cannot be substantiated by statistical
significance testing due to a large variability in the data and/or a low
number of observations.
7

TEST TEST TEST QTY TEST MMBF MMBUMA MTTR MPHVEH ERA MILES VEH TYPE MISSION HRS AVG
M113A1 63-70 4000 5 ALL 1007 142 - -M113AI 75-76 3300 1 IRT 1101 66 1.79 28.6M113AI 76 2190 4 OT 1688 151 .76 -
M1I3A1 77-78 6291 4 IPT 1678 123 1.17 22.6M113A1 77 6576 4 PIT 1461 116 .93 -M113AI 78 5022 2 IRT 1674 79 1.00 21.9M113A1 78 5928 2 PIT 2371 104 - 20.6M113AI 78-79 2068 2 ICT 4137 109 .96 18.8M113A1 79-80 2088 1 RVT 2088+ 131 .99 17.9M113A2 80 3883 1 IRT 1942 100 - -
M113A2 80 5888 1 TFT 5888 235 - -
M113A2 80 2011 1 RVT 1006 223 .67 19.9M548 79 2061 1 ICT 1031 74 .50 16.2M548 79-80 6233 2 PIT 1385 129 - -
M548 80 6199 1 PIT 775 83 - -
M577A2 79 4587 2 TFT 2293 92 1.23 16.5
LISTING DOES NOT INCLUDE MII3AIEI AND OTHER VEHICLES THAT WERE NOT NEW ORDEPOT.
IRT = Initial Rebuild RRADOT = Operational TestIPT = Initial Production TestPIT = Production Improvement TestRVT = Rebuild Verification Test RRADTFT = Tech Feasibility TestMMBF = Mean Time Between FailureMNBUMA = Mean Time Between Maintenance Action.
Summary of new or depot M113 FOV tests at APG or YUMA from 1963 to 1980.
TABLE 1
8
-1

ao 2i
U-~ pe -
FE2
a ab

ul
00
t~ e

31E
C4A
SCS
Q AC(n tti
AisA
in .o V.. . . .
a 0 0 a a

42 -
232> ~I
C0 2
C1
(%go
Re4
_ ~on2

M113 SDC DATA BASE DESCRIPTION
The M113 SDC DAta Base consists of 68,127 records as shown in the followingtabulation. Each record contains space for 450 alpha numeric digits fora total of 30,657,150 digits, each one-hand entered. Fortunately, most ofthem are zero or blank. The 68,127 records are broken out as follows:
Code Type of Record Count
Al Historic Reports 2188A2 0BI Unscheduled and Scheduled 17280B2 Independent Maintenance 17280B3 Incidents 17280Cl Supplementary Dependent 12061C2 Maintenance Incidents 0D Quarterly Reports 2038El Narrative Reports 0E2 0F 0Total 68,127
The M113 sample data collection started and ended at five locations inaccordance with the following tabulations:
Start Date Base Description End Date
17 Nov 81 Support Co of the 1/2 Inf Bn, A and B Co of1/28 Inf Bn, 1 Inf Div (Mech) at Ft. Riley, KS 30 Nov 82
20 Nov 81 2/19 Inf Bn, 24 Inf Div (Mech) at Ft. Stewart, GA 30 Nov 823 Dec 81 1/7 Inf Bn, 31D, VII CORPS, Aschaffenburg USAREUR 30 Nov 825 Dec 81 2/13 Inf Bn, 81D, V COPRS Mannhein USAREUR 30 Nov 825 Jan 81 2/7 Cay, 1st Cav Div, Ft. Hood, TX 30 Nov 82
Nine types of M113 family of vehicles (FOV) were reported in accordancewith the following tabulation:
NSN MODEL NOMENCLATURE
2350-00-968-6321 MII3AI Carrier, Personnel, Full tracked, Armor2350-00-068-4077 M113A2 Carrier, Personnel, Full tracked, Armor2350-00-056-6808 M577AI Carrier, Command Post, Light, Tracked2350-01-068-4089 M577A2 Carrier, Command Post, Light, Tracked2350-00-076-9002 MlO6Al Carrier, Mortor 107mm, Self-propelled2350-00-069-6931 M106A2 Carrier, Mortor 107mm, Self-propelled2350-00-071-0732 M125A1 Carrier, Mortor 81mm, Self-propelled2350-01-068-4087 M125A2 Carrier, Mortor 81mm, Self-propelled2350-01-045-1123 M901 Combat Vehicle, Anti-tank, improved
13
.. .. . . .. .. . .

.- .- . -- - .-.- r .-. . . .. -
A total of 408 (164 non-depot and 244 depot) vehicles were under theM113 SDC plan in accordance with the following base distribution:
Vehicle Ft. Ft. As- Mann- Ft.Type Riley Stewart chaff heim Hood Totals
MI13Al Depot 28 17 16 17 43 121Non depot 7 6 8 4 12 37
M113A2 Depot 1 5 25 36 2 69Non depot 0 31 14 0 0 45
M577AI Depot 0 1 0 0 2 3Non depot 1 0 0 0 4 5
M577A2 Depot 0 0 0 7 0 7Non depot 0 5 8 0 0 13
M106A1 Depot 0 0 4 2 0 6Non depot 3 1 0 1 0 5
M106A2 Depot 2 4 0 2 4 12Non depot 0 0 0 0 0 0
M125A1 Depot 0 2 6 8 9 25Non depot 5 7 3 1 0 16
M125A2 Depot 0 0 1 0 0 1Non depot 0 0 0 0 0 0
M901 Non depot 0 0 21 22 0 43
Totals Depot 31 29 50 72 60 244
Non depot 16 50 54 28 16 164
The 17,280 B records and 12,061 C records are broken out as follows:
B Records C Records
Q-Service 1,241O-S 4,576Lub 1,070 6,446Remainder 10,393 5,515
17,280 12,061
The Q-service records are quarterly service that is scheduled to beperformed on a 3-month basis. They are not always performed or not alwaysreported.
The O-S records are inspection procedures on the engine, transmissionand final drive that are scheduled to be performed on a monthly basis. Theyare not always performed or not always reported.
The lub files contain all records on replacement lubricating oils (alltypes), greases (all types), filters (all types), and antifreeze (scheduledand unscheduled).
14
.........."....."........'...........-.....-.......""...............'...'...........'..,.''.', "'.,'',. ,''. . "" .''. ,-" ',,'."%•',

.. The remainder contains records of parts receiving some maintenance actioneither unscheduled or scheduled, independent or dependent, and replaced orserviced.
The historical distribution of odometer miles on the 408 vehicles atentry into the M113 SDC program are shown in Figures DB 1 thru DB 9. Withinthese graphs, "New" should read "non-depot" and "Rebuild" should read "depotvehicles". The observation can be made from these graphs that the MlI3Alis the only vehicle with a reasonable distribution of starting miles fordepot and non-depot vehicles. Another observation is that from a statisticalpoint of reference, these vehicles all have a random starting point (anda random finish) as opposed to the more desirable uniform starting miles.Unlike most SDC data bases, there are no vehicles that have a lifetime datarecord.
..............................
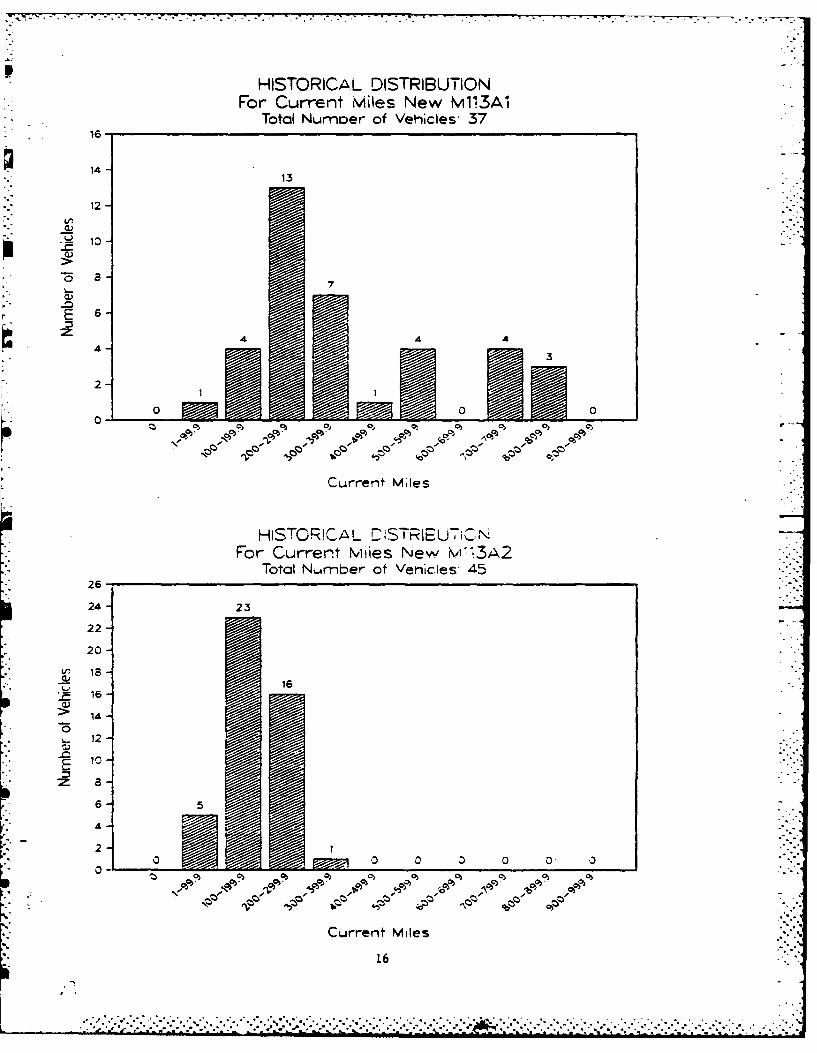
HISTORICAL DISTRIBUTIONFor Current Miles New M113A1
Total Nurnoer of Vehicles 37
143
12
6-
44 4 3
1 10 .
0 0 0
Current Mes
HISTOGRCAL D!STRIE__UTIN-For Current Mlies New iN,,V3A2
Total Number of Venicles 45* 26-
24 23
22-
20-
1616
1A -
* ~ 12 --~o
4-
0 0 0 0 0 0 0
• ,.,
Current Miles
16
.............................................................* *** *

IHISTORICAL DISTRIBUTIONFor Current Miles Rebuild M113A1
Total Number of Vehicles- 12139-
36 34
33
30
27 26
-2424
e f 5- 14 3
E 13
E12 10 - n,
0 -,0
Current Miles
HISTORICAL DISTRIBUTION-For Current Miles Rebuild M113A2
Total Number of Vehicles- 6948-
44-4 :
41
40 -36-
32-' . 28" 28 -
S24-
20"
E-
1 12 "
0 0 00 0 0 0 0 0 0
- o o o o o o1 o o G-.
• ".Current Miles
17• "- .k .. * ';.** * ** -i-* % . -. *-
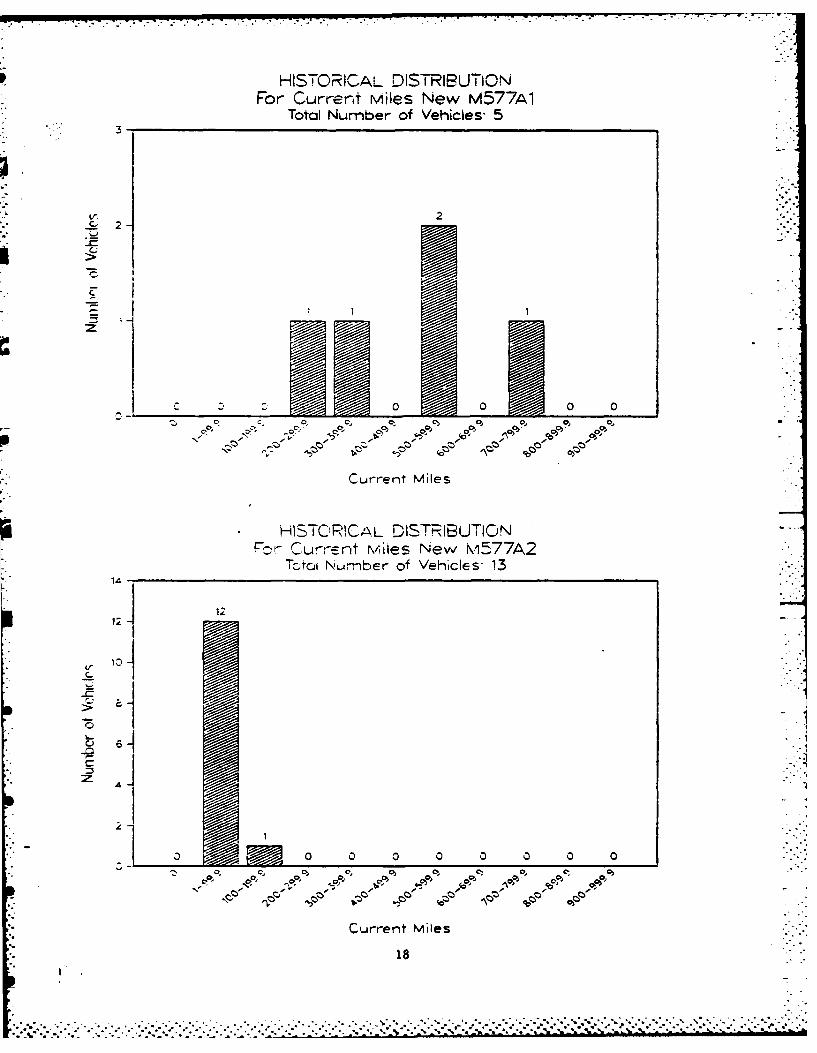
PHIST ORICAL DISTRIBUTIONFor Current mies New M577A1
Total Number of Vehicles- 5
32
0 0 0 0
-00 C* 10 010 i-> C 5jj 0
CurentMiles
HISTORICAL DIRTRIBUTIONF-br 'u'rr.ert rviies New rv57742
Totai Nornber of Vehicles- 13
* 3
1I 0 0 0 0 00 00
Current Miles
18
A............4

HiSTORKOAL DISTRIBUTION%,Fo r Currert r,'Iles Rebuild M577A1I
Total Number of Vehicles: 3
4p INF
HjZC-(4 -C7 J~ -O
4 -
C0 0 0 C 0 0 0
Current Miles
HdSTRICL WL~lJ19

* HISTOIRICAL DISTRISU TIONFor Ourrent miles New M1064'1
Total Number of Vehicles: 5
0 00 0 ~0 0 0
Current Miles
HISTORICAL 'DISTRiBUTIONFor Current N\lss New M106A2
Tol Number of Vehicles: 0
ZI
0 0 0 0 0
C-C 1 C C C 5 C
P,)0
0 P20

HIST ORICAL DISTRIBUTIONFor Current Miles Rebuild M1O6A1
Totai Number of Vehicles: 6
- 01 I Si
For Current M\iles Rebuild M106A2Totai Number of Vehicles- 12
.- 1i-12
1
C* 05 01 -6 0 C)
Curren~t Mies
21

HISTOERICAL DISTRIBUTiONFor Current Miles New M125A1
Total Number of Vehicles: 16
71 7
-I
_ 2
C0 ,0 0 ~ 0o ' 0~oc
ct CI C: oC-0oc
Current Miles
HSTC~I.AL ISThBUTiON
-Z', " ur-reft MjIes New M125A2Total Number of Vehicles 0
o0 0 0 C0C 0 0 0 00 C 0 0 0 0 0 0 0 0
01 017 0 0
Corrent Miles
22
j I.
" .1 .° -°."..". :' ;'_',.'" ""......................................................"..."...."...."""'""""*"'" """ .-..v..-....-.,".

HISTORICAL DISTRIeUTIONFor Current Miles Rebuild M125A1
Total Number of Vehicles' 257-6
6
--
" -2
0 0
Current Miles
HISTORICAL DISTRIBUTIONFbr Current Miles Rebuild M125A2
Total Number of Vehicles: 12--
:'"i
0
: " 1 0 --
,., , 05 C
Current Miles
23o/--
.......*:- ... . .

* HISTORICAL -DISTRIBUTIONFor Current MWes Rebuild M901
1-. Total Nu.mber of Vehicles: 0
C 0 0 0 0 0 0 0 0 0 0
Current Miles
HlsTO13 'CAL DISTRIBUTIONFor Curren-t Miles New M901
Total Number of Vehicles- 43* 26-
24-22
22-
* 20-
C14
10-
-. -1 -
22
-. . . '**4.*~***.*-***0.*%*.**. 0 . 0- 0. *. 3 0.* -* .* .* *' * - ..* ** * .. * .
V ... .
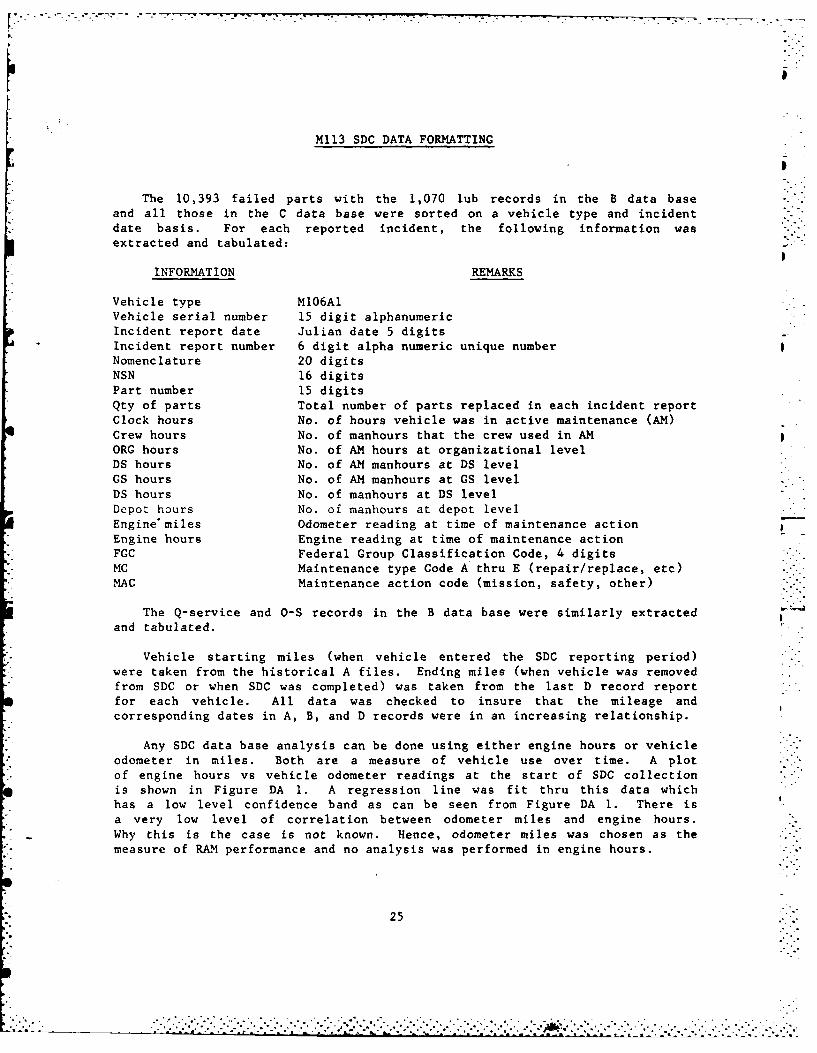
Mll3 SDC DATA FORMATTING
The 10,393 failed parts with the 1,070 lub records in the B data baseand all those in the C data base were sorted on a vehicle type and incident
date basis. For each reported incident, the following information wasextracted and tabulated:
INFORMATION REMARKS
Vehicle type MI06AIVehicle serial number 15 digit alphanumericIncident report date Julian date 5 digitsIncident report number 6 digit alpha numeric unique numberNomenclature 20 digitsNSN 16 digitsPart number 15 digits
Qty of parts Total number of parts replaced in each incident reportClock hours No. of hours vehicle was in active maintenance (AM)Crew hours No. of manhours that the crew used in AMORG hours No. of AM hours at organizational levelDS hours No. of AM manhours at DS levelCS hours No. of AM manhours at GS levelDS hours No. of manhours at DS levelDepot hours No. of manhours at depot levelEngine'miles Odometer reading at time of maintenance actionEngine hours Engine reading at time of maintenance actionFGC Federal Group Classification Code, 4 digitsMC Maintenance type Code A thru E (repair/replace, etc)MAC Maintenance action code (mission, safety, other)
The Q-service and O-S records in the B data base were similarly extractedand tabulated.
Vehicle starting miles (when vehicle entered the SDC reporting period)were taken from the historical A files. Ending miles (when vehicle was removedfrom SDC or when SDC was completed) was taken from the last D record reportfor each vehicle. All data was checked to insure that the mileage andcorresponding dates in A, B, and D records were in an increasing relationship.
Any SDC data base analysis can be done using either engine hours or vehicleodometer in miles. Both are a measure of vehicle use over time. A plot
of engine hours vs vehicle odometer readings at the start of SDC collectionis shown in Figure DA 1. A regression line was fit thru this data whichhas a low level confidence band as can be seen from Figure DA 1. There isa very low level of correlation between odometer miles and engine hours.Why this is the case is not known. Hence, odometer miles was chosen as themeasure of RAM performance and no analysis was performed in engine hours.
25
~. . .. *
• . - / . " .° "% '. " . i. " " °° ; '2 ' .i . o °:.i...°°° -' ,. .% ° % . . . .° % '' o°, .,o • .° % -'• '

The FGC grouping was used to categorize each failed incident into vehicle* sub-groups.
The MC code was used to determine whether the part was replaced or repaired.-* on the spot.
The MAC code was intended to be used to score the failure incidents.However, a sample check of those parts showed that the same part replaced
*was not consistently scored a mission failure or a safety failure. It seems* reasonable that if a particular part was judged to cause a vehicle mission
failure once, it should be consistently judged the same. This was not thecase, hence the M113 SDC data was used as is, that is unscored to removethose parts that failed due to driver/mechanic error/vehicle accident, etc.
The B record (unscheduled) data was observed to be composed of 20%. single*incident reports with unique vehicle and incident report date. The other* 80% had two or more (up to 80) incidents in a grouping with the same vehicle
odometer mileage and report date. This suggested that the vehicle failureswere being discovered and repaired in bunches, or repair was postponed (ifpossible) until a more convenient time which could be a time for scheduled
*maintenance. The other possibility is that the reported failure incidentswere related, that is not independent.
The SDC reporting format specifies that the independent failed part shouldbe reported in the B records and any parts replaced during that maintenanceaction that were destroyed/lost, or replaced due to good maintenance action-(dependent parts) should be reported in the supplemental C records. . An
* investigation disclosed that there were independent incidents in the C records* and dependent incidents in the B records. A procedure was develped to identify.*those incidents that were judged dependent in the B records. No procedure* was developed to identify independent records in the C records (See Dependent
Incidents Investigation within this report). Approximately 17.5% of the-unscheduled B record incidents are dependent. Less than 57% of the C recordsare independent.
Failure incident data was then collected and tabulated for each vehicle*in the following format.
ITEM REMARKS
* Vehicle type* Vehicle SN
*Date in Date first entered into M113 SDC planStart miles Odometer reading at start dateFirst failure Date and mileage at first time vehicle stopped for repair2nd failure Date and mileage at 2nd time vehicle stopped for repair
Date and mileage at 10000 time vehicle stopped for repairnth failure Date and mileage at nth time vehicle stopped for repairTotal incidents Total number of failure incidents charged against vehicleTotal indep incid Total incidents less dependent incidentsTotal failures Total number of times vehicle stopped for repair
*End miles Odometer reading at end dateEnd date Last date under M113 SDC planBase location Where the vehicle was used while under M113 SDC.
26

This date formatting for each vehicle allowed four measures of reliabilityperformance to be developed for each vehicle. They are!
RELIABILITY MEASURE DESCRIPTION
" 1IHBI Mean miles between incidents total incidents(End miles - Start miles)/Total incidents
MMBII Mean miles between independent incidents(End miles - Start miles)/Total independent incidents
MMBF Mean miles between failures(End miles - Start miles)/Total vehicle failures
MMBFF Mean miles between failure within failure mileage(Last failure mileage - First failure mileage)(Total vehicle failures -1)
27
............. . .... ..
.............................. ***~. ~~.. .... ... ... ...
. . .. . . . . . . . . . . . .. . . . . . . . . . . .. . . . . .. . .

"his page intentionally left blank

LU-J LU *
CA (n-
~LU .- I
LUJ LU
cr-
- =-
LUJ
LUC
-
-LA-
LUJ
LUJ
A ~ LU
LU-
LA-:
r',-7 C.CC
01 X SdJI1OH ABU9N3 1JIH3A
p-

DEPENDENT INCIDENTS
The structure of the sample data collection (SDC) plan allows for reportingof all maintenance incidents whose object is to return to or keep the vehicleat 100% operational mode. These incidents are any maintenance actions suchas replacing/replenishing oils, greases and other fluids as well as adjusting,repairing, replacing or otherwise working on vehicle parts. These maintenanceincidents are divided into scheduled maintenance actions and unscheduledmaintenance actions.
A subgroup of the unscheduled maintenance actions are replacing failedparts or removing, repairing/adjusting and replacing out-of-spec parts. Bothof these are herein referred to as a failed part. In the process of removingand replacing these primary failed parts, other non-failed parts have tobe removed to gain access to the failed parts. These secondary parts aresometimes damaged requiring replacement and/or replaced as good maintenanceprocedures. Matched set of V-belts, fluids, gaskets, lock washers, clampsand tie downs are examples of these secondary parts.
The SDC allows for reporting of both types of failed parts. The B recordsformat is for reporting the primary or independent failed part and the Creport format is for reporting all scheduled oil/grease/fluids and allsecondary or dependent parts replaced to replace the independent failed part.
The MI13 SDC data base shows that there are groupings of incident reportsin the B records that have the same vehicle SN and report date. This byitself is to be expected. The grouping counts are shown in the followingtabulation. The 12,704 records exclude 0-S records.
Grouping Length Quantity of each Total No. of records
1 2165 21652 757 15143 371 11134 217 8685 138 6906 107 6547 71 4978 53 4249 42 378
10 32 32011 32 35212 24 28813 23 29914 13 18215 17 25516 15 24017 16 27218 14 252
30
." ,
°..
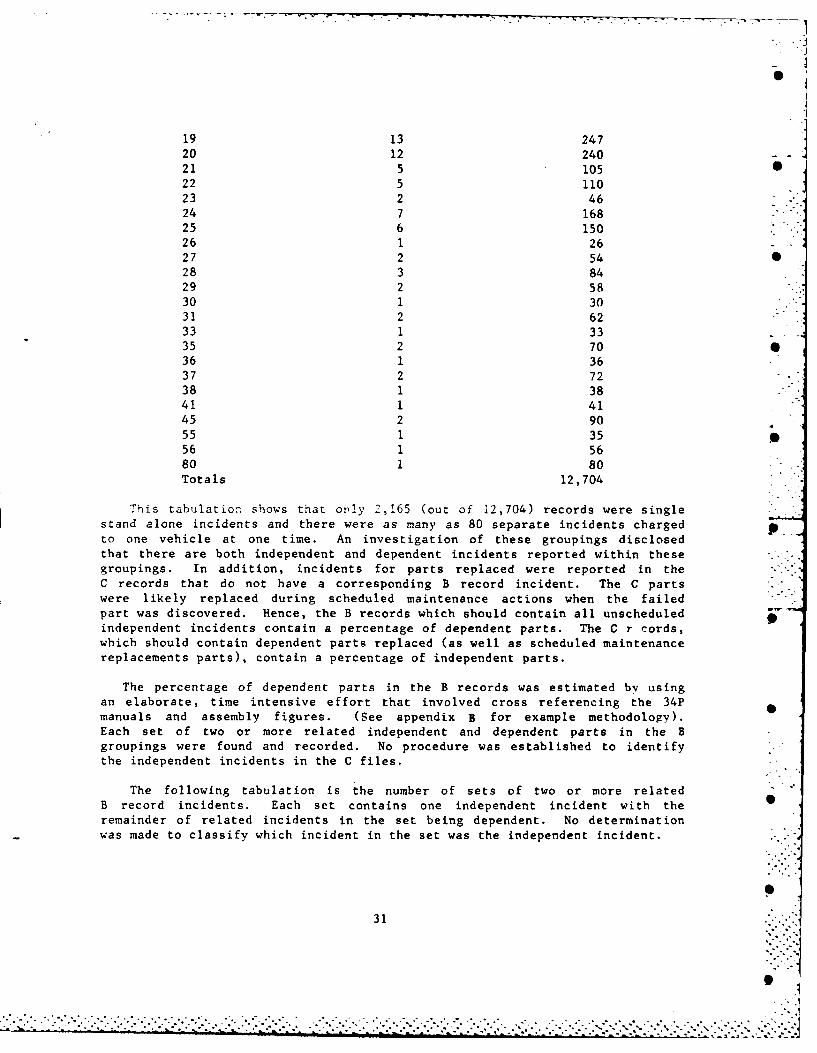
19 13 24720 12 24021 5 10522 5 11023 2 4624 7 16825 6 15026 1 2627 2 54028 3 8429 2 5830 1 3031 2 6233 1 3335 2 70036 1 3637 2 7238 1 3841 1 4145 2 9055 1 3556 1 5680 1 80Totals 12,704
This tabulation shows that only 2,165 (out of 12,704) records were singlestand alone incidents and there were as many as 80 separate incidents chargedto one vehicle at one time. An investigation of these groupings disclosedthat there are both independent and dependent incidents reported within thesegroupings. In addition, incidents for parts replaced were reported in theC records that do not have a corresponding B record incident. The C partswere likely replaced during scheduled maintenance actions when the failedpart was discovered. Hence, the B records which should contain all unscheduledindependent incidents contain a percentage of dependent parts. The C r cords,which should contain dependent parts replaced (as well as scheduled maintenancereplacements parts), contain a percentage of independent parts.
The percentage of dependent parts in the B records was estimated by usingan elaborate, time intensive effort that involved cross referencing the 34Pmanuals and assembly figures. (See appendix B for example methodology).Each set of two or more related independent and dependent parts in the Bgroupings were found and recorded. No procedure was established to identifythe independent incidents in the C files.
The following tabulation is the number of sets of two or more relatedB record incidents. Each set contains one independent incident with theremainder of related incidents in the set being dependent. No determinationwas made to classify which incident in the set was the independent incident.
31

Set Number of Number of Number ofSize Sets Independent Incd. Dependent Incd
2 739 739 739
3 160 160 320
4 72 72 216
5 37 37 1486 22 22 1107 14 14 84
8 7 7 49
9 2 2 1610 2 2 1811 1 1 10
12 1 1 1113 1 1 1215 2 2 2816 2 2 3028 1 1 27
1818
a There are 10,393 unscheduled incidents in the B records (not including
those incidents involving fluids and lub replacements). Hence, approximately
17.5% of the unscheduled B records incidents are dependent. Less than 5%of the C records were estimated to be independent incidents. This leadsto a new reliability measure in addition to mean miles between incident (MMBI).That is, mean miles between independent incidents (MMBII).
32
. ......... ........... .. ... ............. ... -

" -. r " . ---." -.'-- "- "-. • .- . " - . . - - -- V
GROUP MEAN MILES ANALYSIS
The data formatting allowed the mileage readings to be grouped into threedivisions. They are:
Group Remarks
1 Start mileage to first incident failure miles2 First failure miles to last incident failure3 Last incident failure miles to end miles
This data grouping allowed statistical test of significance of the threegroups to see if they were drawn from the same population. This analysisresulted in the following data on mileage means.
Vehicle Groups Group I Group 2 Group 3
Entire Fleet 114 82 50Non depot 105 75 41Depot 119 87 56
Stewart-WAQ 65 113 52Non depot 81 114 39Depot 39 113 74
Riley-WAH 3 85 52Non depot 1 117 32Depot 3 74 62
Hood-WAG 59 89 4Non depot 39 86 0
i Depot 65 90 5- Aschaf-WADI 209 62 100
Non depot 220 62 64Depot 191 113 32
Mannheim-WAP 146 84 30Non depot 31 50 26Depot 191 114 32
Group 1 "entire fleet mean miles" appears much higher than group 2 meanmiles. Group 2 "entire fleet mean miles" appear much higher than group 3mean miles. There also appears to be some extreme mean variations withineach group (especially group 1 and group 3). Group 1 means range from 1to 220 and group 3 means range from 0 to 139.
Statistical significance tests show that due to the large variation fromvehicle to vehicle, the differences in the entire fleet and depot/non-depotfleet are not significant. However, the subdivisions of the vehicle intobase location have some means that are significantly different.
S.
33
6 ..
. . . . . . . . . . . . . . . . . . . . . . . . . . . . . .. . . . .

This suggests that there are significant variations in the way the datawas recorded on the M1l3 SDC base at the five locations. It suggests, for
example, that at Fort Hood the data collection was started immediately withpossibly some repairs postponed until vehicle entered SDC. At Aschaffenburg,failure data was possibly not collected for some time into the SDC reportingperiod and for some time prior to ending the SDC. This possibility existsfor other bases as well. It is not known if failure data was just omittedor reported on a different date.
Due to the fact that the entire fleet and the depot/non-depot fleetsmean miles are not significantly different, the MMBI and MMBII measures havevalidity and any biasing effects from data reporting procedure can beattributed to a possible base effect.
34
ii-i
.%.S '
S%""'
S!
.. . . . . .. .. . . -3 4

I
2-WAY AND 3-WAY ANALYSIS OF VARIANCE
There are several effects on the M113 SDC data that would be of interestin knowing. These are vehicle type, base effect and vehicle age effect aswell as the prime interest effect of depot vs non-depot. A cursory lookat the data shows that the vehicle age effect may be cjnsidered as balancedfrom a statistical design of experiment point of view. That is there aremost vehicles ages represented across vehicle types and base locations.
The number of vehicles can be seen in a blocking of the other three effects
as follows:
NewDepot Locations M1O6Al M1O6A2 M113Al M113A2 M125AIM125A2M577AIM577A2 M901
Mann 1 4 1 22Asch 8 14 3 1 8 21
Non-depot Hood 12 4Riley 3 7 5 1
Stew 1 6 31 7 5Mann 2 2 17 36 8 7Asch 4 16 25 6
Depot Hood 4 43 2 9 2Riley 2 28 1
Stew 4 17 5 2 1
Due to the large number of block voids, it is not possible to run acomplete 3-way ANOVA on the M113 SDC data. Data can be consolidated intoa 2-way ANOVA and a 3-wav ANOVA as follows:
2-WAY ANOVA
DEPOT MlO6Al MII3AI M113A2 M125A1 M577A1 M125A2 TOTALS
Non-depot 5 37 45 16 5 13 121Depot 6 121 69 25 3 7 231Totals 11 158 114 41 8 20 352
35
.. .
. . . . . . . . . . . . . . . . . . . . . . . .. . . . . . . . . .

Vq
3-WAY ANOVA
LOCATION M113A1 OTHER VEHICLES TOTALS
Mann-WAP 4 24 28Asch-WAM 8 47 55
Non-depot Hood-WAG 12 4 16Riley-WAH 7 9 16Stew-WAQ 6 44 50Mann-WAP 17 55 72Asch-WAM 16 34 50
Depot Hood-WAG 43 18 61Riley-WAH-N 28 3 31Stew-WAQ 17 12 29
158 250 408
The 2-way ANOVA can be used to measure vehicle type effect and depoteffect. The 3-way ANOVA can be used to assess base location effect and can
be used to see if the MII3AI is different than the rest of the vehicles.
The 2-way ANOVA was run using all four reliability performance measuresMMBI, MMBII, MIBF, and MIBFF. All four proved to have no significant vehicleeffect and will not be discussed further.
The 3-way ANOVA did show some significant effects. The ANOVA resultsfor the INBI 'measure are tabulated as follows:
Source of Sum of Deg of Mean F F 0.5 F Signif-Variation Squares Freedom Square Ratio Code Valve icance
A. Base 4068 4 1017 20.1 (4,4) 6.39 YesB. Vehicle type 88 1 88 1.74 (1,4) 7.71 No
A x B 737 4 184 3.64 (4,4) 6.39 NoC. Depot 592 1 592 11.72 (1,4) 7.71 Yes
A x C 1862 4 465 9.21 (4,4) 6.39 YesB x C 1 1 1 0 (1,4) 7.71 No
Residual 202 4 50 0 -
Totals 7552 19 397
This concludes that there is a significant difference in the means for
the base effect, no significant difference between the MII3AI and the remainder
of the vehicles and a significant depot effect. The lack of significancein the vehicle type effect is in agreement with the 2-way ANOVA results.
36
.................... ...................................................................................

The MMBII reliability measure results echoed the MMBI results as shouldbe expected since they are only a small percentage difference. There wasno significant difference shown for either of the MMBF and MMBFF measures.This result was not expected because the MMBFF measure was felt to reflectthe true failure rate of the M113 family of vehicles. This MMBFF measureexcludes the mileage contributing to the random start/random finish natureof the M113 SDC data (it eliminates group 1 and group 3 miles). It alsoonly reflects a true measure of when the vehicle was rendered inoperable,that is, how long could the driver expect the vehicle to operate once started.This 3-way ANOVA concludes that all vehicles can be expected to be renderedinoperable at the same rate regardless of vehicle type or base location ordepot type. Measures of this expected failure will be discussed in asubsequent analysis.
The expected mean miles for each of the four reliability measures fromeach 3-way ANOVA is as follows:
MMBI MMBII MMBF MMBFF
Depot 35.2 38.9 92.3 85.7Non-depot 24.3 27.3 81.3 81.7
The 3-way ANOVA analysis shows that the depot vehicles are significantlybetter than non-depot vehicles in two categories, MMBI, and MMBII. Thisresult is counter intuitive. A vehicle from a new production assemblyinitially has all new components whereas for a depot processed vehicle, veryfew parts are replaced in a new condition, some are replaced as reconditionedand some (most) are not replaced at all retaining their prior use history.A new vehicle is subject to infantile type of failures which would make itappear to have an initial higher failure rate. However, the 11113 SDC datahas very few vehicles that can be considered in this infantile failure range.Additionally, as the vehicles progress in the field, the high failure ratecomponents (components usually replaced in a depot process) are again subjectto be replaced in the field for both non-depot and depot vehicles alike,making them tend to become homogeneous as field usage progresses.
A possible cause of the difference in the depot and non-depot vehiclesis the apparent unbalance and biasing effects in the data base itself. Thefact that this is true is shown as follows.
The 3-way ANOVA concludes that there is a significant base effect aswell as a significant depot effect. The means for each base from the 3-wayANOVA are as follows. An average miles driven at each base is also includedin the tabulation.
37
.. ..

Mann Asch Stew Hood RileyWAP WAM WAQ WAG WAR
MMBI 50.1 40.7 28.5 18.5 10.9Ave miles drivenDepot 1043 1058 804 609 476Non-depot 861 819 834 572 482
As a consequence to this parallelism between base mean and average milesthe validity of the base effect and the depot effect results are questionable.At this point, the only valid conclusion is that another method of analysishas to be used to determine the true reliability of depot and non-depotvehicles. This alternate analysis measure must be capable of assessing andremoving the underlying effects of miles driven, base effect, vehicle type(if any), and vehicle age regardless if these effects are balanced orindependent or otherwise.
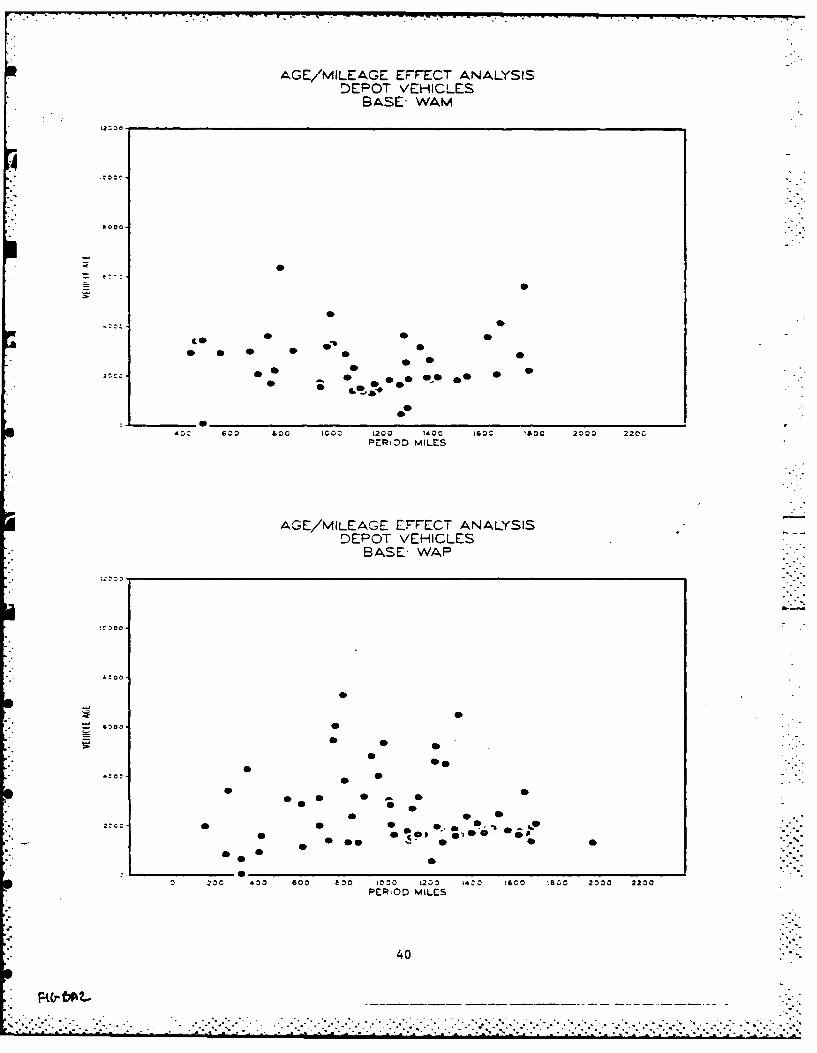
Base-Age-Mileage Effect Analysis
The 3-way ANOVA analysis on vehicle-base-depot effects, and subsequenttrend analysis on vehicle age (miles registered on odometer at mid-pointin SDC reporting period) and the analysis on miles driven show a possiblestrong relationship may exist for a base effect, an age effect and a mileageeffect. Miles accumulated during SDC.reporting period were adjusted to accountfor the actual days under the SDC reporting period to give a miles drivenper unit time measure, termed period miles.
An analysis to quantify their exact effect would be desirable. Thiscould be obtained by using a 3 or 4 way ANOVA including depot effect as anadditional effect. This ANOVA requires that the data on each effect be blockedinto Depot (2 treatments), Base (5 treatments), Age (1,000 mile increments= 9+ treatments) and mileage effects (200 mile increments = 10+ treatments).This requires data to fill 2xSxlOxlO or 1000 blocks which is impossible withonly 408 vehicles. Even if the mileage and age effects were reduced to 5increments, the probability of having 250 blocks filled with 408 vehiclesin an unplanned experiment is near zero.. This fact is evident when observingthe distribution of vehicles over vehicle age and period miles shown in FiguresBAI to BA5. Even blocking the data in 2000 mile age increments are voidof data entries. Hence, an ANOVA cannot be conducted and some other meansof measuring the effects will have to be pursued.
An interesting observation can be made by this method of data presentation.There is no strong tendency to use the lower mileage vehicles over the highermileage vehicles. This is evident at all bases for both depot and non-depotvehicles. The only possible exception is non-depot vehicles at Mannheim(WAP) shown in Figure BA5. Here the majority of non-depot vehicles at thisbase are around 2000 miles vehicle age. The 5 higher mileage vehicles areused less.
38......°.

AGE/MILEAGE EFFECT ANALYSISDEPOT VEHICLES
BASE WAG
:O'Zc
* ~ LOOO-
0 r&
:.* *b
2000.-l•S t
2 400 6~00 So 01, 120 l0 00 80 200 20
PEIO MILES
• *
200 4.0 600 500. 1000 1 .00 :400 :600 t600 2000 2200
PERIOD MILES
AGE/MiLEAGE EFFECT ANALYSISDEPO VEHICLES
BASE- WAH
030
£01:
*l000-
*339
S *i- =
S• %- ,
- 200 400 6:3 hC 1000 1200 WOO) :600 6h00 2000 220. 0' .'
PERIOD MgLES
39 .
... . .o•. .... .... ...... .. . .o ,. • . . . . . ..
.1% -eo0,. 0, o.% % oo o ' .% o. " oO. Oo ,o- °°p~e%.% o, ,, -I 'i% °o°%,o °-. %-,~ o' '0 ,.°- .- - .. °- , , ' -"o° o " -°* o, o •
AGE/MILEAGE EF'FECT ANALYSISDEPOT VEHICLES
BASE- WAM
? 00
A D: 600 D 60 too 1200 140c 160C 1300 2000 220C"
FP"R i D M ILE S
AGE/MILEAGE EFFrECT ANALYSISDEPOT VEHICLES
BASE- WAP .'S ..
0 60 600 Loo IL00 100 10 800 •000 2200
PERIOD MILCS
5040- 6500 0 0 ID ~ t II 60 :0 0 20
S Sii
S0'-"-
FIC-- 1 .. ,S". • ,"S
"' "% " '-" '. . '. .. -•.'' . . ''' o' o%1 . . S °" S% - S .' ' - S '' 'S"". -% , ' ' ' ' ' ' " . -o ' % -" ' ' ' ' ''
-- ., ' ,-: ".'-- ._ ". . ," , .." . . ,, ."".-,"L - '"""'" - - - " ":""' S- , - '"-S" . . -_. .._, """L"""' , -"""" , "'' ,'''

AGE/MILEAGE EFFECT ANALYSISDEPOT VEHICLES
BASE: WAO12 000
0000
A 0 oo 10 2.0 IO 10 800co 2C
PERIODMIL-E
AG/IEG FETAAYI
2 00 3Z 600 a00 Isla 12.0: 1400 1600 11%00 2000 2200PERIOD MILES
A~G/MLEGEEFEC AALSI
NPNcoO VEHCLE

AGE/MILEAGE EFT-ECT ANALYSISNONDEPOT VEHICLES
BASE- WAH
6:u c :0 40 10 10 00 20
PE3O MILE
AGSIEe-EETETAAYI
NODPTVHCEBAE A
4,
to apS9- 5 o 0
0 S ar0S
61.-3 Z a o 12O : 0 143 1000 hOC 2000 2200PERIOD M41LES
* AG/MILAGE FTEC ANAYSI

AGE/MILEAGE EFFECT ANALYSISNONDEPOT VEHICLES
BASE- WAP
SI
S Si
... 00 S
20S oo 600 60 1000 1200 1400 1600 1400 2000 2200
PERIOD MILES
AGE/MILEAGE EFFECT ANALYSISNONDEPOT VEHICLES
BASE. WAQ
S;O 0C
e "S
$oo12O160 100 200 20
*
S 5 .- 0
-,,
.0 40,0 600 600 1000 1200 140 0 1600 1600 20 00 22'00
PERIOD MILES
43
" t l . ":-:- -'.-'-..--....--...'.... .-......'..'....--.. ....,,.-.,-....-,...,,...--...,.....-...-...,..,..., .. .v.,,-.......,.,.......-.2
-''' -" -" --- - -"-'- ",. -' . - .. .. . ... '. .".. . . . . . ". '. . ' .: '' 2 .. , .,. ...' '..2 -2 '' ., : ,.2 ) "2 '',_L Z , i '" - ':::: :,- .,,

MULTI-VARI METHODOLOGY
This Multi-vari technique is a graphical method of viewing scatter plotsof any one (or all, one at a time) of the suspected effects on the data.It involves the application of linear (or non-linear) regression to bestfit a line through the data sorted to show the desired effect.
The strongest effect on the dependent variable (herein, NMBI, MMBII,MMBF, or MBFF) is thus estimated and then subtracted out of the data. Thisresults in a modified dependent variable within which the second strongesteffect can be viewed on a scatter plot, estimated and then removed. Thistechnique can be continued until the last effect of interest, (herein, depoteffect) remains free of the possible bias of the previous effects.
This Multi-vani methodology does not assume that the effects areindependent. That is, one effect does not influence another's outcome.However, it does assume a hierarchy of influence exists, that is, a strongereffect can influence a less stronger effect, but the less stronger effect
0 does not appreciately influence the stronger effect. This gives validityto the method of first subtracting out the strongest effect purifying thelesser effects.
In a true planned design of experiments, the biasing effects of thoseknown or unknown influencing factors that are not to be measured are balancedout. That is, the experiment is set up such that the expected m ean valueof each factors biasing effect of its influence on the dependent variableis zero. This balancing requires that the error mean of each biasing effectnot only be zero over all, but also be zero for each division of the data.This is required to eliminate possible bias in fitting regression lines to -
the data.
The Multi-vani methodology does not assume that the effects are balanced.* It does assume that the presence of these effects are known or at least
suspected. The M1l3 SDC data base is far from balanced. Period miles, vehicleage, vehicle type, base location, etc. can be biasing the main interest effect,the depot effect. This is to say that a straight average of all the depotor non-depot vehicles from all locations may not represent the true effectdue to the potential biasing effects from unbalanced or not independent factorssuch as period miles and/or others.
The first step in applying the Multi-vani methodology is to see how wellthe dependent variable (NMBI, etc) fits a normal curve. This is shown inFigure MVl. The figure shows that the fit is a skewed normal with a skewnessfactor of 2.02 (1.00 would be perfect normal) and a kurtosis measure of heightvs. spread, of 4.6. All in all, not a good fit. However, it is judged to
* be capable of influencing the statistical analysis used herein due to violatingthe assumption that the underlying distribution be normal, but not to theextent that it can't be useful. The results using this skewed distributionwould be valid but less than exact. The M113 SDC data does not merit a moreexact technique because of other inconsistencies in the data.
44
The second step in applying the Mulit-vari methodology is to eliminateany vehicles that are suspect as erroneous or not representative of the data
4 base or are statistical outliers. Eleven of the 408 vehicles were eliminatedor purged f rom the data base. One for erroneous high miles, three becausethey were non-runners, four because they were not in the data base long andhad no failures reported against them and three because they were classifiedas statistical outlines. The breakout of these vehicles is in Appendix Aalong analysis of other vehicles investigated but not purged. This leaves397 vehicles (238 depot and 159 non-depot) in the data base.
The large standard deviation shown in Figure MV2 around both depot andnon-depot means is not a measure of the confidence limits around the means.Because of the large number of samples (238 depot and 159 non-depot) in eachestimate, the confidence interval around each mean is considerably less thanthe standard deviation shown. So much so that the means shown arestatistically significantly different in any null-hypothesis tests.
The next step in applying the Multi-vani methodology is to treat eacheffect as if it were independent and/or all the other effects balanced out.Depot (depot vs. non-depot) effect is shown in Figure MV2. Here, as in the3-way ANOVA, the depot vehicles are shown to be better (higher mean miles
*between incidents) than non-depot vehicles. The 3-way ANOVA showed a ratioof 24/35 respectively for non-depot vs. depot MMBI, where as here, as straightaverage shows a ratio of 37.6/51.5 MMBI. Part of the difference betweenthe 3-way ANOVA and the straight average is due to the vehicle purging. The3-way ANOVA used 408 vehicles. The other difference is due to the vehicletype effect and base effect are accounted for with th-e 3-way ANOVA statistical
*treatment. A note of caution should be expressed here. Neither methodaccounts for the possible biasing effect of vehicle age or period miles.
The vehicle type effect is shown in Figure MV3. The means for each vehicletype along with the upper and lower one-standard deviation show that thereistatistically no difference in TIMBI for vehicle type. This is in agreement
with the 3-way ANOVA results. The only possible exception is the M113A2which recorded a 73.6 MNBI as compared to a 35.6 MMBI for the M1l3Al. Notice
* that in all cases, the A2 version performed better (higher 1M4BI) than itsAl counterpart. The only exception, the 11125A1, is not a valid point becauseof only one data point. This suggests that the upgraded A2 versions performbetter than their Al counterparts, but it cannot be statistically supportedusing this method due to the large variance in the data. There is a tendencyto use the A2 versions more than t'.e Al versions especially in the M113.This, because of the period mile bias, would make the A2 versions appearbetter.
The base location effect is shown in Figure MV4. This one-way ANOVAshows a strong base effect that is statistically significant, the same as
*shown in the 3-way ANOVA. However, it should be pointed out that here, asin the 3-way ANOVA each base has possible biasing effects of unbalanced ordependency on vehicle age and/or period miles. Possible vehicle age inbalance
45
45!
, , . .

- - - -, - - ,- - -
exists because not all age groups are equally represented at each base.Possibleperiod miles unbalance effect because the vehicles were driven less or moreat each base. And possible period miles dependency effect because of apeculiar practice, method or mission in applying the vehicle mileage. Thisperiod mile and vehicle age effect will have to be subtracted out of thedependent variable prior to assessing this base effect.
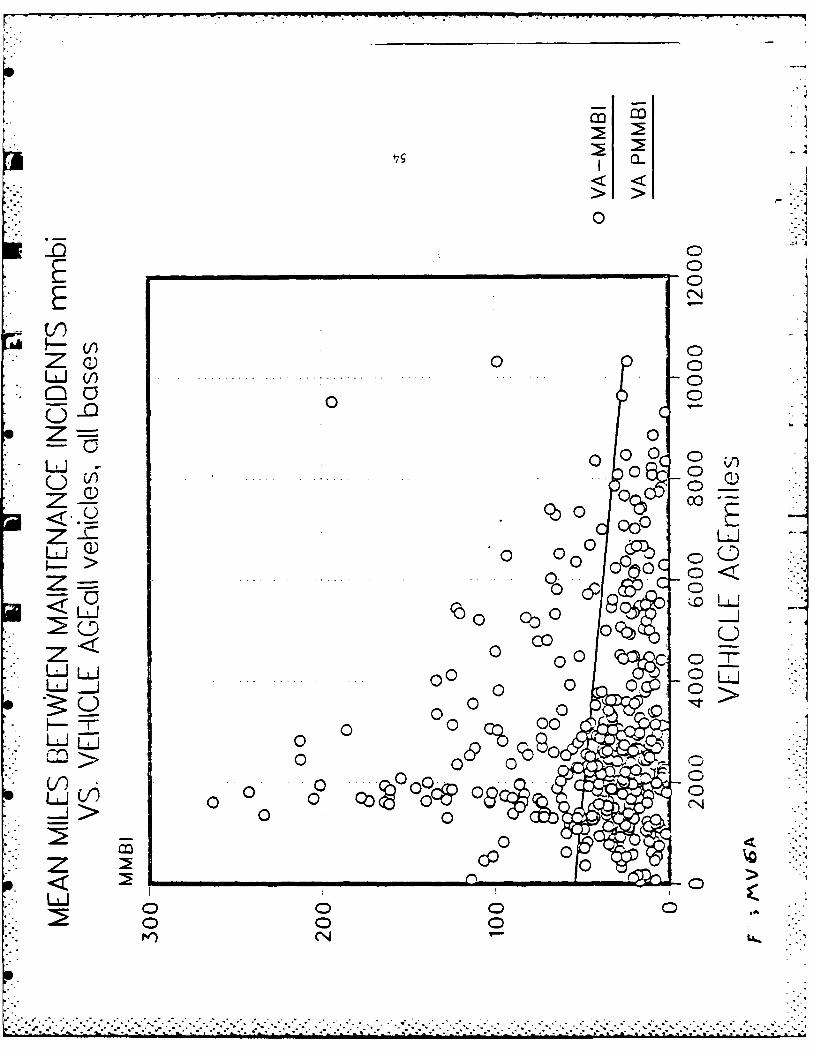
The vehicle age effect is shown in Figure MV5A and B. Figure MV5B wasobtained by computing the mid data collection age (start miles plus endmiles) and grouping these mileage into 1000 mile cells. These figures showa significant down trend as vehicle age increases showing an increasingmaintenance burden with age. The curve in Figure MV5B also shows a possibleclassical bath tub effect with a high failure rate at low mileage (MMBI isthe inverse of failure rate) and an increasing high failure rate at the highermiles. The 9000-9999 data grouping has too few vehicles to be considereda valid point. This effect was investigated, but the data variance doesnot justify fitting anything but a straight line.
Figures MB5A and MB5B show the strength of each visual graphical approachof the Multi-vari approach. In viewing the data scatter in Figure MB5A,the tendency is to conclude that the data is a true shotgun pattern. Thatis, it has no trend. Blocking the data into 1000 mile increments and plottingmeans and standard deviations shown in Figure MB5B gives reassurance thatthe means have a decreasing trend with age increase. Thus the linearregression fit shown in Figure MB5A may not have a good correlation of fit,but it does represent a reasonable measure of the true data mean. This typeof data with its large standard deviation tends to give the impression thatit obscures the true mean but with enough sampling (vehicle count) a reasonableestimate of this mean can still be made.
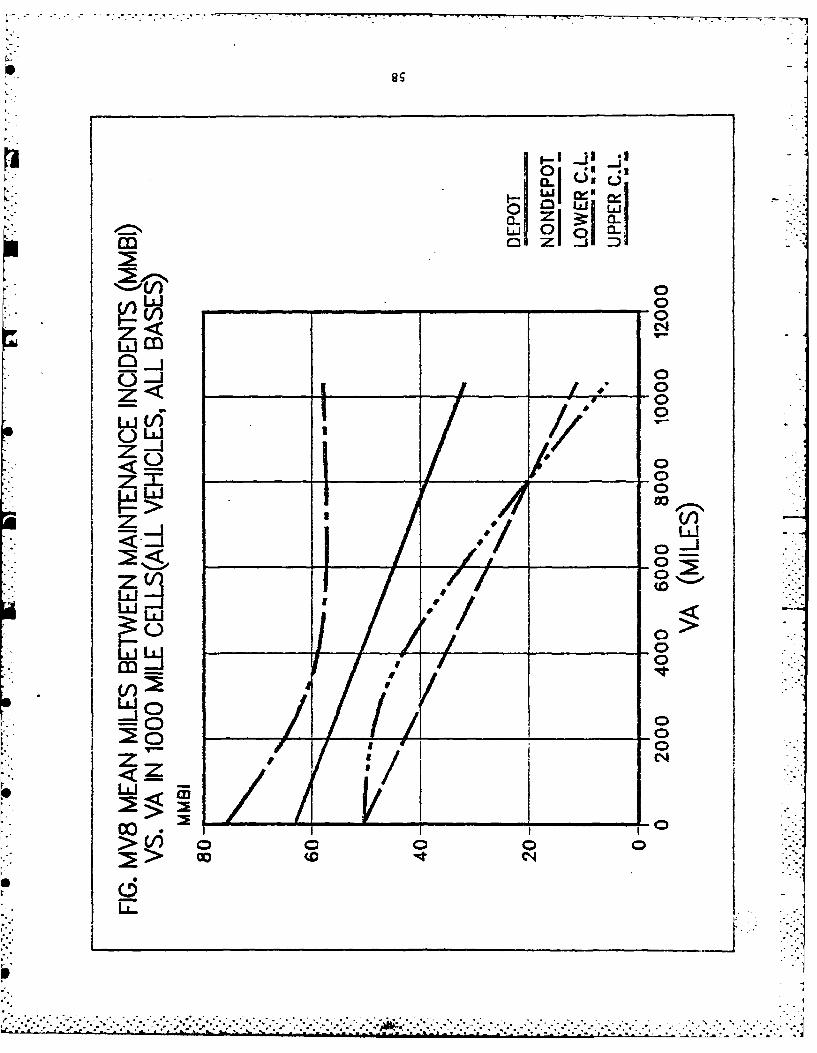
A vehicle age effect can be combined with the depot effect to see ifthe depot or non-depot vehicles have separate means and/or separate downtrend slopes. This data was scatter plotted as shown in Figures MV6 andMV7. The linear regression fit for both sets of data were replotted in FigureMV8. The 95% confidence limits were also graphed for the depot vehicles.This shows that the difference between the means is statistically significant.The non-depot vehicles show a lower mean MMBI (greater maintenance burden)and a slightly steeper decreasing slope with vehicle age showing a tendencyto have a faster increasing maintenance burden as the vehicle ages. However,this slope variation is not statistically significant.
The last single effect investigated in this data is the period mileseffect. That is, how many miles the vehicles were driven during the SDCreporting period. Some vehicles were used very little and some were drivenquite frequently. The reasons for each vehicle driving pattern is not knownhowever, why some are hanger queens and not driven frequently can be speculated
to be one or more of the following; driver/commander preference, base mission,base maintenance policy, base requirement and quantity available, hard toget parts availability and possible mirid of other reaons. This measureis not directly concerned with how many miles the vehicle is driven oncestarted, but the accumulation of total miles over the entire SDC reportingperiod of 406 days. This would be of interest, but this information is not
present in the SDC data base.
46
I
~~~~.. .. .... .......... . ...-. ,oo• - . .... .. •.,.............

The SDC M113 data base contains vehicles that were not driven at allto those that accumulated over 2000 miles. Since not all the vehicles wereunder the SDC reporting period the full 406 days, their mileage was normalizedto the 406 day period. This normalized figure was labled period miles. Abar distribution chart of period miles is shown in Figure MV9. Period mileeffect is seen in a scatter plot shown in Figure MV10. It is by far the
strongest effect. The more miles the M113 is driven, the higher the MMBI(lower the maintenance per mile ratio). The number of failure incidentsOccuring during the reporting period may increase because of the increasedusage miles. That is, the failure incidents per unit time may increase,but the failure incidents per mile will decrease as the vehicles are drivenmore. It is not known what is the casue or effect at this point. That is,are the vehicles driven more because they are runners or are they runnersbecause they are driven more? It is possible because of the fact thatscheduled maintenance actions are on a time (not mileage) basis that somefailure incidents are more time dependent than mileage dependent.
The period miles were placed into 200 mile cells and plotted with onestandard deviation upper and lower limits as shown in Figure MVll. Thisshows that the data is statistically significant. The linear regressionfit for this period miles effect shown in Figure MVIO was:
(MMBI)pM 2 12.14 + 6.7 x 10⁻² (-)
The period mile effect is not balanced for the depot effect, or the baseeffect, or the vehicle type effect. Hence, to get a more accurate estimateof these effects, the period miles effect will have to be subtracted outfirst. This is accomplished by calculating the (MMBI)pM from the aboveequation for each vehicle point and subtracting that value from the originalMMBI and adding that to the overall period mile mean. Thus modifying eachMMBI point.
MOD (MMBI)i = MNBIi = MMBIi - (MMBI)pMi + PM
where i = 1 to 397 vehicles.
This, in effect, balances out the period mile effect as if all vehicleswere driven at the average period mile mileage rate (PM). The results ofthis period mile removal action on the MMBI data are shown in Figure MVI2.As planned, the linear regression fit to this scatter plot data is flat.Interesting observations can be made on this scatter plot. First, the MMBIdata goes negative in a few cases. This has no significant interpretation,but does not subtract from the validity of the approach. To avoid thesenegative values, a higher constant than the average period miles effect (PM-)in above equation, could be added. This would rid the scatter plot of negativevalues, but would not significantly change the following analysis results.
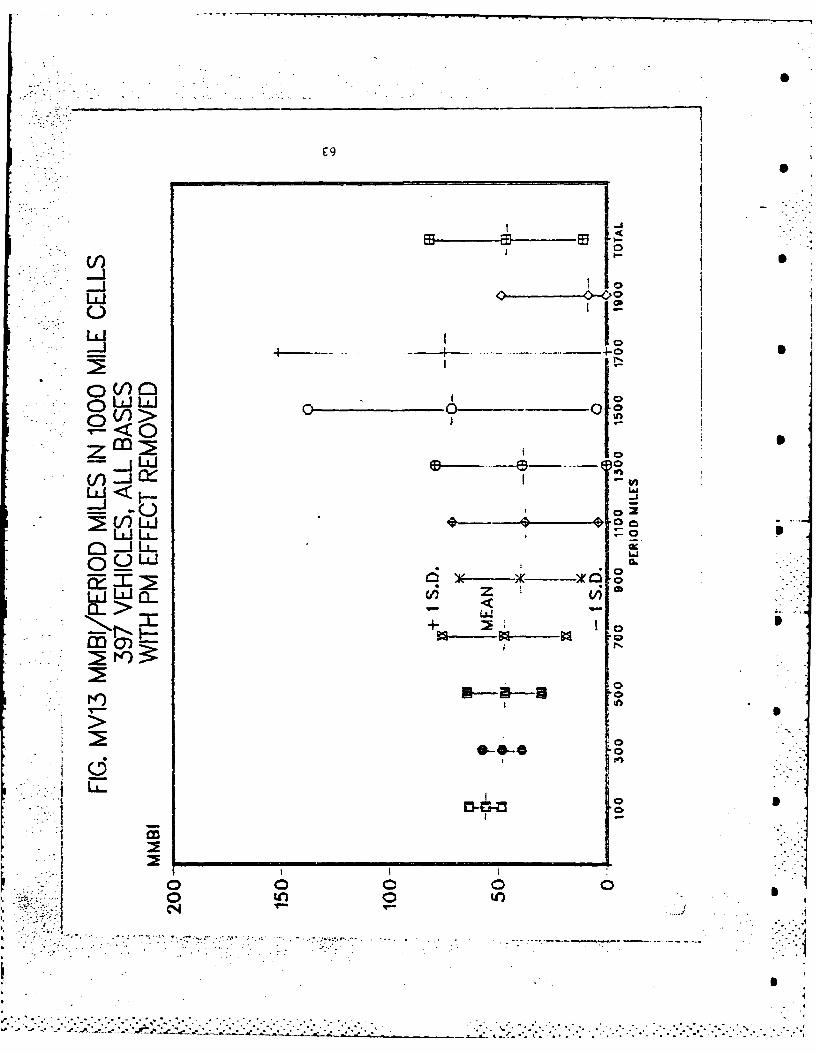
The second observation is that the deviation (scatter) of the dataincreased as period miles increase. This effect is shown by putting the
- period miles in 200 mile cells and plotting + one standard deviation as shownin Figure MVI3.
47

The data in each cell does not have a constant distribution, that is,it is not homoscedastic. This is alarming to statisticians because it greatlycomplicates the analysis methods. In our case, it could be a source of errorat the higher period mile data points, but this potential error will notprevent obtaining more valid measures of the remaining effects. Part ofthe problem of the increasing variance with increasing period miles comesfrom the nature of the data. There can be no high MMBI readings at the lowerperiod miles because the averaging technique used herein forces those intohigher MMBI data points. This in effect limits the variance in data at thelower period mile data points. This gives the upper bound in the data. Thelower bound comes from the fact that the unmodified MMBI data points hadto be greater than zero. When the period mile mean was added to the datapoint in subtracting out the possible mile effect, the zero lower bound wastransitioned to a decreasing lower bound starting from the period mile mean.This is evident from the expanding horizontal V-shape to the scatter in thescatter plot shown in Figure MVl2.
A data transformation of log (MMBI) was applied which successfullyeliminated this non-homoscedastic nature of the data. Subsequent analysisusing this log transformation resulted in the same conlcusions thusdemonstrating that no significant error was introduced into this analysismethod.
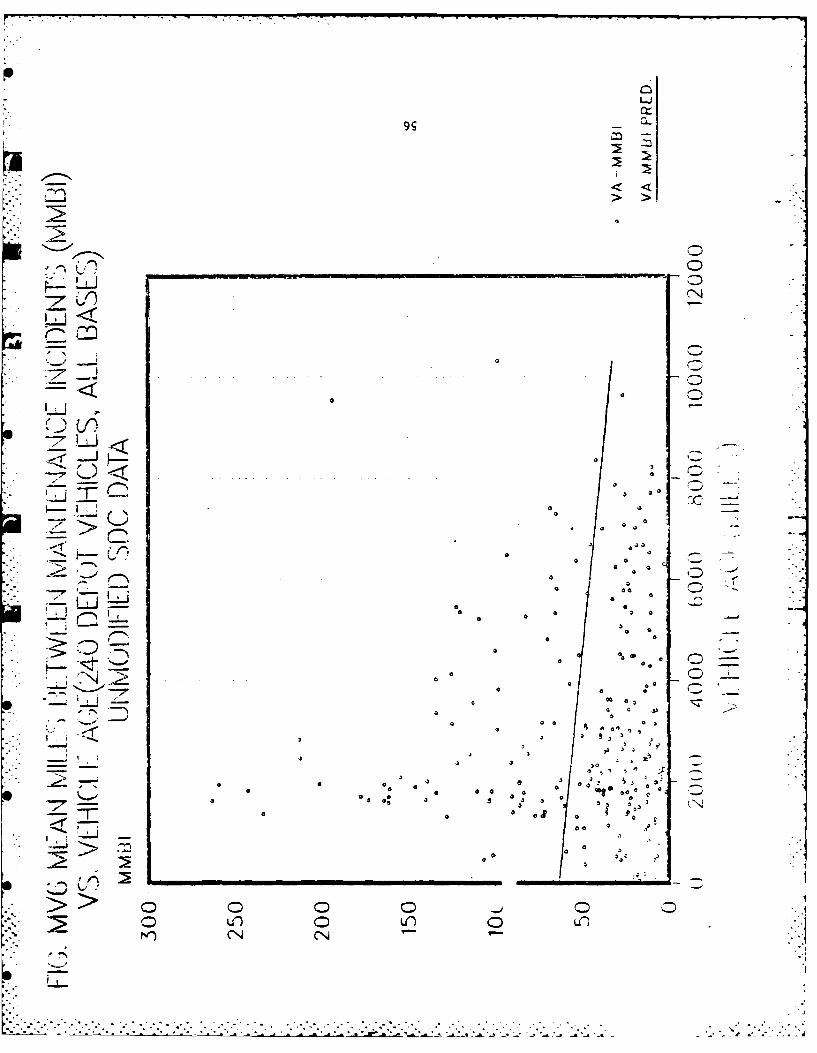
The vehicle age effect can now be removed. Since there was no significantslope difterence between the depot and non-depot vehicles, the vehicle ageeffect will be removed without combining it with the depot effect. Thisis done the same way as with the period miles effect. The vehicle age scatterplot is shown in Figure MV14. The least square regression fit is as follows:
(NNIBI)VA = 50.71 - 1.6 x 10- 3 VA with a mean of 45.96
The vehicle age effect with the unmodified MMBI shown in Figure MV6 wasexpressed with the following regression equation:
(NIBI)VA = 63.18 - 3.0 x 10⁻³ VA with a mean of 53.87
Adjusting for the difference between the Y intercepts and the associatedmean and comparing this with the changes in the slope constant (-1.6 x 10⁻³),it can be concluded that the vehicle age effect was not completely independentfrom the period mile effect. The downward trend still exists indicting anincreasing maintenance burden as the vehicle accumulates mileage. However,it is not as strong as what would normally be expected for a tracked vehicle.This and the large variance in the data would tend to indicate that the past
practice of overhauling the M113 at 6000 miles is not valid and would alsogive emphasis to the present procedure of inspecting each vehicle on anas-needed basis to determine if the vehicle requires depot attention. Italso gives credibility to the Inspect and Repair (I&R) depot procedurecurrently in practice as opposed to a complete overhaul.
48

mS
The variance in the MMBI with vehicle age and period mile effect removedis shown in Figure MVl5. The upper and lower limits shown are one standard Sdeviation. The assumption of constant variance is shown to be valid here.The slight variation in means at each age is due to the 200 mile cell effect.The cells are not balanced within themselves so some effect on the mean shouldbe and is present.
The five vehicles showing a large change at 9000 to 9999 mile block is Scaused from forcing the data to be a linear fit. It indicates that at thisextreme end, the best fit may not be linear but represent an incrasing failurerate due to a different failure phenomenon. This is possibly the wear-outphase of the classical bath tub failure curve. However, the data base isnot strong enough to statistically support this observation.
The vehicle type effect is shown in Figure MVI6A. Comparing this figureresults with Figure MV3, the same general shape can be observed. The biggestchange is lowering the M113A2 MMBI. Vehicle age effect period mile effectwould have a large impact in this variable. The newer A2 versions, especially
the M113, tend to be used more than the Al version. The better performance(higher M4IBI) of the A2 vehicles over the Al vehicles is still present. Againin the M125A2 data point is not valid. The large variance in each dataprecludes statistical verification of this observation
The MMIBI is again modified to remove this vehicle type effect (as wellv'-hicl,: 3ge and peri, milcs) and plotzed in Figure MVI6B. As can be
.expected, the mean is the same. The variance is different but does not violatethe assumption of constant variance.
The last effect to be removed is the base effect. It is plotted in FigureMVI7. There is no significant difference in any base except for the 99vehicles at Mannheim (WAP). Comparing these results to the results shownin Figure MV4, the observation can be made that the lower MMBI shown forthe 46 vehicles at Ft. Stewart (WAH) was not due to a base effect, but dueto the biasing effect of vehicle type, vehicle age and period mile effects.However, something is being done at Mannheim to gain better recordedperformance out of their vehicle fleet.
The modified MMBI (with Base, Vehicle type, vehicle age an-' period mileeffect removed) is shown in Figure MVI8. It is a straight line mean as isexpected and the variance does not violate the constant variance assumption
The last effect of interest is the depot effect. The modified MMBI withall effects removed is shown in Figure MVl9. This shows that there is nodifference in the reliability performance of non-depot and depot vehicles.This is quite a different conclusion than that which would have been drawn 0from looKing at the unmodified data.
The change in mean !MBI for both depot and non-depot vehicles as eacheffect is removed as shown in Figure MV20. Each effect eroded some of thedifference with the period miles and base effect having the stongest bias.
49
.i.i..---? -. i..- i . . . ' .-. - . . ..-- . .... ..-.. .- -... . ... .- .-" .' " . . " . i- - ' . .-- . .'i'

oLO
2
C
..................... .............. ............ . . . . ... 0
Z ) ,
Liz>cn-
LL~
040
_ _ _ ____
.. . . . . . . . . . . . . .

LL-J
L
0 .0)U~o< <
LUJ
CN>
> >'
0 00 0 00

0
CIO
0
0 C
ur) C.

Cs4
00
L&J<)
< <--. > >-;-
0 0
0
v0 0L .L I .. . ... . . . . . . . . . . . . . . . . . . . . . . . . . . .. o00
00 0
QQ0 0O
" Z 0
00 C) 00
_0000 o_
LJL 0 oF
<J 00 0 00
00LJj0 0c:
-i> 0 (UJ..o_0 .I( Q o 0-
op G t. L. o
0 P0 0(0 __j
0 co
LI J ...... 0 00 l
0Z0 0
0 0 0
1 0 0 0 0
0 0 0
n00. ) .cp
.. ." - - o - , ° . ° - o . - , . . . . . . . .. . . . . . . . . . . ' .

Li0Li I-
Li
IAI
o.*/ Lc IM* OLJJ I
QcD -LA-
*z -
C)J IE* _;K 0
>-z ED
in- :20 11
zI I-
U)*
-70
£ 30
0 '-4
0 -O 0 1
- 0 0
* - 3
(oz CC C0 ~~~ LnC)Ol )L

0Li
_ 0~-
< <> >
o-~ 0
~0720 (N
LLJj
007.,; 0
-. 0
'~~~0 -
* 0* -~
:0~
r()0~ -
* >- (-,, ,0
00 - .'.0
0 0
0 0
,..,,... C , -'
-- -. ' 0 0-C -.
* .- % -. 0
0 'I->
-. 0
* . I- .*' 3 0
0 ~ 0~ ~ "~bo ~
-- .-r a' a
1 3 0 0 00 00 10
0* 0 ~ 0000 CN
0 ~ 0~, 0 0
I~J~ ~ o 0e1
>s> ~I -o0 0 0 0 0 0 00 u)N (N
I.
00
-=N 0j0C
- 0
WV) 1
La 0
<-4
ILL
z V0-o__ __-LL0
-- I

I6
IC01
C 4
MEMEM0
C- 0
co0
r0
0c
'IIL

09
00
L - -o"; . .
1--
CL
A LLJ(/0Ld
VI)
Z 0
.. . ... . .. . . .. . . .... . .. .. .. .
.-J
F-"° ".o-o o - ""-
ZT r, CL
L L LJ*F-. LJ 6~
LLJ -1 M
LLJ 0 \ C
*.. . . . . . . . . . . . . ... .. 0.~
Lizo-
0
LL.. J

19
I-
C:>
U.)
1 .o -
__ ow
Lj. 0 0"
m'° -
00
oow
LOO 0 0
C14 04
- I -
.* - ..- i.

* Z9
ZI -
C~)
ZOO
ZLLJ
aL c0. a LJ0. yf
*
L.Lj C)) LI. . ,* 6
*n - 0r
m. a
Ltn 0 l) 0 i
CC14
E9
I) >< .0
w 1-J <--- 4-- 02
z C
0 LOC*0

717
:E
<v)~~~~~> >__ _ _ __ _ _ _
V-
* ... . . . . . . . ... .. 0.. . .. . . . .
< 0
*L * a
- *i *L a 0
C) *0
.................................................................... ............... ..... ...... g
W1) ILiJ
LOLL
0~ %,.: e*n <. 77 00a I
LLJfZ> .1
04-

1--0e3 M
_ _ I* II
E55< IC7L
00
4
LO u0

99
J _________
I,I 4.
-6- 4- C
C
_________ __________ SU -
U] -,
4.I -'
* 14.
-I i
-
-
4..fl
I -
-x IZ
I-lw -,I - - - - -
4.
* + I5
6 -iI. C-
4
4.
T
0
001~

L9
iC
C!, <
> _j
0>
.4:73
lW C__ __1W Li00

99
ujj
cn'
u LIP0
Bitm 1
LOJ

69
o 0-La _
>oc
133
0 0to C4
. . . . . . . . . . .

II
zz
03
030
. . . . .. ...
a3 I
.. .. (D N , .

ELJ
>Wa
lo-
QwI--LL.
LLmqL.JLLI ~ ~ 1 WiLL
CL L&J a..<LLii
> 0l
Lic 0TLLLI E a.
>A 0Az~ Chz -
0L Cl4
aa.
UOC
C:) Z 0
ACTUAL VEHICLE FAILURE ANALYSIS
A vehicle failure is herein defined as a point in time when the vehicleis stopped for a repair. It could be because the vehicle was renderedinoperable due to the failed part or it could be a convenient point in itsusage that allowed for an inspection and repair. M113 SDC data does notdistinquish between either case. One or several failure incidents couldbe reported against the vehicle during this single stopping point. Thisfailure measure results in two reliability measures, Mean Miles Between Failure(MMBF) where the total count of when the vehicle is stopped for repair isdivided into the total cumulative mileage for each vehicle, and MMBFF wherethe mileage from start of SDC reporting to first failure and last failureto end of SDC reporting is eliminated from the mileage along with one failure.Mathematical expressions are as follows: Both measures are based uponunscheduled incidents only.
MMBF i = (TOTAL MILES DRIVEN)
(TOTAL VEHICLE FAILURES)
(MMBFF)i = (MILEAGE FROM FIRST FAILURE TO LAST FAILURE)
(TOTAL VEHICLE FAILURES -1)
(fQr i = 1 to 408 for each vehicle)
The results of an analysis is presented in the following discussion. MNBFFwas chosen because it was felt to be a more exact measure of actual vehiclefailures or how long on the average could the driver expect the vehicle to --
operate once started. The analysis follows the Multi-vari analysis performedon the MMBI reliability measure. Hence no graphic results will be presented.
The data fit is again a skewed normal with a mean of 95.1 miles, a standarddeviation of 66.6, a skewness of 1.8 and kurtosis of 4.9 (Reference FigureMVI for comparison).
There were 3 outliers that were not omitted from the data for thisanalysis. The raw data showed mean of 89.7 MMBFF for non-depot vehiclesand 98.8 MIMBF for depot. Neither of which is statistically significantlydifferent from the other. This is in agreement with the 3-way ANOVA analysisresults.
The unmodified data showed the following bask effect means and variances:
WAG WAH WA WAP WAQ TOTAL
Mean q0 85 69 104 129 95.1SD 48 57 50 74 78 66.6Qty 75 46 100 99 77 397
72
--. °-'i

The unmodified data showed the following vehicle type effect:
M106 M113 M125 M577Al A2 Al A2 Al A2 Al A2 M901 Total
Mean 80 74 99 121 91 22 71 65 48 95.1SD 53 46 66 79 63 -- 28 34 17 66.6
Qty 11 12 152 111 41 1 8 18 43 397
The unmodified data showed the following vehicle age linear regression
line.
MMBF = 2.6 x 10- 3 (vehicle mileage) + 87.35 with again a mean of 95.1,a standard deviation of 66.6 and a goodness of fit measure of .08 (1.00 wouldbe a perfect fit).
This has about the same magnitude as in the MMBI analysis, however itis an increasing effect. The MMBFF data also shows a very strong periodmiles effect with the following linear regression line.
MMBFF = 8.6 x 10⁻² (period miles) + 20.0
with a mean of 95.1, standard deviation of 66.6 and a goodness of fit measure
of .52 (a good fit for this scatter data).
Removing each biasing effect using the same technique used for the MTBIMulti-vari analysis results in the following difference in the depot andnon-depot vehicles:
Non-depot Depot Total
Mean 95.7 95.0 95.3SD 49.0 50.3 49.7VCA 159 238 387
The conclusion drawn here is there is no significant difference in theexpected mean miles to when the vehicle is stopped for repair. This appliesto base effect and vehicle type effect. Vehicle age has a slight beneficialeffect and there is a strong period miles effect.
73
. . . . . . . . .. . . . . . .. . . °"

FIRST FAILURE ANALYSIS
Since both non-depot and depot vehicles tend to become homogeneous asfield failed components are replaced on each alike, a true measure of
* reliability of depot and non-depot vehicle performance would be to track -
field failure history on those components receiving some depot process andcompare those with the new component performance.
This is not possible within the M113 SDC data. First, because the data* does not track either new or depot processed vehicles from a zero miles
condition and second, of more importance, is that the processing depot doesnot record which components received depot processing on an individual vehiclebasis, let alone what type of depot process they received.
This lack of record keeping on an individual vehicle basis at the depotprecludes any analysis attempting to determine field reliability performanceof depot processed 'vehicles as compared to new components.
74

* .. DEPOT ACTION EFFECT
The second object of this study is to assess the impact of specific depot*actions and procedures on reliability of the M113 FOV in the field. This
is of special interest since the depot procedures have changed the DMWRsthat required complete overhaul to gradually transition to an Inspect andRepair MIR) procedure. The vehicles under M1113 SDC represent this transition
*period from 1970 thru 1982. Even though the emphasis in later years is onI&R, the depot tendency is to do as complete an overhaul as possible. Aninvestigation of actual depot practices would likely disclose that thereis not much difference in the depot overhaul and established I&R practiceup thru 1982. Reliability impact from changes in specific DMWRs cannot beassessed due to lack of record keeping on specific depot vehicles. Historyof DMWR changes is available along with variation practices to these DMWRs.However, no records as to what was specifically done at each vehicle or evenblocks of vehicles were kept by the processing depot. Without knowing thehistory of at least the major components on the M1113 depot vehicles, evaluating
the field reliability impact of DMWR changes is impossible to accomplish.
A look at reliability of depot vehicles vs year of depot action can be*assessed and is shown in Figure DAl. This is with the unmodified data. This
- .figure shows a reliability growth from 1970 to 1982. However, this data*is biased the same wasy as shown in the Multi-vani methodology. It reflects
a parallel in vehicle age effect and possibly a period miles effect sinceyounger vehicles have a slight tendency to be driven more. The year of depot
effect was again assessed with the unbaised data, that is with vehicle age,period miles, vehicle type and base effects removed. This is shown in FigureDA2. This linear regression fit is essentially flat. The standard deviation
for each year was determined and plotted in Figure DA3. From this the
conclusion can be easily made that there is no significant difference inthe reliability of depot vehicles over the year of their depot action.
This conclusion endorses the current I&R practice of depot processing*in that the transition from complete overhaul to I&R such as it is has not* degraded the field reliability of depot vehicles. The number of vehicles -
within each year are shown in Figure DA3. This mean shown with less than5 vehicles should not be taken as a valid representation.
75
........ ....... ....... EFFE.T

9 L
(D (D
'0
LU
L~j
W)- -6n
(N --

M: m
a- a
LLLL
00
LiJ
UJLJ 0
mU>0
Lii
L,-
ZcCN
KL
C0

- -_ _ - 0 4
C4
C--
EL()ULLJ n-
LLJ
-LJ +)
M >U
* N -
* )
0) 0D 0 0U-) C fln
Q-SERVICr 'TrrCT ON RELIABILITY
The Quarterly service maintenance performed on the M113 SDC vehiclesshould have an effect on their reliability. This should be especially truesince not all vehicles get Q-services on . regular basis. Some vehiclesat each of the 5 bases under SDC received no Q-service and some receiveda total of 6 over the 4 plus quarters reporting period. The normalized ratioof Q-service performed at each base is shown in Figure QSI. Each value isnormalized to account for the different number of vehicles at each base.It should be noted that this is Q-service reported and may not representthe actual Q-service performed.
Since the SDC reporting period is for 4 quarters, a zero reading at eachlevel and a max level at 4 would represent a perfect record. Obviously fromFigure QSI, each base has a far less than perfect record. Two bases appearto have a slightly better record than the others, these are WAQ (Mannheim)and WAQ (Ft. Stewart), with WAM (Aschaffenberg) not far behind.
The number of Q-services reported on depot and non-depot vehicles wasplotted against the strongest reliability measure MMBI in Figure QS2 andQS3. A regression line was fitted to each curve after Q-service points 5and 6 were lumped into Q-service 4 data point. The result is shown in Figures
Qs4 and QS5. This shows that the number of Q-services performed has no effect-n reliability for non-depot vehicles and a possible slight increasing effect
for depot vehicles. This slight increase is not significant.
Perhaps it is not the quantity of Q-services performed, but the qualityof service performed. The quality of Q-service performed should be measuredby the manhours expended during the Q-service action. That is the moremanhours expended, the more thorough the Q-service should be. The manhoursexpended during Q-service ranged from 0 to 200 for both crew and organization.The distribution of each along with clock time is shown in Figure QS6. Theexplanation of why there is such a large dispersion in the number of hours
used to perform a standard procedure Q-service is not known. It could wellreflect the quality or thoroughness of the Q-service as assumed above.
Proceeding with this assumption, the total (sum of crew and organizationmanhours expended on all Q-services performed on each vehicle was plottedagainst its reliability measure MMfBI for both depot and non-depot vehicles.These are shown in Figures QS7 and QS8. The linear regression fit throughthe depot data shows a strong positive interaction. This shows that themore manhours expended on Q-service for depot vehicles, thus the more thoroughit is, the better the reliability performance of the depot vehicle. Thisrelationship is quite strong.
The non-depot vehicles surprisingly show a slight decreasing effect,Figure QS8, that as the IBI seems the independent of the Q-service, thesame trends are shown for the number of Q-services performed (see FiguresQS4 and QS6). At this point, no plausible explanation is offered to explainthis difference.
79
. . . .
. . .. .. .. ... .. * ' - .. . .. . .. ". " i : , "' " ".. .-.. .'.. . .'., '".'".. ." ,.. .".

An in-depth study of this effect would probably show the effect to benon-linear showing an optimum level of manhours expended. The effect shouldalso show a time lag effect from the fact that preventive maintenance shouldimpact a reliability measure sometime in the future use of the vehicle bypreventing or postponing component failure. It is quite possible this lageffect is shown in the non-depot vehicle insensitivity to Q-service.
0
-..i.. . . ..•

40 00 m oe e
0U
00- L
L 0000 e %U
n0 00 0
0 Li0 0 L
I I I

ZZ
0ft esc a as o t
LL LL
LLJl
r)0W
Wo
(IZwn
I I I |I I I . "
o 0 0 0 0 0 0
o 0 0C18N
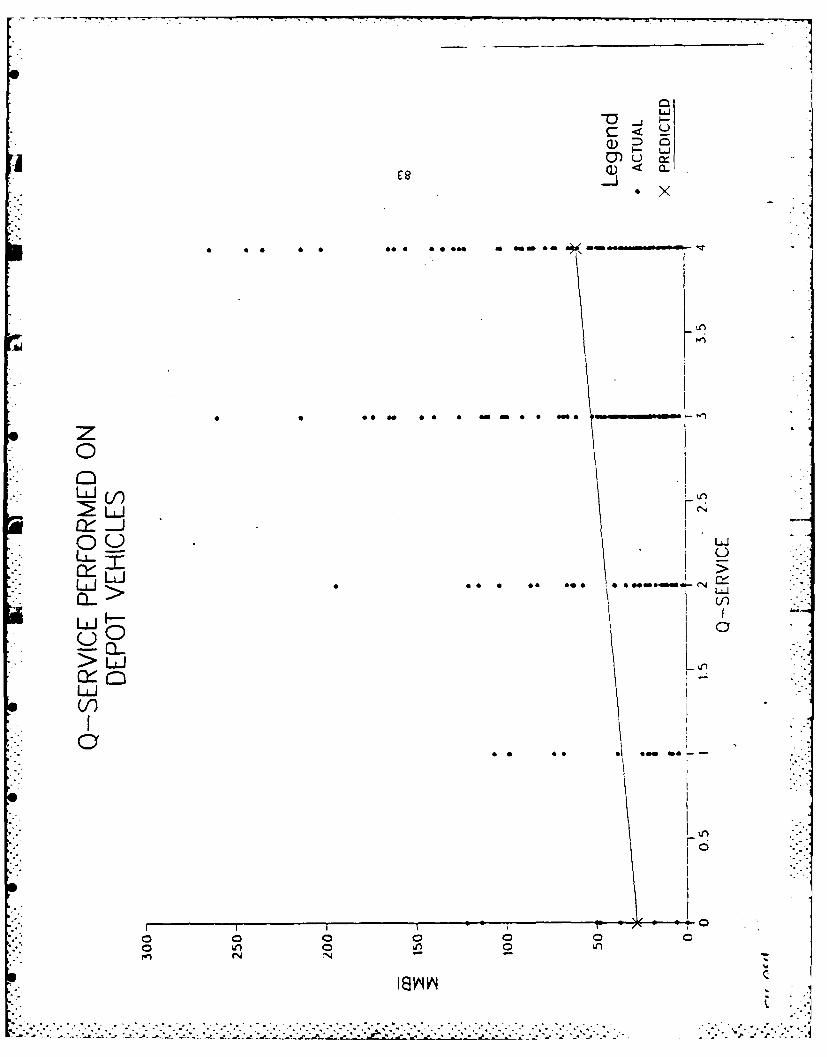
LLi
ox
00
MAI(
re
L 0
1C C
C)~
oY 0 0 6 0 0 0
CN N -

Lij
178 Q -
Ox
LA
* CN
LL~WLU
J- 0)
0 moo.a - *
so
a-
I I II ~1 /~'

110 C0
0 a4o suotinqpsp iU B u~u- SOZ) 101 OR 0z)~~eda4 0 P~ o '0 OJO -slq meOsL 0 z P"o 'Ofiz '011
01) 0'
LW3
o
Ln.
C-
Ql)
* C)
- a
s.AnOH O qqwnN

98
ry0
D0
LL0
.70r
00
\Dg
oo
<LU 0

, ... -....
U') 0n
~<
L2 o
o; Q o
--
tot
". I
00*0a
10 a/
J t
00~~0 a :0L.~itL 01 o; *
" "0 " *
*C
0 " . - - ,
• •. • •
* 0 * P j , 00..
0
C * *
* C•
0,,.. .... .. .... .. ... .. ...... .... ...... ; -

SUBSYSTEM RELIABILITY
Within the SDC data, there are two codes applied to each recorded incident,a subsystem alpha catagorization (A thru V) and a Federal Group Classification(FGC) code 0100 thru 9500.
The subsystem catagories in each system are very similar, however, thereis very poor correlation between them on each incident. The subsystem alphacode required a visual checkoff on the data sheet. The FGC 4-digit codewas obtained from the parts manual along with the incidents part number.A sample check on the FGC number recorded against the part number showedan imperfect but good 1 to 1 correlation. Hence the alpha catagorizationwas judged more erroneous than the FCC numerical code. Thus, the FGC datagrouping is used to catagorize and measure subsystem reliability.
To obtain a reliability measure of FGC subsystems on the depot andnon-depot vehicles, all incidents were grouped and counted in each majorFGC category as shown in Table SRI. A significance test was applied asrecorded in this table. A marginal significance means that the mean differencewas significant at the 90% but not the 95% confidence interval. The subsystemsthat show significant differences in Table SRI are echoed in Figure SRl.The MMBI data used here is biased in favor of the depot vehicles becauseno biasing effects were removed. So if the depot subsystem proved betterthan the non-depot system, it may be due to the bias. However, if the depotvehicles prove less reliable than the non-depot vehicles, then that shouldbe a true significant difference.
FCC category 0300 Fuel Systems and FGC 1300 Wheels and Track are thetwo subsystems that the depot vehicles showed a significant lower reliability.These two subsystems are prime areas to investigate in Phase II.
88
................................................................................................... . ~ .... .... ....

FGC MMBI FAIL COUNT MMBI FAIL COUNT DESCRIPTION SIGNIFICANCE
01 723 278 649 194 Eng Assy Marginal
03 372 540 301 418 Fuel Sys Yes
04 2646 76 1120 57 Muff & Pipes No
05 485 415 488 258 Cooling Sys No
06 147 1367 136 926 Elect Sys Yes
07 986 204 1024 123 Transmission No
08 3296 61 2624 48 Final Drive Marginal
09 2011 100 1099 60 Prop Shaft No
11 1377 146 1384 91 Rear Axle No
13 194 1036 264 477 Wheels Track Yes
14 1478 136 1326 95 Steering/Brakes No
15 3591 56 2470 51 Yes
16 1571 128 1125 112 Shocks/Springs Yes
18 198 1015 160 787 Hull Yes
19
20
22 2366 85 2571 49 Hull Acc No
24 1204 167 1285 98 Hyd/Fluids No
29 33512 6 62978 2 Kits No
33 2793 72 1211 104 Armament Yes
34 2793 72 906 139 Misc Yes
TABLE SRI
FGC SUBSYSTEM BREAKOUT
89
89J
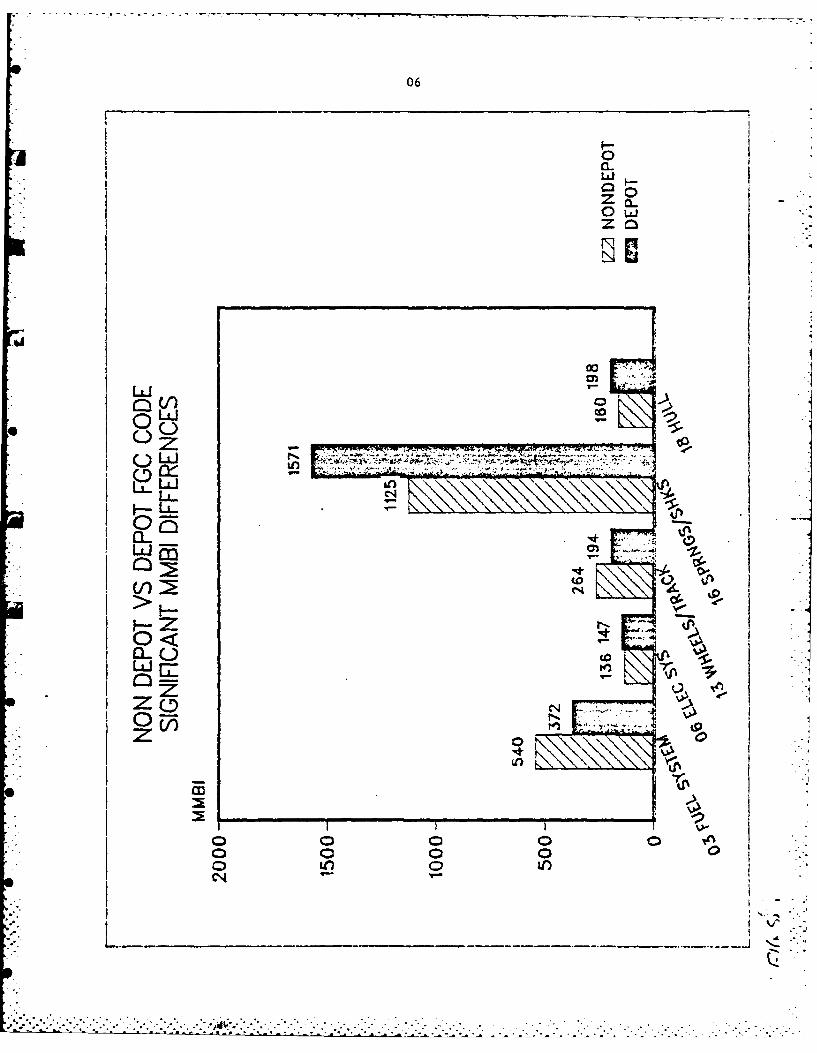
06
0 u
z n
00
0) U
LL-I
ED En
o <
o It 0LI
Em
_ _ _ _ _ _ _ _ _ _ _
*C 0* 0* *** * * *. ..
- C) . **

COST DRIVERS
Cost drivers are individual components that have a high part cost ora high labor cost or both associated with the maintenance incidents reportedunder the M113 SDC data base. Both B and C type records are included. Thisincludes both independent and dependent parts, from both scheduled andunscheduled maintenance actions, excluding those actions dealing with vehiclefluids, (oil, fuel, grease, antifreeze). High labor cost can come from ahigh quantity of parts replaced or a high manhour per part requirement.
Labor and parts costs are summed into a total cost which is not intendedto be an exact measure, but only to provide a relative ranking of supportcost for the M113 family of vehicles. The part cost is determined from theAMDF listing which does not always reflect current 84 dollars. Labor costsare determined from the sum of all crew, DS, GS and depot maintenance manhourchanges times an average cost per maintenance of $14.27. Total cost is noton a yearly basis, or vehicle basis, but reflect costs expended over thetotal 406 day SDC reporting period for all 408 SDC vehicles.
A total of 1771 different parts were serviced on the M113 family ofvehicles. These parts were either replaced with a reconditioned (rebuilt,overhauled, inspected, repaired, remanufactured, cannabalized, etc) replacementpart or a new (not previously used manufactured) part. The history of thereplacemeni part is unknown as well as the history of the part replaced.The cost of the replacement part is from the AMfF listing which does notnecessarily reflect either new or reconditioned part cost. Hence, nodifferentiation of new or reconditioned parts are reflected in the part cost(hence, total cost) in cost driver listing. If the part was not replacedwith another part but rather repaired (adjusted, serviced, reset, etc) atsite, than the AMDF parts cost was not assessed, however, the at-site laborcosts for this repair action are accounted for in labor costs. The off-sitereconditioning labor and parts cost are not directly accounted for. Theyare indirectly assessed by assigning the AMDF parts cost.
An explanation of the values shown in :he table in Appendix C, CostDrivers, is as follows:
Col 1 Part NSNCol 2 Part number may be truncated if in excess of 15 spaces.Col 3 Truncated nomenclature from the AMDF fileCol 4 Total quantity replaced. This replacement part did not necessarily
fail. It could have been replaced because it was a dependent*I incident or due to driver error or accident.
Col 5 Total quantity adjustedCol 6 Total of all crew manhours expended replacing or repairing this
part.
91
[ -°.. .

Col 7 Sum of all Orgnizational maintenance manhours expended aginstthis part.
Col 8 Sum of all DS maintenance manhours expended against this part.Col 9 Sum of all GS maintenance manhours expended against this part.Col 10 Sum of all depot maintenance manhours expended against this part.Col 11 Unit part cost taken from the 84 AMDF listing. If the part could
not be found in the AMD, it was listed as zero cost. The samecost is used to reflect both new or reconditioned parts.
Col 12 Total parts cost which is equal to quantity replaced (Col 4) timesCol 11.
Col 13 Total labor costs which is equal to the sum of all labor manhours(Col 6, 7, 8, 9, and 10) times an average maintenance labor manhourcost of $14.27
Col 14 Total cost which is equal to the sum of total parts cost (Col13) and total sales costs (Col 12).
Cost drivers are identified and ranked so as to aid future investigationswhose purpose would be to reduce field maintenance costs (one of the objectsof Phase II of this study). The highest cost drivers are periscopes andtelescopes and power train corronents from engine thru track pads. Thereare 168 parts that show a total cost expenditure of more than $1000. Theremaining 1603 parts listed total costs from $999.00 to zero cost.Surprisingly, some screws, nuts and washers are included in the above category.This is due to the fact that a disproportionate labor cost was associatedwith these parts. It is felt that labor cost in replacing a nut, for example,should be included in what part the nut secures and not assigned to the nut.
Supplementing the cost driver list in Appendix C is listing of the 100most frequently used unscheduled parts (incident reports) in the MI113 SDCreporting period. This listing again intended to aid Phase II investigations.It is interesting that the most frequent reported unscheduled incident isautomotive grease.
9
. 92
6°

D-Ri49 £27 M1±13 NEW VERSUS OYERI4AUL(U) ARMY TANK-AUTOMOTIVE 2/2COMMAND WARREN MI D J HAiCKENBRUCI NOV 84 TACOM-83-34
UNCLASSIFIEDO 1/3ML
mEohhEmhhhmhhEEomhhhmhhmohEE

I~v 21 25
L3* 36 om~
1" lAO 1112
11111 1L25 A 1.
MICROCOPY RESOLUTION TEST CHARTNATIONAL BUREAU OF STANDARDS-1963-A

DETAILED CONCLUSIONS
1. Field usage shows little or a slight tendency to use lower mileage vehiclesover older, higher mileage vehicles. This is true for both depot and non-depotvehicles.
2. At those bases that have both non-depot and depot vehicles, there isno preferential vehicle use tendency.
3. There is no tendency to use A2 designated vehicles over Al designatedvehicles at those bases that have both types, especially for the M113.
4. Some of the vehicles under SDC are non-operational or operational andnot used throughout the four quarter reporting period.
5. There is statistical evidence that some bases reported vehicle mileageaccumulation without reporting failure incidents at the start of the SDCcollection period and again at the end of the SDC collection period.
6. There is evidence of missing failure incidences. However, this is ona per vehicle basis and not particular to any one base location.
7. The upgraded A2 versions of the M113 FOV perform better than theircounterpart Al version, however, this cannot be positively concluded withstatistical confidence.
8. The vehicle-age effect on mean miles between failure incident shows atendency to take the classical statistical bath tub curve. However, thelarge variance in the data prevents statistical verification
9. M113 SDC data by its very nature tends to have large variances. Thisdoes not preclude estimation of a true mean providing that a large numberof vehicles (samples) is present.
10. The M113 SDC data indicated that the MI13 family of vehicles does nothave a definite wear-out pattern at the assumed 6000 mile overhaul mileage.In fact, the failure rate shows no large increasing trend even up to 10,000miles.
11. The failure history vs. vehicle age indicates that the present practiceof inspecting each vehicle on an as-needed basis and using the depot practiceof Inspect and Repair rather than overhaul at 6000 miles, is a better practice.This merits further investigation to establish its validity.
12. All bases have the same influence on vehicle reliability performance. except for one which is significantly better. The cause is not known, but
. it is not due to vehicle type, vehicle age or period miles biasing effects.It is possibly due to the apparent lack of reporting failure incidents inthe beginning and end of the M113 SDC reporting period, and to the betterQ-service attributed to that base.
93
.... ... ........................................... . . . . .
* 13. There is no significant difference in the reliability performance innon-depot and depot vehicles. This conclusion is assuming biasing effects
. of vehicle base, age, type and miles driven are removed.
14. On the average, a M113 type of vehicle can expect to have a MMBI of45 miles between failure incidents. This is assuming that it is driven about1000 miles per year and is approximately 5000 miles in age. Any deviationfrom this mean will have a stong effect on its expected mean.
15. Labor manhour costs reported in the SDC M113 data base appear to behigh. On the other hand, not all labor cost expended in replacing thecomponent are reflected for that component. Some of its labor costs areassigned to its brackets, nuts, washers, and screws which were lost, damagedor otherwise replaced to secure the component. The validity of this conclusionshould be investigated in Phase II.
16. Nuts, bolts and washers are identified as cost drivers because of asuspected misleading labor practice of spreading the replacemnt manhoursover all parts replaced including these securing parts. The validity ofthis conclusion should be investigated in Phase II.
17. The highest cost drivers are periscopes and telescopes and power traincomponents from engine thru track pads.
18. The subsystem alpha categorization does not correlate well with vehiclepart number within each incident report. The 4-digit FGC code correlatesmuch better.
19. Fuel systems and wheels and track subsystems were significantly lessreliable on depot vehicles as compared to non-depot vehicles.
20. There are dependent failure incidents (parts replaced to get at theindependent failed part) in the B-type records which should only haveindependent failures. And there are independent failure incidents reportedin the C-type records which should only have dependent failures.
21. Approximately 17.5% of the SDC M113 B-records improperly containeddependent failure incidents. Less than 5% of the SDC M113 C-records containedindependent failure records.
22. The SDC M113 data base contained no C2 reocrds. This is in violationof contractual requirements.
23. The SDC M113 data base appears to improve in its reporting proceduresas the data reporting period progressed from start to finish.
24. There were errors in the M113 data base in reporting mismatchednomenclature, NSN and Part Number. The frequency of these errors does notdegrade the usefulness of the data base.
94

25. The Ml13 SDC data base is unscored. The Maintenance Action Code containedwithin is not consistent in its ranking of failure incidents as mission,safety or other types of failure.
26. The M113 SDC data base has a random start and a random finish whenodometer mileage is used as the measure of RAM performance. This factorintroduces a bias in the data except when the underlying distribution istruly exponential. to
* 27. There is a very low correlation between vehicle odometer miles and vehicle*engine meter reading. Within each vehicle, both readings increase
proportionally, but a wide variation is seen between vehicles.
28. The reporting sequence of failure incidents suggests that there aresignificant variations in the way SDC data was collected at some of the 5bases. This conclusion should be verified in Phase II.
29. The M113 SDC data cannot be blocked into an analysis of variance (ANOVA)with valid results due to voids in the data and strong biasing due tounbalanced and/or dependent effects.
30. The lack of record keeping an individual vehicle at the processing depotprecludes any analysis attempt to determine field reliability performanceof depot vehicle components as compared to new (non-depot processed) vehicle
* components.
31. There is no significant difference in the field reliability of depot*vehicles regardless of the year of their depot action. This conclusion is
significant in that it strongly endorses the current I&R practice of depot* processing over the past practice of complete overhaul.
* 32. The effect of the Number of Quarterly Services performed on the M4113FOV under the SDC reporting period has little or no effect on reliability
* performance for both depot and non-depot vehicle.
33. There is large dispersion of both crew and organization manhours used*in performing Q-services. This is unexpected since the Q-service procedure
is standard.
34. The manhours expended on Q-seivice, thus the more thorough it is, thebetter the field reliability performance of depot vehicle. This is a strongrelationship. Surprisingly, this is not true for non-depot vehicles.
35. The M113 FOV can expect on the average to run 95 miles before requiringrepair of an unscheduled failure. (MMBFF reliability measure). This isassuming the vehicles are driven about 1000 miles per year, and isapproximately 5000 miles in age. Any deviation in these mean values willhave a strong influence on this expected mean.
36. There is no significant difference in MMBFF reliability measure fordepot and non-depot vehicles. This applies to vehicle type and base effect.
*Vehicle age has a slight increasing effect that is not statisticallysignificant and a strong increasing period miles effect that is statisticallysignificant.
95

RECOMMENDATIONS
1. The preventive maintenance practices on the Ml13 should be studied todetermine optimum type and quality. A measure of the quality as well asthe quantity of preventive maintenance should be subjected to a non-linearstatistical analysis with a time lag effect.
2. The SDC process of selecting all vehicles at a base location with a largenumber of vehicles should be evaluated. An optimal number of vehicles shouldbe able to be selected to provide good statistically significant results.This may be as low as 10 vehicles in each effect block of interest. Keepingdata on more than this number of vehicles has little or no payoff.
3. The current depot practice of not keeping historical records on individualcomponents on specific vehicles processed through the depot should be reviewed.Potential payoff of being able to evaluate depot practice on field reliabilityperformance is a worthwhile payoff.
4. Detailed guidance should be given and enforced as to the accepted methodof assigning manhour charges to all parts replaced. A disproportionate manhourcharge was assigned to simple parts such as replaced washers and screws.This charge, if realistic, should be assigned to its secured part.
96............-...96~~ ..2
d ~

APPENDIX A
VEHICLE PURGING

Vehicle Purging
Contained within the 408 vehicles recorded in the SDC data base are severalvehicles with very high ?.flBI (Mean Miles Between Incidents) or zero ?OIBF.
* A separate investigation within the data records of each suspect vehiclewas conducted to see if the recorded data (or lack of) can be judged valid.
Vehicle M113A2, C 4441, 5450 miles. Depot, WAM
*Date Remarks
81334 Start miles 1126 at entry into SDC81349 Final drive failure at 1200 miles (No other failures
recorded)82090 Quarterly report showing 1200 miles, 158 engine hours.
*82181 Final Quarterly report showing 6576 miles, 727 Enginehours.
Action taken: Remove this vehicle from data base. Reason: 437 miles and569 accumulated in 90 days. This is considered unrealistic data entry errorruled out because of corresponding increase in engine hour recording.
Vehicle 113AI, MSJ 17717, 2005 miles, non-depot, WAN.
Date Remarks
81334 Start miles 552.0 at entry to SDC82090 First Quarter report at 6040 miles. No failures reported
in 520 miles. This is suspect.82091 First of 32 failures reported at 6040 miles82344 Last of 32 failures reported at 7525 miles82365 End miles 7525
Action taken: Even though the data shows no failures in 520 initial miles(suspect failure incidents were not recorded at start of test). This vehiclewas not deleted. This i~s a common fault in the data and is not peculiarto this vehicle.
Vehicle M113A2, SJ 11223, 1917 miles, depot, WAP
Date Remarks
81334 Start miles 34682113 First of 15 failures reported at 1606 miles. 1260 miles
accumulated in 144 days with no failure incidents recorded.*82342 Last of 15 fialures reported at 2263 miles
82365 End miles 2263
*Action taken: This vehicle was not deleted. (See "Action taken" note on* vehicle MSJ17717 above.
Al
-. ~* ~*tf-t' . . ~ . - . .- * --. -* ** . . .r . . .*. . . .~

i°--
Vehicle M1l3Al, C1124, 1835 miles, depot, WAG
Date Remarks
82005 Start miles 648282048 First of 27 failures at 655882210 713 miles reported in 13 days with no failures82336 Last of 27 failures reported at 8317 miles82365 End miles at 8317.
Action taken: Even though data shows 713 miles accumulated in 13 days, this
action was not deleted.
Vehicle Ml13A1, MSJ 13974, 0 miles, depot, WAG
Date Remarks
82242 Start miles 3482365 End miles at 34. No failures reported
Action taken: Vehicle deleted because it was not used in 123 days ofreporting.
Vehicle M1I3A1, F_2128, 0 miles, depot, WAQ
Date Remarks
81338 Start miles at 97081343 Drive assembly failure at 970 miles. Only failure
reported.82181 End miles 970
Action taken: Vehicle deleted from data base for non-use for 208 days waitingdrive assembly repair. Judged as non-representative of normal field usage.
Vehicle MII3A,, MSJ 14136, 0 miles, depot, WAG
Date Remarks
82286 Start miles 204582300 ?17 Periscope incident at 2045 miles82337 Battery replacement at 2045 miles82365 End miles 2045
Action taken: Vehicle deleted for non-use for 79 days.
A2
V ..

Vehicle MlI3AI, MSJ 21862, 353 miles, non-depot, WAM
Date Remarks
81334 Start miles 302482092 End miles 3377. 353 miles reported in 121 days with
no failure incidents reported.
Action taken: Vehicle deleted. Suspect lack of reporting.
Vehicle MII3AI, MSJ 21877, 288 miles, non-depot, WAM
Date Remarks
81334 Start miles 334582090 End miles 3633. 288 miles reported in 121 days with
no failure incidents reported.
Action taken: Vehicle deleted. Sister vehicle MSJ 21862 above.
Vehicle M113AI, SJ 14152, 15 miles, non-depot, WAH
Date Remarks
82285 Start miles 311282365 End miles 3127. No failures- reported in 80 days and
15 miles of running
Action taken: Vehicle deleted. Judged non-representative of normal field
use.
Vehicle M577A2, PAA1727, 350 miles, non-depot, WAM
Date Remarks
81334 Start miles 787
82090 End miles 1137. No failures reported in 121 days and
350 miles of running.
Action taken: Vehicle deleted. Suspect lack of data reporting.
Vehicle MII3A1, SJ 13083, depot, WAN
Date Remarks
81334 Start miles 141682043 Greased at 1792 miles82192 Greased at 2133 miles82276 Fuel pump at 2257 miles82321 Fuel pump at 2358 miles82365 End miles at 2453
Action taken: Vehicle eliminated. Vehicle went 1037 miles in 396 days andhad two fuel pumps replaced. It is identified as an outlier in statistical
tests. RESID - 4.2
A3
. ... . . . . ."-" *--**-*.-.*-.*.*.*.** .. "- ".. . . . .".

Vehicle M113A2, MSJ 13733, depot, WAP
Date Remarks
81334 Start miles 125382247 Greased at 1960 miles83393 Greased at 2086 miles82298 Greased at 2183 miles82237 Greased at 2882 miles82365 End miles 2912
Action taken: Vehicle eliminated. Vehicle went 1659 miles in 369 days andhad no hardware failures. It is identified as an outlier in statisticaltests. RESID = 7.3
Vehicle M577A2, PAA 01738, non-depot, WAQ
Date Remarks
81327 Start miles 155482012 Retainer replaced at 1554 miles
82103 Pin replaced at 1673 miles82263 Nut replaced at 2139 miles82365 End miles 2308
Action taken: Vehicle eliminated. Vehicle went 754 miles in 403 days andhad no hardware failures. It is identified as an outlier in* statisticaltest. RESID = 4.0
Summary of Actions Taken:
1 vehicle deleted due to suspected erroneous high miles3 vehicles deleted because they were non-runners4 vehicles deleted because they had no failure incidents reported againstthem.3 vehicles deleted because they were statistical outliers.
A4
........ ........ ......... ....... ...........................

APPENDIX B
INCIDENT DEPENDENCY INVESTIGATION

INCIDENT DEPENDENCY INVESTIGATION
The "B Record for Ml13" ABT (Sample output shown as Exhibit Al) compiled
from the M113, 450 character SDC data tape, B1 and B2 records, contains several
groupings of incidents (An incident should be an independent failure/repair)
that occurred on the same reporting date. Exhibit A2 is a tabulation the
number of records that have the same report date and vehicle serial number.
This A2 exhibit shows that only 43% of the incidents reported are single
incidents, that is reported on separate days. The remaining 57% of the
incidents have two or more possibly related parts reported as replaced on
the same reporting date.
Exhibit A2 shows that three blocks of incidents, one block of 33 and
two blocks of 11, were chosen to .investigate. The two 11 blocks are shown
in Exhibit Al. The 33 block is shown in Exhibit A3.
VEHICLES SN REPORT DATE VEHICLE NEW/OVERHAUL NO OF INCIDENTS
Block 1 89 82263 MI06AI New 11
2 85 81343 N106AI New 11
3 165 82095 M577AI New 33
Searching the M113 450 character SDC data tape for all records containing
the incident numbers for each of the two 11 and the one 33 blocks shows that
no Cl or C2 records were reported. Exhibit A4 shows that there were 12,020
Cl records reported, but none for above incident numbers. The Cl and C2
records are for reporting related replacement parts and fluids. Exhibit
A4 also shows that there are no C2 records. That omission is a violation
of contractual requirements.
•l
.. . . .. . . . . . . . . . . . . . . . . . . . . . . . ..7'

Further search f or the 11113 SDC tape shows that there were Cl records
reported for the three Julian dates of interest typical examples of these
are shown in Exhibit A5. They are mostly for fluids with very few parts.
Each part was identified to a figure number (assembly drawing) from 34P
manuals for Series M1113 Vehicles. These tabulations are shown in Exhibits
B, C, and D. Some parts have multiple applications as they are common parts.
* The assumption was made that if any figure number of a common part matched
-~ another part in the block then that application was the actual part replaced.
Parts that appear to be related (34P figure number was repeated) were
* copied from the 34P TM and are shown in Exhibits E and F.
VEHICLES SN SUPPORTING EXHIBITS
Block 1 89 D+ None
2 85 B +El thru E5
3 165 C +Fl thru F5
Review of these exhibits E and F show that they're multiple related
*incidents in vehicle SN 85 and lb5. None were found for vehicle SN 89.
* Vehicle 89 has a later Julian date than the other two blocks thus indicating
a possible learning curve in the reporting procedure. This poses a problem
in the data in that it loses consistency. This will impose a further bias
* to any analysis.
Exhibits E show that 9 of the 11 incidents from Block 2 could be related
*to one to three failures. Exhibits F show that similar relationship exist.
-Exhibits E show that 17 clock hours and 34 labor manhours were expended
in repair of these 11 incidents. This appears to be excessive.
B2

- - A -- - .,
. .FE.,GRB F4"r% hU13t 450 CrIARACTER TAPE*
A =, A I C : N T I AC I ... .. '" . .. C NI A - -.
A. '... ,Aj .A Q : ' -
!t-o !ZI7.. A. . . ..AAAA.. ... f8l- . ;,-! 2 -A.. .. . .-. - - - -
* .-- " * .' -. *-
* . I..- . --. - -C -r ",' . .. ..', .., .- ' ' , . St* -. '.,= .. -" . , - - 0: ,-: ' :5 . .
A-".-2 " A- .- . ... .*.-E 2 :
? - "- ,: ,.. Z E , " _-:
* -_. All I A.~-
-I Z
-A] '. - Ar . °' A; - > ,: F " .. . . . .... ... .. .... .A-
A~.kA... . . . ....AI A :.A# . . .A,±, : ,, : ... . ? . .: = ' . : . _ -
.. . " A.'AAAA "A : '.C 2 .. ... . ... j .. .... - -A . .- .. . . ... . ..- •
C ;-,-.?.. 2 , '.,''- - .4-,- 2 -'-, A .. . -o . , , , ",i. , .,= -v; . .. ' . : .. - -. . 5
,-A,-. . _ :. . -r,-- , .::t- ,, 8 .-~ A --.- .. _ . - A
.. .. -"- -. . . .. . .. A...... .A. . A -.. .. .
-7
",3 -' -.. . . .. . . . . .. . ...... . - ....
fA IA-2AAAAA-: -4 - .;A ,; ' - P>. A. At :--A" - .' - . . . .A . . .. . ;IA' C.. ... A A . . ..A...A. .A
", . . -2 2 A . *AA>- ' 7 ,A-.,J A ..,AA. A-AAJA_- - ..' • -- - -.. --- . ... . ....
-, ; ,, . . . . . .>.A, , ., ,, . A: . ), . . , ., . ... , -A. - ." , -U "
""A" . .. "-A- .. ." ...... 7 TAA.AAS.AAA .AA A "AA ... . ....' - - --- A ... -
-. • .~- - - - - -2 - A A . .....
-:2.. . . .. . J. 2 . . . . . . .= :._ = .. . . . .:. .. . . - "AA -A A A A -. A: . - - • -.
-. ~~"' E7A) LA T ' t TC .1AA.AA AAZAA Z.A--3
... -. AA- .3 2 '.A .. A ,f-". A'". . ." -E ": ... A-A ,r~ -.' ,. . .. , , . 2 A :A , '. - _ " - "T :,- . . ' - "-
- ~ ~~~ -- -. -~.A - L)
-,C A. A ,-. AA . . . AA--AA A *A;4;'A-A; ', , ' AA ",.... " .A-AA,AA,. " A-. 7A..' A.,,
.... '7 S. 2 Z S C 2 - C: : ,3 C , : :: 1 ,: 2 : C .- C1 ._1 j.".
4A ." ;. : .. .. . f l A ': ': AAA, : A 'A AA,, 7A A . ... . . -.. . ...A' --
, A-"C AA:A' - AA.-. . A.. . -" AA YAA.A A A.A -A A •-A:::: .... AA OA. .....A'A . ...~ A -AV A.'. Wi" ' : : ] g 2 : : : ' , - - . . . . .
- .. . . "":: r-. .. . ... A"1 0 ,_.tJ ' , A -.,fl :. 2.- 5?.... ."" . '7-- . A . . .
.. ..A A .. . . .... .. .. - ' -L S : "' . - ..- ' ' - 2 " - I " :2 : .
" "HF 08 5 813 "._43 P4003., -1 CLAMP' LOOP S'340 - O " - '.s: -''" ....... rA'f
..... 834 , 402 R C:E,.NL _o4 .c r r: o-.s_", .,'"P' ; 81343'- r4005,TUBE BEL''L NT ALUMINUM4? "0-'C A? .... = 1:4,121
-'- 6 1 $E -1- .:- .. . . ... , . .. . .. . ... . .
17 .. ].A A'A A A AAA.7 .A A A A A' . . . .A.A
A- A A H *E: A * A A A4 A R4AAAA-%A L AAAMP, F *-5 -" ., A .% "A. ...-,.-A. A¢ 5 A8 4 -40032 * AACETANGL 0- 0A3-'- *A,, ..AA.-
C..
- .- ,-..-.--..-,m - '7.., 2 -'
v .; ,-',..--.,'--,.'-. ..- ,'v v ...-'..'-:, :.:,: .,.,'.. " v ..-',.,-'..'v -.....-.--. , - ..:',x > , ."--'., .'-...':. --.,. ',Z
- .' -J I-. _ I IJ 'J ) I ' " ' _+. " ' ..l lJ ~ . .l l '_ _ I '. " I ] ' - " . " 41 i , . +r E E • . . - . I I

A.'ca
00
-4-
.d
Cu
co m (-
LM)
Cun
- 0- 4- 4 - 4- ,4 ' nc - "c
4L)
4b4 R4 t4 t 4k 4k4)i t4hq k 1

Cz .J 1
I~~~ I i :1TC
-7 C7*,
f I *nF I.. I * 3
-~~7 CH_ 7c- .-Z,' c~ rl
r- c . r l : IVC
Ff 1 IT
- --- B51

9'
0 1- r r, el) m° , ° o
el r- t - r, 4 1
- -4 - -4I
00000000000
H H- -- HHHHE- --
00000000000
wwwwwwwwwww
000000000--000000000000000000000000000000000 ."."
".

,'E' QAC f: 1. 1. 0 .P ( 20 ( ,
'IL FNbI15O-0O-186-6681 M. LL21 1.2
GIL: 91S0-rO-l.89-.:.7 ', . .. :'if.' ,"M S 1272 6060c ! .:13 3.!l: " 1I :'.i '
C~ ~ ~ L C )
tiSJ 12722;:06CC 1 'H
RII.T 9 150. C---1. 0 -...*' '1 -
S-: 72 :., 6 C C I.R I Z4l3-,
* EAI IS- T&22-" -:' ...... '.." .
IJ , N -. I
RS 1- T -
C 716
.,irL: , r "": 5 -0:-1 L ,. . .'.,..-1. ," , r; L ..1"O.:hi
1I. " r ,.,J,-1SS,- '
1 - 1 S L Lil, i1
H E, ,0I I " ... .. "' - ",.. nh. .'~ -"
h*..J 1.-, ,,FC '131 4 ii1 113 .4 -.
1 C3 i ICC, 1
I F. 1 C11 L3L.03 14- , ,c. j, 68:7
* J Fif, .. :1 .." .-"." : ." :.i.. .. .:z,: ..," 508.3E . :4,'"-
j: ,r r 1 f) 0" 3 '0.-1
p'i1 J i .b'_" : : ' SOS .l : -, *.. ']4" "3 . ;s : : ,",, 1 I3 2 ;. . ;
[A L U 27 '2
I-:_8 :F:: . ^' ' .. I .1.s ?7 .1 1 -I'.
B7
. .- "- . .- ; -..... H. . . . . . . . .

M1O6A1 SN 085 NEW
DATE 81343
INCID NAME NSN PN FIG ITEM CLCK T-HRS
R40020 HOSE 2590-999-2384 10942651 6 16 1.5 3.0
R40021 FILTER 2910-884-1207 5575009* 1.5 3.0
*SHOULD BE 5575824
R40025 CLAMP* 5340-782-1804 11589145 60 09 .5 1.0
*BRACK SHOULD BE
R40026 CLAMP 5340-598-8062 MS21919C4 7 02 .5 1.0
17 19
R40027 HOSE* 4730-800-2828 10865913 6 17 2.5 2.5
*COUPL SHOULD BE 124 01
235 01
238 05
239 02
241 14
*R40028 RECEP 2590-930-2054 10950251 33 27 2.0 4.0
R40029 SWITCH 5930-771-8119 10874979 6 02 1.5 3.0
R40030 CONTRL 2590-679-9168 10861660* 17 11 3.0 6.0
SHOULD BE 10861660-1
*R40031 CLAMP 5340-664-2369 MS21919DG26 60 8 1.5 3.0
*R40032 BRACK 5340-133-9732 10932821 17 2 1.0 4.0
R40054 TUBE 4710-999-2358 10943121 23 32 .5 1.0
TOTAL 17.0 34.0
TABLE 1 VEHICLE M1O6A1, VEHICLE NO 089, REPORT DATE 81343
* ~. ... ::.~::.:.::.:.x~..>*::-.--B8

M577A1 NEW SN 165
INCID NO NAME NSN PN FIG ITEM
R20037 HARNESS WIRE 2590-930-2332 11589191 76 01R20038 RUB STRIP 9320-143-7051 10942565 162 34R20039 RUB STRIP 9320-143-7051 10942565 162 34R20040 GASKET 5330-199-5884 MS35769-31 239 05R20041 BRACKET 2940-411-5794 11633210 240 06R20041 BRACKET 2940-411-5794 11633210 3 06R20042 STRAP TIEDWN 5975-473-5595 8763398 62 04
66 2568 3269 16
R20043 GASKET 5330-543-7160 7962267 44 03R20045 SWITCH THERMO 5930-688-9881 7771274-2 50 02R20046 HEADLIGHT 6220-678-9046 MS51318-1 49 01R20047 LIGHT MARKER 6220-670-7692 MS51303-2 47 01R20048 LENS 6220-557-8229 7962266 44 04R20049 BUMPER RUB 5340-779-4573 10886357 54 28
55 08R20050 IGN UNIT 2990-770-1641 7062198* NO LISTINGR20051 LENS, LIGHT 6220-741-2769 8327366 49 17R20052 KIT PARTS 2930-711-9362 5702866 25 KITR20053 AIR BOX 2990-890-0697 5134825* NO LISTINGR20054 CLIP RET 5340-857-1424 8763397 69 21
INCLUDED IN 7 OTHER FIGURES
R20055 CLAMP LOOP 5340-922-6301 MS21333-79 4 11R20056 CRADLE 2590-962-8332 8763393 59 1
62 1/5
66 2468 31
69 17R20057 CRADLE 2590-162-8333 8763391 69 22
INCLUDED IN 8 OTHER FIGURES 18
171022
260204
26R20058 SCREW MACH 5305-984-6210 MS35206263
INCLUDED IN 26 OTHER FIGURES
B9
........................................................................ ............ . . .

INCID NO NAME NSN PN FIG ITEM
R20059 CYL HYD 2590-446-2487 7532461 233 01R20060 BUSHING ADAPT 4730-800-4648 10874812 236 04
240 05R20061 HARNESS WIRE 2590-930-2332 11589191 76 01R20062 BREATHER ASSY 4720-019-1324 8376371 232 06
236 03
240 04245 02
R20063 INSERT REC 2815-057-1582 5135721R20064 BUMPER RUB 5340-913-3359 10886471 134 19
188 20R20065 CUSHION 5330-401-5232 10886778 162 35R20066 RUBBER STRIP 9320-143-7051 10942565 162 34R20067 SEAL RUBBER 5330-937-2230 10886779 162 35R20068 WASHER FLAT 5310-877-5972 10910174-3 3 11
4 0698 02
101 01
103 13235 15244 32
R20069 CLIP RET 5340-857-1424 8763397 62 0266 0567 0568 0569 21
74 0593 02
299 02 . -
R20070 STRAP WEBBING 5340-543-3477 8690468 176 08181 10182 13185 04186 11190 11192 01
B10
- .-#/ L.. . . . . . . . . . . . . . . . . . . . . . . . .

V- .
M1O6A1 NEWVEHICLE NO. 089, DATE 82263
INCID NAME NSN PN FIG ITEM CLCK T-HRS
S40039 COVER 5935-773-1428 7731428 76 11 1.0 1.0S40041 BUMPER 5340-209-9281 8341563 142 08 .5 .5
143 06151 13154 09160 05
S40042 PULLEY 3020-679-9189 8756915 231 08 1.0 2.0
232 12S40044 SWITCH 5930-841-1506 7748750 97 15 1.0 1.0S40045 NUT 5975-771-6634 7716634 63 27 1.5 3.0
64 0678 1478.1 0379 07
S40046 PLATE 2920-109-4309 11633594 28 03 1.0 2.0S40047 BOX 2590-134-0822 10886040 56 02 1.0 3.0S40048 WASHER 5310-809-8536 MS27183-24 1 07 4.0 8.0
105 05S40049 BELT 3030-833-1336 MS51066P54 27 08 1.5 1.5
SHOULD BE 5106652-2S40050 SHOCK 2540-714-6156 10875328 127 01 3.0 6.0S40051 SHOCK 2540-714-6156 10875328 127 01 2.0 4.0
Exhibit DVehicle M1O6A1, Vehicle No. 089, Report Date 82263
B11
"i" -0

TM 9-2300--257-34P
114262
27 2
Rq0OZI1,/4~.
r:.%
a R'1021%2/A
2;
229
B12

TM 9-2300-257-34 P
in)
IK
% .
0,-' ' , /
'4 \ I -i
,e e . -
Is :.'", ", .:
-- ,,\ ,--.
I'-' *- .- . .... ra
• "- B13
./ -- -..
o 238%'-
Wdodo~I-I / '.-9
.-. ......... ..... . .. ., .. .. ., .... ,-. ' .. . . .; . . ... ... . . , -
_~~~~~....................._.... .._........................... , .... '.l.... "....

TM 9-2300-257-34P
Cq.a~ ZS&I
Aim&,,,~ ~ezi,
- -. ~~2:4W
\ %1,12A,
/ct
/
11 C3Vy/
/ u
Chn*/ 4
B14
EX14161T

TM 9-2300-257-34P
4 .. ,3l
li
Ihng , 5.B1
F~g-- E

TM 9-2300-257-34P
2 4~
- -j
13
7 7
15 <
~ 2
*2 7 C " 'a18 8
B 16

TM 9-2300-2S7-34P
00A ly (0
3*4I
50A
- A~eTA 012910
Fiqirc 4f.-Buckist eadlght
IIL'A N 6
id. 1.~ -
~17
TA 0467231
Figurr hh .- Serore hcadlhqht. I
264 Change 3B7
4~ki -4IIITF

- !~
__ \ • /. w # \\.d-/ " . . -
1__4 ....... \ 'X J °"
'-N...-', ... '" "',,,
" ./, --fk, ','--X C, ',-:;0 .0- X, . '(*: - .)' "
-t . , _ - ', ' ' ,,2 , ' ""
" ~ ~~~~"', __ ,f 'z': 'X, ,',",
® '- _ - .N'%. . /,,--;... .. :
.*, "// .v,, ,a
~N , , - , ,,N• '.~ i -,, ,,, :.-':_ _ _ " ~ "* - "- - " A '/ "" " "
N.. 'N".,,..
x~'~-~~ = NNS 'Ns *'
.*j7,t ? l ,r/',,• ,* .' ;.T, I"" .,. ;"' :. " . .; . ',4t.'.!: ;:': ',.".'..,, .:; % :', :. : ' "I I , / . ;.,,.t-.-. . ,
...... .. .;"""'' "" ' ' '" : '" ' ; '; :"' ;;',' ' :;;,', -N :,.. /.,2- *, . ./
)) .' • -. ° .° .. '. % % °% °. °. -.. / /, . "N'.-"- -'-"--''- " '- ', -,"--- .. ,,'.., , ,'-... -" v .. . . .. .. .... ... .... . ============== ,?.-' '.3 ::..,' . ..'...,.., :'-' .'" "- '. "" '" "'v,:-'_.,,-,. ..., ...... _",,

TM 9-2300-257-34P
k. -"
4m L
to
29 Ch ng 2 1
I q

- " - II
- --/I,-, , :, ' ": : '! ' , .\ \
--- _ i .* .. / / . , \ \ "-, * \. > = .
:: ' .' - _ / . \ ,\ ;
l , .. \, .. / --- // ;, .,
I-:" r.\ , ' ' j
::. :i'" '.. , ':
I;' , '",,lI,378 Change 2
-- m, t

TM 9 2300..2SY-34P 0
FIC e5? 611D.r ICY'LiWOPA
1 ~ 3- f6 3 1~ ,''.
-n6-J '*- 7EA5 4
IZ I
6~6
17 i
20 21
9/ ~ v TA 01 712
Figtiri 235. Ramp hy-idraulic lines and fittings (except M741 I.
0
7
4. 451
~7fl12'I P B21
.KV%**
%-S

APPENDIX C
COST DRIVERS

92 1*4 04n40 N np 01 " I n. o o IN# N n 0 0, 0 4w (40UNN C. r i o. V) N o n CNO.If'o cP1.
C-0 VN *NeIn11 0 MMO.4 V.In co460 N n0 4 WN I 6 c n F . c N a 0 n~41 r r) qCN 0 C'o In N
qC n N_ 040e'In W) vw V n (4ed 4.44.4444.
N b41,P 40Nm11). r, 4 n n INMIO~ NI e In 'CN. O nM c NM 4 n 4 V 0 P , p , i 4i P1 o4 N4 M -4 r)inob CO o NII41,0r 40 b).a.tPN4w v N N- 0. 4 9 90 nN t .00 p n N C
0nNW400 P 4"N1;9 'GOIMOC-'C0 'C VOMN0'IN 40 - nd cpwInC a0a0tnm0 m0 oO' o. In v oo
0. N N o IN00n N co n 1N w pq N . G 4- --- 0. ' -( n g ,o- I nP)0C 000 n C. d oc 10 D4InU~ M......
o0 0 060000 0OC0 C400 0 10 0 0 .. 0 G- 0 b") 0 0 - 0 0 4 - In '0 0 0 0 M1 0 0 CD 0 N 0 0 0 NO0 0 N 0 0 0 in 0
N N 4 0 P) w ao a.0 m1 In w * I N 6 In ' IN 'C IN 0InN 0 0 .4 n In 00- 0- IM 0 w 1). 4 . 0 0 Inl - - tnS in.4 wv n o . in MM MM Inv N .N N - -.MN r, -n ' ON N N .. m m N
a1 '0 4 N.. IN N4 -4. w 4 .
00000000000000000000000000coo000000000 CCO00000000000000
5o ~~~~~~~~~~0 000000000000000000000 00 0 00 0 0............... .;z...................... ................................................................................................
-0 0 '4 OW4- In) ' n- - 0V 'NI. N4
*~ '0 4 oIN I Ii cc. 6 0.4MzN4ONz ; N4M 10Inq.0 Z 0'06N e'NIn060N'Inn4..0 4Oz 'COONOV
0NN .I0. a 0 CN 0 0 a .0 WN -0N.4N N N ma. VW04N. 'M M IN0.N
C.! N? N N . . NW N . .- . .4 . .. !. -. L?9 III . -!r*0 n WC.qMO 0 Nw - m 0 In &.W 0N . N' N6M1IM0I0 WN 0,0 N 0OM6O- 0NN 0ON.4MIN 0 W OMOOONO&
'o w M..4C '1 M c1.4' NNN IN V N 0 0 MN N 0. QM INNM n ofb) ON 'C~N4NOn -0'In .00 nN N. N I n% In .9. 4.i. m1 N .- -
0 YN t 0 .40 . IIINN.4W'MIn In N M.4MN, w 0 . 0 nNM O00 W 0 0' aONNPO0tn -W0. P In - " M N - 4 P In in N
NO. In00q '. **I.6N w. M N ' M n~nCC NP. '0N O-W MN tn. N...r' n
z a , ura mbU~ L) 0 w 0 0 j j. W 6.IaW 2 m 40L
4L InlS in La >. - U q. - M be I 0W 0.. 4 gu z- w D
0j zz o "'C0_ j W0 -Z zug - Xn e 4 N L) 0 .14.W ~ w c jIu P1c- Ciac ~ zwj c; WW :;c wx x: .c 0C z I, -A
E- 0 a0axcOnIO 4n c0e'16 N'C4 x w~w wa m .4. In _jP1 m'e0 x O0' IN I
L) In W = a 4 0 -. 4 a .4 44 u6. z4 N m444 4 c 1- 0 --La U -0- aI- ._I I C -4 4 xn n In In 4.
zLL N9M !LjInz0c11 1 I P_ i a I.- W 0 1- u w Ii w W I a m I 0 w )d U I iI -i I im II P I~ I I- I I W
O004NN0000 000 000 0 o 0- 00 0 0 0 0 0 ! M 0000 00 000N N Ieo Noo ~ o0 Ncv.-o, NIN0 0 0, 0 00w0 0 0 00Mo 0 0 0 ' Cow0NM N00 0 0000 C00 I0 WOM 00 N O InOMVr O~0 0 o
a .: .0 11 .in* 0 ^ N V ) N " 0 n tn C . oV N C 1

4 5 d; N N .) 41..N a V-c N'O* . Z0 P, w 0 on NO 4 a MO n N *. r, pq a'a in 40 " V ca 4wvin to.4 I z .6 400*1 ") 4- N 4 ,a0. N 14 InNS S W ton MN N 0. 0 N 0. 0. NM co i N NOi
in* qinc CIASNWIN 4 MM 0 C4 4 .4 WIN 04 .4 N 4 c C N -UM.I -O W - In - -- --
NI P I 0 W II W 0 0 MM * N N . U N 4N W MO4 444I.4C :?zmC.inW ; 0 N;0 ;0-1 ' j b0W r N I--J N K W 4 N N M4 N n N -0 M N I - *-. N0 'd ' 40 -l M -O
o0 N 0 0 4 V 0 fn 0 0 N Co cc 0 in 04 0 0 ) 00 0 I o m N Ve 0 4N 4 N 0 0 Iin 0N
400 400 0 0 MC01000O00n00In 4.GNV;O00 0 N
V) in Nt4 V . 0 N N4 4in ; 04ON4 0 N; ;,Z, z S 0; 0 N; 0; N 0 P n N;W 0. N; N S 4 a;C4 b;a-4w)4M44S a4Ow4 N iNS 0 -0 v4 qr .. n .44 N N4
E- U NW00 NS0p) NeDIN P.) 0 W M4 4 NM W N 0n N..n N
40. 0 "wo S 04- N N Nn on V) - 0 I 40 a V 46.4" -O. N 0mo F) Colo0".0 0 41 4VC0. n S.U M44 4V4 V N. 0 NOI . N W N
U.IfLQ 00000 000000 O 00000000 0000 woo0000 000-00000CC
cn,"0000*Ono00000040'a0000*000000 _00,000000
Q! In a0! MS InS S !. In NO N 0. 1? -: 0. Ml 0: 00 1 MN C44 0in in in in In w 0
CO. V-VU- 1-V 0. a- 4 10 10- t 4.o-0 C40 N N " 0 0 &. - 04O M) 0. * M 044 N 10o.
0 0 0, V C 44400-WN 0 SN 4 - .n 0 4 .0 .4 4 vN40
4jJF0
Woo= 4No Y
0n
. 4 Nm VN .4-.0I 0 0 00W 0 o. *0400.
.4N N4 Na ) 4 I
Qi - ~ m . 0.oNW0 ~w ~iN4 wxx jN 4 .. 0 z 4 . w P 0 ) N .- w Z
(AF U ) 0 C4 -: z ( ja(W W0 . W_ -4 In U 0 (nS-.I- Q4 WC 464 0 af..
WI A.Z 1U -W clw !- 0 -WM I-.ZO 0 W z)-Ic ;- 0 aW;Z- .f W u 9 i-U ! wO0 Z4w X': uI a c.J0.CL ;n wzj~lfO~l~ 0 0 = w to _j z0-U) .0 WU 00
I O. 6 4 2w -O. 1 w L- ( 1 ) 1 I . ~ J db (Df l~~~ zOfI.f (a J5 14-. OZ W (n.IIX. 70XJSW~ O4 z cc~
-~ UJ~Z ZZ - 0~ 2w oW40 OEZZIA. Mij zJ
UZ
Nj N
O N4 .4N N inFVaN N A a"o 0. II 0 NOI 0. .0 T.7"
M 4Z. 0.)4 Co 0. .- 4V0 N0. 0 N4 0e MI . N 0 0400.M .N0. 54045 4 4"N4In O00400.N0.N40.0f.. S WIS0 N 0N S4NM 000M,(.40.4 0 4.. O M Mng..4
0N M0. O0. 0 N V MU 0 0 0. 4M 2 .WM0 I0 - N M 10 o. Co.MV 040 nM
a ~ lN O4 N44 ON W.54101.N...N Lf.AN N 0L

a.U.~ 0.~. r. III -4 'a 0 in N w N Io 0 43.' oN - 0 .c DMNN-I n 000 0. lq
0~- a. 0. @ 0 w mIW N N 0- 0-, 0 @ , w w~ w0wv@ @ww
-1 wM t * 44 ZW (4- O W Z (-JZ'4= 0 - Zc W 00 ' z Itw = W04 W.9 _j~W C6~9- Z CC- 0 1. 0. _j W- Uw tA2w4wo-Lm I -- aw o 0uC 1~a..c 0 Z~ hW. cnJ DI w .j won 00 to 0Uli
1* w :c Lzaw a (flW 0 u a')-- 0 1.meiC z n.J = o( a 0 c . Lji0 u l 0 w w a W C.C wW 0 C 0 9E jW CWWQW..Z= =.z U w4 c Q eu I.- _j Q
qw 0c 4wxcflxzw=LwZuxc0..Z N)'Ifl.jz-w- .~ oxZxu z xz zw Zt W aX< w w u m~ w 0 W ZU O 0 IL9 W~(WW La z w u ; lwwwu9-. _- W O-wuwz- =UW wo" It.J9I...-ww09n -00wGet- Zi M.-gA m - .4MC0U w - X U) I.-Zx 04 X ui .- c a
=an CO0O 49 L) C - Z .. ~ a n I w .9 . 1 Lu I- " j0 _j.-.le0 4Z (1~0LU 6I (* 14j9n C)~9 z 0 le 4C...a M 44Z -w a w 0. 9-*
w 0: cz -94.-9 -Z4x ;-u w" w = .-- Qwd. -W wZzdL CLw -Z-9-a aa wn Clcw-jwfl.JU 0 c w wz w IWZIA w tofUW~l ou0(n W.Jum U- IL :b. WWZr-)JIL CA
w 4ZOxw344
W ZU =-= 4U-4p"Z i3WU-4LZU0AWW0 J...ZW4..ZawWLawza
N cmN -9 In N ~ 0
0q -,L ' - - W 4 1 N N CD N 0 o-0 01 O 9000.0 cl.VO 10 IL I q, VIC 1 b, 0 IO
4t 2 r)N I I lN rll InI10 NO 0 1 N 0
-. 1. WOt~ 11 -- N- C
~c jUn0 NOOMOM.9.40Lo0(flOO. coWN-NO.0. NA 00.0 motee" o NO . 0N 0 _jC0 cc r. N -W Z Z Z Z N W" Zx.4 zze=. w. Wtocx w
~ 0
a. N 0
) 01 19 1 1 1 9 11 I fIt I1I9I I I t tie I111191119 fI I I9 1 9 9 1 I 9~ 0
zI 000000@0@0000O0@O0000@00eeOoe0Oe 0
zi L, , o-q, n W N 0) N. F OrIM 0- n VP4N I I In0 C- .r r n I 0.N * 0N o. * M40&. q v m 0 v I
WI~~~~~~~~~~fl~~~~. n .4~W@ V . I S .Wtl ~ I [email protected] I W
*Z z
* zzzzzzzzzzzzzzzzzzzzzzzz zzzzzzzzzzzzzzzzzzzzzzzzzzzzzzzzz z

I I, I~. . . S S17S
u )uuuuuL iuL
u cNc ja W aI-P
W U le 0
W
WW.0 4 Wc -C Ujo 4 .W -..'0 Q .. Jn . W .J 0 W Z Z
6 0Cie- ._, 0 0, l .4 Zf W V) .. t J 0 0 CZ -UJWW 4a = 5Z4.. W 00 3: = I. (- Oo a i- x hW -X 4jW I 2
a: : w c ozzcuww 02U . . U, ,- WoW;4,.~.u WO w Cz 4 cc c 4- Jwop.-0 0 m .-W..s oW W (11
Z I. P- :; = c NI...
0z P04 Nm C3 Am uI =O.j 4 W WN d uS4 M 1 M N0 x S N. cN ~ .04 N
MVI M NNO.VIMO UNM, NIO S . N I N O co O... . V 'a SNM'0.4V44S 4 -NM VIVSV N4O0.40V N770A INMVIO
~~~~~~~~C~~~~~~~ N in a- N4M @0S VI4 0 -0 4' M~ NIO ~VM4N 50WN G.M ~N.NN.4 '0OSMV.41IMNOS4.IS'N4. 4N 4 40'N0M.0. In0
-0 inM .0. VN V 5 P 5 M r M:! -0 4 0. 1N4 N. C4 N ..O
f I~l I III III It I111 II I11 II 1 11 IIIt0. *1OMS. C.O0. N Mw0.I0 0 0 N 0 0 nN 0 0W 0 .o. M . M 0 0N M S IM 4N WM..M 0NMzO0M 0 a a . ""0.4.WN .0 - 1 0n nN aN
Q 4C.V0 4 0 0 &N 4 0M o,0. a 00 *1 MN WON MN0,MNO COO. 0.N
0000000000000O0000000000@0000000000000 @000On 4 0~oooo 0 0 0 000 0 0 )0 0a0 00 0 000 0VIOOO40 0 VIZI 0 NMq -N P1 in 0. N 4. N N N N m in M n V MN4 VMq.N Nt0W N M)M . 0 W)W NM e40 to 0V
2 ZZZZZZZ*ZZZZZZZZZZ2Z zzzzzzzZzzzzz
................................................................................................................

DISTRIBUTION LIST
3 Commander 1 CommanderUS Army Tank-Automotive Command US Army Electronics R&D CommandATTN: AMSTA-M ATTN: AMDEL-PO-SAWarren, MI 48090 Ft. Monmouth, NJ 07703
I Commander 1 CommanderUS Army Tank-Automotive Command US Army Belvoir R&D CenterATTN: DRCPM-M113 ATTN: STRBE-HAWarren, MI 48090 Ft. Belvoir, VA 22060
1 Commander 1 CommanderUS Army Tank-Automotive Command US Army Missile CommandATTN: DRCPM-M60 ATTN: AMSMI-DSWarren, MI 48090 Redstone Arsenal, AL 35898
2 Commander 1 CommanderUS Army Tank-Automotive Command US Army Natick R&D CenterATTN: AMSTA-TSL ATTN: STRNC-OWarren, MI 48090 Natick, MA 01760
1 Commander 1 CommanderUS Army Armament R&D Center US Army Test & Evaluation CommandATTN: AMSMC-RAA ATTN: AMSTE-AD-SDover, NJ 07801 Aberdeen Proving Ground, MD 21005
I Commander 1 CommanderUS Army Armament Command US Army Troop Support CommandATTN: AMSMC-SA ATTN: AMSTS-BRock Island, IL 61229 4300 Goodfellow Blvd
St. Louis, MO 631201 Commander
US Army Aviation Command 1 CommanderATTN: AMDAV-BA US Army Materiel Systems Analysis4300 Goodfellow Blvd ActivitySt. Louis, MO 63120 ATTN: AMXSY-RV
Aberdeen Proving Ground, MD 210051 Commander
US Army Communications Electronics 1 ChiefCommand Defense Logistics Studies Information
ATTN: AMSEL-POD-SA ExchangeFt. Monmouth, NJ 07703 US Army Logistics Maragement Center
ATTN: AMXMC-D. 1 Commander Ft. Lee, VA 23801
US Army Depot Systems CommandATTN: AMSDS-X 2 CommanderLetterkenny Army Depot Defense Technical Information CenterChambersburg, PA 17201 ATTN% DDC-TC
Cameron StationAlexandria, VA 22314
".,%.., -... ..... ... .......... .......... , , ..... •.... °,.... ..... ,°.,•.°... --

FILMED
2-85
DTIC