oxytocin enhances signal to-noise in hippocampal …pv669fb3838/owen thesis... · oxytocin enhances...
TRANSCRIPT
OXYTOCIN ENHANCES SIGNAL-TO-NOISE IN HIPPOCAMPAL
FEED-FORWARD TRANSMISSION BY SELECTIVE ACTION ON
TARGETED INTERNEURON SUBTYPES
A DISSERTATION SUBMITTED TO THE DEPARTMENT OF
MOLECULAR AND CELLULAR PHYSIOLOGY AND THE COMMITTEE ON GRADUATE STUDIES
OF STANFORD UNIVERSITY IN PARTIAL FULFILLMENT OF THE REQUIREMENTS
FOR THE DEGREE OF DOCTOR OF PHILOSOPHY
SCOTT FRASER OWEN MARCH 2012
This dissertation is online at: http://purl.stanford.edu/pv669fb3838
© 2012 by Scott Fraser Owen. All Rights Reserved.
Re-distributed by Stanford University under license with the author.
ii

I certify that I have read this dissertation and that, in my opinion, it is fully adequatein scope and quality as a dissertation for the degree of Doctor of Philosophy.
Richard Tsien, Primary Adviser
I certify that I have read this dissertation and that, in my opinion, it is fully adequatein scope and quality as a dissertation for the degree of Doctor of Philosophy.
Karl Deisseroth
I certify that I have read this dissertation and that, in my opinion, it is fully adequatein scope and quality as a dissertation for the degree of Doctor of Philosophy.
John Huguenard
I certify that I have read this dissertation and that, in my opinion, it is fully adequatein scope and quality as a dissertation for the degree of Doctor of Philosophy.
Vernon Madison
Approved for the Stanford University Committee on Graduate Studies.
Patricia J. Gumport, Vice Provost Graduate Education
This signature page was generated electronically upon submission of this dissertation in electronic format. An original signed hard copy of the signature page is on file inUniversity Archives.
iii

iv
ABSTRACT
Neural circuits throughout the brain are under the continuous influence of
neuromodulators which shape network activity in accordance with behavioral context.
Oxytocin is a key neuromodulator that has been linked to social memory and maternal
behavior in animals, as well as to autism spectrum disorders, trust, emotion
recognition and parenting in humans. Here we show that activation of oxytocin
receptors sharpens the responses of the hippocampal circuit, increasing the signal of
spike transmission through the network while simultaneously suppressing the noise of
background spontaneous activity. Both of these actions are mediated through a
depolarization of the fast-spiking interneurons. The resulting increase in inhibitory
tone serves to silence spontaneous activity in the CA1 pyramidal cells, while a use-
dependent depression of the inhibitory synapses permits enhanced feed-forward spike
transmission. Furthermore, we show that oxytocin potently modulates spontaneous
hippocampal Sharp-Wave Ripple oscillations in a slice preparation. These results
elucidate the action of oxytocin in the hippocampus, while simultaneously shedding
light on a novel mechanism by which modulation of fast-spiking interneurons can
modify hippocampal circuit activity.

v
ACKNOWLEDGMENTS
My experience at Stanford has been one of the richest and most fulfilling of my life. I
am exceptionally grateful to the community here and to the many lifelong friends,
colleagues and mentors who have been invaluable to my personal and professional
development.
Dick Tsien, my thesis advisor, mentor, teacher and colleague has been the ideal role
model, a steadfast supporter and a loyal friend throughout my time at Stanford. I will
sorely miss the regular opportunities to talk science with Dick. His insight, knowledge,
incisiveness, passion, enthusiasm and disciplined thinking are inspiring and each of
our meetings left me with a compelling drive to work ever harder. He is a fearless
leader and phenomenally loyal to the members of his lab. While always setting the
curve as the hardest working member of the team, he nevertheless invariably reminds
us of the fun of doing science, even at the most stressful of times.
I could not imagine a better environment than the Tsien lab for my graduate training. I
feel privileged to have worked with more exceptional colleagues during my time in the
lab than I could name here. I would be remiss, however, not to single out Yulong Li
for the generosity, enthusiasm, breadth of knowledge, and relentless questioning that
he would offer most evenings after a long day of experiments. His tireless interest and
endless font of ideas had a tremendous impact on my graduate training and on my
thesis. I am grateful to Patrick Bader, Damian Wheeler, Rachel Groth, Huan Ma,
Curtis Barrett, Mike Tadross, Ananya Mitra and Parsa Safa for energizing, educational
and fruitful collaborations. I thank Susan Harnisch for keeping us organized and in

vi
good spirits, and John Emery, Allan Borrayo, Madhubanti Neogi, Claudia Rivetta and
Miquell Miller for excellent technical support. Damon Poburko and Henry Lam, my
baymates and partners in crime, have both been a fantastic source of support, good
humor and technical know-how.
The Molecular and Cellular Physiology Department has been more of a family than a
workplace during my time here. I thank the Program Director, Dan Madison, for
creating a flexible and fulfilling physiology curriculum, and fostering a unique blend
of irreverence and academic rigor. My thesis committee: Liqun Luo, John Huguenard,
Karl Deisseroth, and Dan Madison, as well as Shaul Hestrin who served as Chair, have
been tremendously generous with their time, ideas and expertise. From the
departmental retreats, to the Science Fridays, to the innumerable less formal
interactions in the hallways of Beckman, I am very grateful for all of my other friends
and colleagues in the MCP Department, in paticular the Smith, Lewis, Goodman, and
Nachury labs. Fernando Tejada, Cathy Booth, Jzesern Tan and Schantae Wright
always have warm and ready smiles while creating a productive and enjoyable
departmental atmosphere.
The Stanford community is a seemingly inexhaustible resource of scientific wisdom
and technical expertise. Without the patient and infinitely knowledgeable tutelage of
Csaba Földy in the world of interneurons and inhibition, this project could never have
taken the shape that it did. Outside of the Stanford community, I am grateful to Ken
Pelkey and Gord Fishell for their thoughtful discussions on this work. I thank all of
my graduate school friends for their support, steadiness, good humor and

vii
encouragement. In particular, Matt Carter and Saul Villeda became lifelong friends,
always ready to share a joke or lend a hand, since I first met them on the interview
trail. I am also very thankful for my long term friends, Steve and Molly Thomas, who
have supported me through all of life’s vicissitudes.
I am lucky to have an unbelievably loving, supportive and caring family. My
grandparents, Frank and Helen Owen have enthusiastically followed and encouraged
my scientific career from its earliest days. My sister, Patricia McCartney and her
husband Clinton are models of energetic warmth and devotion to family. Their sons,
Charlie and Hunter are an effervescent source of creativity, kindness and joy.
My parents, Charles and Judith Owen, introduced me to the fascination of research
with their contagious enthusiasm for discovery. Throughout my career, they have been
unfailingly loving and supportive: always ready to critique a manuscript, celebrate a
success, or help troubleshoot a recalcitrant problem. My father set a standard for
kindness, strength, intelligence, courage, passion for life, family and science, and
grace during hardship that few could ever hope to meet. The unwavering loyalty,
positivity, enthusiasm, resilience, and devotion to family from my mother provided an
unshakeable foundation of love and stability. Her scientific insight, writing and
teaching abilities have been invaluable throughout this work.
The most exceptional stroke of good fortune I had was to meet my wife, Laura Prolo
Owen, and the best decision I made was to marry her. She is my steadfast source of
kindness, boundless energy, and love. Her talents as a scientist, clarity of thought,
generosity with time and effort, and precision as a writer and communicator have

viii
meant that nearly every aspect of the work in this thesis has been improved
immeasurably by her help. To have my most careful critic, my most ardent supporter,
and my best friend all in the same companion is a blessing beyond compare. I look
forward to moving on to the next stage of our lives and careers together. It has been a
privilege to get to know the entire Prolo family. I thank them for their understanding
and support, and for the many home-baked meals and spectacular desserts that
sustained me throughout graduate school. I am grateful for the warmth and generosity
with which they have welcomed me into the family.
Finally, the work in this thesis has been generously supported by funding from the
National Institutes of Health, the Burnett Family Fund and the Mathers Foundation.
Additional funding has come from the National Defense Science and Engineering
Graduate Fellowships (NDSEG), and a National Research Service Award (NRSA)
from the National Institute of Mental Health (NIMH).

ix
TABLE OF CONTENTS
ABSTRACT ...................................................................................................................... iv ACKNOWLEDGMENTS ................................................................................................. v TABLE OF CONTENTS ................................................................................................. ix LIST OF FIGURES .......................................................................................................... xi CHAPTER 1: Introduction .............................................................................................. 1
Distinct neuronal populations each have a critical role for normal brain function and behavior. .......................................................................................................... 1
Neuronal activity and circuit function is controlled by a continuous balancing of excitation and inhibition. ........................................................................................ 2
Neuromodulators targeted subsets of neurons to influence neural circuitry. ......... 4
Oxytocin as a neuromodulator. ............................................................................... 5
The role of oxytocin in circuit physiology. ............................................................ 7
Oxytocin in the hippocampus. ................................................................................ 7
Oxytocin signaling in behavior and disease. .......................................................... 8
A salience cue that enhances signal-to-noise. ........................................................ 9
CHAPTER 2: Oxytocin modulates hippocampal signal processing through inhibition .................................................................................................................. 10 Oxytocin receptor activation enhances signal-to-noise in CA1 pyramidal cells. . 10
Increased evoked spike probability with TGOT. .................................................. 11
Reduced spike latency and enhanced spike timing precision with TGOT. .......... 11
TGOT does not increase the excitability of CA1 pyramidal cells. ....................... 12
Blockade of interneuron signaling eliminates the effect of TGOT on EPSP-spike coupling. ............................................................................................................... 14
TGOT shifts the E-I balance by reducing the evoked disynaptic IPSC without altering the monosynaptic EPSC. ......................................................................... 17
CHAPTER 3: Oxytocin acts selectively on fast-spiking interneurons in CA1 ......... 21 Increased inhibitory tone with TGOT application. ............................................... 21
Selective blockade of spontaneous IPSCs induced by TGOT implicates activity of a specific class of inhibitory interneurons. ....................................................... 23
Whole cell recordings from fast-spiking interneurons reveal dose-dependent response to TGOT. ............................................................................................... 23
Fast-spiking cell types, but not other interneuron subtypes are depolarized by TGOT. ................................................................................................................... 24
Voltage clamp recordings reveal a TGOT-induced inward current. .................... 27
TGOT-induced use-dependent depression of fast-spiking perisomatic-targeting synapses is necessary and sufficient to explain the reduction in evoked IPSC. ... 30
x
Extracellular stimulation confirms that TGOT depresses inhibitory synapses onto pyramidal cells without affecting excitatory synapses onto interneurons. ........... 33
Computer modeling of the link between TGOT-induced depression of inhibitory synapses and EPSP-evoked spiking. .................................................................... 39
CHAPTER 4: Spontaneous hippocampal oscillations are modulated by oxytocin .. 46 TGOT-induced spiking and unitary field potentials detected by tetrode recordings. ............................................................................................................ 48
Differential responses to TGOT by putative pyramidal cells and interneurons on tetrode recordings. ................................................................................................ 49
Tetrode recordings allow high-throughput comparison of single unit responses to multiple neuromodulator types. ............................................................................ 49
Power spectrum analysis provides additional insight into the effects of TGOT on spontaneous network activity. .............................................................................. 53
Tetrode recordings are well suited to study spontaneous Sharp-Wave Ripple (SPW-R) events in the slice preparation. .............................................................. 56
Individual TGOT-responsive neurons are active during SPW-R events. ............. 57
Spontaneous SPW-R events are entirely abolished by TGOT application. ......... 60
CHAPTER 5: Conclusion ............................................................................................... 62 Oxytocin enhances signal-to-noise, consistent with a role as a salience cue in hippocampal signaling. ......................................................................................... 62
The mechanism by which a reduction of inhibition sharpens spike timing. ........ 64
Comparison to other neuromodulators. ................................................................ 65
Oxytocin in the human hippocampus. .................................................................. 69
Autism, excitatory-inhibitory balance and brain rhythms. ................................... 70
Consequences of oxytocin-induced silencing of SPW-R events. ......................... 71
APPENDIX: Methods ..................................................................................................... 74 Hippocampal slice preparation ............................................................................. 74
Electrophysiological recordings ........................................................................... 76
Analysis of whole cell and cell-attached recordings. ........................................... 78
Tetrode recordings. ............................................................................................... 79
Tetrode data analysis. ........................................................................................... 80
SPW-R detection and analysis .............................................................................. 80
Drugs and reagents. .............................................................................................. 82
Interneuron labeling and classification. ................................................................ 82
Computer model of EPSP-spike coupling. ........................................................... 83
REFERENCES ................................................................................................................ 85

xi
LIST OF FIGURES
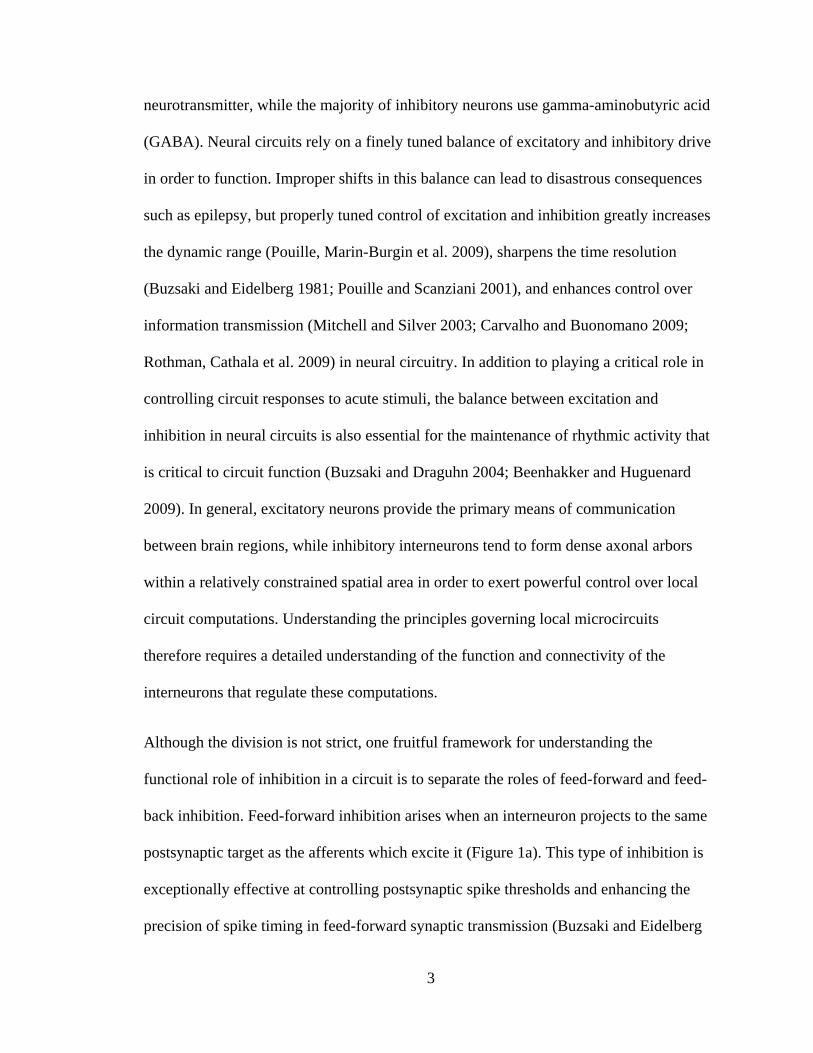
Figure 1. Many interneurons form either feed-forward or feed-back connections within local circuitry. .............................................................................................. 4
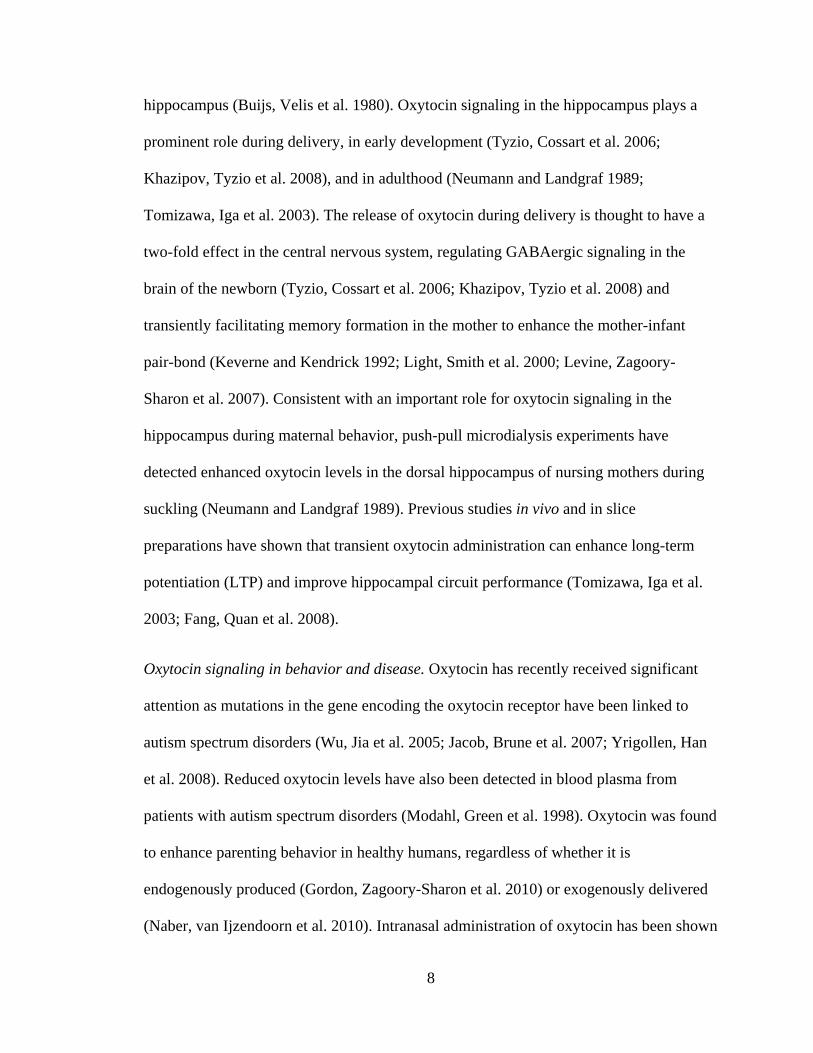
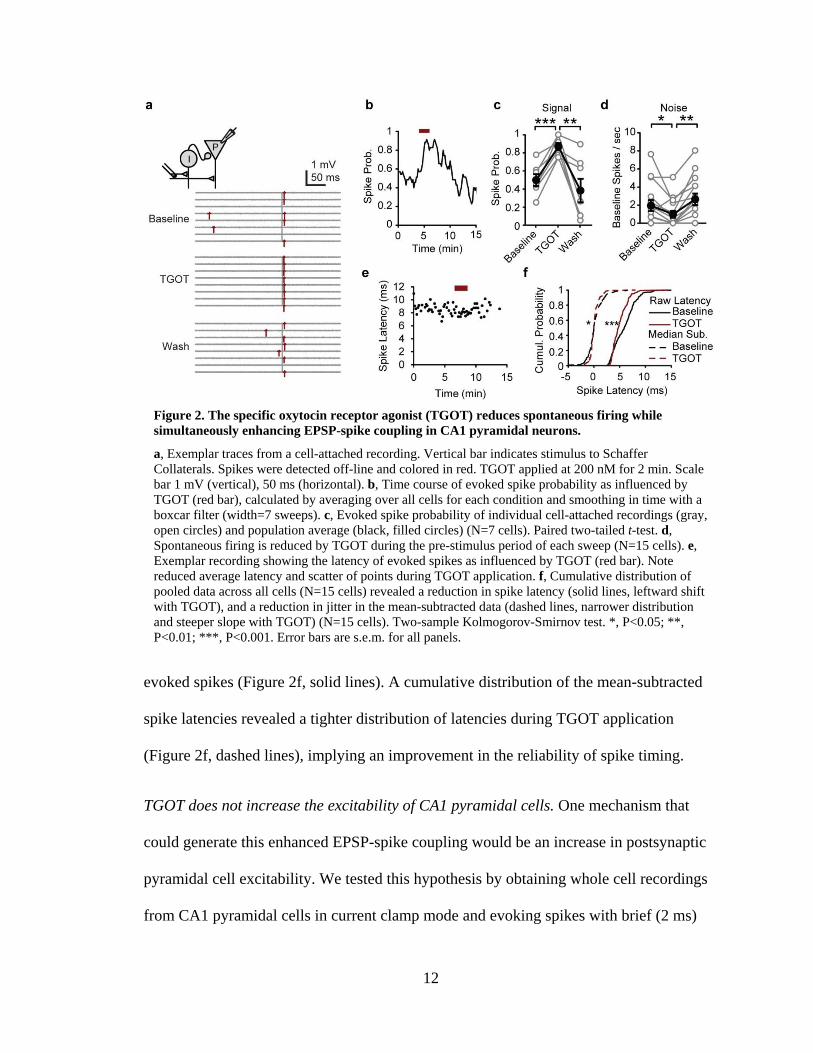
Figure 2. The specific oxytocin receptor agonist (TGOT) reduces spontaneous firing while simultaneously enhancing EPSP-spike coupling in CA1 pyramidal neurons. .............................................................................................................................. 12
Figure 3. TGOT does not increase excitability of CA1 pyramidal neurons. ............... 13
Figure 4. Passive membrane properties of pyramidal cells are unaffected by TGOT. 14
Figure 5. Blockade of GABAA receptors occludes the effect of TGOT effect on EPSP-spike coupling but blockade of GABAB receptors does not. ..................... 15
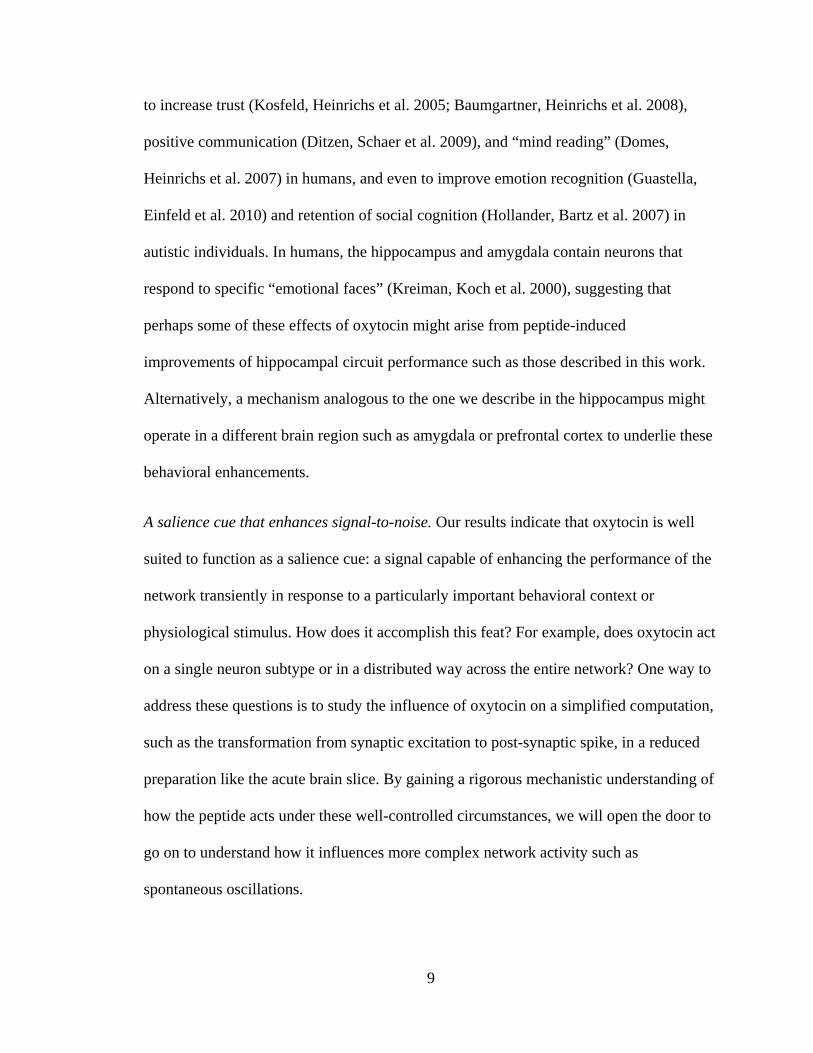
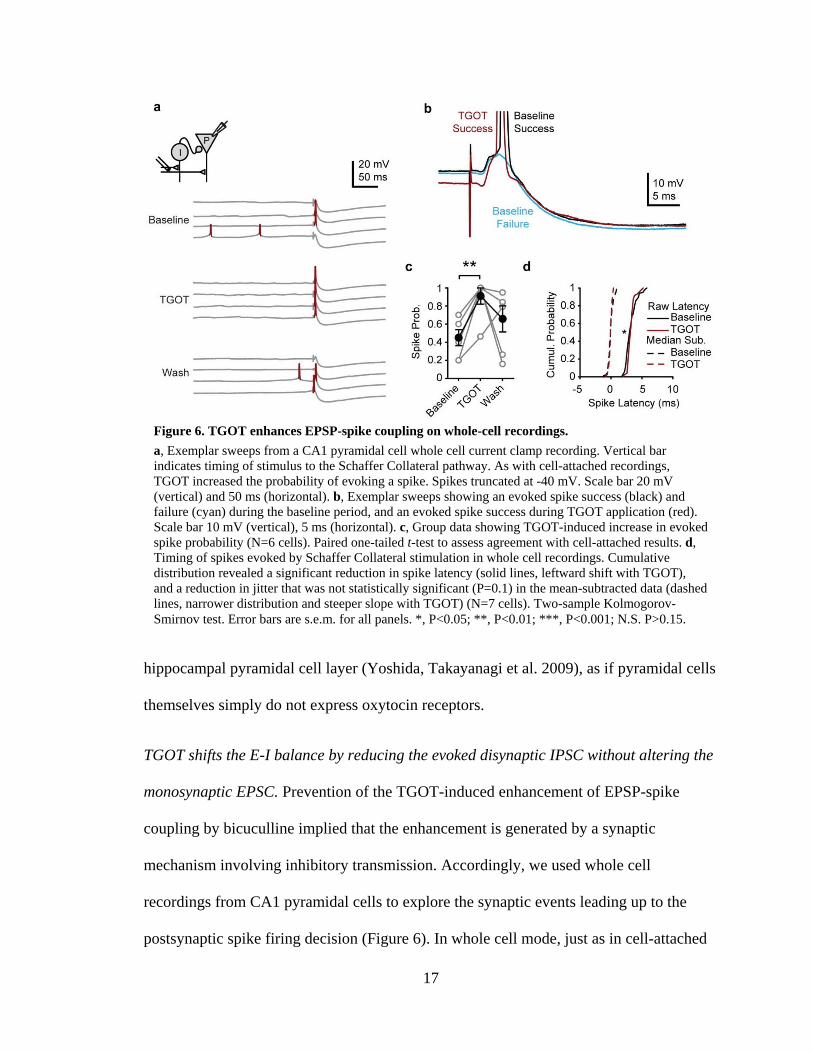
Figure 6. TGOT enhances EPSP-spike coupling on whole-cell recordings. ............... 17
Figure 7. TGOT reduces the evoked inhibition but does not alter the evoked EPSC. 19
Figure 8. Evidence for TGOT action on fast-spiking interneurons. ............................ 22
Figure 9. Dose-dependent responses of fast-spiking interneurons to TGOT application. ........................................................................................................... 25
Figure 10. TGOT selectively depolarizes multiple types of fast-spiking interneuron. 26
Figure 11. Increase in the rate and amplitude of IPSCs onto FS neurons with TGOT application. ........................................................................................................... 29
Figure 12. Paired recordings reveal synaptic locus of TGOT induced decrease in evoked inhibition. ................................................................................................. 31
Figure 13. TGOT reduces evoked monosynaptic IPSCs onto pyramidal cells. .......... 33
Figure 14. TGOT does not affect EPSCs onto fast-spiking interneurons. .................. 34
Figure 15. Generalization of network phenomenon to other brain states. ................... 35
Figure 16. Generalization of network phenomenon to other neuromodulators. .......... 38
Figure 17. Computer modeling of TGOT mechanism underlying EPSP-spike coupling effect. .................................................................................................................... 40
Figure 18. Exemplar sweeps from simulation demonstrate importance of residual IPSC. ..................................................................................................................... 42
Figure 19. Simulation of GABAA driving force influence on spike probability and timing. ................................................................................................................... 43
Figure 20. Tetrode recording of TGOT administration. .............................................. 48
Figure 21. Tetrode recordings from the CA1 pyramidal cell layer permit simultaneous observation of multiple cell responses to TGOT application ............................... 50
Figure 22. Tetrode recordings permit high-throughput analysis of neuron peptide responses. .............................................................................................................. 51
xii
Figure 23. Power spectrum analysis of TGOT application. ........................................ 54
Figure 24. Exemplar Sharp-Wave Ripple (SPW-R) event from an acute slice recording ............................................................................................................... 56
Figure 25. Tetrode recordings reveal a correlation between neurons activated by TGOT, and those activated by sharp-wave ripple events. .................................... 58
Figure 26. Exemplar sharp-wave ripple events in control ACSF and during TGOT application. ........................................................................................................... 59
Figure 27. TGOT abolishes spontaneous SPW-R events in acute slices. .................... 60
Figure 28. Depolarization of FS interneurons by TGOT in both male and female animals. ................................................................................................................. 75
Figure 29. Wiring of pre-amplifier for tetrode recordings from acute slices. ............. 79
Figure 30. Tetrode recording and spike clustering in acute slices. .............................. 81

1
CHAPTER 1: Introduction
The brain is made up of a tremendous diversity of neurons, each of which plays a distinct
role in controlling neural circuitry and animal behavior. How is it that a wide variety of
neuronal subtypes work together to perform the sophisticated computations that can be
glimpsed in action by functional recordings? While this question is absolutely essential to
our understanding of even the most fundamental aspects of nervous system function, it
nevertheless represents the biggest set of unsolved mysteries about the brain. Over the
past several decades, neuroscientists have made remarkable strides in characterizing the
large-scale organization of different brain regions, and also in understanding the cellular
biophysics of individual neurons. There remains, however, a substantial gap in our
knowledge with respect to linking the microscopic scale of neuronal biophysics and
biochemistry to the macroscopic dynamics of neuronal networks made up of billions of
cells. Improving our understanding of how many distinct types of cells are organized into
functional neural circuits will be critical to our understanding of the brain, and our ability
to treat numerous psychiatric diseases such as Autism Spectrum Disorders, Depression,
Schizophrenia, Tourette’s Syndrome and many other disorders whose root causes appear
to be based on defects at this level of brain function.
Distinct neuronal populations each have a critical role for normal brain function and
behavior. Since the breathtakingly insightful and thorough work of Santiago Ramón y
Cajal, we have known that each neural circuit possesses a distinct complement of
neuronal subtypes. Much effort in modern neuroscience focuses on improving our
classification of these neurons beyond the morphological studies employed by Cajal, to
include biochemical, biophysical and functional criteria (Brown and Hestrin 2009). With

2
this added information, we can begin to see how each cell type fits into to the activity of
the circuit as a whole. For example, the activity of specific dopaminergic cells in the
ventral tegmental area is strongly correlated with either rewarding or aversive behaviors
(Schultz 1998; Lammel, Ion et al. 2011), whereas specific classes of neurons in the
hippocampus are strongly entrained by multiple types of organized neuronal oscillations
that are critical to learning and memory (Klausberger, Marton et al. 2005; Klausberger
and Somogyi 2008).
By manipulating the activity of these identified subclasses of neurons within an otherwise
intact circuit, it is possible to establish a causal link between the specific pattern of
activity of individual cell types, the resulting influence on the circuit, and the behavior of
the animal. For example, selective silencing of specific inhibitory interneurons in the
ventromedial hypothalamus can suppress innate aggressive behaviors in mice (Lin, Boyle
et al. 2011). Alternatively, selective activation of fast-spiking interneurons in cortex can
transiently improve cortical circuit performance (Sohal, Zhang et al. 2009) and enhance
sensory perception (Cardin, Carlen et al. 2009). Extrapolating from many results such as
these, spread across a broad range of brain regions and cell types, it is clear that
understanding how the activity of each cell type is controlled, and how the specific
properties of each class of neuron allow it to contribute to the overall performance of the
network, will be a crucial step to our understanding of the brain as a whole.
Neuronal activity and circuit function is controlled by a continuous balancing of
excitation and inhibition. The majority of neurons in the brain can be classified as either
excitatory (promoting the activity of their postsynaptic targets) or inhibitory (suppressing
the activity of their postsynaptic targets). Excitatory neurons primarily use glutamate as a
3
neurotransmitter, while the majority of inhibitory neurons use gamma-aminobutyric acid
(GABA). Neural circuits rely on a finely tuned balance of excitatory and inhibitory drive
in order to function. Improper shifts in this balance can lead to disastrous consequences
such as epilepsy, but properly tuned control of excitation and inhibition greatly increases
the dynamic range (Pouille, Marin-Burgin et al. 2009), sharpens the time resolution
(Buzsaki and Eidelberg 1981; Pouille and Scanziani 2001), and enhances control over
information transmission (Mitchell and Silver 2003; Carvalho and Buonomano 2009;
Rothman, Cathala et al. 2009) in neural circuitry. In addition to playing a critical role in
controlling circuit responses to acute stimuli, the balance between excitation and
inhibition in neural circuits is also essential for the maintenance of rhythmic activity that
is critical to circuit function (Buzsaki and Draguhn 2004; Beenhakker and Huguenard
2009). In general, excitatory neurons provide the primary means of communication
between brain regions, while inhibitory interneurons tend to form dense axonal arbors
within a relatively constrained spatial area in order to exert powerful control over local
circuit computations. Understanding the principles governing local microcircuits
therefore requires a detailed understanding of the function and connectivity of the
interneurons that regulate these computations.
Although the division is not strict, one fruitful framework for understanding the
functional role of inhibition in a circuit is to separate the roles of feed-forward and feed-
back inhibition. Feed-forward inhibition arises when an interneuron projects to the same
postsynaptic target as the afferents which excite it (Figure 1a). This type of inhibition is
exceptionally effective at controlling postsynaptic spike thresholds and enhancing the
precision of spike timing in feed-forward synaptic transmission (Buzsaki and Eidelberg
4
1981; Pouille and Scanziani 2001). Feed-back inhibition, in contrast, arises when an
interneuron projects back onto the same cells from which it receives afferent excitation
(Figure 1b) (Buzsaki 1984), and is useful in suppressing runaway excitation, controlling
burst firing of neurons, and sustaining network oscillations (Mann, Suckling et al. 2005).
Other arrangements such as lateral inhibition, can sharpen divisions between neuronal
ensembles and maintain excitatory-inhibitory balance during computations. Because each
subclass of interneurons has its own distinct pattern of connectivity and its own
specialized complement of biophysical properties, feed-forward and feed-back inhibition
are largely mediated by distinct subsets of interneurons (Lamsa, Heeroma et al. 2005;
Glickfeld and Scanziani 2006).
Neuromodulators targeted subsets of neurons to influence neural circuitry. Many
animals, especially mammals with large and highly complex brains, face a difficult
challenge of how to coordinate the activity of many distinct and often spatially separated
brain structures with the constantly changing needs of the overall organism. One answer
to this challenge is provided by small molecules called neuromodulators which can shift
Figure 1. Many interneurons form either feed-forward or feed-back connections within local circuitry.
a, Cartoon of an interneuron (I) forming a feed-forward inhibitory connection onto an excitatory pyramidal neuron (P). Both cells receive afferent excitation from the same incoming pathway (from the left). b, Cartoon of an interneuron (I) forming a feed-back inhibitory connection onto an excitatory pyramidal neuron (P).

5
the activity of local circuitry through targeted actions on individual cell types.
Neuromodulators are often linked to a specific behavioral context such as reward,
feeding, sleep or social interaction. Studying the influence of these neuromodulators on
individual cell types, and the resulting impact on overall circuit activity, thus provides a
unique window into the purpose of physiologically relevant subsets of neurons (those that
respond to the same neuromodulator) in different neuronal computations. Furthermore,
many neuromodulators are genetically, biochemically, or functionally linked to human
diseases, providing a direct path to connect our understanding of specific neurological or
psychiatric diseases to the action of individual cell types within a neural circuit.
Oxytocin as a neuromodulator. Oxytocin is a cyclic, nine amino acid peptide that was
originally identified through its prominent role in milk letdown, labor and delivery
(Gimpl and Fahrenholz 2001). It is generated by specialized neurons in the hypothalamus
and secreted throughout the brain and periphery in a behaviorally dependent manner
(Buijs 1978; Buijs, Velis et al. 1980; De Vries and Buijs 1983). In both the brain and
peripheral tissue, oxytocin signals through a G protein-coupled receptor (the oxytocin
receptor) which is encoded by a single gene.
The peptidergic fibers that carry oxytocin from the hypothalamus to various release sites
in the brain are thin and difficult to track over long distances. The locus of oxytocin
action in the brain is therefore most commonly determined by imaging of the oxytocin
receptor expression in different brain regions. To date, no commercially available
antibodies are capable of effectively discriminating the oxytocin receptor from the
structurally similar vasopressin receptors. Autoradiography, the most reliable technique
available for determining oxytocin receptor expression levels, has good sensitivity for
6
detecting faint signals from a brain region with relatively low levels of receptor
expression, but is not well suited for identifying the specific cell types within a brain
region that express the receptor. Evidence from autoradiographic studies indicates that
oxytocin receptors are expressed in multiple brain regions including the hypothalamus,
amygdala, olfactory bulb, piriform cortex and hippocampus (Gimpl and Fahrenholz 2001;
Tomizawa, Iga et al. 2003). The recent generation of a knock-in mouse expressing the
fluorescent protein venus-GFP in the locus of the oxytocin receptor promises to facilitate
these studies at the cellular level, but it has not yet been employed to characterize
hippocampal expression of the oxytocin receptor in detail (Yoshida, Takayanagi et al.
2009).
Oxytocin does not penetrate the blood-brain barrier efficiently, and appears to be
regulated independently in the bloodstream and the central nervous system (Gimpl and
Fahrenholz 2001). Peripheral and central oxytocin are both generated in the
hypothalamus, but peripheral oxytocin is manufactured by the magnocellular neurons and
secreted directly into the bloodstream, while central oxytocin is generated by the
parvocellular neurons and released throughout the brain (Gimpl and Fahrenholz 2001).
The release of oxytocin in extrahypothalamic areas of the brain appears to be synaptically
mediated (Buijs and Swaab 1979), but elevated levels of oxytocin can be detected by
microdialysis in the ventricular cerebrospinal fluid (CSF) as well as in multiple distinct
brain regions during parturition, suckling or vaginocervical stimulation (Kendrick,
Keverne et al. 1986; Kendrick, Keverne et al. 1988; Kendrick, Keverne et al. 1988;
Neumann and Landgraf 1989; Kendrick, Keverne et al. 1991; Keverne and Kendrick
7
1992), suggesting that volume transmission of the peptide may take place in vivo
(Veening, de Jong et al. 2010).
The role of oxytocin in circuit physiology. The influence of oxytocin over each neural
circuit depends both on the specific classes of neuron that express the oxytocin receptor
within that circuit, and the sub-cellular signaling pathways activated by the oxytocin
receptor within those neurons. In the central amygdala, oxytocin modulates fear
responses by activating a subclass of interneurons which, in turn, inhibit a class of
vasopressin receptor-expressing neurons (Huber, Veinante et al. 2005; Viviani, Charlet et
al. 2011). In the hypothalamus, by contrast, tonic release of oxytocin from magnocellular
neurons retrogradely drives endocannabinoid-mediated suppression of presynaptic
GABA release onto those neurons (Oliet, Baimoukhametova et al. 2007). In the medial
amygdala, the physiological responses to oxytocin are less well characterized, but it
appears that an uncharacterized subclass of neurons increases its firing in response to the
peptide (S.F.O., data not shown) (Terenzi and Ingram 2005). Behavioral experiments
have indicated that oxytocin signaling in the medial amygdala and prefrontal cortex plays
a critical role in the formation of pair bonds between prairie voles (Williams, Insel et al.
1994; Young, Lim et al. 2001; Young and Wang 2004) and social memories in mice
(Ferguson, Young et al. 2000; Ferguson, Aldag et al. 2001; Choleris, Little et al. 2007).
Oxytocin signaling has also been linked to parenting behavior (Takayanagi, Yoshida et
al. 2005) and anxiety-related behavior in mice (Yoshida, Takayanagi et al. 2009).
Oxytocin in the hippocampus. Oxytocin receptors are expressed in the hippocampus of
many mammalian species (Gimpl and Fahrenholz 2001), and oxytocinergic fibers project
from the paraventricular nucleus of the hypothalamus (PVN) into the ventral
8
hippocampus (Buijs, Velis et al. 1980). Oxytocin signaling in the hippocampus plays a
prominent role during delivery, in early development (Tyzio, Cossart et al. 2006;
Khazipov, Tyzio et al. 2008), and in adulthood (Neumann and Landgraf 1989;
Tomizawa, Iga et al. 2003). The release of oxytocin during delivery is thought to have a
two-fold effect in the central nervous system, regulating GABAergic signaling in the
brain of the newborn (Tyzio, Cossart et al. 2006; Khazipov, Tyzio et al. 2008) and
transiently facilitating memory formation in the mother to enhance the mother-infant
pair-bond (Keverne and Kendrick 1992; Light, Smith et al. 2000; Levine, Zagoory-
Sharon et al. 2007). Consistent with an important role for oxytocin signaling in the
hippocampus during maternal behavior, push-pull microdialysis experiments have
detected enhanced oxytocin levels in the dorsal hippocampus of nursing mothers during
suckling (Neumann and Landgraf 1989). Previous studies in vivo and in slice
preparations have shown that transient oxytocin administration can enhance long-term
potentiation (LTP) and improve hippocampal circuit performance (Tomizawa, Iga et al.
2003; Fang, Quan et al. 2008).
Oxytocin signaling in behavior and disease. Oxytocin has recently received significant
attention as mutations in the gene encoding the oxytocin receptor have been linked to
autism spectrum disorders (Wu, Jia et al. 2005; Jacob, Brune et al. 2007; Yrigollen, Han
et al. 2008). Reduced oxytocin levels have also been detected in blood plasma from
patients with autism spectrum disorders (Modahl, Green et al. 1998). Oxytocin was found
to enhance parenting behavior in healthy humans, regardless of whether it is
endogenously produced (Gordon, Zagoory-Sharon et al. 2010) or exogenously delivered
(Naber, van Ijzendoorn et al. 2010). Intranasal administration of oxytocin has been shown
9
to increase trust (Kosfeld, Heinrichs et al. 2005; Baumgartner, Heinrichs et al. 2008),
positive communication (Ditzen, Schaer et al. 2009), and “mind reading” (Domes,
Heinrichs et al. 2007) in humans, and even to improve emotion recognition (Guastella,
Einfeld et al. 2010) and retention of social cognition (Hollander, Bartz et al. 2007) in
autistic individuals. In humans, the hippocampus and amygdala contain neurons that
respond to specific “emotional faces” (Kreiman, Koch et al. 2000), suggesting that
perhaps some of these effects of oxytocin might arise from peptide-induced
improvements of hippocampal circuit performance such as those described in this work.
Alternatively, a mechanism analogous to the one we describe in the hippocampus might
operate in a different brain region such as amygdala or prefrontal cortex to underlie these
behavioral enhancements.
A salience cue that enhances signal-to-noise. Our results indicate that oxytocin is well
suited to function as a salience cue: a signal capable of enhancing the performance of the
network transiently in response to a particularly important behavioral context or
physiological stimulus. How does it accomplish this feat? For example, does oxytocin act
on a single neuron subtype or in a distributed way across the entire network? One way to
address these questions is to study the influence of oxytocin on a simplified computation,
such as the transformation from synaptic excitation to post-synaptic spike, in a reduced
preparation like the acute brain slice. By gaining a rigorous mechanistic understanding of
how the peptide acts under these well-controlled circumstances, we will open the door to
go on to understand how it influences more complex network activity such as
spontaneous oscillations.

10
CHAPTER 2:
Oxytocin modulates hippocampal signal processing through inhibition
Using acute hippocampal slices, we have demonstrated that oxytocin enhances the signal-
to-noise of neuronal circuitry. We began by studying one of the most conceptually
straightforward building blocks of neuronal computation: the EPSP-spike coupling
transformation by which a neuron integrates multiple disparate synaptic inputs and then
responds either with a spike, or with silence. This transformation is mediated by a
delicate balance of excitatory and inhibitory neurotransmission.
Results
Oxytocin receptor activation enhances signal-to-noise in CA1 pyramidal cells. To test the
effect of oxytocin receptor activation on feed-forward spike transmission in the
hippocampus, we prepared acute hippocampal slices from young adult Sprague-Dawley
rats (age p21-p28). While recording from CA1 pyramidal cells in cell-attached mode to
avoid disturbing the intracellular composition, we used a tungsten bipolar electrode to
stimulate the glutamatergic Schaffer Collateral input from neighboring area CA3 at 10 s
intervals. The stimulus strength was set at threshold to evoke a spike from the CA1
pyramidal cell on approximately half of the trials. In addition to evoking a monosynaptic,
excitatory input onto the postsynaptic pyramidal cell with short latency, stimulation of
the Schaffer Collaterals also excites a variety of interneurons in the CA1 region. These
interneurons produce an inhibitory input onto the postsynaptic pyramidal cell
milliseconds after the excitatory input. The combined result of the two inputs in the
postsynaptic pyramidal cell is a brief window of membrane depolarization, followed by

11
hyperpolarization of the membrane due to disynaptic feed-forward inhibition from local
interneurons. In this way, b oth the threshold and the timing of spikes evoked in CA1
pyramidal cells by Schaffer Collateral stimulation are dictated by a finely tuned balance
of excitatory and inhibitory synaptic inputs (Buzsaki and Eidelberg 1981; Alger and
Nicoll 1982; Pouille and Scanziani 2001; Lamsa, Heeroma et al. 2005).
Increased evoked spike probability with TGOT. In agreement with previously reported
results from a similar assay (Pouille and Scanziani 2001), evoked spikes followed the
stimulus with a short latency (5.87±0.42 ms) and very little jitter (variance in latency,
2.29±0.30 ms2) (Figure 2a,e-h). Strikingly, bath application of TGOT (Thr4, Gly7-
Oxytocin), a specific agonist for oxytocin receptors, at 200 nM, dramatically increased
the probability of evoking a spike in the postsynaptic pyramidal cell (Figure 2a-c). This
effect was unexpected given the ability of oxytocin receptor agonists to enhance
inhibitory drive onto the same hippocampal neurons (Muhlethaler, Charpak et al. 1984;
Zaninetti and Raggenbass 2000), and was fully reversible upon washout of the peptide. In
addition to its effects on stimulation-evoked spikes, TGOT also suppressed the
spontaneous activity of CA1 pyramidal cells during the pre-stimulus period of each
sweep (Figure 2a,d). The combination of increased evoked spike probability (signal) and
reduced spontaneous activity (noise) results in an enhanced signal-to-noise ratio, of
potential importance for signal throughput and temporal fidelity in the CA1 network.
Reduced spike latency and enhanced spike timing precision with TGOT. In several
recordings TGOT appeared to reduce the latency and jitter of evoked spikes (e.g. Figure
2e). Pooling data from multiple experimental groups (see methods), we found that TGOT
had a moderate but statistically significant effect in reducing the average latency of
12
evoked spikes (Figure 2f, solid lines). A cumulative distribution of the mean-subtracted
spike latencies revealed a tighter distribution of latencies during TGOT application
(Figure 2f, dashed lines), implying an improvement in the reliability of spike timing.
TGOT does not increase the excitability of CA1 pyramidal cells. One mechanism that
could generate this enhanced EPSP-spike coupling would be an increase in postsynaptic
pyramidal cell excitability. We tested this hypothesis by obtaining whole cell recordings
from CA1 pyramidal cells in current clamp mode and evoking spikes with brief (2 ms)
Figure 2. The specific oxytocin receptor agonist (TGOT) reduces spontaneous firing while simultaneously enhancing EPSP-spike coupling in CA1 pyramidal neurons.
a, Exemplar traces from a cell-attached recording. Vertical bar indicates stimulus to Schaffer Collaterals. Spikes were detected off-line and colored in red. TGOT applied at 200 nM for 2 min. Scale bar 1 mV (vertical), 50 ms (horizontal). b, Time course of evoked spike probability as influenced by TGOT (red bar), calculated by averaging over all cells for each condition and smoothing in time with a boxcar filter (width=7 sweeps). c, Evoked spike probability of individual cell-attached recordings (gray, open circles) and population average (black, filled circles) (N=7 cells). Paired two-tailed t-test. d, Spontaneous firing is reduced by TGOT during the pre-stimulus period of each sweep (N=15 cells). e, Exemplar recording showing the latency of evoked spikes as influenced by TGOT (red bar). Note reduced average latency and scatter of points during TGOT application. f, Cumulative distribution of pooled data across all cells (N=15 cells) revealed a reduction in spike latency (solid lines, leftward shift with TGOT), and a reduction in jitter in the mean-subtracted data (dashed lines, narrower distribution and steeper slope with TGOT) (N=15 cells). Two-sample Kolmogorov-Smirnov test. *, P<0.05; **, P<0.01; ***, P<0.001. Error bars are s.e.m. for all panels.

13
current injections through the recording pipette. Stimuli were delivered once every 10 s,
and the amplitude of the current injection was adjusted for each cell to elicit a spike in
roughly half of the trials (Figure 3), thus keeping the protocol similar to that used to
demonstrate an improvement in signal-to-noise (Figure 2). In marked contrast to the
TGOT-induced increase in evoked spike probability following Schaffer Collateral
stimulation, TGOT dramatically reduced the probability of evoking a spike by current
injection (Figure 3). This abrupt and reversible drop in current-evoked spike probability
was coupled to a moderate but statistically significant hyperpolarization of the cell
membrane (Figure 4a). The hyperpolarization of the membrane and the reduction in
spikes evoked by current injection were consistent with the TGOT-induced reduction in
spontaneous activity of CA1 pyramidal cells (Figure 2d). However, both results were in
Figure 3. TGOT does not increase excitability of CA1 pyramidal neurons.
a, Exemplar sweeps from a CA1 pyramidal cell whole cell current clamp recording. Vertical bar and pulse icon indicate timing of a brief current injection. TGOT application reduced the probability of eliciting a spike. Scale bar 160 mV (vertical), 50 ms (horizontal). b, Group data demonstrating the reversible reduction in current injection-evoked spikes with TGOT application (N=7 cells). Error bars are s.e.m. Paired two-tailed t-test. c, Time course of current-evoked spike probability as influenced by TGOT (red bar) calculated by averaging over all cells for each condition and smoothing in time with a boxcar filter (width=7 sweeps). *, P<0.05; ***, P<0.001.

14
the opposite direction from that which would explain the increased EPSP-spike coupling
following Schaffer Collateral stimulation. We therefore returned to Schaffer Collateral
stimulation to seek a synaptic basis for the TGOT-induced increase in EPSP-spike
coupling.
Blockade of interneuron signaling eliminates the effect of TGOT on EPSP-spike coupling.
Inhibitory interneuron activity has been strongly implicated in setting spike thresholds in
a wide range of neuronal circuits. To test whether the increase in evoked spike
probability by TGOT might be mediated by GABAergic interneurons, we repeated the
experiments in the presence of either the GABAB blocker CGP52432 or the GABAA
Figure 4. Passive membrane properties of pyramidal cells are unaffected by TGOT.
a, Membrane potential of CA1 pyramidal cells measured during the pre-stimulus period of each sweep in whole cell current clamp recordings (N=12 cells). Paired two-tailed t-test: ***, P<0.001. b, Holding current in voltage clamp recordings from CA1 pyramidal cells in whole cell mode with NBQX (10 M), AP5 (50 M) and bicuculline (10 M) in the bath is unaffected by TGOT application (red bar). Membrane potential was clamped at -70 mV. Gray lines in panels b and c represent individual recordings (N=6 cells). Black line is the population average. Scale bar for panels b and c 100 pA (vertical, panel b), 50 M (vertical, panel c), 2 min (horizontal, both panels). c, Membrane resistance measured from the same recordings shown in panel b by using -10 mV hyperpolarizing voltage steps. d, Individual recordings (open symbols) and population averages (filled symbols) from the same recordings depicted in panels b and c shows no net change in holding current (gray circles) or membrane resistance (triangles) with TGOT application. Error bars are s.e.m. for all plots.

15
blocker bicuculline. The CA3 region was removed in all experiments featuring
bicuculline in order to prevent ictal activity. The TGOT-induced increase in spike
probability in the presence of the GABAB receptor antagonist CGP52432 (2 M) (Figure
5a,c,e) was virtually identical to that seen under control conditions (Figure 2). The
Figure 5. Blockade of GABAA receptors occludes the effect of TGOT effect on EPSP-spike coupling but blockade of GABAB receptors does not.
a, Cell-attached recordings from CA1 pyramidal neurons in the presence of CGP52432 at 2 M resembled those in control ACSF, both during the baseline period and in response to TGOT at 200 nM. Scale bar for panels a and b 1 mV (vertical), 50 ms (horizontal). b, Cell-attached recordings in the presence of bicuculline at 10 M show no effect of TGOT on spike probability or timing. Counter-clockwise arrow indicates reduced stimulus intensity sufficient to reach spike threshold. Note increased spike latency and reduced spike timing precision relative to control (Figure 2), as well as increased number of spike doublets and triplets. c, Group data indicating that the increase in evoked spike probability in response to TGOT persisted in the presence of CGP52432 at 2 M (N=8 cells). d, Group data demonstrating that bicuculline blocked the TGOT-induced increase evoked spike probability. (N=6 cells). e, Time course of evoked spike probability as influenced by TGOT (red bar) shown separately for CGP52432 (black) and bicuculline (green). Probability calculated by averaging over all cells for each condition and smoothing in time with a boxcar filter (width=7 sweeps). All error bars are s.e.m. Paired two-tailed t-test. **, P<0.01; N.S., P>0.15.

16
presence of the GABAA receptor antagonist bicuculline (10 M), however, substantially
altered evoked spiking behavior. Lower stimulus intensities sufficed to reach spike
threshold (24±1 A in bicuculline; 151±27 A in control; P<0.01 unpaired two-tailed t-
test), consistent with the known importance of the GABAA-mediated disynaptic feed-
forward IPSP in near-threshold behavior (Buzsaki and Eidelberg 1981; Pouille and
Scanziani 2001). Whereas under control conditions a stimulus at threshold intensity
resulted in either a failure or a single spike in the postsynaptic cell (Figure 2), threshold
stimuli in bicuculline generally caused either a failure or a burst of two to four
postsynaptic spikes (Figure 5b). The latency from the stimulus to the first spike was
significantly longer in bicuculline (51±5 ms in bicuculline; 5.7±0.8 ms in control,
P<0.001 two-tailed unpaired t-test) and the variance in the timing of the first spike was
dramatically increased (304±64 ms2 in bicuculline; 3.27±2 ms2 in control, P<0.01 two-
tailed unpaired t-test), consistent with the importance of the feed-forward IPSP in
shortening the spike timing window. Strikingly, with bicuculline present, TGOT had no
effect on the probability of evoking a spike (P>0.95), the latency of spike timing (P>0.5),
or the latency variance (P>0.3; paired two-tailed t-test) (Figure 5b,d,e).
The actions of TGOT thus appear restricted to the local interneuron circuitry in this assay
(Muhlethaler, Sawyer et al. 1983; Muhlethaler, Charpak et al. 1984; Zaninetti and
Raggenbass 2000). Indeed, when GABAA transmission was blocked with bicuculline, we
observed no TGOT-induced change in pyramidal cell holding current or input resistance
(Figure 4), indicating the TGOT-induced hyperpolarization of the pyramidal cell
membrane may be due to a change in inhibitory tone. In addition, genetic labeling studies
have revealed a sparse distribution of oxytocin receptor-expressing cells in the
17
hippocampal pyramidal cell layer (Yoshida, Takayanagi et al. 2009), as if pyramidal cells
themselves simply do not express oxytocin receptors.
TGOT shifts the E-I balance by reducing the evoked disynaptic IPSC without altering the
monosynaptic EPSC. Prevention of the TGOT-induced enhancement of EPSP-spike
coupling by bicuculline implied that the enhancement is generated by a synaptic
mechanism involving inhibitory transmission. Accordingly, we used whole cell
recordings from CA1 pyramidal cells to explore the synaptic events leading up to the
postsynaptic spike firing decision (Figure 6). In whole cell mode, just as in cell-attached
Figure 6. TGOT enhances EPSP-spike coupling on whole-cell recordings.
a, Exemplar sweeps from a CA1 pyramidal cell whole cell current clamp recording. Vertical bar indicates timing of stimulus to the Schaffer Collateral pathway. As with cell-attached recordings, TGOT increased the probability of evoking a spike. Spikes truncated at -40 mV. Scale bar 20 mV (vertical) and 50 ms (horizontal). b, Exemplar sweeps showing an evoked spike success (black) and failure (cyan) during the baseline period, and an evoked spike success during TGOT application (red). Scale bar 10 mV (vertical), 5 ms (horizontal). c, Group data showing TGOT-induced increase in evoked spike probability (N=6 cells). Paired one-tailed t-test to assess agreement with cell-attached results. d, Timing of spikes evoked by Schaffer Collateral stimulation in whole cell recordings. Cumulative distribution revealed a significant reduction in spike latency (solid lines, leftward shift with TGOT), and a reduction in jitter that was not statistically significant (P=0.1) in the mean-subtracted data (dashed lines, narrower distribution and steeper slope with TGOT) (N=7 cells). Two-sample Kolmogorov-Smirnov test. Error bars are s.e.m. for all panels. *, P<0.05; **, P<0.01; ***, P<0.001; N.S. P>0.15.
18
mode, TGOT caused a sharp increase in the probability of evoking a spike by Schaffer
Collateral stimulation (Figure 6a,c). The spike timing precision of EPSP-evoked spikes in
whole cell configuration was markedly enhanced relative to the precision observed in
cell-attached mode during the pre-TGOT baseline period. We attribute this enhanced
spike timing precision in whole cell recordings (average variance 0.17±0.05 ms2 in whole
cell; 3.27±2 ms2 in cell-attached; P<10-5, unpaired t-test) to the low (2 mM) Cl- internal
solution used to enhance the IPSP amplitude in the whole cell recordings. As confirmed
by computer modeling (Figure 19), the larger IPSP amplitude resulting from the
increased Cl- driving force in whole cell mode narrows the depolarization window and
sharpens the spike timing relative to that recorded in the more physiological cell-attached
mode. Despite this, we found that TGOT was still able to confer a slight enhancement of
spike timing precision (Figure 6d). The average latency was reduced by TGOT (3.56±0.4
ms in control, 3.45±0.3 ms in TGOT, P<0.05 two sample Kolmogorov-Smirnov test).
The mean-subtracted spike timing showed a modest reduction in spike jitter, but this
trend did not reach statistical significance for the whole cell recordings, perhaps due to
the smaller size of the data set and the lower initial value of the spike latency in control
conditions (5.87±0.4 ms in cell-attached recordings, 3.56±0.4 ms in whole cell
recordings).
Nearly every stimulus in the presence of TGOT evoked an action potential, making it
impractical to compare the amplitude of the evoked EPSP between TGOT and control
conditions. There was, however, a significant reduction in the amplitude of the evoked
IPSP in TGOT as compared to the preceding baseline period (Figure 7a,b). In another set
of cells, we recorded evoked IPSCs as outward currents in voltage clamp using a holding

19
potential of 0 mV and found a significant reduction in the amplitude of the evoked IPSC
during TGOT application (Figure 7c,d). No change was observed between TGOT and
control conditions in the evoked EPSC, isolated by including 10 M bicuculline in the
bath and holding the cell at -65 mV, close to the GABAA reversal potential (Figure 7c,d).
This reduction in evoked IPSC, without a direct effect on the EPSC, shifts the excitatory-
inhibitory (E-I) balance following Schaffer Collateral stimulation in the correct direction
to explain the observed increase in evoked spike probability. Furthermore, the inability of
TGOT to influence evoked spike probability in the presence of bicuculline (Figure 5)
suggests that this reduction in evoked IPSC is likely the predominant mechanism
underlying the enhanced spike probability. Accordingly, we set out to investigate the
action of TGOT on inhibitory interneurons with a goal of understanding this reduction in
evoked inhibitory drive.
Figure 7. TGOT reduces the evoked inhibition but does not alter the evoked EPSC.
a, Average traces from all evoked spike successes during the baseline period (black) and during TGOT application (red) from a single cell, corrected for TGOT-induced shift in membrane potential, reveal a reduction in the IPSP following the evoked spike. Scale bar 10 mV (vertical), 50 ms (horizontal). b, Group data show a moderate but statistically significant reduction in evoked IPSP when measured with respect to pre-stimulus baseline. Data pooled from evoked spike successes and failures (N=6 cells). Paired two-tailed t-test. c, Average evoked IPSC (top) from one cell and EPSC (bottom) from a different cell recorded before (black) and during (red) TGOT application. Note that TGOT reduces evoked IPSC amplitude without affecting the evoked EPSC. Scale bar 400 pA (vertical) and 20 ms (horizontal). d, Group data showing significant reduction in the evoked IPSC (N=8 cells) without any effect on the evoked EPSC (N=6 cells). Error bars are s.e.m. for all panels. Paired two-tailed t-test. *, P<0.05; **, P<0.01; ***, P<0.001; N.S. P>0.15.
20
Summary
We have found that oxytocin receptor activation enhances the signal-to-noise and
sharpens the timing of feed-forward spike transmission in the CA1 region of
hippocampus. Both of these effects are mediated through inhibitory transmission, and can
be abolished by the GABAA blocker bicuculline. When GABAergic transmission is
blocked with bicuculline, oxytocin signaling has no apparent effect on the passive
membrane properties of pyramidal cells. The oxytocin receptor agonist reduces the
amplitude of the evoked feed-forward IPSC without any apparent effect on the feed-
forward EPSC. The net result of these synaptic effects is to shift the excitatory-inhibitory
(E-I) balance of feed-forward transmission in the correct direction to explain the
enhanced feed-forward spike transmission. The following experiments aim to elucidate
the mechanisms underlying these phenomena.

21
CHAPTER 3:
Oxytocin acts selectively on fast-spiking interneurons in CA1
By identifying the specific interneuron subtypes in CA1 which respond to oxytocin, we
have been able to provide evidence for an elegantly simple mechanism by which one set
of interneurons can permit an increase in the response of CA1 pyramidal cells to
synchronous synaptic input while simultaneously suppressing the spontaneous activity of
those same pyramidal cells. These results offer insight into an important mechanism by
which oxytocin controls brain function, and a new perspective on the role of a particular
subclass of interneurons in modulating circuit activity.
Results
Increased inhibitory tone with TGOT application. In agreement with previous reports
(Muhlethaler, Sawyer et al. 1983; Muhlethaler, Charpak et al. 1984; Raggenbass, Wuarin
et al. 1985; Raggenbass, Tribollet et al. 1989; Zaninetti and Raggenbass 2000), we found
that TGOT immediately and reversibly increased both the rate (Figure 8b-d) and the
amplitude (Figure 8b,e) of spontaneous IPSCs arriving onto CA1 pyramidal cells. We set
out to identify the origin of these TGOT-induced spontaneous IPSCs in the hope that it
would illuminate the multiple effects of TGOT on CA1 spontaneous activity, evoked
spike probability, and spike timing precision. These spontaneous inhibitory synaptic
events could be blocked by 10 M bicuculline, indicating that they were mediated by
GABAA receptors. Likewise, the effects of TGOT on the rate and amplitude of
spontaneous IPSCs were entirely blocked by the specific oxytocin receptor antagonist

22
d(CH2)51,Tyr(Me)2,Thr4,Orn8,des-Gly-NH2
9-Vasotocin (OTA) at 1 M (Elands, Barberis
et al. 1988; Zaninetti and Raggenbass 2000; Huber, Veinante et al. 2005) suggesting that,
even when applied at 200 nM, the action of the agonist TGOT was specific to the
oxytocin receptor, with minimal cross-talk to the receptors for vasopressin or other
peptides. The TGOT-induced enhancement of IPSC rate and amplitude were similarly
abolished by inclusion of 200 nM tetrodotoxin (TTX) in the bath (Zaninetti and
Raggenbass 2000), indicating that the effect of TGOT is likely mediated by a change in
Figure 8. Evidence for TGOT action on fast-spiking interneurons.
a, Schematic showing interneuron subtypes in CA1 hippocampus. Note FS interneurons rely exclusively on P/Q-type voltage gated calcium channels (VGCCs) for synaptic transmission while RS interneurons rely significantly on N-type VGCCs. b, Excerpts from exemplar CA1 pyramidal cell voltage clamp recordings before (black) and during (red) TGOT application. Bath application of NBQX (10 M) and AP5 (50 M) together with 50 mM Cl- in the pipette solution isolated downward IPSC events. Under control conditions TGOT increased the rate and amplitude of these events. The effect of TGOT was blocked by bicuculline (10 M), the oxytocin receptor antagonist (OTA, 1M), or TTX (200 nM). Pre-treatment with AgaIVA (0.5 M) blocked the TGOT-induced effect on IPSCs but GVIA (1 M) did not. Scale bar 100 pA (vertical), 50 ms (horizontal). c, Time course of IPSC frequency detected in CA1 pyramidal cells as influenced by TGOT (red bar), averaged across all cells for each condition. IPSC frequency increased in response to TGOT under control conditions (black line) and in GVIA-treated slices (green) but not AgaIVA-treated slices (orange). (N=6 cells each condition). d, IPSC frequency onto pyramidal cells before (black) and during (red) TGOT application (N=6 cells for each condition). Paired two-tailed t-test. e, IPSC amplitude onto pyramidal cells before (black) and during (red) TGOT application. Paired two-tailed t-test. Error bars are s.e.m. for all panels.*, P<0.05; **, P<0.01; ***, P<0.001.

23
presynaptic interneuron firing rather than a change in spontaneous presynaptic release at
inhibitory nerve terminals.
Selective blockade of spontaneous IPSCs induced by TGOT implicates activity of a
specific class of inhibitory interneurons. Pyramidal cells in area CA1 receive input from a
wide variety of interneuron subtypes. Each subtype possesses a distinct combination of
physiology and connectivity and plays a specific role in the overall function of the local
circuitry (Freund and Buzsaki 1996; McBain and Fisahn 2001; Klausberger and Somogyi
2008). To help identify which interneuron subtypes respond to TGOT, we drew on
previous reports that fast-spiking (FS) interneurons in hippocampus mediate their
transmission exclusively through P/Q-type channels, while the regular-spiking (RS) cells
rely predominantly on N-type channels (Figure 8a) (Poncer, McKinney et al. 1997;
Wilson, Kunos et al. 2001; Hefft and Jonas 2005; Foldy, Lee et al. 2007). The TGOT-
induced increases in the amplitude and frequency of IPSCs onto CA1 pyramidal cells
were entirely abolished by pre-treatment with the P/Q-type calcium channel blocker -
Agatoxin IVA but were unaffected by pre-treatment with the N-type calcium channel
antagonist -conotoxin GVIA (Figure 8b-e). These two results indicate that the majority
of TGOT-induced IPSCs likely arise from fast-spiking interneurons in the CA1 region of
hippocampus, with little or no contribution from the regular-spiking interneuron
subtypes.
Whole cell recordings from fast-spiking interneurons reveal dose-dependent response to
TGOT. We used whole cell recordings from multiple interneuron subtypes to obtain more
direct confirmation of the TGOT-sensitive interneuron subtypes. Given that interneurons
in the stratum radiatum are unresponsive to TGOT (Zaninetti and Raggenbass 2000), we

24
directed our experiments to interneurons in the strata oriens and pyramidale of CA1. Each
interneuron was identified based on its firing profile in response to current injection (e.g.
Figure 9a, see methods). Initially, we considered only those cells which exhibited a
classical fast-spiking phenotype including: (1) peak firing rates greater than 200 Hz with
little firing rate accommodation, (2) characteristic fast-spiking action potential waveform,
(3) large amplitude spontaneous IPSPs with fast kinetics, and (4) minimal
hyperpolarization-induced sag current due to Ih. Based on these criteria, every fast-
spiking neuron in our data set exhibited a strong, dose-dependent depolarization and
increase in firing rate in response to TGOT application (Figure 9b,c). When TGOT was
applied at 0.2 nM, three out of seven neurons were depolarized by more than 2 mV, but
only one increased its firing rate by more than 0.5 Hz. By contrast, application of TGOT
at 2 nM caused eight out of nine neurons to be depolarized by more than 2 mV and the
firing rate of six out of nine to be increased by more than 2 Hz. In response to TGOT
doses of 20 nM (N=9 cells) and 200 nM (N=30 cells), all fast-spiking neurons responded
with strong depolarizations and firing rate increases. The 200 nM dose produced the most
robust response (Figure 9b), motivating our continued use of this near-saturating
concentration of TGOT in further experiments.
Fast-spiking cell types, but not other interneuron subtypes are depolarized by TGOT.
Next, we sought to identify the critical subset of TGOT-sensitive interneurons based on
spatial or functional criteria. Neurons were marked by including 0.1% biocytin in the
recording pipette to allow for post-hoc staining of axonal and dendritic morphology
(Figure 10b, representative tracings above axis). We grouped neurons based on
morphological and physiological criteria into one of five different subclasses of CA1
25
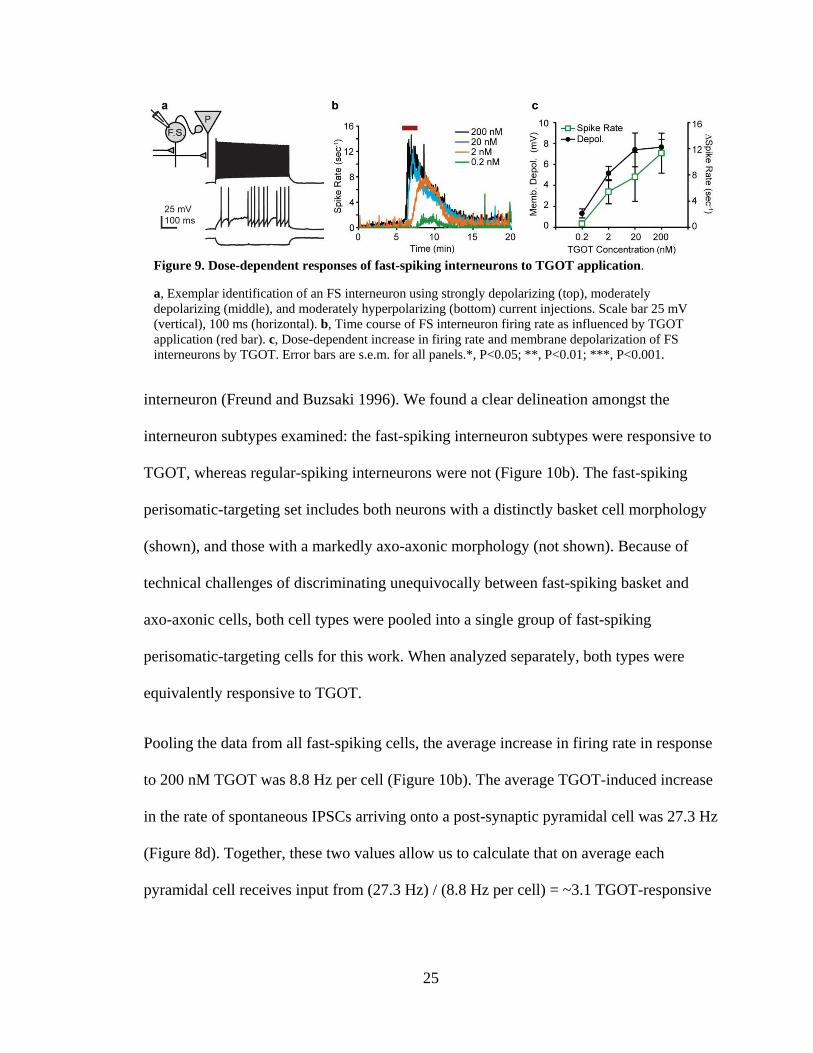
interneuron (Freund and Buzsaki 1996). We found a clear delineation amongst the
interneuron subtypes examined: the fast-spiking interneuron subtypes were responsive to
TGOT, whereas regular-spiking interneurons were not (Figure 10b). The fast-spiking
perisomatic-targeting set includes both neurons with a distinctly basket cell morphology
(shown), and those with a markedly axo-axonic morphology (not shown). Because of
technical challenges of discriminating unequivocally between fast-spiking basket and
axo-axonic cells, both cell types were pooled into a single group of fast-spiking
perisomatic-targeting cells for this work. When analyzed separately, both types were
equivalently responsive to TGOT.
Pooling the data from all fast-spiking cells, the average increase in firing rate in response
to 200 nM TGOT was 8.8 Hz per cell (Figure 10b). The average TGOT-induced increase
in the rate of spontaneous IPSCs arriving onto a post-synaptic pyramidal cell was 27.3 Hz
(Figure 8d). Together, these two values allow us to calculate that on average each
pyramidal cell receives input from (27.3 Hz) / (8.8 Hz per cell) = ~3.1 TGOT-responsive
Figure 9. Dose-dependent responses of fast-spiking interneurons to TGOT application.
a, Exemplar identification of an FS interneuron using strongly depolarizing (top), moderately depolarizing (middle), and moderately hyperpolarizing (bottom) current injections. Scale bar 25 mV (vertical), 100 ms (horizontal). b, Time course of FS interneuron firing rate as influenced by TGOT application (red bar). c, Dose-dependent increase in firing rate and membrane depolarization of FS interneurons by TGOT. Error bars are s.e.m. for all panels.*, P<0.05; **, P<0.01; ***, P<0.001.

26
Figure 10. TGOT selectively depolarizes multiple types of fast-spiking interneuron.
a, Exemplar current clamp recording from an FS perisomatic-targeting interneuron. Note the depolarization and increase in spiking during TGOT application (red bar). Scale bar 40 mV (vertical), 2 min (horizontal). b, Interneurons recorded in the strata pyramidale, oriens and radiatum, grouped based on electrophysiological properties and morphology into five subtypes including oriens-stratum lacunosum moleculare (O-L.M.) cells (N=3 cells), RS basket cells (N=9 cells), FS perisomatic-targeting cells (N=14 cells), FS bistratified cells (N=16 cells) and RS trilaminar cells (N=3 cells). Filled symbols indicate TGOT-induced membrane depolarization, open symbols indicate TGOT-induced change in firing rate. Black horizontal bars indicate respective average values. Exemplar biocytin-filled neurons of each cell type above with soma and dendrites (black) and axon (green). Approximate location of the pyramidal cell layer is indicated by a gray stripe. Scale bar 250 M. Paired two-tailed t-test. c, Voltage dependence of TGOT-induced current, calculated by subtracting the current recorded from voltage ramps in TGOT from the baseline voltage ramp current. d, Time course of the current recorded at selected potentials from FS neuron voltage ramp recordings. e, Voltage clamp recordings from FS perisomatic-targeting interneurons held at -65 mV under control conditions (purple, N=7 cells), with 10 mM BAPTA in the recording pipette (orange, N=7 cells) and with 1mM GTPS in the recording pipette (green, N=7 cells). All recordings were baseline subtracted to adjust for the leak current measured during the first 2 min of the recording before the onset of the GTPS-induced current. Lines represent average current in each condition. Shaded area represents average ± S.E.M. Traces were time-aligned to the wash-in of TGOT (red bar). For one cell in the GTPS in which baseline recording period was 10 min rather than 15 min, the pre-TGOT period was aligned to the start of the other recordings, and the remainder of the trace was aligned to the TGOT wash-in. f, GTPS (1mM) in the recording pipette occludes the TGOT-induced current in FS neurons, but 10 mM BAPTA has no effect. Unpaired two-tailed t-test. *,p<0.05; **, P<0.01; ***, P<0.001.

27
fast-spiking cells in our acute slices. Because of the relatively conservative approach
employed to count TGOT-induced IPSCs, this number is likely to be an under estimate.
Voltage clamp recordings reveal a TGOT-induced inward current. To gain insight into
the mechanisms by which TGOT depolarizes the fast-spiking interneurons, we went on to
record from fast-spiking perisomatic-targeting cells in voltage clamp mode. Cells were
held at -65 mV, near the resting potential, and the voltage was periodically ramped
between -80 mV and +20 mV, once every 10 sec. TGOT application simultaneously
increased the amplitude of the outward current at depolarized potentials and the inward
current at hyperpolarized potentials (Figure 10d). The reversal potential of the TGOT-
induced current was calculated by subtracting the ramp current during TGOT application
from the current under baseline conditions. The reversal potential of the TGOT-induced
current (-3.1 ±3.4 mV in control Voltage Ramp ACSF, see methods) was consistent with
induction of current through a non-selective cation channel (Figure 10d). When external
Na+ was partially replaced by NMDG (50 mM) in the bath solution, the reversal potential
was significantly more negative (-13.8±3.7 mV in NMDG Voltage Ramp ACSF, P<0.05,
unpaired two-tailed t-test), consistent with participation of Na+ ions as the predominant
charge carrier of the TGOT-induced inward current. This enhanced inward current near
the resting membrane potential is consistent with the depolarization and the increase in
spontaneous firing of these cells observed in current clamp recordings. In a subset of
recordings, the TGOT-induced current did not reverse and was inward at all membrane
potentials. These recordings were excluded from the voltage ramp analysis.
To investigate the molecular mechanisms underlying this inward current, we voltage-
clamped a further set of interneurons at -65 mV for at least 5 min before applying TGOT
28
at 200 nM. Under these conditions, TGOT had no effect on the holding current in
regular-spiking interneurons (data not shown), but it induced a large inward current in all
of the fast-spiking perisomatic-targeting interneurons recorded. Because the fast-spiking
interneurons in area CA1 form strong inhibitory connections with one another, the
TGOT-induced inward current was accompanied by a pronounced increase in the rate of
spontaneous IPSCs onto the recorded fast-spiking cell (Figure 11). The traces in Figure
10e were filtered at 0.1 Hz to show the TGOT-induced current independently of these
spontaneous synaptic events. To test whether G protein signaling within the fast-spiking
neuron itself is necessary for the TGOT-induced inward current, we replaced the GTP in
the intracellular recording solution with 1 mM GTPS, a constitutively active, non-
hydrolysable GTP analog. In these recordings, a persistent inward current developed over
the first 5 minutes of the recording, as the GTPS diffused into the cell (Figure 10e,f).
After allowing this GTPS-induced current to stabilize, we applied TGOT externally and
found that the GTPS-induced current largely occluded the TGOT-induced current
(Figure 10e,f), indicating that the TGOT-induced current arises from G protein signaling
within the fast-spiking neurons. To test whether this pathway is dependent on
intracellular calcium signaling, we included 10 mM BAPTA in the recording pipette.
Neither the amplitude, nor the kinetics of the TGOT-induced current were affected by
intracellular BAPTA, indicating that the intracellular signaling mechanism is likely not
Ca2+-dependent (Figure 10e,f) (see also (Alberi, Dreifuss et al. 1997) and (Reymond-
Marron, Tribollet et al. 2006)).
Taken together, these data provide direct evidence for the selectivity of TGOT for fast-
spiking hippocampal interneurons, as previously suggested by the calcium channel

29
pharmacology (Figure 8). The agonist selectivity for fast-spiking cells is notable because
fast-spiking basket cells, with fast membrane time constants and short synaptic latencies,
are thought to be the predominant source of feed-forward inhibition in CA1 (Glickfeld
Figure 11. Increase in the rate and amplitude of IPSCs onto FS neurons with TGOT application.
a, Exemplar whole cell recording from an FS basket cell voltage clamped at -60 mV. Pipette solution
contained 2 mM Cl-, setting the chloride reversal potential at -108 mV and causing GABA
A-mediated
IPSCs to appear as transient outward currents (see insets). Note the large inward current induced by TGOT application (red bar) together with an increase in the rate of spontaneous IPSC events. Scale bar 200 pA (vertical, all traces), 2 min (horizontal, full trace) or 20 ms (horizontal, insets). b, Increase in IPSC events onto FS perisomatic-targeting neurons (N=6 cells) plotted from individual cells (open, gray circles) and group average (filled, black circles). Error bars are s.e.m. Paired two-tailed t-test: ***, P<0.001. c, Time course of IPSC rate increase onto FS perisomatic-targeting from individual cells (gray) and group average (black) with TGOT application (red bar).

30
and Scanziani 2006). These cells would therefore be the most likely candidate to mediate
the TGOT-induced changes in EPSP-spike coupling described earlier (Figure 2).
The increase in firing rate of the fast-spiking cells is consistent with the TGOT-induced
increase in large amplitude asynchronous IPSCs arriving onto CA1 pyramidal cells and
the blockade of those IPSCs by AgaIVA (Figure 8b-e). Furthermore, this enhancement in
inhibitory tone provides a mechanistic explanation for the suppression of background
activity of CA1 pyramidal neurons (Figure 2) (Muhlethaler, Charpak et al. 1984), and the
hyperpolarization of the pyramidal cells observed in current clamp recordings (Figure
4a). However, the decrease in the evoked IPSC (Figure 7) which accounts for the increase
in EPSP-spike coupling following Schaffer Collateral stimulation (Figure 2, Figure 6),
cannot be explained by these asynchronous events alone.
TGOT-induced use-dependent depression of fast-spiking perisomatic-targeting synapses
is necessary and sufficient to explain the reduction in evoked IPSC. To determine the
mechanism by which TGOT application reduces the evoked IPSC, we turned to
simultaneous recording from connected interneuron to pyramidal cell pairs. We restricted
our analysis to those pairs in which the presynaptic interneuron had a perisomatic-
targeting morphology to minimize variability due to cell type heterogeneity.
In fast-spiking interneuron to pyramidal cell pairs, TGOT depolarized the presynaptic
interneuron, substantially increasing its spontaneous firing rate (Figure 12a, top row). In
these pairs, TGOT also increased the frequency of spontaneous postsynaptic IPSCs (gray
traces below). Averaging many responses (red) enabled discrimination of the evoked
postsynaptic IPSC arising specifically from action potentials in the presynaptic neuron,

31
which was markedly diminished by TGOT application (Figure 12a, top row, Figure 12b).
To determine whether the decrease in evoked IPSC amplitude was a result of use-
dependent synaptic depression or a direct effect of TGOT on synaptic strength, we
performed another set of paired recordings wherein the TGOT-induced depolarization of
the presynaptic cell was counteracted by a hyperpolarizing bias current delivered through
the recording pipette (Figure 12a, middle row). In these recordings, the evoked IPSC was
Figure 12. Paired recordings reveal synaptic locus of TGOT-induced decrease in evoked inhibition.
a, Simultaneous recording from presynaptic interneurons (upper traces) connected to postsynaptic pyramidal cells (lower traces). Top pair, exemplar presynaptic FS perisomatic-targeting cell permitted to depolarize in response to TGOT. Middle pair, another presynaptic FS perisomatic-targeting cell in which the TGOT-induced depolarization was countered by a hyperpolarizing current injection. Bottom pair, RS basket cell to pyramidal cell synaptic transmission is unaffected by TGOT application. b, Group data reveals depression at FS to pyramidal synapses only occurs when the presynaptic FS neuron is allowed to depolarize in response to TGOT. (N=8 for FS; N=5 for FS no depolarization; N=4 for RS). Paired two-tailed t-test. c, FS to pyramidal cell pairs in which the presynaptic interneuron is driven at 1 Hz (black), 5 Hz (green), 20 Hz (blue) or 50 Hz (red) for 10 s reveal a frequency-dependent synaptic depression in control ACSF. Responses are normalized to the first IPSC in the train. d, The degree of synaptic depression at FS to pyramidal synapses is correlated with the change in rate of spontaneous firing during TGOT application. Each filled black circle represents one FS to pyramidal cell pair. Colored diamonds represent average depression from driven 10 s trains. Synaptic depression is plotted on the y-axis and the change in firing rate of the presynaptic cell induced either by TGOT or current injection is plotted on the x-axis. No black circles were obscured by colored diamonds. (N=8 cells for 1, 5, 20 and 50 Hz trains; N=7 cells for 2 and 10 Hz trains). e, Time course of recovery from synaptic depression induced by a 50 Hz, 10 s train. (N=8 cells). Error bars are s.e.m. for all plots. *, P<0.05. N.S. P>0.15.
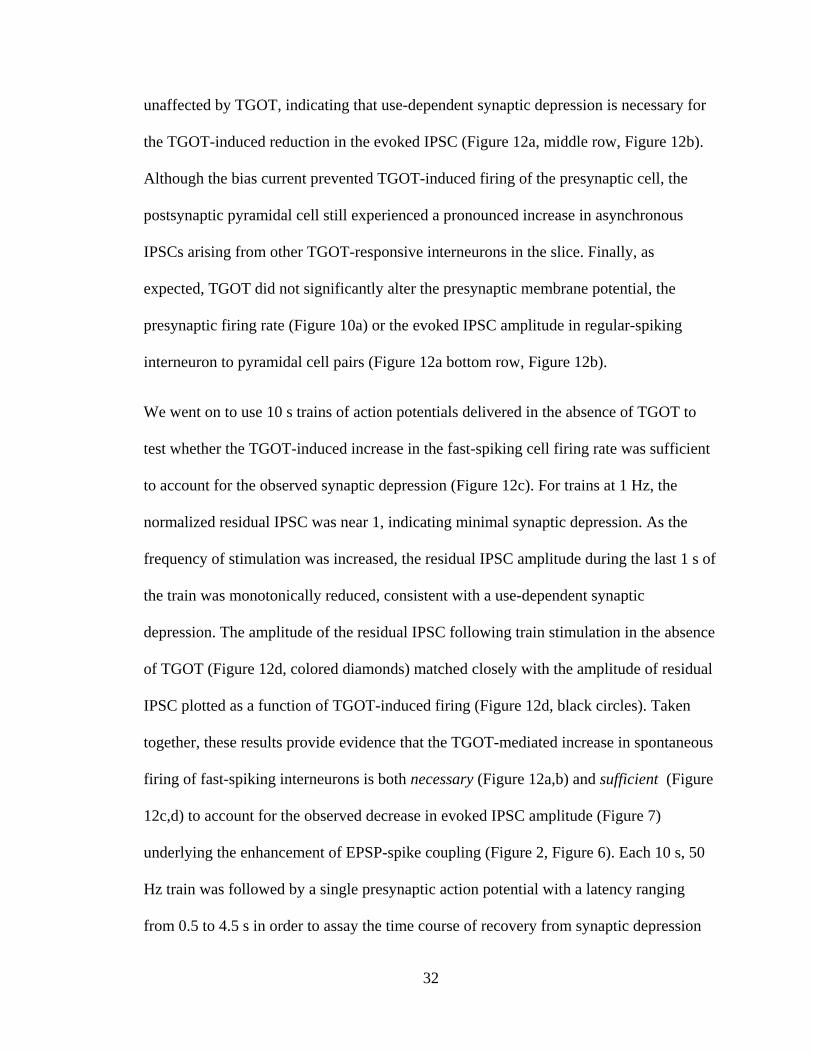
32
unaffected by TGOT, indicating that use-dependent synaptic depression is necessary for
the TGOT-induced reduction in the evoked IPSC (Figure 12a, middle row, Figure 12b).
Although the bias current prevented TGOT-induced firing of the presynaptic cell, the
postsynaptic pyramidal cell still experienced a pronounced increase in asynchronous
IPSCs arising from other TGOT-responsive interneurons in the slice. Finally, as
expected, TGOT did not significantly alter the presynaptic membrane potential, the
presynaptic firing rate (Figure 10a) or the evoked IPSC amplitude in regular-spiking
interneuron to pyramidal cell pairs (Figure 12a bottom row, Figure 12b).
We went on to use 10 s trains of action potentials delivered in the absence of TGOT to
test whether the TGOT-induced increase in the fast-spiking cell firing rate was sufficient
to account for the observed synaptic depression (Figure 12c). For trains at 1 Hz, the
normalized residual IPSC was near 1, indicating minimal synaptic depression. As the
frequency of stimulation was increased, the residual IPSC amplitude during the last 1 s of
the train was monotonically reduced, consistent with a use-dependent synaptic
depression. The amplitude of the residual IPSC following train stimulation in the absence
of TGOT (Figure 12d, colored diamonds) matched closely with the amplitude of residual
IPSC plotted as a function of TGOT-induced firing (Figure 12d, black circles). Taken
together, these results provide evidence that the TGOT-mediated increase in spontaneous
firing of fast-spiking interneurons is both necessary (Figure 12a,b) and sufficient (Figure
12c,d) to account for the observed decrease in evoked IPSC amplitude (Figure 7)
underlying the enhancement of EPSP-spike coupling (Figure 2, Figure 6). Each 10 s, 50
Hz train was followed by a single presynaptic action potential with a latency ranging
from 0.5 to 4.5 s in order to assay the time course of recovery from synaptic depression
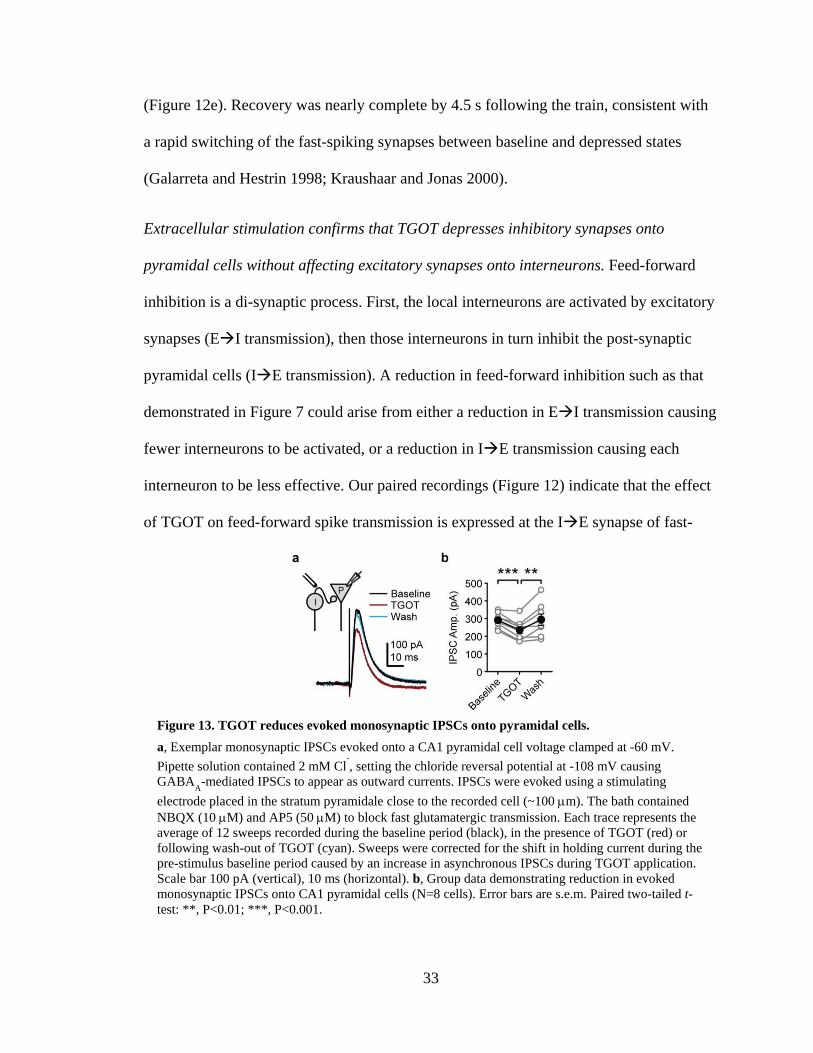
33
(Figure 12e). Recovery was nearly complete by 4.5 s following the train, consistent with
a rapid switching of the fast-spiking synapses between baseline and depressed states
(Galarreta and Hestrin 1998; Kraushaar and Jonas 2000).
Extracellular stimulation confirms that TGOT depresses inhibitory synapses onto
pyramidal cells without affecting excitatory synapses onto interneurons. Feed-forward
inhibition is a di-synaptic process. First, the local interneurons are activated by excitatory
synapses (EI transmission), then those interneurons in turn inhibit the post-synaptic
pyramidal cells (IE transmission). A reduction in feed-forward inhibition such as that
demonstrated in Figure 7 could arise from either a reduction in EI transmission causing
fewer interneurons to be activated, or a reduction in IE transmission causing each
interneuron to be less effective. Our paired recordings (Figure 12) indicate that the effect
of TGOT on feed-forward spike transmission is expressed at the IE synapse of fast-
Figure 13. TGOT reduces evoked monosynaptic IPSCs onto pyramidal cells.
a, Exemplar monosynaptic IPSCs evoked onto a CA1 pyramidal cell voltage clamped at -60 mV.
Pipette solution contained 2 mM Cl-, setting the chloride reversal potential at -108 mV causing
GABAA-mediated IPSCs to appear as outward currents. IPSCs were evoked using a stimulating
electrode placed in the stratum pyramidale close to the recorded cell (~100 m). The bath contained NBQX (10 M) and AP5 (50 M) to block fast glutamatergic transmission. Each trace represents the average of 12 sweeps recorded during the baseline period (black), in the presence of TGOT (red) or following wash-out of TGOT (cyan). Sweeps were corrected for the shift in holding current during the pre-stimulus baseline period caused by an increase in asynchronous IPSCs during TGOT application. Scale bar 100 pA (vertical), 10 ms (horizontal). b, Group data demonstrating reduction in evoked monosynaptic IPSCs onto CA1 pyramidal cells (N=8 cells). Error bars are s.e.m. Paired two-tailed t-test: **, P<0.01; ***, P<0.001.
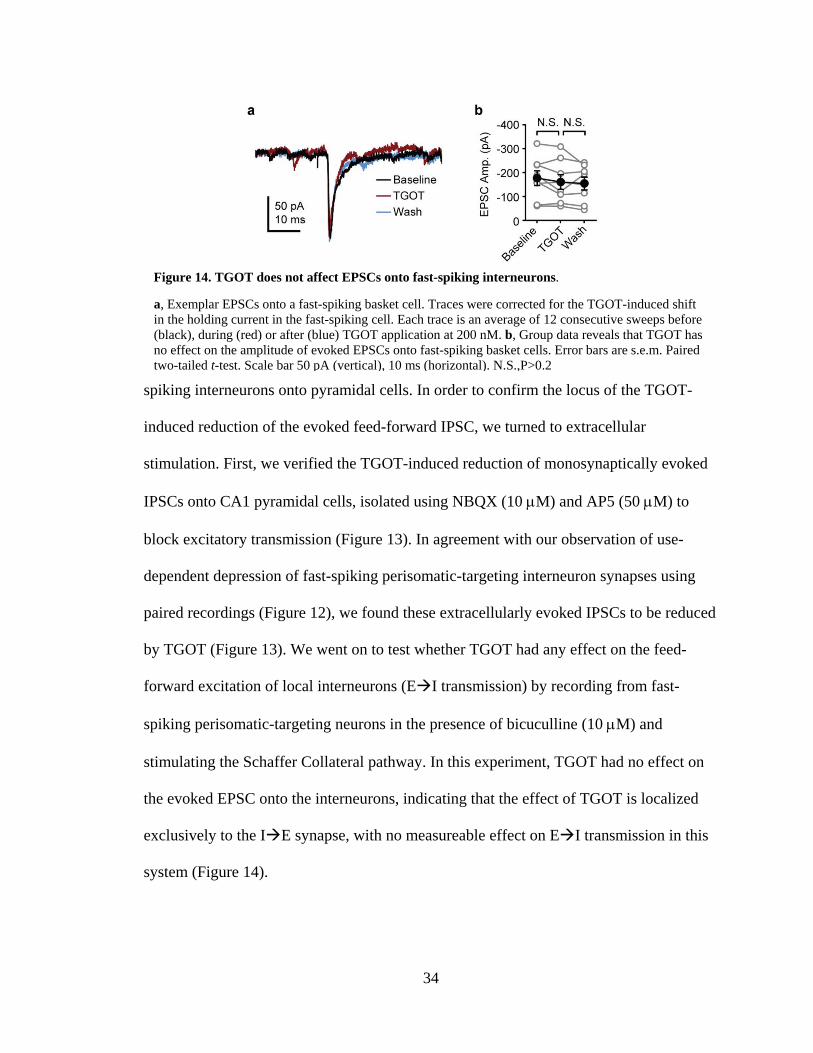
34
spiking interneurons onto pyramidal cells. In order to confirm the locus of the TGOT-
induced reduction of the evoked feed-forward IPSC, we turned to extracellular
stimulation. First, we verified the TGOT-induced reduction of monosynaptically evoked
IPSCs onto CA1 pyramidal cells, isolated using NBQX (10 M) and AP5 (50 M) to
block excitatory transmission (Figure 13). In agreement with our observation of use-
dependent depression of fast-spiking perisomatic-targeting interneuron synapses using
paired recordings (Figure 12), we found these extracellularly evoked IPSCs to be reduced
by TGOT (Figure 13). We went on to test whether TGOT had any effect on the feed-
forward excitation of local interneurons (EI transmission) by recording from fast-
spiking perisomatic-targeting neurons in the presence of bicuculline (10 M) and
stimulating the Schaffer Collateral pathway. In this experiment, TGOT had no effect on
the evoked EPSC onto the interneurons, indicating that the effect of TGOT is localized
exclusively to the IE synapse, with no measureable effect on EI transmission in this
system (Figure 14).
Figure 14. TGOT does not affect EPSCs onto fast-spiking interneurons.
a, Exemplar EPSCs onto a fast-spiking basket cell. Traces were corrected for the TGOT-induced shift in the holding current in the fast-spiking cell. Each trace is an average of 12 consecutive sweeps before (black), during (red) or after (blue) TGOT application at 200 nM. b, Group data reveals that TGOT has no effect on the amplitude of evoked EPSCs onto fast-spiking basket cells. Error bars are s.e.m. Paired two-tailed t-test. Scale bar 50 pA (vertical), 10 ms (horizontal). N.S.,P>0.2
35
Generalization of this network-based phenomenon to other brain states and
neuromodulators. Because a large number of synaptic contacts are inevitably severed
during the preparation of brain slices, many of the neurons in a slice will be quiescent
relative to the intact brain. It is possible, therefore, that the novel circuit phenomenon we
have uncovered, mediating the TGOT-induced enhancement of hippocampal signal-to-
noise, might apply only in the artificial situation in which overall activity levels are low
and all of the fast-spiking synapses are maximally recovered from their synaptic
Figure 15. Generalization of network phenomenon to other brain states.
a, Schematic of field recording configuration for kainate-induced gamma rhythms. b, Excerpt from exemplar stratum radiatum field recording before (upper, black trace) and during (lower, blue trace) kainate application at 200 nM. Note gamma oscillation in the presence of kainate. Scale bar 50 V vertical, 50 ms horizontal. c, Power spectral density from field recording electrode in stratum radiatum under control conditions (black), in kainate (blue) and kainate + TGOT (red). Note primary peak at 25-30Hz and secondary peak at ~50 Hz indicating presence of a gamma oscillation induced by kainate and persisting in the presence of TGOT. d, Peak power of the kainate-induced gamma oscillation at 25-30 Hz is unaffected by TGOT. e, Exemplar sweeps from synaptic field EPSP recorded in stratum radiatum in the presence of kainate-induced gamma oscillation (blue) and with the addition of TGOT (red). f, Field EPSP slope is unaffected by TGOT in the presence of kainate-induced gamma oscillations. g, Averaged traces from exemplar field recording of evoked population spike in the stratum pyramidale before (blue) and during (red) TGOT application in the presence of kainate-induced gamma oscillations. h, Group data demonstrating TGOT-induced enhancement of CA1 population spike amplitude evoked by Schaffer Collateral stimulation in the presence of kainate-induced gamma oscillations (N=6 slices). Paired two-tailed t-test. **, P<0.01; ***, P<0.001.

36
depression. To test whether the TGOT-induced enhancement of feed-forward spike
transmission is robust under conditions more like those in vivo, we used low doses of
kainate (100-200 nM) to elevate activity levels in the slice and induce a persistent gamma
rhythm oscillation (Figure 15b,c). Kainate application is a standard tool for inducing
gamma rhythms in hippocampal slices, and many properties of the kainate induced
gamma rhythms have been shown to fit closely with gamma rhythms in vivo (Atallah and
Scanziani 2009). In order to monitor both the ongoing gamma oscillation and the EPSP-
spike coupling with the same set of recording electrodes, we switched from recording
individual cells in cell-attached or whole-cell mode, to recording field potentials from the
strata pyramidale and radiatum (Figure 15a). This change in recording conditions
provided the added advantage that the recorded signal corresponded to the averaged
population activity of many hundreds or thousands of neurons in the slice, and therefore
represented a more faithful measure of the network response to our stimulus.
In this assay, the kainate-induced gamma rhythm appeared as a ~50 V oscillation on the
stratum radiatum field recording electrode (Figure 15b). The power spectrum of this
oscillation revealed a peak at ~25 Hz and a secondary peak at ~50 Hz, which appeared to
represent a higher harmonic of the 25 Hz peak (Figure 15c). We used only those slices
which expressed a stable gamma rhythm for at least 30 min before TGOT application.
TGOT did not affect the ongoing gamma oscillation (Figure 15d), nor did it affect the
field EPSP elicited once every 10 s by a stimulus to the Schaffer Collaterals and recorded
by a field electrode in the stratum radiatum (Figure 15e,f), consistent with a lack of any
direct effect of TGOT on excitatory synaptic transmission (Figure 7c,d). TGOT
application did, however, significantly increase the amplitude of the evoked population
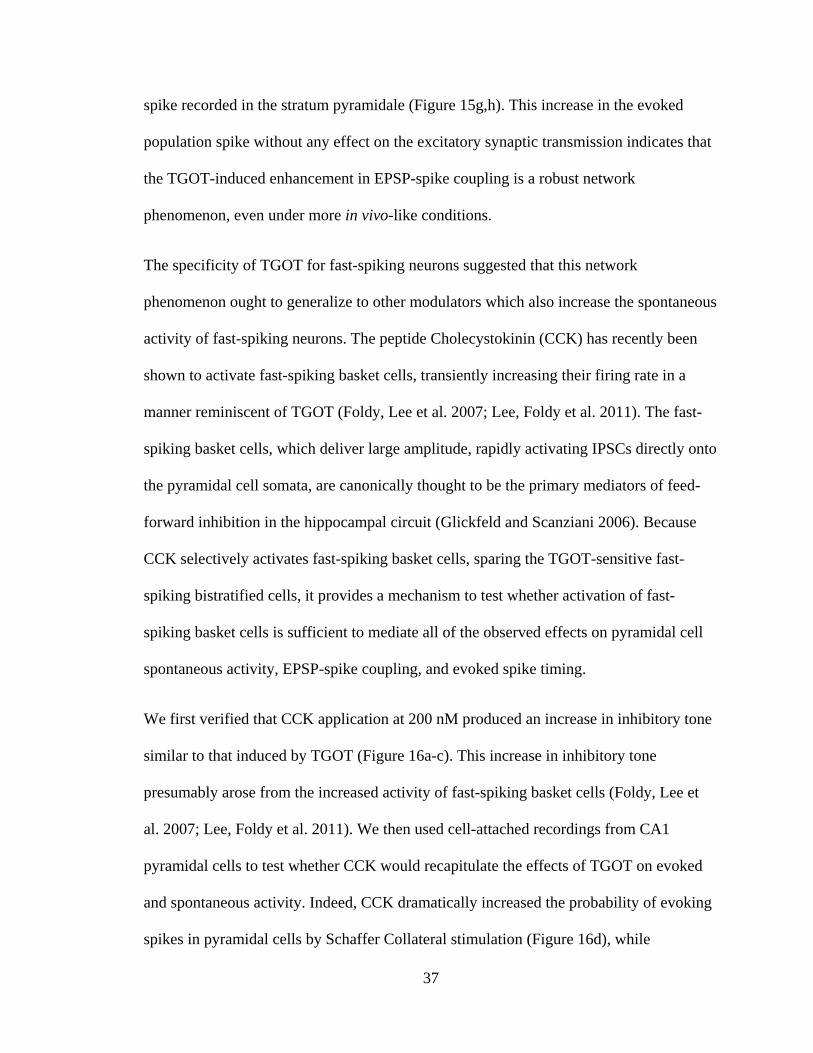
37
spike recorded in the stratum pyramidale (Figure 15g,h). This increase in the evoked
population spike without any effect on the excitatory synaptic transmission indicates that
the TGOT-induced enhancement in EPSP-spike coupling is a robust network
phenomenon, even under more in vivo-like conditions.
The specificity of TGOT for fast-spiking neurons suggested that this network
phenomenon ought to generalize to other modulators which also increase the spontaneous
activity of fast-spiking neurons. The peptide Cholecystokinin (CCK) has recently been
shown to activate fast-spiking basket cells, transiently increasing their firing rate in a
manner reminiscent of TGOT (Foldy, Lee et al. 2007; Lee, Foldy et al. 2011). The fast-
spiking basket cells, which deliver large amplitude, rapidly activating IPSCs directly onto
the pyramidal cell somata, are canonically thought to be the primary mediators of feed-
forward inhibition in the hippocampal circuit (Glickfeld and Scanziani 2006). Because
CCK selectively activates fast-spiking basket cells, sparing the TGOT-sensitive fast-
spiking bistratified cells, it provides a mechanism to test whether activation of fast-
spiking basket cells is sufficient to mediate all of the observed effects on pyramidal cell
spontaneous activity, EPSP-spike coupling, and evoked spike timing.
We first verified that CCK application at 200 nM produced an increase in inhibitory tone
similar to that induced by TGOT (Figure 16a-c). This increase in inhibitory tone
presumably arose from the increased activity of fast-spiking basket cells (Foldy, Lee et
al. 2007; Lee, Foldy et al. 2011). We then used cell-attached recordings from CA1
pyramidal cells to test whether CCK would recapitulate the effects of TGOT on evoked
and spontaneous activity. Indeed, CCK dramatically increased the probability of evoking
spikes in pyramidal cells by Schaffer Collateral stimulation (Figure 16d), while
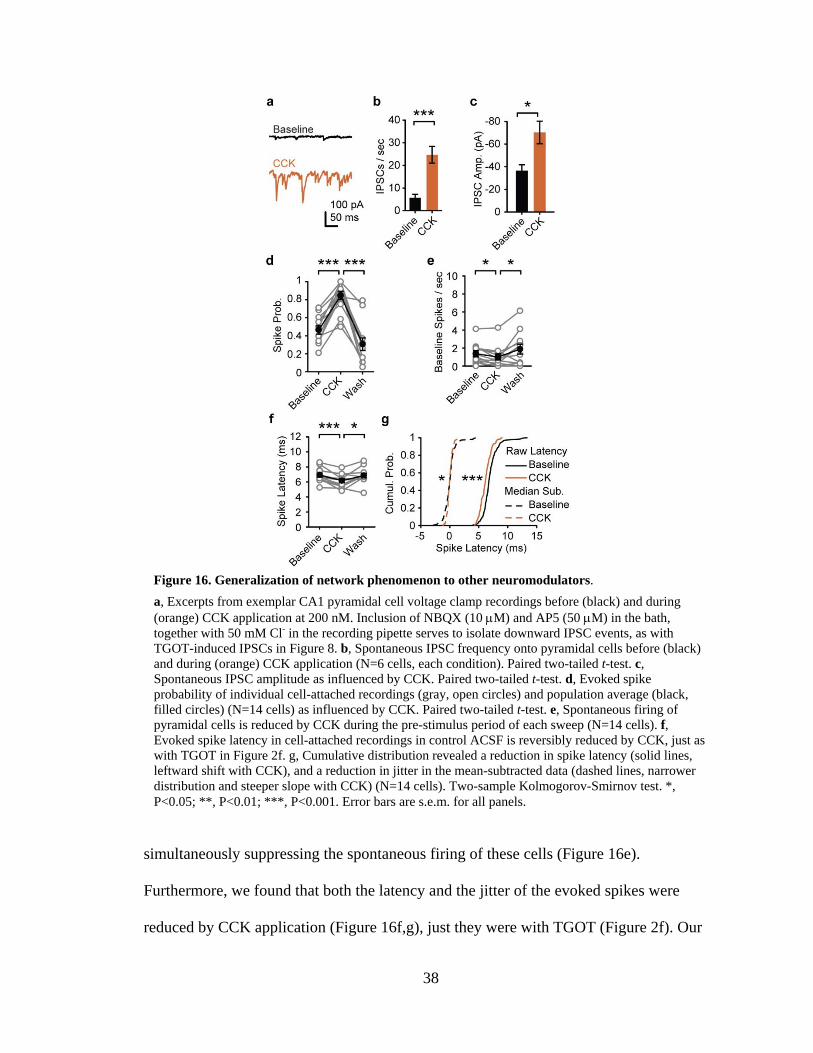
38
simultaneously suppressing the spontaneous firing of these cells (Figure 16e).
Furthermore, we found that both the latency and the jitter of the evoked spikes were
reduced by CCK application (Figure 16f,g), just they were with TGOT (Figure 2f). Our
Figure 16. Generalization of network phenomenon to other neuromodulators.
a, Excerpts from exemplar CA1 pyramidal cell voltage clamp recordings before (black) and during (orange) CCK application at 200 nM. Inclusion of NBQX (10 M) and AP5 (50 M) in the bath, together with 50 mM Cl- in the recording pipette serves to isolate downward IPSC events, as with TGOT-induced IPSCs in Figure 8. b, Spontaneous IPSC frequency onto pyramidal cells before (black) and during (orange) CCK application (N=6 cells, each condition). Paired two-tailed t-test. c, Spontaneous IPSC amplitude as influenced by CCK. Paired two-tailed t-test. d, Evoked spike probability of individual cell-attached recordings (gray, open circles) and population average (black, filled circles) (N=14 cells) as influenced by CCK. Paired two-tailed t-test. e, Spontaneous firing of pyramidal cells is reduced by CCK during the pre-stimulus period of each sweep (N=14 cells). f, Evoked spike latency in cell-attached recordings in control ACSF is reversibly reduced by CCK, just as with TGOT in Figure 2f. g, Cumulative distribution revealed a reduction in spike latency (solid lines, leftward shift with CCK), and a reduction in jitter in the mean-subtracted data (dashed lines, narrower distribution and steeper slope with CCK) (N=14 cells). Two-sample Kolmogorov-Smirnov test. *, P<0.05; **, P<0.01; ***, P<0.001. Error bars are s.e.m. for all panels.

39
prediction was thus amply fulfilled, that use-dependent depression of fast-spiking basket
cell synapses can account for all of the changes in the circuit properties that we observe
with TGOT or CCK application.
Computer modeling of the link between TGOT-induced depression of inhibitory synapses
and EPSP-evoked spiking. The increased probability of evoked spikes, the reduced spike
latency, and the decreased jitter were striking consequences of TGOT application, even in
the light of use-dependent depression of fast-spiking synapses (Galarreta and Hestrin
1998; Kraushaar and Jonas 2000; Szabo, Holderith et al. 2010). To test our interpretation
of the biophysical mechanism underlying these phenomena, we constructed a computer
model to find out whether all of the effects could be accounted for as sequelae of the
TGOT-induced increase in interneuron activity. A simplified CA1 pyramidal cell,
consisting of a soma, a single dendritic branch and a single axonal branch was modeled in
the NEURON environment. On each simulated sweep, an EPSC in the dendrite was
followed with a 2 ms delay by an IPSC in both the soma and dendrite (Figure 17a). Under
baseline conditions, excitatory and inhibitory conductances were adjusted to allow the
membrane potential just to reach spike threshold, causing firing on half the trials.
Spontaneous IPSCs were randomly distributed throughout each sweep, and synaptic
variability was simulated by varying the amplitudes of the EPSC, the feed-forward IPSC
and the spontaneous IPSCs in a pseudo-random manner. In accordance with our findings,
we simulated TGOT application by (1) raising the rate of spontaneous IPSCs onto the
soma from 5 to 35 Hz (Figure 8d), (2) doubling the amplitude of the spontaneous IPSCs
(Figure 8e), thereby mimicking the enhanced input from fast-spiking perisomatic-
targeting cells, and (3) reducing the evoked somatic IPSC to 60% of its basal value

40
Figure 17. Computer modeling of TGOT mechanism underlying EPSP-spike coupling effect.
a, Schematic of the computer model. A simplified CA1 pyramidal cell was simulated in NEURON with a single excitatory synapse onto a single dendritic projection, and with inhibitory synapses onto both the dendrite and the soma. b, Simulation of IPSP amplitude as influenced by TGOT. Bar plots represent results from the model under baseline (gray) and TGOT (red) conditions. Whole cell experimental data from Figure 7b reproduced here to permit direct comparison. c, Simulation of evoked spike probability as influenced by TGOT. Bar plots and symbols represent model and experimental data (reproduced from Figure 6c) respectively. d, Cumulative distribution of simulated evoked spike latencies from 500 iterations of the model under baseline (solid black line) and TGOT (solid red line) conditions reveal a TGOT-induced reduction in spike latency. Mean-subtracted cumulative distributions (dashed lines) demonstrate a narrower distribution of spike latencies in TGOT conditions, corresponding to reduced spike jitter. Two sample Kolmogorov-Smirnov test. ***, P<0.001. e, Simulated exemplar sweeps showing timing of spikes elicited by combined EPSC-IPSC conductances. Baseline conditions (black) are compared to conditions in which the EPSC is held constant but the IPSC is reduced to 60% (orange) or 0% (green) of its original level. f, Simulated exemplar sweeps in which the IPSC has been reduced from baseline (black) to 60% (orange) and 0% (green) of its original level, and the EPSC has then been lowered such that the combined EPSC-IPSC response is maintained just above the spike threshold. g, Simulated spike latency as a function of the residual IPSC depends on whether the EPSC is held constant at baseline levels (red) or reduced together with the IPSC to remain near spike threshold (gray). This plot was generated in the absence of any spontaneous IPSCs (see methods). h, Simulated influence of TGOT on evoked spike probability as a function of varying the delay between t(e), the onset of gEPSC, and t(i), the onset of gIPSC. Absolute values of gEPSC and gIPSC were varied for each latency value to set the baseline spike probability at 50%, while maintaining a fixed ratio of gEPSC/gIPSC=6 (see methods). i, Number of evoked spikes as a function of the residual IPSC. gEPSC held constant at baseline levels for panels i-l. j, Fraction of sweeps in which exactly one spike was evoked, plotted as a function of the residual IPSC. k, Jitter in the timing of the first evoked spike as a function of residual IPSC. l, Timing jitter of all evoked spikes as a function of residual IPSC fraction.

41
(Figure 7c,d), in accordance with the use-dependent depression of the fast-spiking
synapses (Figure 12). These changes in spontaneous and evoked inhibition reduced the
evoked IPSP (Figure 17b) and increased the evoked spike probability (Figure 17c) in line
with our experimental observations. Furthermore, the model neuron displayed a
decreased spike latency and reduced jitter (Figure 17d), qualitatively similar to
experimentally observed actions of TGOT (Figure 2f) and CCK (Figure 16g). The model
therefore not only supported the idea that changes in spontaneous and evoked inhibition
were sufficient to explain the enhancements of evoked transmission and spike timing, but
also allowed us to investigate their biophysical underpinnings.
First, we sought to understand why a TGOT-induced decrease in feed-forward inhibition
shrinks evoked spike latency and jitter, in apparent conflict with the idea that feed-
forward inhibition enforces sharp spike timing (Buzsaki and Eidelberg 1981; Buzsaki
1984; Pouille and Scanziani 2001). This issue is clarified by considering the combined
influence of the EPSC and IPSC conductances on membrane voltage near the spike firing
threshold (Figure 17e,g). A reduction in the IPSC conductance (gIPSC) allows an unaltered
EPSC conductance (gEPSC) to push the membrane potential up to the spike firing
threshold more quickly and precisely (Figure 17e,g), as well as more reliably (Figure
17c). If the EPSC is, in contrast, reduced to nearly the same degree as the IPSC in order
to bring the EPSC-IPSC combination back to threshold (Pouille and Scanziani 2001), the
simulated spikes arrive with longer latencies and increased jitter relative to basal
conditions (Figure 17f,g). We also undertook a systematic variation of the delay between
the onset of gEPSC and gIPSC to less or more than the 2 ms delay implemented in the rest of
the modeling. The TGOT-induced increase in EPSC-spike coupling persisted as long as

42
the IPSC onset occurred well before the postsynaptic membrane reached the spike firing
threshold (Figure 17h).
Finally, we focused on functional consequences of the strikingly incomplete depression
of the fast-spiking synapses (Figure 12c) with further modeling (Figure 17i-l). Despite
the rapid onset of depression, a residual IPSC persisted even up to the end of 10 s trains
at the highest TGOT-induced frequency (Figure 12d). The functional consequences of the
residual IPSC were addressed in our model by relating the number of evoked pyramidal
spikes to the fractional amplitude of the residuum (Figure 17i). In the extreme case of
complete elimination of feed-forward inhibition, the unopposed EPSCs give rise to
multiple spikes spread over a considerable interval (Figure 17e,i, Figure 18) as confirmed
by our own observations with bicucculine blockade of GABA receptors (Data not
Figure 18. Exemplar sweeps from simulation demonstrate importance of residual IPSC.
Exemplar sweeps from the simulation that generated the plots in Figure 17i-l. Residual IPSC is reduced to a defined percentage of its baseline level, while the EPSC is held constant and the rate and amplitude of spontaneous IPSCs is enhanced as described (see methods). Note that when the residual IPSC is reduced to 0% of its baseline level, every sweep results in at least 2-3 evoked spikes with the later spikes occurring at highly variable times. Residual IPSC values between 40%-80% result in reliable transmission of a single spike. Maintaining a residual IPSC 100% of the original results in a spike transmission just below 50% because of the increase in spontaneous inhibition associated with TGOT.
43
shown). Retention of 40-80% of the original IPSC ensured reliable transmission of a
single spike, but IPSC reduction below 40% allowed multiple postsynaptic spikes.
Residual IPSC fractions greater than 80% resulted in a growing number of spike
transmission failures (Figure 17i, Figure 18). Thus, if the fidelity of spike transmission is
operationally defined as the fraction of sweeps containing precisely one postsynaptic
spike, maximal fidelity was found over a range of residual IPSCs centered on 60%, the
Figure 19. Simulation of GABAA driving force influence on spike probability and timing.
a, Cumulative probability of spike latency calculated by the computer model for different GABAA reversal potentials reveals a progressive reduction in spike latency (leftward shift of curves) with increasing inhibitory driving force (more hyperpolarized reversal potentials, displayed above axis in mV). As described in methods, the ratio of GABA to AMPA conductance in each condition was held at a fixed value of 6 and the values of both conductances were set just to exceed the empirically determined spike threshold under baseline conditions. b, Mean-subtracted data from panel a reveal progressively enhanced spike timing precision (steeper curves) with increased inhibitory driving force. c, Increasing inhibitory driving force in the model increases the evoked IPSP amplitude under baseline (black) and TGOT (red) conditions, and also enhances the difference between TGOT and baseline IPSP amplitudes. Parameters were modified as previously described to simulate TGOT application. d, The effect of simulated TGOT application on evoked spike probability persists across a range of inhibitory driving forces. e, Cumulative probability of spike latency as influenced by TGOT in the model. TGOT reduces evoked spike latency independently of whether the simulation includes a large GABAA driving force (-110 mV, comparable to whole cell recordings) or a small GABAA driving force (-80 mV, near the resting membrane potential). Two-sample Kolmogorov-Smirnov test. f, Mean-subtracted data from panel e for the reduced GABAA driving force (-80 mV reversal) reveal a sharpening of spike timing precision with TGOT. Two-sample Kolmogorov-Smirnov test. g, Mean subtracted data from panel e for a large GABAA driving force (-110 mV reversal) reveal a modest sharpening of spike timing precision. Two-sample Kolmogorov-Smirnov test. ***; P<0.001.

44
value we observed experimentally with TGOT application (Figure 7c,d). Likewise, a
residual IPSC of 50-60% was optimal in considerations of global spike jitter (variance in
timing computed by lumping all spikes together, Figure 17l) whereas the jitter of the first
spike alone decreased monotonically as the residual IPSC was lowered (Figure 17k).
Thus, the empirically observed features of the TGOT response in interneurons seem well-
suited in several respects to retuning of overall circuit performance.
Having used our model to confirm our mechanistic interpretation of the primary effect of
TGOT on EPSP-spike coupling, we set about using the same model to understand the
modest differences in spike timing between our whole cell and cell-attached recordings.
The whole cell current clamp recordings used to probe EPSP-spike coupling in this study
were performed using a low (2 mM) internal Cl- concentration. We chose this
concentration to increase the driving force for Cl- and enhance our ability to measure
TGOT-induced changes in the GABAA-mediated feed-forward IPSP (Figure 7). An
inevitable consequence of the enhanced inhibitory driving force, however, is a narrowing
of the window of membrane depolarization following synaptic stimulation. Our modeling
of the EPSP-spike coupling transformation across a range of Cl- driving forces (Figure
19) agrees with our experimental observations (Figure 2 compared to Figure 6), that the
narrowing of this depolarization window results in a reduction of spike latency and a
sharpening of spike timing, without impairing the enhancement of evoked spike
probability or the sharpening of evoked spike timing induced by TGOT.
45
Summary
In addition to reducing the evoked inhibitory transmission, we find that TGOT enhances
the inhibitory tone in the CA1 microcircuit by increasing the spontaneous firing of fast-
spiking interneurons. The heightened activity of the fast-spiking interneurons induces a
robust, but incomplete use-dependent synaptic depression. Because fast-spiking
interneurons are the primary source of feed-forward inhibition, a depression of their
output synapses reduces the feed-forward IPSP and accounts for the enhanced feed-
forward spike transmission that we observe with TGOT (Figure 2). The residual synaptic
efficacy at fast-spiking synapses is sufficient to maintain an enhanced inhibitory tone
onto pyramidal cells and suppress their spontaneous activity over several minutes of
oxytocin signaling. Our computer model confirms that the reduction in feed-forward
inhibition can account for the changes we observe in both evoked spike probability and
timing.
46
CHAPTER 4:
Spontaneous hippocampal oscillations are modulated by oxytocin
We can learn a tremendous amount about the brain by examining the inputs and outputs
of individual neurons, as well as by studying in detail the way in which each neuronal
subtype responds to physiological and non-physiological stimuli. In the end, however,
these isolated neuronal operations must be placed in the context of larger circuit
operations if we are to understand their implications for behavior or disease.
Simultaneous intracellular recordings from dozens of neurons, however, are
experimentally impractical. More tractable approaches to monitoring individual cells
within circuit operations are often based either on extracellular electrophysiological
recordings, or on imaging of calcium- or voltage-sensitive dyes loaded into neuronal
populations. The electrophysiological approach lacks the spatial resolution of the imaging
method, but boasts significantly better time resolution for tracking neuronal spiking
activity. In addition, extracellular recording techniques are well suited to monitor
organized oscillations among large ensembles of neurons with a sensitivity and time
resolution that is impossible using current imaging methods.
Mammalian neural circuitry exhibits an exceptionally broad range of oscillatory
behaviors ranging from ultra-slow (~0.01 Hz) to ultra-fast (~400 Hz) rhythms (Buzsaki
and Draguhn 2004). These oscillations have each been linked to specific neural
computations and behavioral contexts such as attention, sleep, object binding, memory
formation, memory recall and memory consolidation. Each oscillation is maintained by a
distinct set of cellular, synaptic, electrical and chemical mechanisms, but a common
theme running through many oscillation types is the interaction between excitatory and

47
inhibitory circuitry. Elegant and painstaking work in vivo has linked the selective
recruitment of fast-spiking interneuron subtypes to three of the most prominent and well-
studied oscillations in the hippocampus: the theta (6-12 Hz), gamma (40-80 Hz) and
ripple (150-250 Hz) oscillations (Klausberger, Marton et al. 2005; Klausberger and
Somogyi 2008). The selectivity of TGOT for fast-spiking neurons, together with the role
of fast-spiking neurons in neural oscillations, raises the immediate question of how
TGOT influences these oscillations. Under appropriate experimental conditions, acute
hippocampal slices exhibit in vitro correlates of many of these oscillations. Using an in
vitro preparation to study these phenomena renders them amenable to physiological and
pharmacological interventions that can be difficult to employ in vivo. Accordingly, we
modified our recording system to study the influence of TGOT on many simultaneously
recorded neurons while at the same time monitoring the oscillatory behavior in the
hippocampal slice.
Results
We first adapted tetrode recordings, a technique most often used in vivo for behavioral
experiments (Buzsaki 2004) but whose utility in slice recordings has also been
demonstrated (Hempel, Sugino et al. 2002), to our system in order to record activity from
populations of neurons in an acute slice preparation. A tetrode consists of four ultrafine
wires that have either been microfabricated, or twisted tightly together. When the tetrode
is inserted into brain tissue, action potentials fired by any neuron within approximately
50-150 m (Buzsaki 2004) will tend to draw current slightly differently from each of the
four wires of the tetrode. Accordingly, the shape of spikes fired by each neuron in the
vicinity of the tetrode will bear a unique signature across the four channels of the tetrode,

48
allowing individual spikes from concurrently recorded activity of many neurons to be
assigned reliably to the neuron that generated them (Harris, Henze et al. 2000).
TGOT-induced spiking and unitary field potentials detected by tetrode recordings. Based
on our finding that TGOT increases the firing rate of the fast-spiking basket cells, whose
somata are predominantly located in the pyramidal cell layer, we expected that
extracellular multielectrode recording from this subregion of our hippocampal slices
would reveal changes in neuronal activity. Indeed, we saw a dramatic TGOT-induced
shift in spontaneous activity on recordings from tetrodes placed in the CA1 pyramidal
cell layer of acute slices. The most pronounced feature was the increase in spiking
activity (sharp, downward events in Figure 20) (Muhlethaler, Charpak et al. 1984;
Zaninetti and Raggenbass 2000). In addition to the increased spiking, however, we also
observed an increase in the frequency of broader, upward “unitary field potentials”
(Figure 20b, arrows). These events follow action potentials from perisomatic-targeting
interneurons (Glickfeld, Roberts et al. 2009; Bazelot, Dinocourt et al. 2010) and arise
from the large number of highly concentrated and extremely potent synapses formed by
Figure 20. Tetrode recording of TGOT administration.
a, Exemplar traces from a tetrode recording from the CA1 stratum pyramidale before TGOT application, b, during TGOT application at 200 nM, and c, following TGOT washout. Note the increase in spkes (sharp, downward events) and unitary field potentials (broad, upward events, indicated by arrows) with TGOT application. Scale bar 250 V, 50 ms.

49
these cells onto the somata of their pyramidal cell targets. The increase in these field
events is therefore consistent with an increase in spontaneous firing of fast-spiking basket
cells.
Differential responses to TGOT by putative pyramidal cells and interneurons on tetrode
recordings. We went on to characterize the firing of individual neurons in these
recordings by using well-validated techniques to cluster spikes based on waveform
characteristics (see methods). In agreement with the whole cell data reported above,
tetrode recordings from the pyramidal cell layer revealed a dramatic increase in the
activity of a subset of neurons (presumably fast-spiking interneurons) following TGOT
application (Figure 21, arrows). In several cases, other cells (presumably pyramidal cells)
recorded from the same tetrode showed a decrease in activity with TGOT application,
consistent with the TGOT-induced suppression of pyramidal cell spontaneous activity
described above (Muhlethaler, Charpak et al. 1984). The TGOT-induced changes in
neuronal activity could be entirely blocked by the oxytocin receptor antagonist OTA
(Figure 21b).
Tetrode recordings allow high-throughput comparison of single unit responses to
multiple neuromodulator types. The ability to record from multiple units simultaneously
opens the door to a high-throughput determination of how individual cells respond to a
variety of neuromodulatory influences. By exposing the slice to two successive TGOT
applications, spaced 20 min apart (e.g. Figure 21a) we can plot the change in firing rate
for each cell in response to the first application, against the response to the second
application (Figure 22a). In this case, the responses are either clustered near the origin
(indicating little response to either application of the peptide) or along a diagonal with a

50
slope of approximately 1 (indicating robust, and nearly equivalent responses to
successive TGOT applications) (Figure 22a, arrows). By contrast, if the second TGOT
application takes place in the presence of the oxytocin receptor antagonist (OTA), the
responses lie near the origin (indicating no response), or along the x-axis (indicating a
response to TGOT alone, but not in the presence of OTA) (Figure 22b, arrowheads). The
Figure 21. Tetrode recordings from the CA1 pyramidal cell layer permit simultaneous observation of multiple cell responses to TGOT application
a, Six individual cells respond to two successive applications of TGOT, spaced 20 min apart. The firing rate of putative pyramidal cells was either suppressed by TGOT (arrowheads) or unaffected. The firing rate of putative FS interneurons was dramatically increased by TGOT (arrows). b, Six simultaneously recorded cells from a tetrode confirm blockade of TGOT signaling by the oxytocin receptor antagonist OTA (1 M). Application of TGOT in control ACSF increased the firing of a putative FS interneuron (arrow) and suppressed the firing of putative pyramidal cells (arrowheads), but both effects were abolished in subsequent application of TGOT in the presence of OTA.
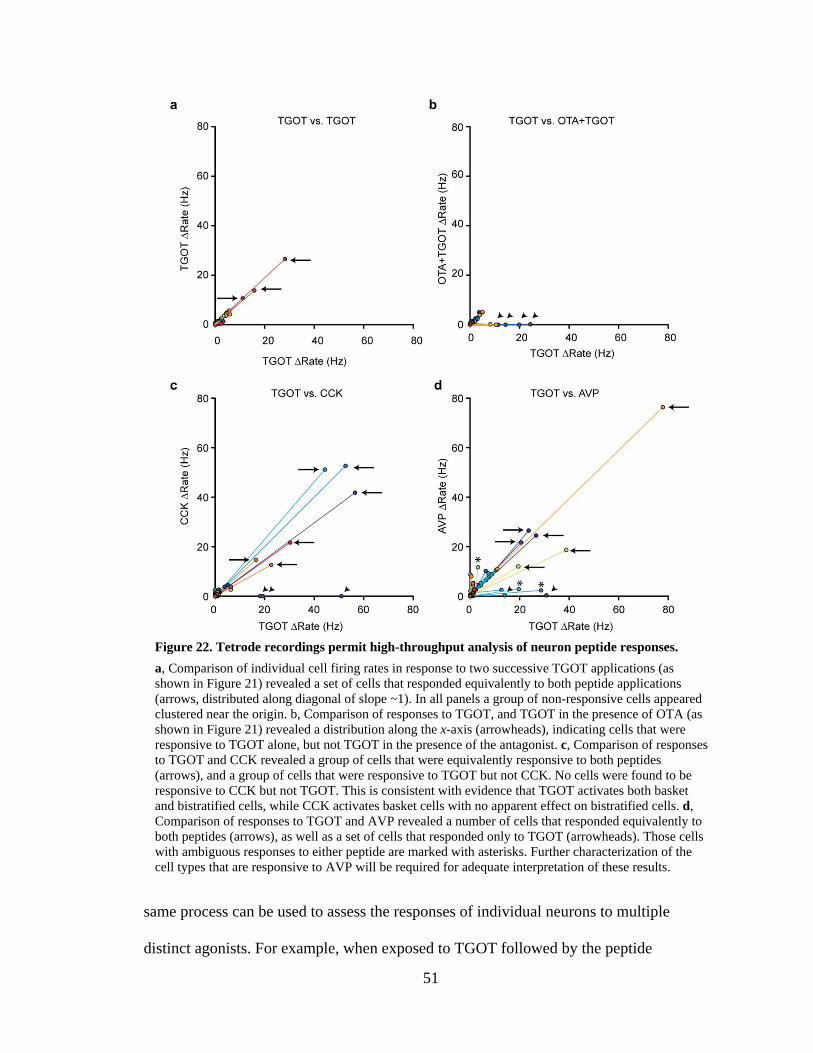
51
same process can be used to assess the responses of individual neurons to multiple
distinct agonists. For example, when exposed to TGOT followed by the peptide
Figure 22. Tetrode recordings permit high-throughput analysis of neuron peptide responses.
a, Comparison of individual cell firing rates in response to two successive TGOT applications (as shown in Figure 21) revealed a set of cells that responded equivalently to both peptide applications (arrows, distributed along diagonal of slope ~1). In all panels a group of non-responsive cells appeared clustered near the origin. b, Comparison of responses to TGOT, and TGOT in the presence of OTA (as shown in Figure 21) revealed a distribution along the x-axis (arrowheads), indicating cells that were responsive to TGOT alone, but not TGOT in the presence of the antagonist. c, Comparison of responses to TGOT and CCK revealed a group of cells that were equivalently responsive to both peptides (arrows), and a group of cells that were responsive to TGOT but not CCK. No cells were found to be responsive to CCK but not TGOT. This is consistent with evidence that TGOT activates both basket and bistratified cells, while CCK activates basket cells with no apparent effect on bistratified cells. d, Comparison of responses to TGOT and AVP revealed a number of cells that responded equivalently to both peptides (arrows), as well as a set of cells that responded only to TGOT (arrowheads). Those cells with ambiguous responses to either peptide are marked with asterisks. Further characterization of the cell types that are responsive to AVP will be required for adequate interpretation of these results.

52
cholecystokinin (CCK) (Figure 22c), the responses grouped (1) at the origin, (2) along a
slope of 1 (Figure 22c, arrows), or (3) along the x-axis (Figure 22c, arrowheads). These
results can be readily interpreted by comparing the cell-type specificity of TGOT (Figure
10) to that of CCK (Foldy, Lee et al. 2007; Lee, Foldy et al. 2011). Fast-spiking basket
cells are activated by both TGOT and CCK and have responses lying along a slope of
approximately 1 in this plot. In contrast, the responses of fast-spiking bistratified cells,
which are activated by TGOT but not by CCK, lie along the x-axis. Similarly, when
TGOT was followed by arginine vasopressin (AVP), we found some neurons clearly
responded to both peptides (Figure 22d, arrows), while others appeared to respond
selectively to TGOT (Figure 22d, arrowheads).
This technique has the benefit of being relatively high throughput, as 10-20 neurons can
be recorded simultaneously in a single slice. Additionally, the extracellular recording
technique avoids a potential experimental bias that can be inadvertently introduced by
targeted recordings: neurons on tetrode recrodings are selected based on whether their
spike shape can be readily distinguished from other cells in the slice, without regard to
cell shape, genetic profile, or other features that are commonly used to select cells for
whole cell or cell-attached recording. A potential drawback, however, is revealed in the
TGOT vs AVP experiment (Figure 22d). Some neurons show a robust response to one
peptide while also showing an ambiguous or diminished response to the other peptide
(Figure 22, asterisks). Still more problematically, when an otherwise relatively silent
neuron shows little or no firing in response to a peptide application, it is impossible to tell
whether that neuron was unaffected by the peptide, whether it may have been
hyperpolarized by the peptide, or whether it may have been depolarized but failed to
53
reach threshold. In addition, techniques to identify the cell type of tetrode-recorded
neurons are limited and not entirely reliable. For these reasons, this technique is valuable
as a relatively high-throughput screen to determine the types of neuronal responses that
may occur in a slice following peptide application, but the more laborious intracellular
recordings such as those employed above are critical for developing a complete and
unambiguous interpretation of the responses.
Power spectrum analysis provides additional insight into the effects of TGOT on
spontaneous network activity. In addition to information about the spiking activity of
individual neurons, tetrode recordings also provide a continuous local field potential
measurement of synchronized oscillatory activity among populations of neurons. The
activity of fast-spiking interneurons has been implicated in a number of network
oscillations, including the gamma (25-80 Hz) and ripple (150-250 Hz) oscillations
(Klausberger, Marton et al. 2005; Klausberger and Somogyi 2008). Power spectrum
analysis, as used in Figure 15 to verify the presence of a kainate-induced gamma
oscillation, is an effective tool to discriminate between the dominant modes of oscillation
in different experimental conditions. The frequency range from 10 Hz to 500 Hz in our
tetrode recordings was dominated by organized rhythmic activity among populations of
neurons in the slice, while the power above 500 Hz was primarily contributed by action
potentials from individual neurons which typically have a duration of ~1 ms. Low
frequency power (below 10 Hz) in our system was dominated by artifacts from the
perfusion system and the amplifier and was accordingly ignored in this analysis.
In the most conceptually straightforward case, we began by examining the effects of the
synaptic blockers NBQX (10 M), AP5 (50 M) and Picrotoxin (10 M) on the tetrode-
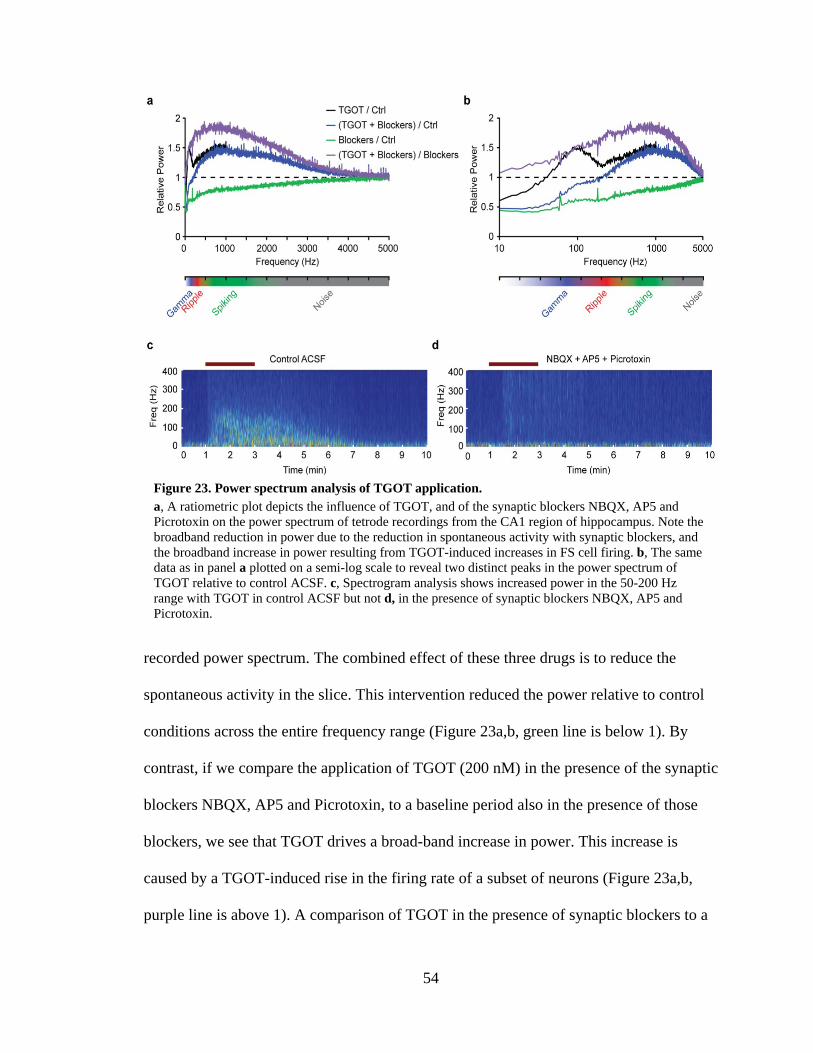
54
recorded power spectrum. The combined effect of these three drugs is to reduce the
spontaneous activity in the slice. This intervention reduced the power relative to control
conditions across the entire frequency range (Figure 23a,b, green line is below 1). By
contrast, if we compare the application of TGOT (200 nM) in the presence of the synaptic
blockers NBQX, AP5 and Picrotoxin, to a baseline period also in the presence of those
blockers, we see that TGOT drives a broad-band increase in power. This increase is
caused by a TGOT-induced rise in the firing rate of a subset of neurons (Figure 23a,b,
purple line is above 1). A comparison of TGOT in the presence of synaptic blockers to a
Figure 23. Power spectrum analysis of TGOT application. a, A ratiometric plot depicts the influence of TGOT, and of the synaptic blockers NBQX, AP5 and Picrotoxin on the power spectrum of tetrode recordings from the CA1 region of hippocampus. Note the broadband reduction in power due to the reduction in spontaneous activity with synaptic blockers, and the broadband increase in power resulting from TGOT-induced increases in FS cell firing. b, The same data as in panel a plotted on a semi-log scale to reveal two distinct peaks in the power spectrum of TGOT relative to control ACSF. c, Spectrogram analysis shows increased power in the 50-200 Hz range with TGOT in control ACSF but not d, in the presence of synaptic blockers NBQX, AP5 and Picrotoxin.

55
baseline in control ACSF without the blockers present, reveals that TGOT in the presence
of synaptic blockers increases the power in the higher frequency spiking range,
presumably due to increased activity of fast-spiking interneurons, while the power in the
lower frequency oscillatory range remains below control ACSF levels (Figure 23a,b, blue
line).
The most striking result comes from a comparison of TGOT application to control ACSF
when synaptic transmission is intact throughout (Figure 23a,b, black line). In this case,
we see a TGOT-induced increase in the spiking power (500-2000 Hz), similar to that
observed with synaptic blockers present. There emerges, however, a second peak in the
TGOT-induced power spectrum at 50-200 Hz, spanning between the frequency range of
the gamma and ripple bands (Figure 23b, compare black and blue lines). We can plot
these changes in power as a function of time, in the format of a spectrogram (Figure 23c).
As this plot reveals, when TGOT is applied in control ACSF, there is a relatively broad-
band increase in power below 200 Hz which does not arise when TGOT is applied in the
presence of the synaptic blockers NBQX, AP5 and Picrotoxin (Figure 23d). We attribute
this second peak in the relative power spectrum to the TGOT-induced increase in the
number of unitary field potentials on the tetrode recording (Figure 20b, arrows). Unitary
field potentials appear as upward deflections lasting 5-20 ms on an extracellular
recording in the hippocampal pyramidal layer, and will consequently increase the value
of the power spectrum in the 50-200 Hz range. It does not appear, however, that this
increase in 50-200 Hz power is caused by coherent oscillations at these frequencies. We
therefore conclude that even though activation of fast-spiking interneurons is a prominent
component of many modes of network oscillation (Klausberger, Marton et al. 2005;

56
Klausberger and Somogyi 2008), the TGOT-induced increase in the activity of these
neurons is not sufficient to induce a coherent oscillation under these conditions.
Tetrode recordings are well suited to study spontaneous Sharp-Wave Ripple (SPW-R)
events in the slice preparation. Having established the tools to record TGOT responses
from large populations of neurons in our slice preparation, we went on to test how TGOT
Figure 24. Exemplar Sharp-Wave Ripple (SPW-R) event from an acute slice recording
a, Four channels of a tetrode recording from the CA1 pyramidal cell layer. Scale bar 250 V (vertical), 20 ms (horizontal). b, Field potential recorded from the Schaffer Collateral pathway simultaneously with the tetrode recording in panel a. c, Spiking activity from 9 individual neurons recorded on the tetrode in panel a. Note that Cells #1 and #5 fire during the SPW-R event. d, Spectrogram of the tetrode recording shown in panel a. Note that the SPW-R event (middle) has both a low frequency component (<100 Hz), and a distinct higher frequency ripple oscillation at ~200 Hz.

57
influences ongoing spontaneous oscillations in the network. Having already found that
TGOT does not affect ongoing kainate-induced gamma oscillations in dorsal
hippocampal slices (Figure 15c,d), we set out to investigate its influence on the brief
population bursts of activity called “sharp waves.” These bursts are generally paired with
a characteristic, high frequency (150-250 Hz) oscillation of the electrical field potential in
the pyramidal cell layer called a “ripple” (Buzsaki 1986; Ylinen, Bragin et al. 1995; Diba
and Buzsaki 2007; Karlsson and Frank 2009). Together, the burst and the oscillation
make up a sharp-wave ripple (SPW-R) complex. SPW-R events are thought to play a
critical role in synchronizing multiple brain regions to facilitate information transfer.
With only minor modifications to the recording conditions, and without any exogenous
factors (see methods), acute hippocampal slices will produce spontaneous sharp-wave
ripple (SPW-R) oscillations (Bains, Longacher et al. 1999; Papatheodoropoulos and
Kostopoulos 2002; Wu, Shen et al. 2002; Maier, Nimmrich et al. 2003; Colgin, Kubota et
al. 2004; Behrens, van den Boom et al. 2005). These SPW-R events in the slice
preparation exhibit the same characteristic frequency (150-250 Hz) and time course (20-
100 ms duration) as SPW-R events recorded in vivo. The spatial profile of the SPW-R
field potential is similar between slice and in vivo recordings, with an upward deflection
in the pyramidal cell layer (Figure 24a) carrying the 150-250 Hz ripple oscillation (Figure
24d), and a downward deflection in the stratum radiatum carrying only low frequency
components (0-50 Hz) without any fast oscillation (Figure 24b).
Individual TGOT-responsive neurons are active during SPW-R events. Based on previous
reports that fast-spiking interneurons, the cells that are responsive to TGOT application,
are selectively active during SPW-R events (Klausberger, Marton et al. 2005;
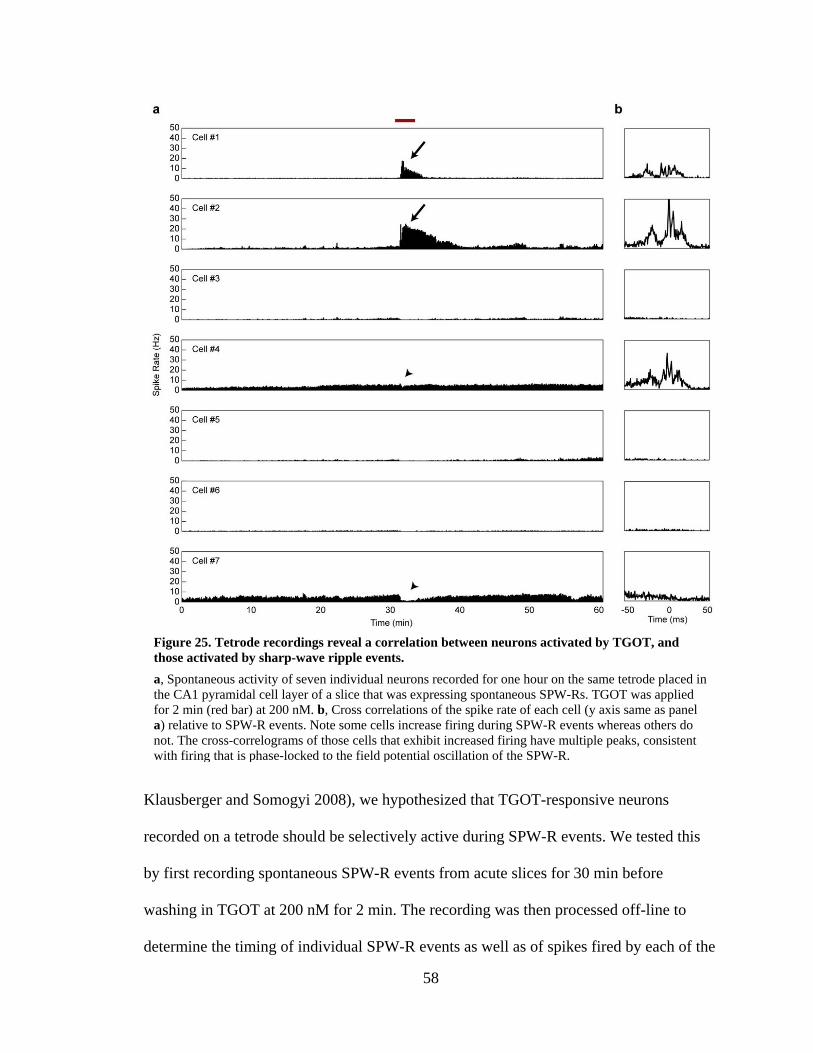
58
Klausberger and Somogyi 2008), we hypothesized that TGOT-responsive neurons
recorded on a tetrode should be selectively active during SPW-R events. We tested this
by first recording spontaneous SPW-R events from acute slices for 30 min before
washing in TGOT at 200 nM for 2 min. The recording was then processed off-line to
determine the timing of individual SPW-R events as well as of spikes fired by each of the
Figure 25. Tetrode recordings reveal a correlation between neurons activated by TGOT, and those activated by sharp-wave ripple events.
a, Spontaneous activity of seven individual neurons recorded for one hour on the same tetrode placed in the CA1 pyramidal cell layer of a slice that was expressing spontaneous SPW-Rs. TGOT was applied for 2 min (red bar) at 200 nM. b, Cross correlations of the spike rate of each cell (y axis same as panel a) relative to SPW-R events. Note some cells increase firing during SPW-R events whereas others do not. The cross-correlograms of those cells that exhibit increased firing have multiple peaks, consistent with firing that is phase-locked to the field potential oscillation of the SPW-R.
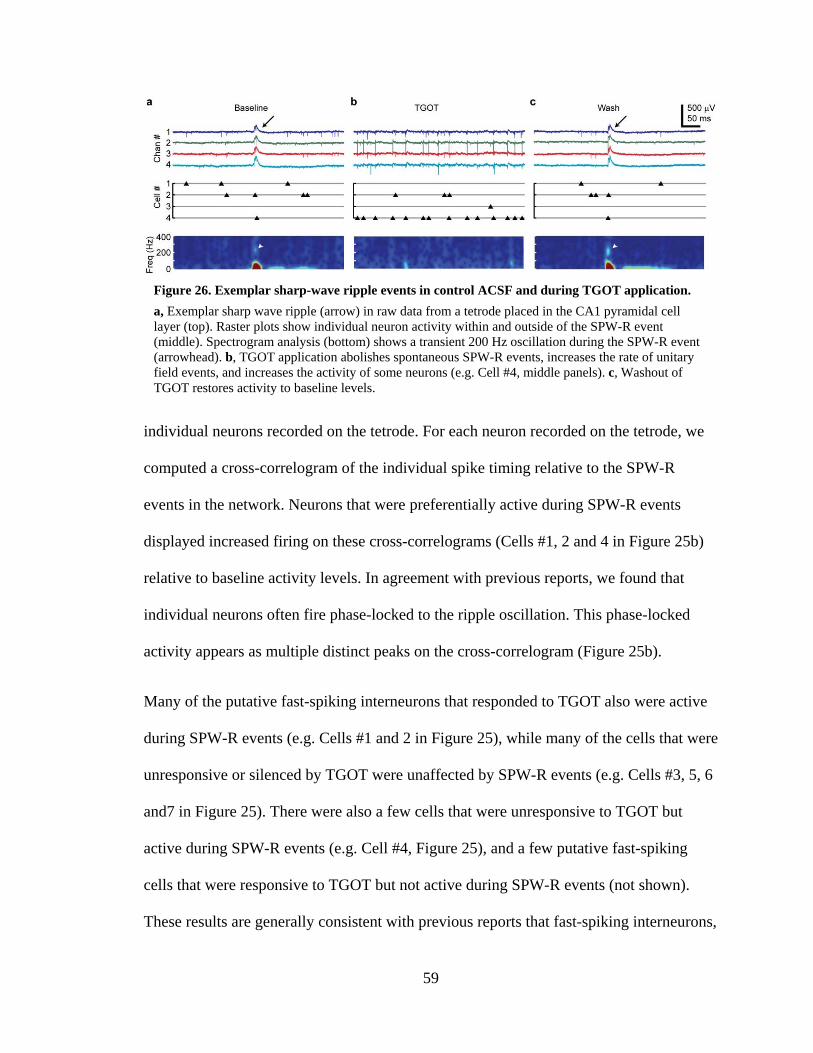
59
individual neurons recorded on the tetrode. For each neuron recorded on the tetrode, we
computed a cross-correlogram of the individual spike timing relative to the SPW-R
events in the network. Neurons that were preferentially active during SPW-R events
displayed increased firing on these cross-correlograms (Cells #1, 2 and 4 in Figure 25b)
relative to baseline activity levels. In agreement with previous reports, we found that
individual neurons often fire phase-locked to the ripple oscillation. This phase-locked
activity appears as multiple distinct peaks on the cross-correlogram (Figure 25b).
Many of the putative fast-spiking interneurons that responded to TGOT also were active
during SPW-R events (e.g. Cells #1 and 2 in Figure 25), while many of the cells that were
unresponsive or silenced by TGOT were unaffected by SPW-R events (e.g. Cells #3, 5, 6
and7 in Figure 25). There were also a few cells that were unresponsive to TGOT but
active during SPW-R events (e.g. Cell #4, Figure 25), and a few putative fast-spiking
cells that were responsive to TGOT but not active during SPW-R events (not shown).
These results are generally consistent with previous reports that fast-spiking interneurons,
Figure 26. Exemplar sharp-wave ripple events in control ACSF and during TGOT application.
a, Exemplar sharp wave ripple (arrow) in raw data from a tetrode placed in the CA1 pyramidal cell layer (top). Raster plots show individual neuron activity within and outside of the SPW-R event (middle). Spectrogram analysis (bottom) shows a transient 200 Hz oscillation during the SPW-R event (arrowhead). b, TGOT application abolishes spontaneous SPW-R events, increases the rate of unitary field events, and increases the activity of some neurons (e.g. Cell #4, middle panels). c, Washout of TGOT restores activity to baseline levels.
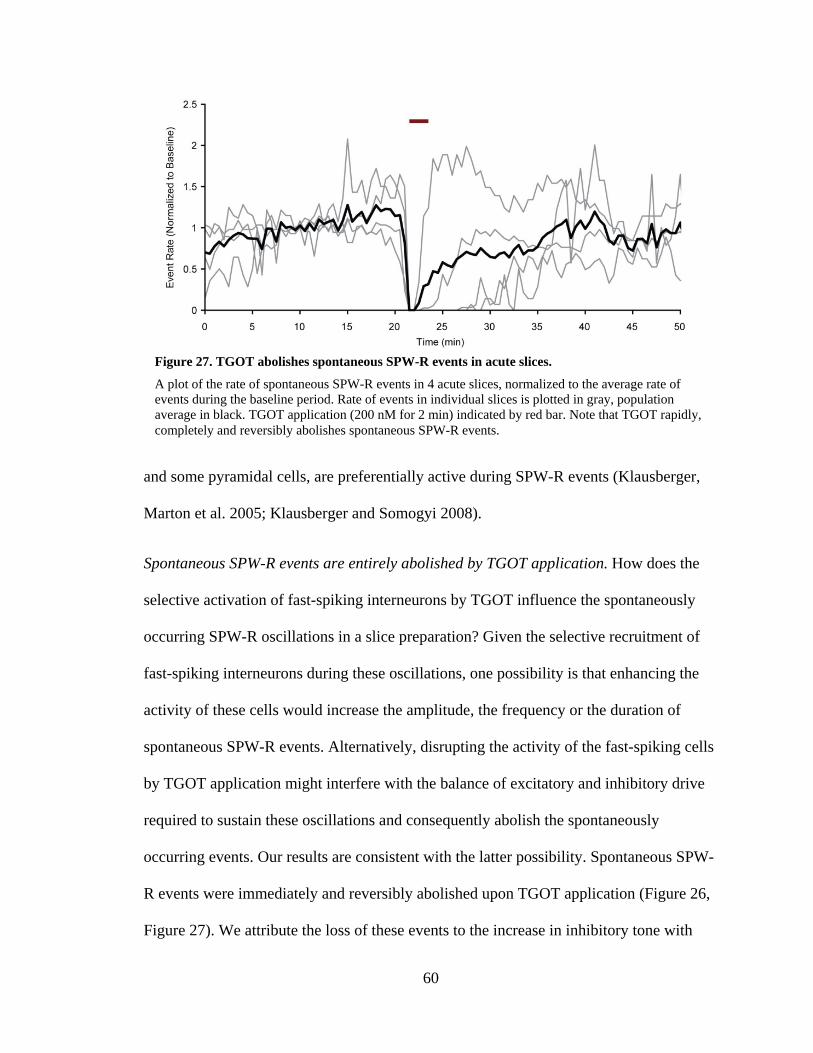
60
and some pyramidal cells, are preferentially active during SPW-R events (Klausberger,
Marton et al. 2005; Klausberger and Somogyi 2008).
Spontaneous SPW-R events are entirely abolished by TGOT application. How does the
selective activation of fast-spiking interneurons by TGOT influence the spontaneously
occurring SPW-R oscillations in a slice preparation? Given the selective recruitment of
fast-spiking interneurons during these oscillations, one possibility is that enhancing the
activity of these cells would increase the amplitude, the frequency or the duration of
spontaneous SPW-R events. Alternatively, disrupting the activity of the fast-spiking cells
by TGOT application might interfere with the balance of excitatory and inhibitory drive
required to sustain these oscillations and consequently abolish the spontaneously
occurring events. Our results are consistent with the latter possibility. Spontaneous SPW-
R events were immediately and reversibly abolished upon TGOT application (Figure 26,
Figure 27). We attribute the loss of these events to the increase in inhibitory tone with
Figure 27. TGOT abolishes spontaneous SPW-R events in acute slices.
A plot of the rate of spontaneous SPW-R events in 4 acute slices, normalized to the average rate of events during the baseline period. Rate of events in individual slices is plotted in gray, population average in black. TGOT application (200 nM for 2 min) indicated by red bar. Note that TGOT rapidly, completely and reversibly abolishes spontaneous SPW-R events.
61
TGOT application, which presumably lowers the overall level of excitatory activity in the
slice below the threshold required to support spontaneous oscillations.
Summary
Multielectrode recordings are readily able to detect a TGOT-induced increase in the
activity of putative fast-spiking interneurons in the CA1 pyramidal cell layer of acute
slices. This recording technique has the advantage of being able to detect network
population and field potential activity as well as single unit firing. We were able to use
this approach to study the effect of TGOT on physiologically relevant, spontaneously
occurring bursts of activity called Sharp-Wave Ripple (SPW-R) events in our acute slice
preparation. Consistent with our finding that TGOT activates fast-spiking interneurons,
and previous reports that these same interneuron classes are selectively activated by
SPW-R events (Klausberger, Marton et al. 2005; Klausberger and Somogyi 2008), we
found that many of the neurons activated by TGOT were also active during SPW-R
events (Figure 25). In spite of increasing the activity of many of the same neurons that
were active during SPW-R events, we found that TGOT completely abolished the
occurrence of these events (Figure 26, Figure 27).
62
CHAPTER 5: Conclusion
Oxytocin enhances signal-to-noise, consistent with a role as a salience cue in
hippocampal signaling. We set out to understand how increased oxytocin signaling,
which occurs in mothers following delivery (Neumann and Landgraf 1989; Keverne and
Kendrick 1992; Light, Smith et al. 2000; Levine, Zagoory-Sharon et al. 2007) or in
treatment for autism spectrum disorders (Guastella, Einfeld et al. 2010), can affect a
canonical hippocampal circuit. Evidence from behavioral studies with humans and
animals suggests that oxytocin may act as a salience cue by transiently enhancing
cognitive performance in socially relevant situations. Our data reveals that oxytocin
enhances the signal of feed-forward spike transmission, while simultaneously
suppressing the noise of spontaneous background activity.
We demonstrate a mechanism, rooted in synaptic physiology, by which oxytocin is able
to achieve this temporary improvement of hippocampal function. Oxytocin depolarizes
the fast-spiking interneurons without affecting other cell types in the hippocampus. The
enhanced inhibitory tone from the fast-spiking neurons suppresses the spontaneous
activity of the pyramidal cells, while at the same time inducing a use-dependent
depression at the fast-spiking to pyramidal cell synapse. This depression reduces the
feed-forward inhibition evoked by Schaffer Collateral stimulation and results in enhanced
feed-forward spike transmission in the pyramidal cells. The enhanced EPSP-spike
coupling provides a mechanistic framework that can reconcile evidence that oxytocin
receptor activation increases inhibition (Zaninetti and Raggenbass 2000) with previous
reports that oxytocin improves reference memory function and late-phase LTP
(Tomizawa, Iga et al. 2003).
63
Our results speak to the generic question of how a neuromodulator, delivered diffusely
and over an extended timescale, can precisely influence a rapid process like EPSP-spike
coupling that relies on finely tuned, sub-millisecond kinetics. TGOT not only enhances
the probability of evoking a spike, it also sharpens the timing of that spike. Our computer
model (Figure 17, Figure 19) revealed that both of these effects can be accounted for
entirely by the TGOT-induced suppression of evoked feed-forward inhibition.
Little is known about the exact spatial and temporal dynamics of oxytocin release in vivo.
The rapid onset (tau ~60 ms) and incompleteness (residual averaging ~35%) of the
depression at fast-spiking synapses, however, indicates that these synapses are ideally
suited to shift the dynamics of the circuit swiftly in response to oxytocin, whether
delivered quickly and focally as in synaptic release (Buijs and Swaab 1979), or diffusely
administered at low doses as in volume transmission (Neumann and Landgraf 1989;
Keverne and Kendrick 1992; Veening, de Jong et al. 2010). The time course with which
TGOT enhanced the evoked spike probability (Figure 2b) was nearly as rapid as its action
depolarizing individual fast-spiking neurons (Figure 9b). The onset of both effects was
likely limited by the rate of peptide agonist diffusion into the slice. The close agreement
in the kinetics of these responses is to be expected from the rapid onset of use-dependent
depression at the synapse between fast-spiking interneurons and pyramidal cells (Figure
12) (Galarreta and Hestrin 1998; Kraushaar and Jonas 2000; Szabo, Holderith et al.
2010).
By sparing the regular-spiking neurons and incompletely suppressing the fast-spiking
synapses, oxytocin signaling avoids the dangers associated with a complete loss of
inhibitory transmission, such as impaired spike timing precision (Figure 5) (Pouille and
64
Scanziani 2001) and epileptogenesis. Indeed, the benefits of retaining a prominent
residual IPSC were clearly elucidated by our computer model (Figure 17i-l). The net
result is an elegant two-for-one effect: the single action of TGOT in depolarizing fast-
spiking cells both suppresses the spontaneous background activity and enhances the
evoked responses of CA1 pyramidal cells. Together, these two effects serve to enhance
the signal-to-noise of the CA1 pyramidal cell responses.
The mechanism by which a reduction of inhibition sharpens spike timing. Sharpening of
spike timing precision is hypothesized to be a chief role of feed-forward inhibition. In
support of this view, and in agreement with previous reports (Pouille and Scanziani
2001), we found that abolishing GABAA-mediated synaptic inhibition with bicuculline
greatly increased the average latency and the jitter of evoked spikes (Figure 5). Although
TGOT partially suppressed the evoked IPSP, our results revealed a reduction in spike
latency and a modest sharpening of spike timing precision (Figure 2, Figure 6). Why
does the reduced IPSP in TGOT not lead to increased spike latency and jitter as it did in
bicuculline? For bicuculline recordings, we used stimulus intensities that were
significantly lower than those used for control recordings in order to maintain the evoked
spike probability of each cell at approximately 50% in the absence of GABAA-mediated
inhibition. In contrast, the stimulus intensity was held constant when TGOT was applied,
even as TGOT reduced the evoked inhibitory current. As demonstrated by our computer
model, the net effect of TGOT was thus to allow the membrane potential to reach
threshold faster, increasing the evoked spike probability while simultaneously reducing
spike latency and jitter.
65
Comparison to other neuromodulators. The use-dependent nature of the fast-spiking
neuron synaptic depression provides an elegant way of yoking together oxytocin
receptor-driven firing of select inhibitory interneurons (leading to decreased background
noise in pyramidal cells) and an enhancement of circuit throughput (increased signal
transmission via the same principal cells). This mechanistically efficient usage of tonic
firing and use-dependent depression at inhibitory synapses is likely to generalize to other
neuromodulators and neural circuits, possibly even constituting one of the most important
purposes of short-term plasticity at these synapses.
There is a striking similarity between TGOT and the vasoactive gastrointestinal peptide
Cholecystokinin (CCK), in that both peptides are primarily present in the periphery but
nevertheless have important actions in the brain that are largely independent of their roles
outside of the nervous system. The primary function of CCK is in the gastrointestinal
system, but like TGOT it potently activates a subset of interneurons in the hippocampus.
While TGOT depolarizes both fast-spiking perisomatic-targeting and fast-spiking
bistratified cells, the actions of CCK are restricted to depolarization of the fast-spiking
perisomatic-targeting cells, without an appreciable effect on fast-spiking bistratified cells
(Foldy, Lee et al. 2007; Lee, Foldy et al. 2011). Strikingly, we have found that CCK
recapitulates all of the major network effects of TGOT in this assay, including (1)
enhancing inhibitory tone, (2) suppressing spontaneous firing of CA1 pyramidal cells, (3)
increasing the fidelity of feed-forward spike transmission and (4) sharpening the evoked
spike timing (Figure 16).
Other neuromodulatory peptides have been shown to have disinhibitory effects, both
within the hippocampus and in other brain regions. The opioid receptor agonist

66
enkephalin, for example, was found to hyperpolarize multiple interneuron subtypes in the
CA1 region of hippocampus, including parvalbumin-positive basket cells and
somatostatin-positive O.-L.M. cells (Madison and Nicoll 1988; Cohen, Doze et al. 1992;
Lupica, Proctor et al. 1992; Capogna, Gahwiler et al. 1993; Svoboda and Lupica 1998;
Svoboda, Adams et al. 1999; Drake and Milner 2002; McQuiston and Saggau 2003). The
result is an increased propagation of excitatory signals through CA1 pyramidal cells
(Masukawa and Prince 1982; McQuiston and Saggau 2003), resembling the enhanced
EPSP-spike coupling we observed with oxytocin receptor activation. Opioid receptor
activation, however, reduces the level of tonic inhibition onto CA1 pyramidal cells
(Nicoll, Alger et al. 1980; Cohen, Doze et al. 1992; Lupica 1995), unlike the dramatic
increase in rate and amplitude of spontaneous IPSCs during TGOT or CCK application
(Figure 8) (Muhlethaler, Charpak et al. 1984; Zaninetti and Raggenbass 2000). Thus,
opioids appear to increase both signal and noise non-selectively, whereas oxytocin or
CCK receptor activation selectively increases signal while dampening noise.
The -adrenergic receptor agonist norepinephrine (NE) has also been shown to have a
disinhibitory effect on CA1 pyramidal cells in the hippocampus, enhancing EPSP-spike
coupling in CA1 pyramidal neurons (Madison and Nicoll 1988; Doze, Cohen et al. 1991).
Activation of -adrenergic receptors has a widespread influence on both excitatory and
inhibitory neurons in hippocampus, however, and this direct effect on local interneurons
is just one of a diverse set of actions (Madison and Nicoll 1986; Madison and Nicoll
1986; Madison and Nicoll 1988; Doze, Cohen et al. 1991; Bergles, Doze et al. 1996). In
contrast, the actions of TGOT appear restricted to the local interneuron circuitry: when
GABAA transmission was blocked with bicuculline, we observed no TGOT-induced

67
change in EPSP-spike coupling (Figure 5) or in pyramidal cell holding current or input
resistance (Figure 4). Our observation that TGOT has no direct electrical effect on CA1
pyramidal neurons agrees with previous reports (Muhlethaler, Sawyer et al. 1983;
Muhlethaler, Charpak et al. 1984; Zaninetti and Raggenbass 2000), and fits with sparse
genetic labeling of oxytocin receptor-expressing cells in the hippocampal pyramidal cell
layer (Yoshida, Takayanagi et al. 2009). The conclusion from these results is that
pyramidal cells likely do not express oxytocin receptors.
In contrast to the selective effect of TGOT on fast-spiking interneurons, norepinephrine
increased the firing rate of both regular- and fast-spiking interneurons in CA1 (Madison
and Nicoll 1988; Doze, Cohen et al. 1991; Bergles, Doze et al. 1996). Additionally,
norepinephrine was reported to spare monosynaptically evoked IPSCs while reducing
evoked disynaptic IPSCs, a pattern that was attributed to diminished excitation of local
interneurons (Doze, Cohen et al. 1991). It would be worthwhile to reexamine the effects
of norepinephrine on evoked hippocampal IPSCs in light of our experience with oxytocin
receptor activation. Use-dependent depression at the interneuron to pyramidal cell
synapse would likely be an inescapable consequence of the norepinephrine-induced
increases in interneuron firing rates (Bergles, Doze et al. 1996). Paired recordings (e.g.
Figure 12) could determine how much of the norepinephrine-induced suppression of the
evoked IPSC might be attributed to use-dependent depression at the interneuron to
pyramidal cell synapse, in addition to decreased excitation of the interneurons (Doze,
Cohen et al. 1991).
It is possible that both TGOT and norepinephrine may suppress IPSC amplitude through
similar mechanisms. The monosynaptic IPSCs in this study were evoked using a
68
stimulating electrode placed in the pyramidal cell layer, which produced synaptic
responses that presumably arose primarily from perisomatic-targeting interneurons; by
contrast, Doze et al. evoked monosynaptic IPSPs using stimulating electrodes placed
either in the stratum oriens or the stratum radiatum. Stimulation in these layers would
evoke synaptic responses arising primarily from dendritically targeting interneurons,
some of which show less robust use-dependent synaptic depression than perisomatic-
targeting cell types (Maccaferri, Roberts et al. 2000). It is possible, therefore, that the
depression of the disynaptic feed-forward IPSP induced by norepinephrine arose from
use-dependent depression at perisomatic-targeting inhibitory synapses which exhibit high
levels of short-term depression (Kraushaar and Jonas 2000; Maccaferri, Roberts et al.
2000; Glickfeld and Scanziani 2006; Szabo, Holderith et al. 2010) but which would not
be activated efficiently by the oriens or radiatum stimulation used in previous studies
(Doze, Cohen et al. 1991).
It is also interesting to compare our findings in hippocampus with an action of
norepinephrine in a different pathway: at the synaptic outputs of cartwheel cells, an
interneuron subtype in the auditory brainstem. Kuo and Trussell found that
norepinephrine hyperpolarizes cartwheel cells, dampening their spontaneous firing and
relieving basal synaptic depression at their output synapses, thereby enlarging evoked
transmission (Kuo and Trussell 2011). Each of these outcomes is diametrically opposite
to the action of TGOT on hippocampal interneurons, but nevertheless results in a
norepinephrine-induced enhancement of signal-to-noise in the auditory pathway. This
enhancement takes place entirely at a single synapse rather than distributed across a local
circuit, as the neuromodulator hyperpolarizes the presynaptic inhibitory cell and relieves
69
depression, rather than the other way around. Despite wide differences in the
experimental preparation and in the polarity of the effects, both systems share the
common feature that neuromodulatory control of interneuron activity can regulate
network dynamics through use-dependent synaptic depression. It would be interesting to
determine whether this mechanism of tonic interneuron activity and use-dependent
depression of inhibitory synapses is generally useful for regulating circuit throughput in
other regions of the brain.
There may also be a functional link between oxytocin and these other neuromodulators.
Intracerebroventricular injection of oxytocin in sheep stimulates release of
norepinephrine in the medial preoptic area and ventromedial hypothalamus, suggesting
that the oxytocin and noradrenergic systems may act synergistically (Kendrick and
Keverne 1992). Similarly, intracerebroventricular delivery of oxytocin in prairie voles
enhanced levels of preproenkephalin in the nucleus accumbens (Young, Lim et al. 2001)
and CCK administration has been linked to secretion of oxytocin in humans (Ohlsson,
Forsling et al. 2002) and in rats (Verbalis, McCann et al. 1986; Carter, Richardson et al.
2003).
Oxytocin in the human hippocampus. One study in humans reported a lack of oxytocin
receptor autoradiographic signal in the human hippocampus (Loup, Tribollet et al. 1991).
A lack of clear signal in a radioligand labeling assay does not necessarily mean a lack of
oxytocin signaling in this brain region, however. Indeed, a number of studies have
reported apparent mismatches between oxytocin fiber innervation of a brain region and
oxytocin receptor radioligand labeling in that circuit (Gimpl and Fahrenholz 2001). One
explanation for this disparity arises from observations that the oxytocin receptor is often

70
internalized when extracellular oxytocin levels are high. Indeed, in lactating rats with
high levels of oxytocin in the cerebrospinal fluid (CSF), very low levels of oxytocin
receptor binding were reported in the hypothalamus. When these animals were treated
with an oxytocin receptor antagonist, however, the oxytocin receptor radioligand signal
was rapidly enhanced, suggesting a negative feedback system in which elevated
extracellular oxytocin levels suppress the surface expression of oxytocin receptors
(Freund-Mercier, Stoeckel et al. 1994). While the oxytocin receptor is expressed in
mouse and rat hippocampus, some rodent species such as the guinea pig and hamster do
not have any hippocampal expression of the receptor (Gimpl and Fahrenholz 2001).
Further study will therefore be required to determine unambiguously whether oxytocin
receptors are expressed in the human hippocampus.
Autism, excitatory-inhibitory balance and brain rhythms. Our interest in hippocampal
oxytocin signaling originated from a desire to use oxytocin as a window into the etiology
of autism spectrum disorders. Autism spectrum disorders are caused by a complicated
and little understood set of environmental and genetic factors, making it difficult for
researchers to identify the primary causes of the disorder that are shared by all of its
many manifestations. Many of the genes that have been linked to autism, however,
appear to play a role in synapse formation and plasticity. This has led to the hypothesis
that autism might arise from an imbalance of excitation and inhibition in the brain
(Persico and Bourgeron 2006). Indeed, in one ambitious study in which novel optogenetic
tools were used to shift the excitatory-inhibitory balance in vivo, it was found that these
changes resulted in altered social behaviors in mice, consistent with an autism-like
phenotype (Yizhar, Fenno et al. 2011). Furthermore, these exogenously controlled shifts

71
in excitatory-inhibitory balance drove shifts in rhythmic activity that were consistent with
EEG recordings from autistic patients, and in line with the results presented here
following increased inhibition through TGOT application.
Several recent studies have implicated oxytocin signaling as an important component of
autism spectrum disorders (Wu, Jia et al. 2005; Jacob, Brune et al. 2007; Yrigollen, Han
et al. 2008). Our observation that oxytocin increases the inhibitory tone in the
hippocampus without directly affecting excitatory circuitry is especially interesting in
light of this excitation-inhibition imbalance hypothesis. A selective increase in inhibition
without a counterbalancing change in excitation would necessarily shift the excitatory-
inhibitory balance, perhaps underlying some of the behavioral deficits associated with
autism spectrum disorders.
The parvalbumin-positive fast-spiking cells that we find to be responsive to TGOT, have
also been implicated schizophrenia (Zhang and Reynolds 2002; Lodge, Behrens et al.
2009). Furthermore, oxytocin has been demonstrated to improve emotion recognition in
patients with schizophrenia (Averbeck, Bobin et al. 2011) much as it does in patients with
autism (Guastella, Einfeld et al. 2010), suggesting a possible common etiology and
treatment pathway between autism and schizophrenia. Interestingly, other genes such as
cacna1c, which encodes the L-type calcium channel, have also been linked both to
schizophrenia (Ripke, Sanders et al. 2011) and to disorders associated with autism
(Splawski, Timothy et al. 2004).
Consequences of oxytocin-induced silencing of SPW-R events. The complete abolishing
of spontaneous SPW-R events with TGOT application is a striking result, but further
72
experiments will be required before it can be interpreted adequately. An informative next
step will be to repeat the in vitro recordings of spontaneously occurring SPW-R events
with lower doses of TGOT. Our hypothesis is that TGOT application at a concentration
high enough to depolarize fast-spiking interneurons but low enough to avoid a significant
effect on fast-spiking cell firing rates (e.g. less than 1 nM, see Figure 9) may boost the
contribution of these interneurons to individual SPW-R events without shifting the tonic
excitatory-inhibitory balance enough to silence spontaneous SPW-R events altogether. In
this case, low concentrations of TGOT would be expected to enhance the amplitude of
SPW-R events, in contrast to the silencing of the events that we observed with higher
doses of the peptide.
Our in vitro results regarding SPW-R oscillations raise the question of what effect
oxytocin signaling has on SPW-R events in vivo? Are these events abolished as they are
in vitro? Multiple studies have linked SPW-R events in vivo to memory consolidation and
information transfer between brain regions (Lee and Wilson 2002; Girardeau,
Benchenane et al. 2009). It is possible that the transient SPW-R events, which often occur
in vivo during otherwise quiescent periods on hippocampal recordings, correspond to an
“off-line” brain state, in which the hippocampal network is performing “housekeeping”
tasks such as transmitting stored information to neighboring cortical areas for long-term
memory consolidation. By temporarily silencing these SPW-R events, oxytocin signaling
might bias the hippocampal circuit towards an “on-line” brain state that is more receptive
to receiving and storing information from the sensory systems and the outside world. This
idea fits with our empirical observation that TGOT suppresses SPW-R oscillations (an
“off-line” rhythm) without affecting gamma oscillations (an rhythm corresponding to an
73
“on-line” brain state). This hypothesis, however, requires further testing through in vivo
recording and behavioral experiments.
The enhancement in circuit and behavioral performance that we observe with oxytocin
raises an obvious question: if oxytocin is capable of improving circuit performance, why
is it not present in the system all of the time? One can re-phrase an analogous question to
ask: if a heightened state of EPSP-spike coupling is advantageous, why is the network not
always in a regime that permits this elevated level of feed-forward spike transmission?
Because the brain does not have infinite capacity to store every piece of information
taken in by the sensory systems over every moment of every day, the neural circuitry
responsible for memory storage, memory retrieval, sensory processing, and many other
processes must constantly balance which information to store, which information to pass
on to downstream systems, and which information to discard as noise. In this context,
there is an inherent value to molecular salience cues that are capable of shifting the
computational state of certain neural circuits according to specific behavioral contexts.
Based on our results, oxytocin is a candidate for such a salience cue in hippocampal
circuit processing. It is likely that oxytocin might perform a similar function in other
brain regions, possibly through a mechanism similar to the one we outline here for the
hippocampus. Furthermore, based on results from other neuromodulators such as
norepinephrine and CCK, we speculate that the mechanism we have uncovered for
oxytocin might apply to other modulators both inside and outside of the hippocampus in
response to a variety of behavioral contexts.

74
APPENDIX: Methods
Hippocampal slice preparation. All protocols were approved by the Institutional Animal
Care and use Committee of Stanford University. Hippocampi were dissected from p21-
p28 Sprague-Dawley rats of either sex in ice cold sucrose slice solution containing (in
mM) 206 Sucrose, 11 D-Glucose, 2.5 KCl, 1 NaH2PO4, 10 MgCl2, 2 CaCl2 and 26
NaHCO3. After being allowed to chill in sucrose for approximately 30 seconds,
hippocampi were transferred to a petri dish. The regular sucrose solution was removed,
and the hippocampi were arranged to lay flat, with CA1 upward and the dorsal edges
pointing slightly away from one another as described by Madison and Edson (Madison
and Edson 2001). The petri dish was placed on ice, and a warm liquid (34°C) sucrose
slicing solution supplemented with 1% Low Melting Point agarose was added slowly to
embed the hippocampi. This solution was allowed to cool on ice, and once the agarose
containing the hippocampi was set, it was removed from the petri dish and glued to the
stage of a Leica VT 1000S vibratome. Slices were cut at 300-400 m thickness using the
maximum amplitude, frequency setting of 9/10, and speed of 1.75/10. Slices were
transferred immediately to a submerged recovery chamber filled with warm (34°C)
artificial cerebro-spinal fluid (ACSF) containing (in mM) 122 NaCl, 3 KCl, 10 D-
Glucose, 1.25 NaH2PO4, 2 CaCl2, 1.3 MgCl2, 26 NaHCO3, 3 Na-Pyruvate, 2 Na-
Ascorbate and 5 L-Glutamine. For all experiments except those involving spontaneous
Sharp-Wave Ripple events the slices were allowed to recover for 1 h at 34ºC then
maintained at room temperature in the submerged chamber until recording 1-10 h after
slicing. Gender of animals did not significantly influence the effect of TGOT on EPSP-
spike coupling or on interneuron depolarization (Figure 28).
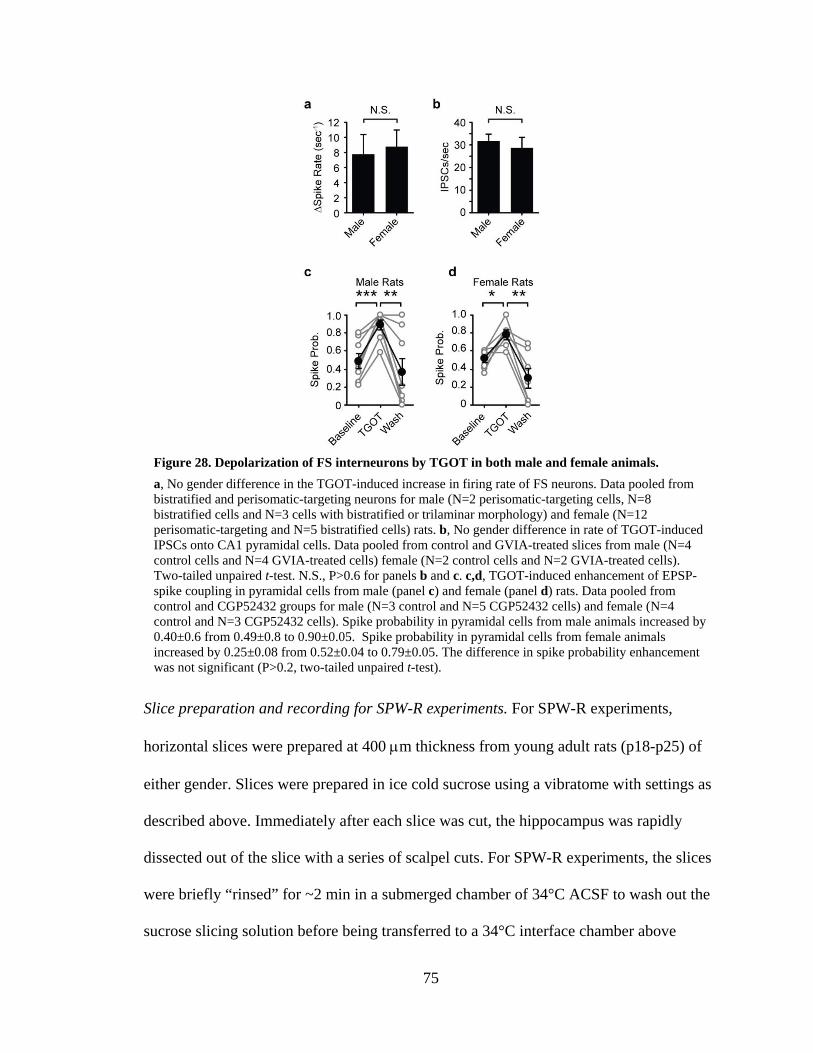
75
Slice preparation and recording for SPW-R experiments. For SPW-R experiments,
horizontal slices were prepared at 400 m thickness from young adult rats (p18-p25) of
either gender. Slices were prepared in ice cold sucrose using a vibratome with settings as
described above. Immediately after each slice was cut, the hippocampus was rapidly
dissected out of the slice with a series of scalpel cuts. For SPW-R experiments, the slices
were briefly “rinsed” for ~2 min in a submerged chamber of 34°C ACSF to wash out the
sucrose slicing solution before being transferred to a 34°C interface chamber above
Figure 28. Depolarization of FS interneurons by TGOT in both male and female animals.
a, No gender difference in the TGOT-induced increase in firing rate of FS neurons. Data pooled from bistratified and perisomatic-targeting neurons for male (N=2 perisomatic-targeting cells, N=8 bistratified cells and N=3 cells with bistratified or trilaminar morphology) and female (N=12 perisomatic-targeting and N=5 bistratified cells) rats. b, No gender difference in rate of TGOT-induced IPSCs onto CA1 pyramidal cells. Data pooled from control and GVIA-treated slices from male (N=4 control cells and N=4 GVIA-treated cells) female (N=2 control cells and N=2 GVIA-treated cells). Two-tailed unpaired t-test. N.S., P>0.6 for panels b and c. c,d, TGOT-induced enhancement of EPSP-spike coupling in pyramidal cells from male (panel c) and female (panel d) rats. Data pooled from control and CGP52432 groups for male (N=3 control and N=5 CGP52432 cells) and female (N=4 control and N=3 CGP52432 cells). Spike probability in pyramidal cells from male animals increased by 0.40±0.6 from 0.49±0.8 to 0.90±0.05. Spike probability in pyramidal cells from female animals increased by 0.25±0.08 from 0.52±0.04 to 0.79±0.05. The difference in spike probability enhancement was not significant (P>0.2, two-tailed unpaired t-test).

76
regular ACSF. Slices for SPW-R experiments were maintained in the 34°C interface
chamber until recording 1-5 h after slicing. The recording solution for SPW-R events was
identical to the regular ACSF described above, except that the KCl was elevated to 4 mM
and the CaCl2 was elevated to 3 mM.
Electrophysiological recordings. All electrophysiological recordings were performed in a
submerged chamber maintained at 32-34ºC with constant bath perfusion of ACSF at ~5
mL per minute. Each slice was allowed to equilibrate in the chamber for 15-45 min
before the start of recording. To prevent ictal activity, the CA3 region was removed with
a razor cut between CA3 and CA1 prior to any recordings in bicuculline. Whole cell,
cell-attached and field potential recordings were made using glass pipettes pulled with a
tip resistance of 2-4 M. For cell-attached recordings and field potential recordings,
pipettes were filled with ACSF. For all current clamp recordings from pyramidal cells,
and all recordings from interneurons except for the voltage ramp recordings, the
intracellular solution contained (in mM) 130 K-Gluconate, 1 MgCl2, 10 HEPES, 0.3
EGTA, 10 Tris-Phosphocreatine, 4 Mg-ATP, 0.3 Na-GTP. For interneuron recordings the
current clamp solution was supplemented with 0.1% biocytin. GTP was omitted from the
internal solution in experiments featuring GTPS. Spontaneous IPSCs onto pyramidal
cells were detected in voltage clamp using a 50 mM Cl- internal solution containing (in
mM) 70 CsMeSO3, 35 CsCl, 15 TEA-Cl, 1 MgCl2, 0.2 CaCl2, 10 HEPES, 0.3 EGTA, 10
Tris-Phosphocreatine, 4 Mg-ATP and 0.3 Na-GTP. For recordings of evoked IPSC and
EPSC amplitudes, the internal solution contained (in mM) 130 CsMeSO3, 8 CsCl, 1
MgCl2, 10 HEPES, 0.3 EGTA, 10 Tris-Phosphocreatine, 4 Mg-ATP and 0.3 Na-GTP.

77
For voltage ramp recordings, the internal solution contained (in mM) 50 K-Gluconate, 70
CsMeSO3, 10 TEA-Cl, 1 MgCl2, 10 HEPES, 0.3 EGTA, 10 Tris-Phosphocreatine, 4 Mg-
ATP and 0.3 Na-GTP. In the voltage ramp recordings, the pipette reference potential was
set to zero in control ACSF and a junction potential of -15.1 mV (calculated using
pClamp) was corrected post hoc. Apart from voltage ramp recordings, all membrane
potentials reported are not corrected for liquid junction potentials. A whole cell recording
was then obtained from a putative interneuron, and the fast-spiking phenotype was
verified as described above. The bath solution was then substituted for Voltage Ramp
ACSF containing (in mM) 112 NaCl, 10 D-Glucose, 3 KCl, 1.25 NaH2PO4, 10 TEA-Cl,
1.3 MgCl2, 2 CaCl2, 26 NaHCO3, 5 4-Aminopyridine, 0.1 CdCl2, 0.001 TTX. Voltage
ramps ~1 sec in duration between -80 and +20 mV were applied every 10 sec until the
current reached a steady state for >2 min, at which point TGOT was applied.
Slices were visualized with an upright microscope (Zeiss Axioskop 2 FS Plus) using
infrared differential interference contrast (IR-DIC) optics. Recordings were made using a
MultiClamp 700B amplifier (Axon Instruments, Union City, CA). Signals were filtered at
10 kHz using a Bessel filter and digitized at 20 kHz with a Digidata 1322A analog-digital
interface (Axon Instruments). Series resistance was carefully monitored and recordings
were discarded if the series resistance changed significantly or reached 20 M. Synaptic
events were evoked using a tungsten bipolar stimulating electrode placed in the Schaffer
Collateral excitatory afferents from area CA3 to deliver stimuli 100 s in duration. With
the exception of the monosynaptic IPSC recordings in Figure 13, the stimulating
electrode was placed as far as possible from the recorded pyramidal cell (~400 m to
~800 m) to minimize the contribution of monosynaptically evoked IPSCs to the feed-

78
forward transmission. Monosynaptic IPSCs (Figure 13) were evoked by placing the
stimulating electrode in the pyramidal cell layer close to the recorded cell (~100 M). A
2 mM Cl- internal solution was used to generate outward GABAA-mediated IPSCs at a
holding potential of -60 mV with NBQX (10 M) and AP5 (50 M) included in the bath
to eliminate fast glutamatergic transmission.
For gamma rhythm experiments, the field potential was recorded continuously from the
strata radiatum and pyramidale. Baseline recordings were made for ~10 min before
application of kainate at 100-500 nM. The field potential from the stratum radiatum was
monitored for gamma rhythm activity. Only slices in which the gamma rhythm was stable
for at least 30 min prior to TGOT application were considered for further analysis.
Gamma oscillations were quantified using custom-written MATLAB scripts.
Analysis of whole cell and cell-attached recordings. Analysis of spikes, evoked synaptic
currents, and synaptic potentials were performed offline using custom written routines in
MATLAB (Mathworks). Spontaneous IPSCs were detected offline with MATLAB using
a modified version of the freely available detectPSPs script by Phil Larimer
(http://www.mathworks.com/matlabcentral/fileexchange). Spike jitter histograms were
calculated by subtracting the latency of each spike from the average latency of spikes
evoked in that cell. To account for the TGOT-induced shift in average spike latency, the
average latency and jitter were calculated separately for control and TGOT conditions in
each cell. Jitter in cell-attached recordings was calculated pooling data from control and
CGP52432 data sets. Measurements of cell excitability (Figure 3) and EPSP-spike
coupling in whole cell mode (Figure 6) were performed simultaneously in the same set of
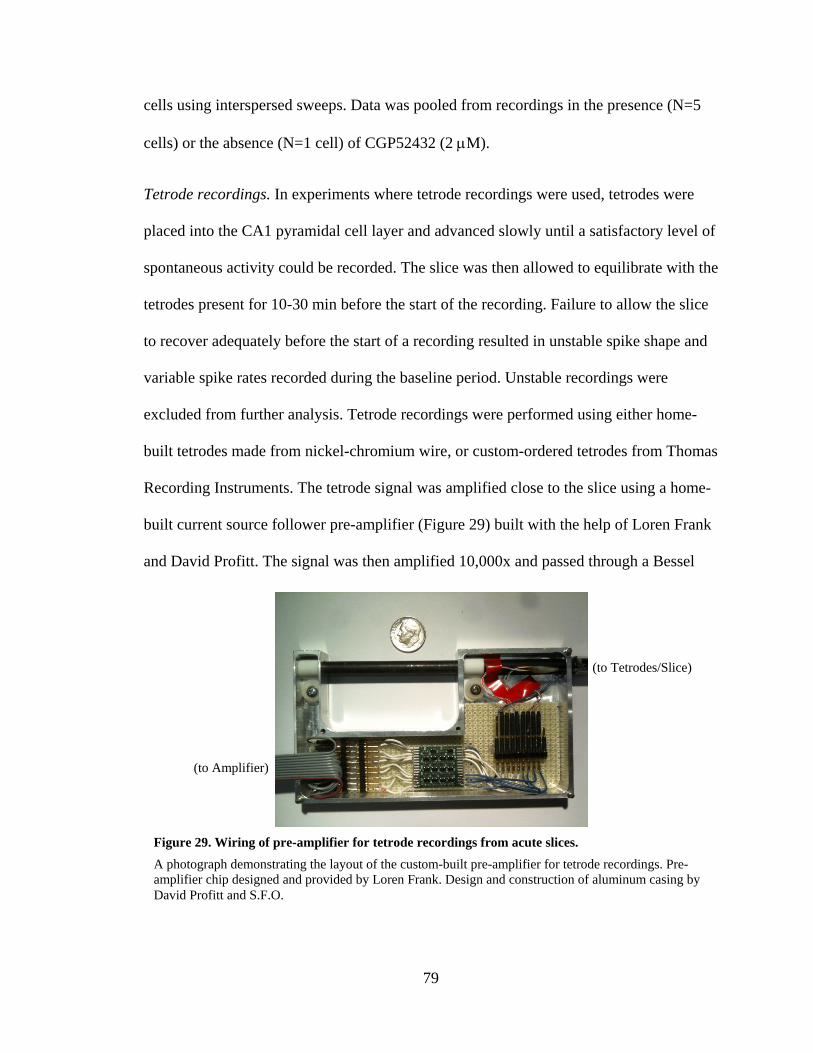
79
cells using interspersed sweeps. Data was pooled from recordings in the presence (N=5
cells) or the absence (N=1 cell) of CGP52432 (2 M).
Tetrode recordings. In experiments where tetrode recordings were used, tetrodes were
placed into the CA1 pyramidal cell layer and advanced slowly until a satisfactory level of
spontaneous activity could be recorded. The slice was then allowed to equilibrate with the
tetrodes present for 10-30 min before the start of the recording. Failure to allow the slice
to recover adequately before the start of a recording resulted in unstable spike shape and
variable spike rates recorded during the baseline period. Unstable recordings were
excluded from further analysis. Tetrode recordings were performed using either home-
built tetrodes made from nickel-chromium wire, or custom-ordered tetrodes from Thomas
Recording Instruments. The tetrode signal was amplified close to the slice using a home-
built current source follower pre-amplifier (Figure 29) built with the help of Loren Frank
and David Profitt. The signal was then amplified 10,000x and passed through a Bessel
Figure 29. Wiring of pre-amplifier for tetrode recordings from acute slices.
(to Tetrodes/Slice)
(to Amplifier)
A photograph demonstrating the layout of the custom-built pre-amplifier for tetrode recordings. Pre-amplifier chip designed and provided by Loren Frank. Design and construction of aluminum casing by David Profitt and S.F.O.
80
bandpass filter 10 Hz-10,000 Hz before being digitized using a Digidata 1322A analog-
digital interface (Axon Instruments) and recorded using pClamp (Axon Instruments).
Tetrode data analysis. The four traces in Figure 30a show one second of continuous
extracellular recording from the four channels of the tetrode. Extracellular spikes were
picked from this recording as events where the electrical potential on one or more of the
tetrode channels exceeded three times the standard deviation of the values recorded on
the sweep as a whole using home-built software in MATLAB. We calculated the
amplitude of each spike on each of the four channels and used a combination of home-
built and freely-available MATLAB software to plot spike amplitudes on a scatter plot in
a six-dimensional space, (1) Channel 1 Amplitude vs. Channel 2 Amplitude, (2) Channel
1 vs. 3, (3) 1 vs. 4, (4) 2 vs. 3, (5) 2 vs. 4, and (6) 3 vs. 4 as shown in Figure 30. Spikes
were clustered by units in the six-dimensional space. Judicious drawing of boundaries
between clusters allows us to distinguish multiple individual units from a single tetrode.
The software to assign individual spikes to hand-picked clusters was written and kindly
provided by Mattias Karlsson. Once spikes were clustered by unit, an average spike
waveform was computed for each unit on each channel to verify independence of units,
and the data were re-plotted in raster form to draw out independent responses of
individual units recorded simultaneously on the same tetrode. The Inter-Spike Interval
(ISI) for each cluster of spikes shows a refractory period of 5-10 ms, helping to confirm
that all of the spikes assigned to that cluster likely came from the same neuron.
SPW-R detection and analysis. For SPW-R recordings, a field potential electrode was
placed in the stratum radiatum, along with two tetrodes in the pyramidal cell layer. The

81
Figure 30. Tetrode recording and spike clustering in acute slices.
a, Raw data showing four channels recorded from a tetrode placed in the CA1 pyramidal cell layer of an acute slice. Scale bar 500 V (vertical), 20 ms (horizontal). b, Raster plots showing the timing of spikes from nine individual cells in the above recording. c, Plotting the amplitude of each spike on each channel of the tetrode recording against its amplitude on all other channels causes all of the spikes from each cell to cluster together in a multi-dimensional space, such that the spikes from each cell can be uniquely identified. d, Uniqueness of spike waveforms can be confirmed by plotting an average wavform of all of the spikes from each cell. Width of the line at each point represents the standard deviation of the average wavform at that point. e, Computing a histogram of inter-spike-intervals (ISI) from each cell reveals a refractory period of 5-10 ms, consistent with all of the spikes in that grouping arising from a single cell. Any groupings whose ISI did not display a distinct refractory period were excluded from further analysis.
82
continuously recorded signal from this field electrode was band-pass filtered off-line
between 1-50 Hz, using the idealfilter() Matlab function. SPW-R events were detected as
epochs during which this filtered field potential signal exceeded 10 times the root-mean-
square noise value of the entire signal for a duration of at least 30 ms (Figure 30).
Drugs and reagents. All salts and buffers for intracellular and extracellular solutions, as
well as ATP, GTP, GTPS, phosphocreatine and biocytin were purchased from Sigma
(St. Louis, MO). TGOT ((Thr4,Gly7)-Oxytocin), OTA ((d(CH2)51,Tyr(Me)2,Thr4,Orn8,
des-Gly-NH29)-Vasotocin) and Cholecystokinin octapeptide peptides were purchased
from Bachem (Torrance, CA), dissolved at 1 mM in ddH2O and stored at -20ºC until use
within 6 months of purchase. Bicuculline, TTX, NBQX, D-AP5 were purchased from
Ascent Scientific (Princeton, NJ). Calcium channel blockers GVIA and AgaIVA were
purchased from Peptides International (Louisville, KY). Because GVIA and AgaIVA are
relatively expensive drugs and consequently were used to pre-treat slices rather than
being bath applied during a recording. Slices were pre-treated for 20-30 min in an
interface chamber prior to recording. All solutions containing GVIA or AgaIVA also
contained 0.1 mg/mL bovine serum albumin (BSA) to prevent the drugs from sticking to
the walls of the container. Stock solutions were prepared and stored according to
manufacturer specifications.
Interneuron labeling and classification. Following whole cell recording from
interneurons, slices were transferred to a fixative solution containing 4%
paraformaldehyde, 4% sucrose, 0.2% picric acid and 1x phosphate buffered saline. Slices
were maintained in this solution for 24-72 h before being stained with 3,3’-
diaminobenzidine tetrahydrochloride (0.015%) using a standard ABC kit (Vector).
83
Neuronal cell types were identified based on morphology of axonal and dendritic arbors
and electrophysiological properties of the cell.
Computer model of EPSP-spike coupling. The simulated CA1 pyramidal cell was
modeled using the NEURON programming environment and automated using MATLAB.
A simplified pyramidal cell, consisting of a cylindrical soma with a single axon and
single dendrite was initialized to starting parameters before each stimulus so each sweep
was run independently of all others. Neuronal passive and voltage-gated conductances
were based on previously reported models (Hao, Wang et al. 2009; Ascoli, Gasparini et
al. 2010). Small adjustments were made to improve agreement of parameters such as cell
excitability and action potential waveform between the model and experimental
observations. Each sweep consisted of (1) a single, large-amplitude “evoked” EPSC onto
the cell dendrite, (2) a single, large-amplitude IPSC arriving onto the cell soma 2 ms after
the evoked EPSC to simulate feed-forward inhibition from perisomatic-targeting
interneurons, (3) a single, smaller-amplitude IPSC arriving onto the cell dendrite to
simulate feed-forward inhibition from dendritically-targeting interneurons with a latency
identical to the IPSC onto the soma, and (4) multiple “spontaneous” IPSCs arriving onto
the cell soma with randomly distributed amplitudes and timing. In order to reveal a
clearer picture of the role of the feed-forward IPSC in modulating spike timing,
spontaneous IPSCs were omitted from the simulation used to generate Figure 17g. At the
outset of each set of sweeps, the combined “evoked” EPSC-IPSC amplitudes were
empirically set by increasing the EPSC conductance and the IPSC conductance together
with a fixed IPSC/EPSC ratio of 6:1 until spike threshold was reached. Experimental
measurement of IPSC/EPSC ratio ranged from 2.62 to 5.20 (mean±S.E.M. of 3.65±0.28).

84
This experimentally measured range is presumed to be an underestimate of the true ratio
due to imperfect isolation of the IPSC reversal potential, causing a presumed GABAergic
contribution to the measured EPSC in some cells. In the model, IPSC/EPSC ratios from
4:1 up to 6:1 showed a pronounced TGOT-induced increase in evoked spike probability.
The value of 6:1 supported the strongest influence of TGOT on spike timing and jitter.
Noise was introduced in each sweep by using pseudo-random number generation to vary
(1) the evoked EPSC, (2) the evoked IPSC and (3) the spontaneously occurring IPSCs.
Evoked EPSC and IPSC conductances were varied independently on each sweep
according to a normal distribution centered on the empirically determined mean value,
with a standard deviation that was 5% of the mean. To simulate TGOT application, three
interventions were made. First the conductance of the evoked IPSC onto the cell soma
was reduced to 60% of the “baseline” level, while sparing the evoked EPSC conductance
and the conductance of the evoked IPSC onto the dendrites (see Figure 7). Second, the
amplitude of the spontaneous IPSCs was doubled (see Figure 8e). Third, the rate of
spontaneous IPSCs was increased from 5 Hz to 35 Hz (see Figure 8d). For the simulation
used to generate Figure 17b-c, the GABAA reversal potential was set at -110 mV,
consistent with our whole cell recording conditions. For the rest of the simulations used
to generate Figure 17, the GABAA reversal potential was set to -90 mV, consistent with
cell-attached recording conditions. The increase in evoked spike probability was a robust
feature of the model as the GABAA reversal potential was varied from -80 mV to -120
mV (Figure 19). The reduction in latency and latency jitter were decreased in magnitude
but remained statistically significant as the driving force for GABAA-mediated inhibition
was reduced (Figure 19).
85
REFERENCES
Alberi, S., J. J. Dreifuss, et al. (1997). "The oxytocin-induced inward current in vagal neurons of the rat is mediated by G protein activation but not by an increase in the intracellular calcium concentration." Eur J Neurosci 9(12): 2605-2612.
Alger, B. E. and R. A. Nicoll (1982). "Feed-forward dendritic inhibition in rat hippocampal pyramidal cells studied in vitro." J Physiol 328: 105-123.
Ascoli, G. A., S. Gasparini, et al. (2010). "Local control of postinhibitory rebound spiking in CA1 pyramidal neuron dendrites." J Neurosci 30(18): 6434-6442.
Atallah, B. V. and M. Scanziani (2009). "Instantaneous modulation of gamma oscillation frequency by balancing excitation with inhibition." Neuron 62(4): 566-577.
Averbeck, B. B., T. Bobin, et al. (2011). "Emotion recognition and oxytocin in patients with schizophrenia." Psychol Med: 1-8.
Bains, J. S., J. M. Longacher, et al. (1999). "Reciprocal interactions between CA3 network activity and strength of recurrent collateral synapses." Nat Neurosci 2(8): 720-726.
Baumgartner, T., M. Heinrichs, et al. (2008). "Oxytocin shapes the neural circuitry of trust and trust adaptation in humans." Neuron 58(4): 639-650.
Bazelot, M., C. Dinocourt, et al. (2010). "Unitary inhibitory field potentials in the CA3 region of rat hippocampus." J Physiol 588(Pt 12): 2077-2090.
Beenhakker, M. P. and J. R. Huguenard (2009). "Neurons that fire together also conspire together: is normal sleep circuitry hijacked to generate epilepsy?" Neuron 62(5): 612-632.
Behrens, C. J., L. P. van den Boom, et al. (2005). "Induction of sharp wave-ripple complexes in vitro and reorganization of hippocampal networks." Nat Neurosci 8(11): 1560-1567.
Bergles, D. E., V. A. Doze, et al. (1996). "Excitatory actions of norepinephrine on multiple classes of hippocampal CA1 interneurons." J Neurosci 16(2): 572-585.
Brown, S. P. and S. Hestrin (2009). "Cell-type identity: a key to unlocking the function of neocortical circuits." Curr Opin Neurobiol 19(4): 415-421.
Buijs, R. M. (1978). "Intra- and extrahypothalamic vasopressin and oxytocin pathways in the rat. Pathways to the limbic system, medulla oblongata and spinal cord." Cell Tissue Res 192(3): 423-435.
Buijs, R. M. and D. F. Swaab (1979). "Immuno-electron microscopical demonstration of vasopressin and oxytocin synapses in the limbic system of the rat." Cell Tissue Res 204(3): 355-365.
Buijs, R. M., D. N. Velis, et al. (1980). "Extrahypothalamic vasopressin and oxytocin innervation of fetal and adult rat brain." Prog Brain Res 53: 159-167.
Buzsaki, G. (1984). "Feed-forward inhibition in the hippocampal formation." Prog Neurobiol 22(2): 131-153.
Buzsaki, G. (1986). "Hippocampal sharp waves: their origin and significance." Brain Res 398(2): 242-252.
Buzsaki, G. (2004). "Large-scale recording of neuronal ensembles." Nat Neurosci 7(5): 446-451.
Buzsaki, G. and A. Draguhn (2004). "Neuronal oscillations in cortical networks." Science 304(5679): 1926-1929.
86
Buzsaki, G. and E. Eidelberg (1981). "Commissural projection to the dentate gyrus of the rat: evidence for feed-forward inhibition." Brain Res 230(1-2): 346-350.
Capogna, M., B. H. Gahwiler, et al. (1993). "Mechanism of mu-opioid receptor-mediated presynaptic inhibition in the rat hippocampus in vitro." J Physiol 470: 539-558.
Cardin, J. A., M. Carlen, et al. (2009). "Driving fast-spiking cells induces gamma rhythm and controls sensory responses." Nature 459(7247): 663-667.
Carter, S. J., C. M. Richardson, et al. (2003). "Excitatory effects of oxytocin and cholecystokinin on oxytocin neurones: differences between virgin, pregnant and lactating rats." Neurosci Lett 351(1): 13-16.
Carvalho, T. P. and D. V. Buonomano (2009). "Differential effects of excitatory and inhibitory plasticity on synaptically driven neuronal input-output functions." Neuron 61(5): 774-785.
Choleris, E., S. R. Little, et al. (2007). "Microparticle-based delivery of oxytocin receptor antisense DNA in the medial amygdala blocks social recognition in female mice." Proc Natl Acad Sci U S A 104(11): 4670-4675.
Cohen, G. A., V. A. Doze, et al. (1992). "Opioid inhibition of GABA release from presynaptic terminals of rat hippocampal interneurons." Neuron 9(2): 325-335.
Colgin, L. L., D. Kubota, et al. (2004). "Long-term potentiation is impaired in rat hippocampal slices that produce spontaneous sharp waves." J Physiol 558(Pt 3): 953-961.
De Vries, G. J. and R. M. Buijs (1983). "The origin of the vasopressinergic and oxytocinergic innervation of the rat brain with special reference to the lateral septum." Brain Res 273(2): 307-317.
Diba, K. and G. Buzsaki (2007). "Forward and reverse hippocampal place-cell sequences during ripples." Nat Neurosci 10(10): 1241-1242.
Ditzen, B., M. Schaer, et al. (2009). "Intranasal oxytocin increases positive communication and reduces cortisol levels during couple conflict." Biol Psychiatry 65(9): 728-731.
Domes, G., M. Heinrichs, et al. (2007). "Oxytocin improves "mind-reading" in humans." Biol Psychiatry 61(6): 731-733.
Doze, V. A., G. A. Cohen, et al. (1991). "Synaptic localization of adrenergic disinhibition in the rat hippocampus." Neuron 6(6): 889-900.
Drake, C. T. and T. A. Milner (2002). "Mu opioid receptors are in discrete hippocampal interneuron subpopulations." Hippocampus 12(2): 119-136.
Elands, J., C. Barberis, et al. (1988). "125I-labelled d(CH2)5[Tyr(Me)2,Thr4,Tyr-NH2(9)]OVT: a selective oxytocin receptor ligand." Eur J Pharmacol 147(2): 197-207.
Fang, L. Y., R. D. Quan, et al. (2008). "Oxytocin facilitates the induction of long-term potentiation in the accessory olfactory bulb." Neurosci Lett 438(2): 133-137.
Ferguson, J. N., J. M. Aldag, et al. (2001). "Oxytocin in the medial amygdala is essential for social recognition in the mouse." J Neurosci 21(20): 8278-8285.
Ferguson, J. N., L. J. Young, et al. (2000). "Social amnesia in mice lacking the oxytocin gene." Nat Genet 25(3): 284-288.
Foldy, C., S. Y. Lee, et al. (2007). "Cell type-specific gating of perisomatic inhibition by cholecystokinin." Nat Neurosci 10(9): 1128-1130.
87
Freund-Mercier, M. J., M. E. Stoeckel, et al. (1994). "Oxytocin receptors on oxytocin neurones: histoautoradiographic detection in the lactating rat." J Physiol 480 ( Pt 1): 155-161.
Freund, T. F. and G. Buzsaki (1996). "Interneurons of the hippocampus." Hippocampus 6(4): 347-470.
Galarreta, M. and S. Hestrin (1998). "Frequency-dependent synaptic depression and the balance of excitation and inhibition in the neocortex." Nat Neurosci 1(7): 587-594.
Gimpl, G. and F. Fahrenholz (2001). "The oxytocin receptor system: structure, function, and regulation." Physiol Rev 81(2): 629-683.
Girardeau, G., K. Benchenane, et al. (2009). "Selective suppression of hippocampal ripples impairs spatial memory." Nat Neurosci 12(10): 1222-1223.
Glickfeld, L. L., J. D. Roberts, et al. (2009). "Interneurons hyperpolarize pyramidal cells along their entire somatodendritic axis." Nat Neurosci 12(1): 21-23.
Glickfeld, L. L. and M. Scanziani (2006). "Distinct timing in the activity of cannabinoid-sensitive and cannabinoid-insensitive basket cells." Nat Neurosci 9(6): 807-815.
Gordon, I., O. Zagoory-Sharon, et al. (2010). "Oxytocin and the development of parenting in humans." Biol Psychiatry 68(4): 377-382.
Guastella, A. J., S. L. Einfeld, et al. (2010). "Intranasal oxytocin improves emotion recognition for youth with autism spectrum disorders." Biol Psychiatry 67(7): 692-694.
Hao, J., X. D. Wang, et al. (2009). "An arithmetic rule for spatial summation of excitatory and inhibitory inputs in pyramidal neurons." Proc Natl Acad Sci U S A 106(51): 21906-21911.
Harris, K. D., D. A. Henze, et al. (2000). "Accuracy of tetrode spike separation as determined by simultaneous intracellular and extracellular measurements." J Neurophysiol 84(1): 401-414.
Hefft, S. and P. Jonas (2005). "Asynchronous GABA release generates long-lasting inhibition at a hippocampal interneuron-principal neuron synapse." Nat Neurosci 8(10): 1319-1328.
Hempel, C. M., K. Sugino, et al. (2002). "Multi-unit spike-triggered averaging: a method for probing the physiology of central synapses." J Neurosci Methods 120(2): 121-129.
Hollander, E., J. Bartz, et al. (2007). "Oxytocin increases retention of social cognition in autism." Biol Psychiatry 61(4): 498-503.
Huber, D., P. Veinante, et al. (2005). "Vasopressin and oxytocin excite distinct neuronal populations in the central amygdala." Science 308(5719): 245-248.
Jacob, S., C. W. Brune, et al. (2007). "Association of the oxytocin receptor gene (OXTR) in Caucasian children and adolescents with autism." Neurosci Lett 417(1): 6-9.
Karlsson, M. P. and L. M. Frank (2009). "Awake replay of remote experiences in the hippocampus." Nat Neurosci 12(7): 913-918.
Kendrick, K. M. and E. B. Keverne (1992). "Control of synthesis and release of oxytocin in the sheep brain." Ann N Y Acad Sci 652: 102-121.
Kendrick, K. M., E. B. Keverne, et al. (1986). "Cerebrospinal fluid levels of acetylcholinesterase, monoamines and oxytocin during labour, parturition,

88
vaginocervical stimulation, lamb separation and suckling in sheep." Neuroendocrinology 44(2): 149-156.
Kendrick, K. M., E. B. Keverne, et al. (1988). "Intracranial dialysis measurement of oxytocin, monoamine and uric acid release from the olfactory bulb and substantia nigra of sheep during parturition, suckling, separation from lambs and eating." Brain Res 439(1-2): 1-10.
Kendrick, K. M., E. B. Keverne, et al. (1988). "Microdialysis measurement of oxytocin, aspartate, gamma-aminobutyric acid and glutamate release from the olfactory bulb of the sheep during vaginocervical stimulation." Brain Res 442(1): 171-174.
Kendrick, K. M., E. B. Keverne, et al. (1991). "Cerebrospinal fluid and plasma concentrations of oxytocin and vasopressin during parturition and vaginocervical stimulation in the sheep." Brain Res Bull 26(5): 803-807.
Keverne, E. B. and K. M. Kendrick (1992). "Oxytocin facilitation of maternal behavior in sheep." Ann N Y Acad Sci 652: 83-101.
Khazipov, R., R. Tyzio, et al. (2008). "Effects of oxytocin on GABA signalling in the foetal brain during delivery." Prog Brain Res 170: 243-257.
Klausberger, T., L. F. Marton, et al. (2005). "Complementary roles of cholecystokinin- and parvalbumin-expressing GABAergic neurons in hippocampal network oscillations." J Neurosci 25(42): 9782-9793.
Klausberger, T. and P. Somogyi (2008). "Neuronal diversity and temporal dynamics: the unity of hippocampal circuit operations." Science 321(5885): 53-57.
Kosfeld, M., M. Heinrichs, et al. (2005). "Oxytocin increases trust in humans." Nature 435(7042): 673-676.
Kraushaar, U. and P. Jonas (2000). "Efficacy and stability of quantal GABA release at a hippocampal interneuron-principal neuron synapse." J Neurosci 20(15): 5594-5607.
Kreiman, G., C. Koch, et al. (2000). "Category-specific visual responses of single neurons in the human medial temporal lobe." Nat Neurosci 3(9): 946-953.
Kuo, S. P. and L. O. Trussell (2011). "Spontaneous spiking and synaptic depression underlie noradrenergic control of feed-forward inhibition." Neuron 71(2): 306-318.
Lammel, S., D. I. Ion, et al. (2011). "Projection-specific modulation of dopamine neuron synapses by aversive and rewarding stimuli." Neuron 70(5): 855-862.
Lamsa, K., J. H. Heeroma, et al. (2005). "Hebbian LTP in feed-forward inhibitory interneurons and the temporal fidelity of input discrimination." Nat Neurosci 8(7): 916-924.
Lee, A. K. and M. A. Wilson (2002). "Memory of sequential experience in the hippocampus during slow wave sleep." Neuron 36(6): 1183-1194.
Lee, S. Y., C. Foldy, et al. (2011). "Cell-type-specific CCK2 receptor signaling underlies the cholecystokinin-mediated selective excitation of hippocampal parvalbumin-positive fast-spiking basket cells." J Neurosci 31(30): 10993-11002.
Levine, A., O. Zagoory-Sharon, et al. (2007). "Oxytocin during pregnancy and early postpartum: individual patterns and maternal-fetal attachment." Peptides 28(6): 1162-1169.

89
Light, K. C., T. E. Smith, et al. (2000). "Oxytocin responsivity in mothers of infants: a preliminary study of relationships with blood pressure during laboratory stress and normal ambulatory activity." Health Psychol 19(6): 560-567.
Lin, D., M. P. Boyle, et al. (2011). "Functional identification of an aggression locus in the mouse hypothalamus." Nature 470(7333): 221-226.
Lodge, D. J., M. M. Behrens, et al. (2009). "A loss of parvalbumin-containing interneurons is associated with diminished oscillatory activity in an animal model of schizophrenia." J Neurosci 29(8): 2344-2354.
Loup, F., E. Tribollet, et al. (1991). "Localization of high-affinity binding sites for oxytocin and vasopressin in the human brain. An autoradiographic study." Brain Res 555(2): 220-232.
Lupica, C. R. (1995). "Delta and mu enkephalins inhibit spontaneous GABA-mediated IPSCs via a cyclic AMP-independent mechanism in the rat hippocampus." J Neurosci 15(1 Pt 2): 737-749.
Lupica, C. R., W. R. Proctor, et al. (1992). "Dissociation of mu and delta opioid receptor-mediated reductions in evoked and spontaneous synaptic inhibition in the rat hippocampus in vitro." Brain Res 593(2): 226-238.
Maccaferri, G., J. D. Roberts, et al. (2000). "Cell surface domain specific postsynaptic currents evoked by identified GABAergic neurones in rat hippocampus in vitro." J Physiol 524 Pt 1: 91-116.
Madison, D. V. and E. B. Edson (2001). "Preparation of hippocampal brain slices." Curr Protoc Neurosci Chapter 6: Unit 6 4.
Madison, D. V. and R. A. Nicoll (1986). "Actions of noradrenaline recorded intracellularly in rat hippocampal CA1 pyramidal neurones, in vitro." J Physiol 372: 221-244.
Madison, D. V. and R. A. Nicoll (1986). "Cyclic adenosine 3',5'-monophosphate mediates beta-receptor actions of noradrenaline in rat hippocampal pyramidal cells." J Physiol 372: 245-259.
Madison, D. V. and R. A. Nicoll (1988). "Enkephalin hyperpolarizes interneurones in the rat hippocampus." J Physiol 398: 123-130.
Madison, D. V. and R. A. Nicoll (1988). "Norepinephrine decreases synaptic inhibition in the rat hippocampus." Brain Res 442(1): 131-138.
Maier, N., V. Nimmrich, et al. (2003). "Cellular and network mechanisms underlying spontaneous sharp wave-ripple complexes in mouse hippocampal slices." J Physiol 550(Pt 3): 873-887.
Mann, E. O., J. M. Suckling, et al. (2005). "Perisomatic feedback inhibition underlies cholinergically induced fast network oscillations in the rat hippocampus in vitro." Neuron 45(1): 105-117.
Masukawa, L. M. and D. A. Prince (1982). "Enkephalin inhibition of inhibitory input to CA1 and CA3 pyramidal neurons in the hippocampus." Brain Res 249(2): 271-280.
McBain, C. J. and A. Fisahn (2001). "Interneurons unbound." Nat Rev Neurosci 2(1): 11-23.
McQuiston, A. R. and P. Saggau (2003). "Mu-opioid receptors facilitate the propagation of excitatory activity in rat hippocampal area CA1 by disinhibition of all anatomical layers." J Neurophysiol 90(3): 1936-1948.

90
Mitchell, S. J. and R. A. Silver (2003). "Shunting inhibition modulates neuronal gain during synaptic excitation." Neuron 38(3): 433-445.
Modahl, C., L. Green, et al. (1998). "Plasma oxytocin levels in autistic children." Biol Psychiatry 43(4): 270-277.
Muhlethaler, M., S. Charpak, et al. (1984). "Contrasting effects of neurohypophysial peptides on pyramidal and non-pyramidal neurones in the rat hippocampus." Brain Res 308(1): 97-107.
Muhlethaler, M., W. H. Sawyer, et al. (1983). "Characterization of a uterine-type oxytocin receptor in the rat hippocampus." Proc Natl Acad Sci U S A 80(21): 6713-6717.
Naber, F., M. H. van Ijzendoorn, et al. (2010). "Intranasal oxytocin increases fathers' observed responsiveness during play with their children: a double-blind within-subject experiment." Psychoneuroendocrinology 35(10): 1583-1586.
Neumann, I. and R. Landgraf (1989). "Septal and Hippocampal Release of Oxytocin, but not Vasopressin, in the Conscious Lactating Rat During Suckling." J Neuroendocrinol 1(4): 305-308.
Nicoll, R. A., B. E. Alger, et al. (1980). "Enkephalin blocks inhibitory pathways in the vertebrate CNS." Nature 287(5777): 22-25.
Ohlsson, B., M. L. Forsling, et al. (2002). "Cholecystokinin stimulation leads to increased oxytocin secretion in women." Eur J Surg 168(2): 114-118.
Oliet, S. H., D. V. Baimoukhametova, et al. (2007). "Retrograde regulation of GABA transmission by the tonic release of oxytocin and endocannabinoids governs postsynaptic firing." J Neurosci 27(6): 1325-1333.
Papatheodoropoulos, C. and G. Kostopoulos (2002). "Spontaneous, low frequency (approximately 2-3 Hz) field activity generated in rat ventral hippocampal slices perfused with normal medium." Brain Res Bull 57(2): 187-193.
Persico, A. M. and T. Bourgeron (2006). "Searching for ways out of the autism maze: genetic, epigenetic and environmental clues." Trends Neurosci 29(7): 349-358.
Poncer, J. C., R. A. McKinney, et al. (1997). "Either N- or P-type calcium channels mediate GABA release at distinct hippocampal inhibitory synapses." Neuron 18(3): 463-472.
Pouille, F., A. Marin-Burgin, et al. (2009). "Input normalization by global feedforward inhibition expands cortical dynamic range." Nat Neurosci 12(12): 1577-1585.
Pouille, F. and M. Scanziani (2001). "Enforcement of temporal fidelity in pyramidal cells by somatic feed-forward inhibition." Science 293(5532): 1159-1163.
Raggenbass, M., E. Tribollet, et al. (1989). "Correlation between oxytocin neuronal sensitivity and oxytocin receptor binding: an electrophysiological and autoradiographical study comparing rat and guinea pig hippocampus." Proc Natl Acad Sci U S A 86(2): 750-754.
Raggenbass, M., J. P. Wuarin, et al. (1985). "Opposing effects of oxytocin and of a mu-receptor agonistic opioid peptide on the same class of non-pyramidal neurones in rat hippocampus." Brain Res 344(2): 392-396.
Reymond-Marron, I., E. Tribollet, et al. (2006). "The vasopressin-induced excitation of hypoglossal and facial motoneurons in young rats is mediated by V1a but not V1b receptors, and is independent of intracellular calcium signalling." Eur J Neurosci 24(6): 1565-1574.
91
Ripke, S., A. R. Sanders, et al. (2011). "Genome-wide association study identifies five new schizophrenia loci." Nat Genet 43(10): 969-976.
Rothman, J. S., L. Cathala, et al. (2009). "Synaptic depression enables neuronal gain control." Nature 457(7232): 1015-1018.
Schultz, W. (1998). "Predictive reward signal of dopamine neurons." J Neurophysiol 80(1): 1-27.
Sohal, V. S., F. Zhang, et al. (2009). "Parvalbumin neurons and gamma rhythms enhance cortical circuit performance." Nature 459(7247): 698-702.
Splawski, I., K. W. Timothy, et al. (2004). "Ca(V)1.2 calcium channel dysfunction causes a multisystem disorder including arrhythmia and autism." Cell 119(1): 19-31.
Svoboda, K. R., C. E. Adams, et al. (1999). "Opioid receptor subtype expression defines morphologically distinct classes of hippocampal interneurons." J Neurosci 19(1): 85-95.
Svoboda, K. R. and C. R. Lupica (1998). "Opioid inhibition of hippocampal interneurons via modulation of potassium and hyperpolarization-activated cation (Ih) currents." J Neurosci 18(18): 7084-7098.
Szabo, G. G., N. Holderith, et al. (2010). "Distinct synaptic properties of perisomatic inhibitory cell types and their different modulation by cholinergic receptor activation in the CA3 region of the mouse hippocampus." Eur J Neurosci 31(12): 2234-2246.
Takayanagi, Y., M. Yoshida, et al. (2005). "Pervasive social deficits, but normal parturition, in oxytocin receptor-deficient mice." Proc Natl Acad Sci U S A 102(44): 16096-16101.
Terenzi, M. G. and C. D. Ingram (2005). "Oxytocin-induced excitation of neurones in the rat central and medial amygdaloid nuclei." Neuroscience 134(1): 345-354.
Tomizawa, K., N. Iga, et al. (2003). "Oxytocin improves long-lasting spatial memory during motherhood through MAP kinase cascade." Nat Neurosci 6(4): 384-390.
Tyzio, R., R. Cossart, et al. (2006). "Maternal oxytocin triggers a transient inhibitory switch in GABA signaling in the fetal brain during delivery." Science 314(5806): 1788-1792.
Veening, J. G., T. de Jong, et al. (2010). "Oxytocin-messages via the cerebrospinal fluid: behavioral effects; a review." Physiol Behav 101(2): 193-210.
Verbalis, J. G., M. J. McCann, et al. (1986). "Oxytocin secretion in response to cholecystokinin and food: differentiation of nausea from satiety." Science 232(4756): 1417-1419.
Viviani, D., A. Charlet, et al. (2011). "Oxytocin selectively gates fear responses through distinct outputs from the central amygdala." Science 333(6038): 104-107.
Williams, J. R., T. R. Insel, et al. (1994). "Oxytocin administered centrally facilitates formation of a partner preference in female prairie voles (Microtus ochrogaster)." J Neuroendocrinol 6(3): 247-250.
Wilson, R. I., G. Kunos, et al. (2001). "Presynaptic specificity of endocannabinoid signaling in the hippocampus." Neuron 31(3): 453-462.
Wu, C., H. Shen, et al. (2002). "A fundamental oscillatory state of isolated rodent hippocampus." J Physiol 540(Pt 2): 509-527.
Wu, S., M. Jia, et al. (2005). "Positive association of the oxytocin receptor gene (OXTR) with autism in the Chinese Han population." Biol Psychiatry 58(1): 74-77.

92
Yizhar, O., L. E. Fenno, et al. (2011). "Neocortical excitation/inhibition balance in information processing and social dysfunction." Nature 477(7363): 171-178.
Ylinen, A., A. Bragin, et al. (1995). "Sharp wave-associated high-frequency oscillation (200 Hz) in the intact hippocampus: network and intracellular mechanisms." J Neurosci 15(1 Pt 1): 30-46.
Yoshida, M., Y. Takayanagi, et al. (2009). "Evidence that oxytocin exerts anxiolytic effects via oxytocin receptor expressed in serotonergic neurons in mice." J Neurosci 29(7): 2259-2271.
Young, L. J., M. M. Lim, et al. (2001). "Cellular mechanisms of social attachment." Horm Behav 40(2): 133-138.
Young, L. J. and Z. Wang (2004). "The neurobiology of pair bonding." Nat Neurosci 7(10): 1048-1054.
Yrigollen, C. M., S. S. Han, et al. (2008). "Genes controlling affiliative behavior as candidate genes for autism." Biol Psychiatry 63(10): 911-916.
Zaninetti, M. and M. Raggenbass (2000). "Oxytocin receptor agonists enhance inhibitory synaptic transmission in the rat hippocampus by activating interneurons in stratum pyramidale." Eur J Neurosci 12(11): 3975-3984.
Zhang, Z. J. and G. P. Reynolds (2002). "A selective decrease in the relative density of parvalbumin-immunoreactive neurons in the hippocampus in schizophrenia." Schizophr Res 55(1-2): 1-10.